environmental geology lab 8 – earthquake hazardspage - 1 environmental geology lab 8 –...
TRANSCRIPT
page - 1Environmental Geology Lab 8 – Earthquake Hazards
Earthquakes large enough to cause damage, and possibly loss of life, are an inevitable fact of life in many parts of the United States. Fortunately, there is a lot that can be done to minimize both the cost of repairs and the loss of life, when a major earthquake strikes an urban area.
Worldwide, the vast majority of earthquakes, roughly 95% of them, occur on the edges of tectonic plates, where the plates collide and grind together as they slowly drift to new positions on the earth. The North American plate carries not only the land masses of North and Central America, but also portions of the surrounding oceans. As it happens, the only place where one of the edges of the North American plate is on land is in California (Figure 1). Between the US-Mexico border and San Francisco, a large system of strike-slip faults exists that passes through major metropolitan areas, including the cities of Los Angeles and San Francisco. The San Andreas is the largest and most famous of these strike-slip faults, but in most areas there are 3-5 other large faults parallel to the San Andreas. All of these faults together comprise the boundary between the North American plate to the east, and the Pacific plate to the west, which is a transform plate boundary. Thousands of earthquakes occur in California each year as the Pacific plate moves northward at a rate of 4-6 cm per year, and carries a slice of the state up the coast with it.
California is well-known for earthquakes, partly because they are so numerous, and partly because of the damage and loss of life associated with the larger ones. The great San Fransisco earthquake of 1906 remains among the most famous earthquakes of all time. However, California is by no means the only state to have problems with earthquakes. In this lab you will learn
(a) where the largest and most damaging earthquakes have occurred in the United States;(b) about the Mercalli intensity scale for the effects of earthquake shaking and damage; and(c) which geologic factors affect the severity of damage to a particular building or other
structures.
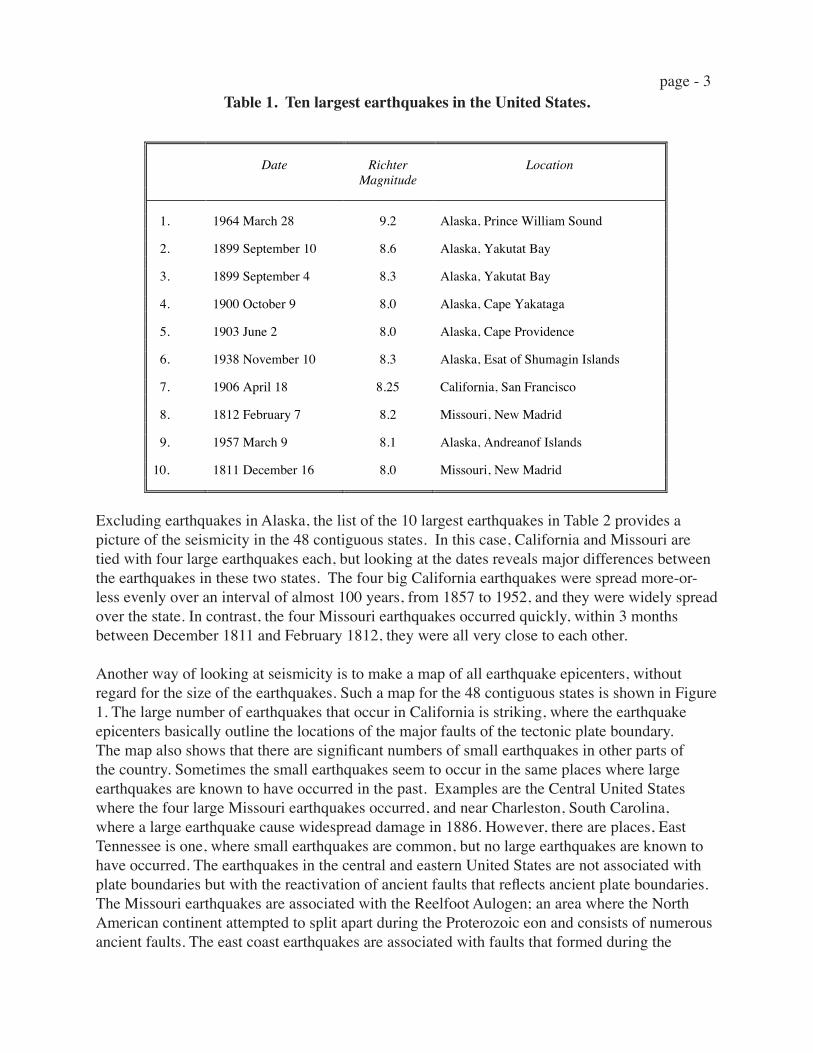
The term seismicity refers broadly to where earthquakes occur and how common they are, especially the larger ones. The list of the ten largest earthquakes in the United States in Table 1 shows that the state of Alaska dominates all other states in terms of seismicity. However, these earthquakes occurred along the Alaskan southern coast, where the Pacific plate is colliding with North America and is being subducted (convergent plate boundary). This coastal region contains numerous islands, which were only sparsely populated when the earthquakes occurred, so little damage or loss of life occurred. The exception was the magnitude 9.2 earthquake of 1964, which caused wide-spread devastation of coastal areas and 115 deaths, mostly from tsunamis (large sea waves generated by earthquakes beneath the ocean) that inundated coastal villages.
page - 2
PACI
FIC
OCE
AN
ATL
ANT
IC
OCE
AN
125
o12
0o
115
o11
0o
105
o10
0o
95o
90o
85o
80o
75o
70o
65o
45o
40o
35o
30o
25o
45o
40o
35o
30o
25o
020
040
0
MIL
ES
PACIFIC OCEANATLANTIC O
CEAN
GU
LF
OF
ME
XIC
OM
E X
I C
OC A
N A
D A
Figu
re 1
. Map
show
ing
the
loca
tions
of e
arth
quak
es in
the
Uni
ted
Stat
es, e
xclu
ding
Ala
ska
and
Haw
aii,
1971
- 19
86.
page - 3
Date Richter
Magnitude
Location
1. 1964 March 28 9.2 Alaska, Prince William Sound
2. 1899 September 10 8.6 Alaska, Yakutat Bay
3. 1899 September 4 8.3 Alaska, Yakutat Bay
4. 1900 October 9 8.0 Alaska, Cape Yakataga
5. 1903 June 2 8.0 Alaska, Cape Providence
6. 1938 November 10 8.3 Alaska, Esat of Shumagin Islands
7. 1906 April 18 8.25 California, San Francisco
8. 1812 February 7 8.2 Missouri, New Madrid
9. 1957 March 9 8.1 Alaska, Andreanof Islands
10. 1811 December 16 8.0 Missouri, New Madrid
Table 1. Ten largest earthquakes in the United States.
Excluding earthquakes in Alaska, the list of the 10 largest earthquakes in Table 2 provides a picture of the seismicity in the 48 contiguous states. In this case, California and Missouri are tied with four large earthquakes each, but looking at the dates reveals major differences between the earthquakes in these two states. The four big California earthquakes were spread more-or-less evenly over an interval of almost 100 years, from 1857 to 1952, and they were widely spread over the state. In contrast, the four Missouri earthquakes occurred quickly, within 3 months between December 1811 and February 1812, they were all very close to each other.
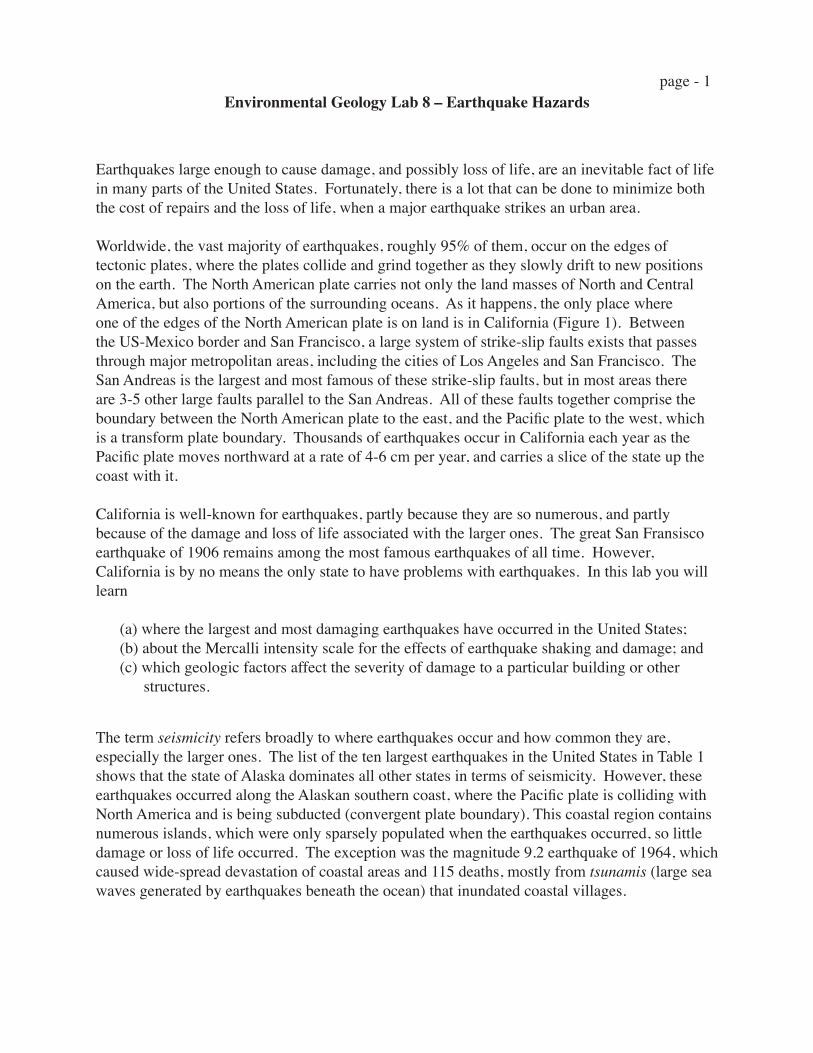
Another way of looking at seismicity is to make a map of all earthquake epicenters, without regard for the size of the earthquakes. Such a map for the 48 contiguous states is shown in Figure 1. The large number of earthquakes that occur in California is striking, where the earthquake epicenters basically outline the locations of the major faults of the tectonic plate boundary. The map also shows that there are significant numbers of small earthquakes in other parts of the country. Sometimes the small earthquakes seem to occur in the same places where large earthquakes are known to have occurred in the past. Examples are the Central United States where the four large Missouri earthquakes occurred, and near Charleston, South Carolina, where a large earthquake cause widespread damage in 1886. However, there are places, East Tennessee is one, where small earthquakes are common, but no large earthquakes are known to have occurred. The earthquakes in the central and eastern United States are not associated with plate boundaries but with the reactivation of ancient faults that reflects ancient plate boundaries. The Missouri earthquakes are associated with the Reelfoot Aulogen; an area where the North American continent attempted to split apart during the Proterozoic eon and consists of numerous ancient faults. The east coast earthquakes are associated with faults that formed during the

page - 4breakup of the Supercontinent Pangaea during the Jurassic era.
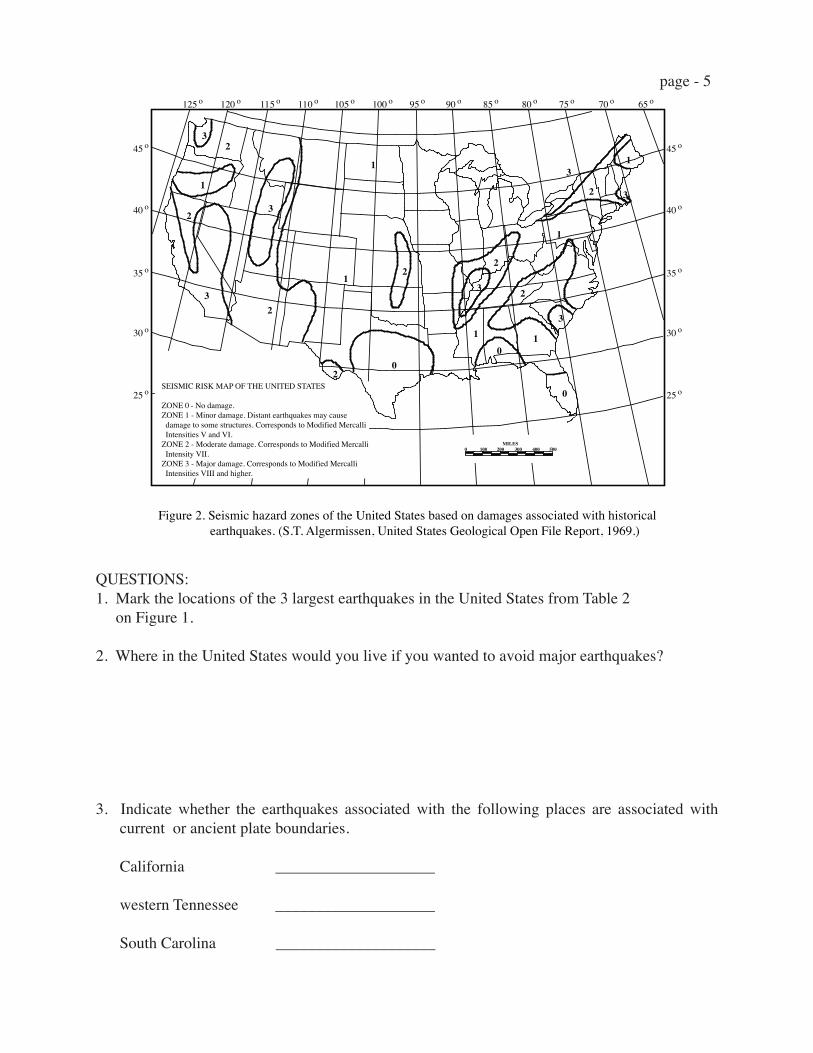
All of the information about earthquakes, both the large, damaging ones and the smaller ones, can be combined with information about the geology where the earthquakes occur to produce a seismic risk map such as the one shown in Figure 2. A seismic risk map is a little bit like a weather forecast. The fact that a particular region has a high seismic risk does not mean that a damaging earthquake is certain to occur there, just as a forecast for rain does not guarantee that there will be rain. The purpose of a seismic risk map is to let the people who live in high risk areas, especially those involved in providing emergency services such as fire and police departments, and hospitals, know that they need to be prepared.
Table 2. Ten largest earthquakes in the United States, excluding Alaska.
Date Richter
Magnitude
Location
1. 1906 April 18 8.25 California, San Francisco
2. 1812 February 7 8.2 Missouri, New Madrid
3. 1811 December 16 8.0 Missouri, New Madrid
4. 1857 January 9 7.9 California, Fort Tejon
5. 1812 January 23 7.8 Missouri, New Madrid
6. 1872 March 26 7.8 California, Owens Valley
7. 1915 October 3 7.8 Nevada, Pleasant Valley
8. 1952 July 21 7.8 California, Kern County
9. 1886 August 31 7.7 South Carolina, Charleston
10. 1811 December 16 7.6 Missouri, New Madrid
page - 5
QUESTIONS:1. Mark the locations of the 3 largest earthquakes in the United States from Table 2 on Figure 1.
2. Where in the United States would you live if you wanted to avoid major earthquakes?
3. Indicate whether the earthquakes associated with the following places are associated with current or ancient plate boundaries.
California ____________________
western Tennessee ____________________
South Carolina ____________________
125 o 120 o 115 o 110 o 105 o 100 o 95 o 90 o 85 o 80 o 75 o 70 o 65 o
45 o
40 o
35 o
30 o
25 o
45 o
40 o
35 o
30 o
25 o
0 100 200 300 400 500MILES
SEISMIC RISK MAP OF THE UNITED STATES
ZONE 0 - No damage.ZONE 1 - Minor damage. Distant earthquakes may cause damage to some structures. Corresponds to Modified Mercalli Intensities V and VI.ZONE 2 - Moderate damage. Corresponds to Modified Mercalli Intensity VII.ZONE 3 - Major damage. Corresponds to Modified Mercalli Intensities VIII and higher.
32
1
2
3
3
2
1
1
2
20
0
3
2
2
3
11
0
1
3
2
1
3
Figure 2. Seismic hazard zones of the United States based on damages associated with historical earthquakes. (S.T. Algermissen, United States Geological Open File Report, 1969.)
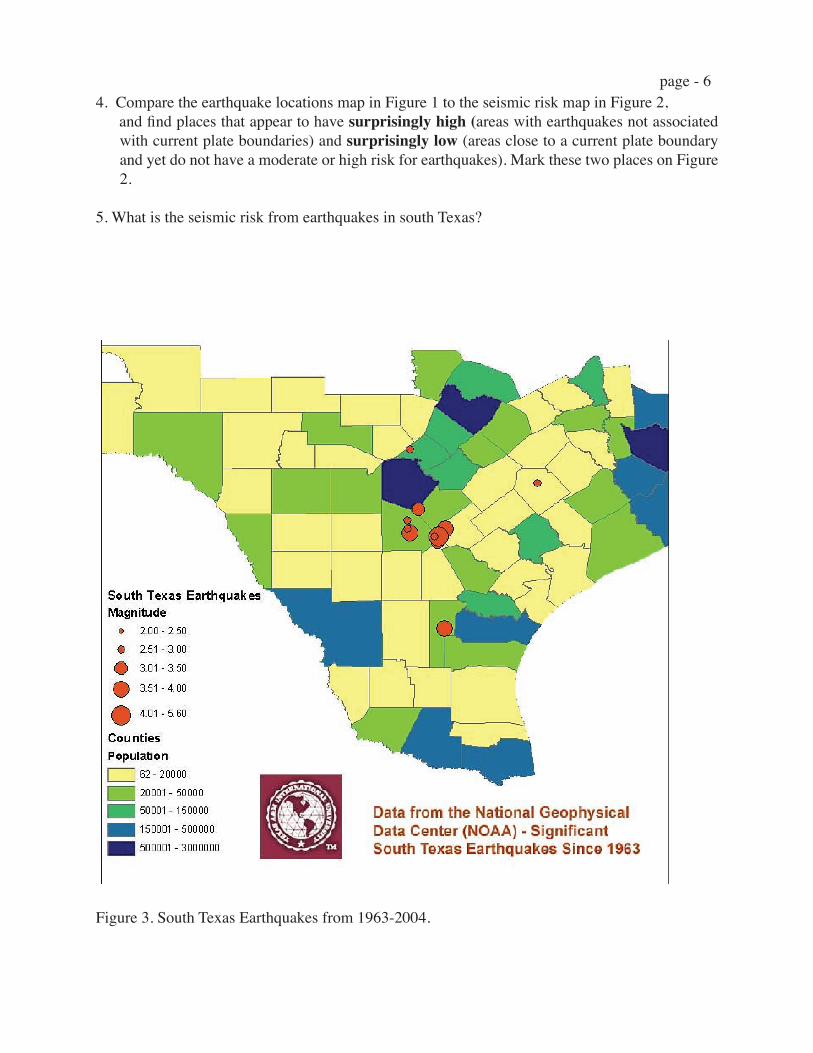
page - 64. Compare the earthquake locations map in Figure 1 to the seismic risk map in Figure 2, and find places that appear to have surprisingly high (areas with earthquakes not associated
with current plate boundaries) and surprisingly low (areas close to a current plate boundary and yet do not have a moderate or high risk for earthquakes). Mark these two places on Figure 2.
5. What is the seismic risk from earthquakes in south Texas?
Figure 3. South Texas Earthquakes from 1963-2004.
page - 7QUESTIONS:6.. How many earthquakes have occurred in South Texas from 1964 to 2004? ______________
7. What is the maximum Richter Magnitude of the South Texas Earthquakes in Figure 3? _________________
8. South of what South Texas city do these earthquakes cluster? _________________
9. Even in regions with a zero seismic risk there are still minor earthquakes. True or False
10. Besides natural earthquakes can you speculate about how else earthquakes can be produced in Texas. Read pg. 198-199 in the textbook. Can you think of some activities that occur in South Texas that might induce small earthquakes. Comment in detail.
The Modified Mercalli Intensity (MMI) is used in the United States to describe the effects of an earthquake on people and buildings. The Mercalli intensity scale was originally developed in Italy, where the building materials used and construction practices are somewhat different from the United States, and later “modified” for use here. Table 3 describes the types of earthquake shaking and damage that are associated with different MMI values. By convention, MMI values are written in Roman numerals to clearly distinguish them from the Richter magnitude for the same earthquake.
Modified Mercalli intensities for significant earthquakes are usually determined by the National Earthquake Information Center (NEIC) in Denver, Colorado, which is part of the United States Geological Survey. The NEIC obtains data about shaking and damage by mailing questionnaires to public officials such as Postmasters, Police Chiefs, and Fire Chiefs. The intensities are posted on a map, and the values are contoured to produce an isoseismal map. The contour lines on an isoseismal map define the areas where the shaking was approximately the same. The isoseismal map in Figure 4 shows intensities for the Coalinga, California, earthquake of 1983. In the early years of earthquake studies, prior to the 20th century, European seismologists used isoseismal
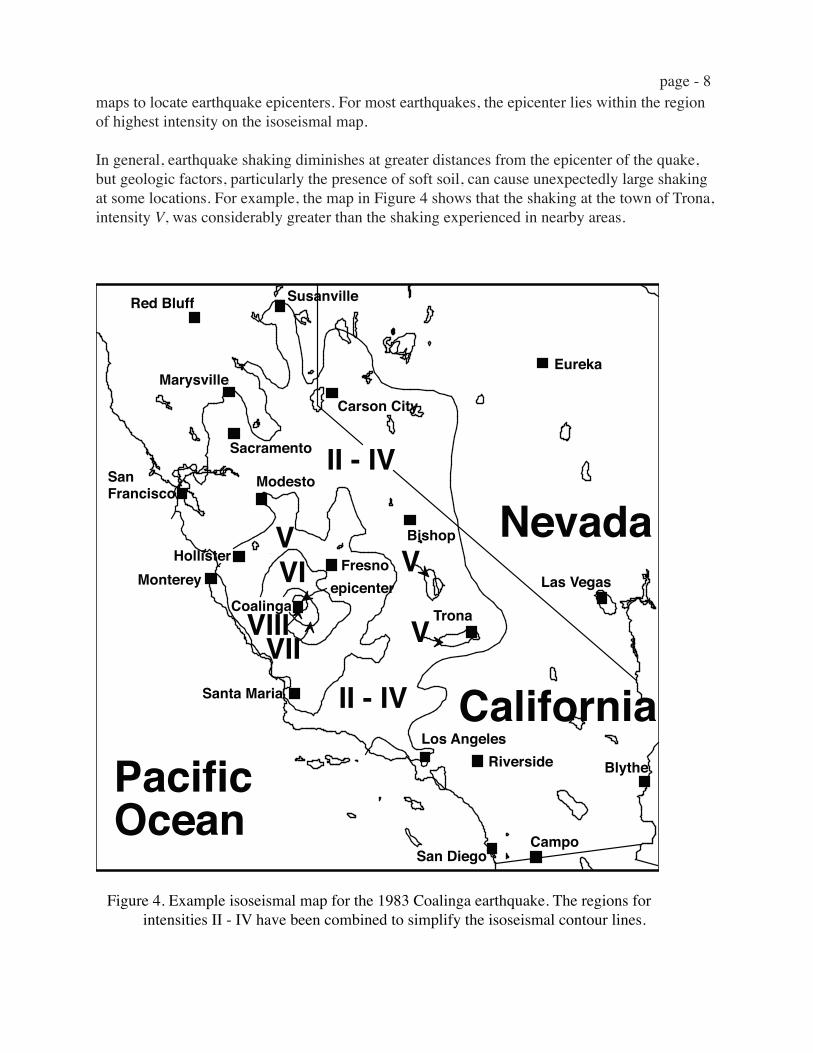
page - 8maps to locate earthquake epicenters. For most earthquakes, the epicenter lies within the region of highest intensity on the isoseismal map.
In general, earthquake shaking diminishes at greater distances from the epicenter of the quake, but geologic factors, particularly the presence of soft soil, can cause unexpectedly large shaking at some locations. For example, the map in Figure 4 shows that the shaking at the town of Trona, intensity V, was considerably greater than the shaking experienced in nearby areas.
Red Bluff Susanville
Eureka
Carson City
Marysville
Sacramento
ModestoSanFrancisco
HollisterMonterey
Coalinga
Fresnoepicenter
Bishop
Trona
Santa Maria
Los AngelesRiverside
Las Vegas
Blythe
CampoSan Diego
California
Nevada
PacificOcean
VIIIVII
VI V
V
II - IV
II - IV
V
Figure 4. Example isoseismal map for the 1983 Coalinga earthquake. The regions for intensities II - IV have been combined to simplify the isoseismal contour lines.
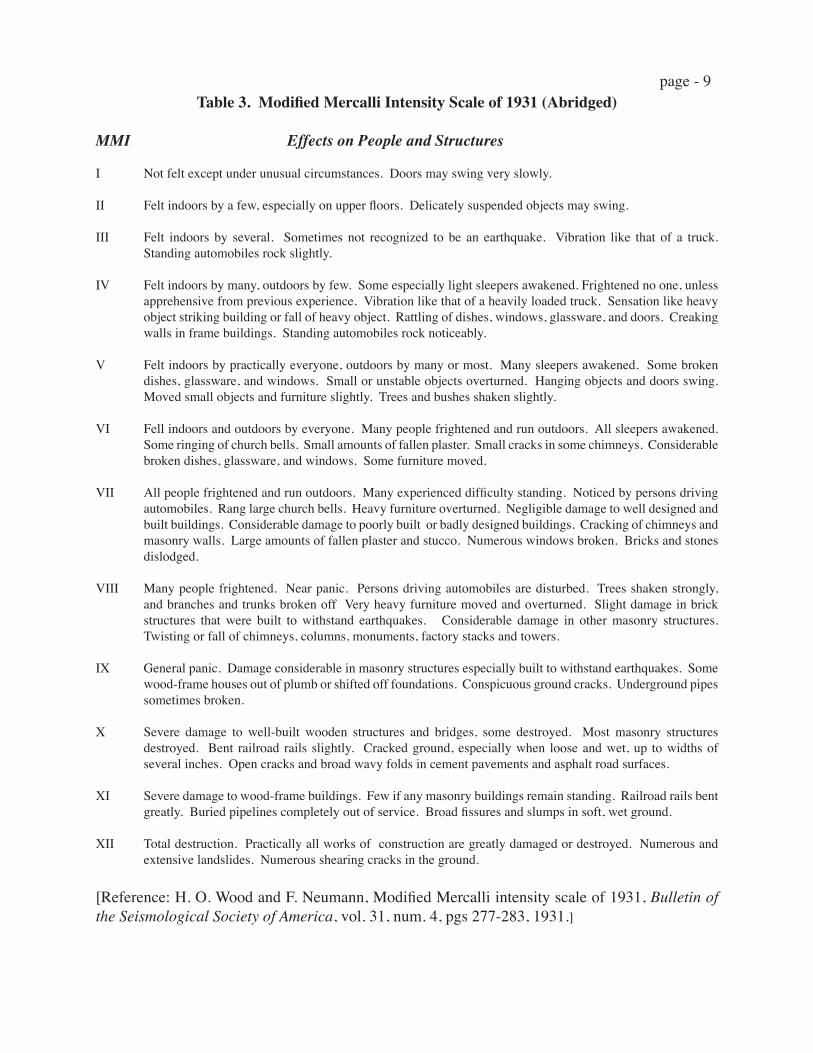
page - 9Table 3. Modified Mercalli Intensity Scale of 1931 (Abridged)
MMI Effects on People and Structures
I Not felt except under unusual circumstances. Doors may swing very slowly.
II Felt indoors by a few, especially on upper floors. Delicately suspended objects may swing.
III Felt indoors by several. Sometimes not recognized to be an earthquake. Vibration like that of a truck. Standing automobiles rock slightly.
IV Felt indoors by many, outdoors by few. Some especially light sleepers awakened. Frightened no one, unless apprehensive from previous experience. Vibration like that of a heavily loaded truck. Sensation like heavy object striking building or fall of heavy object. Rattling of dishes, windows, glassware, and doors. Creaking walls in frame buildings. Standing automobiles rock noticeably.
V Felt indoors by practically everyone, outdoors by many or most. Many sleepers awakened. Some broken dishes, glassware, and windows. Small or unstable objects overturned. Hanging objects and doors swing. Moved small objects and furniture slightly. Trees and bushes shaken slightly.
VI Fell indoors and outdoors by everyone. Many people frightened and run outdoors. All sleepers awakened. Some ringing of church bells. Small amounts of fallen plaster. Small cracks in some chimneys. Considerable broken dishes, glassware, and windows. Some furniture moved.
VII All people frightened and run outdoors. Many experienced difficulty standing. Noticed by persons driving automobiles. Rang large church bells. Heavy furniture overturned. Negligible damage to well designed and built buildings. Considerable damage to poorly built or badly designed buildings. Cracking of chimneys and masonry walls. Large amounts of fallen plaster and stucco. Numerous windows broken. Bricks and stones dislodged.
VIII Many people frightened. Near panic. Persons driving automobiles are disturbed. Trees shaken strongly, and branches and trunks broken off Very heavy furniture moved and overturned. Slight damage in brick structures that were built to withstand earthquakes. Considerable damage in other masonry structures. Twisting or fall of chimneys, columns, monuments, factory stacks and towers.
IX General panic. Damage considerable in masonry structures especially built to withstand earthquakes. Some wood-frame houses out of plumb or shifted off foundations. Conspicuous ground cracks. Underground pipes sometimes broken.
X Severe damage to well-built wooden structures and bridges, some destroyed. Most masonry structures destroyed. Bent railroad rails slightly. Cracked ground, especially when loose and wet, up to widths of several inches. Open cracks and broad wavy folds in cement pavements and asphalt road surfaces.
XI Severe damage to wood-frame buildings. Few if any masonry buildings remain standing. Railroad rails bent greatly. Buried pipelines completely out of service. Broad fissures and slumps in soft, wet ground.
XII Total destruction. Practically all works of construction are greatly damaged or destroyed. Numerous and extensive landslides. Numerous shearing cracks in the ground.
[Reference: H. O. Wood and F. Neumann, Modified Mercalli intensity scale of 1931, Bulletin of the Seismological Society of America, vol. 31, num. 4, pgs 277-283, 1931.]

page - 10QUESTIONS:11. Where was the epicenter for this earthquake, judging from the above isoseismal map (Figure
4). Hint: Normally, but not always, does the epicenter occurs where the Mercalli value is greatest.
12. Describe possible shaking and damage that might have occurred in the town of Coalinga, California based on Figure 4.
13. Describe possible shaking and damage that might have occurred in the City of San Francisco based on Figure 4.
14. Why was the damage locally greater around the small town of Trona. Hint: think about the type of geology in this area, which consists of a dried muddy lake bed. How is the
amplitude of surface waves affected by passage through soft mud versus bedrock. Refer to your lecture notes and textbook.
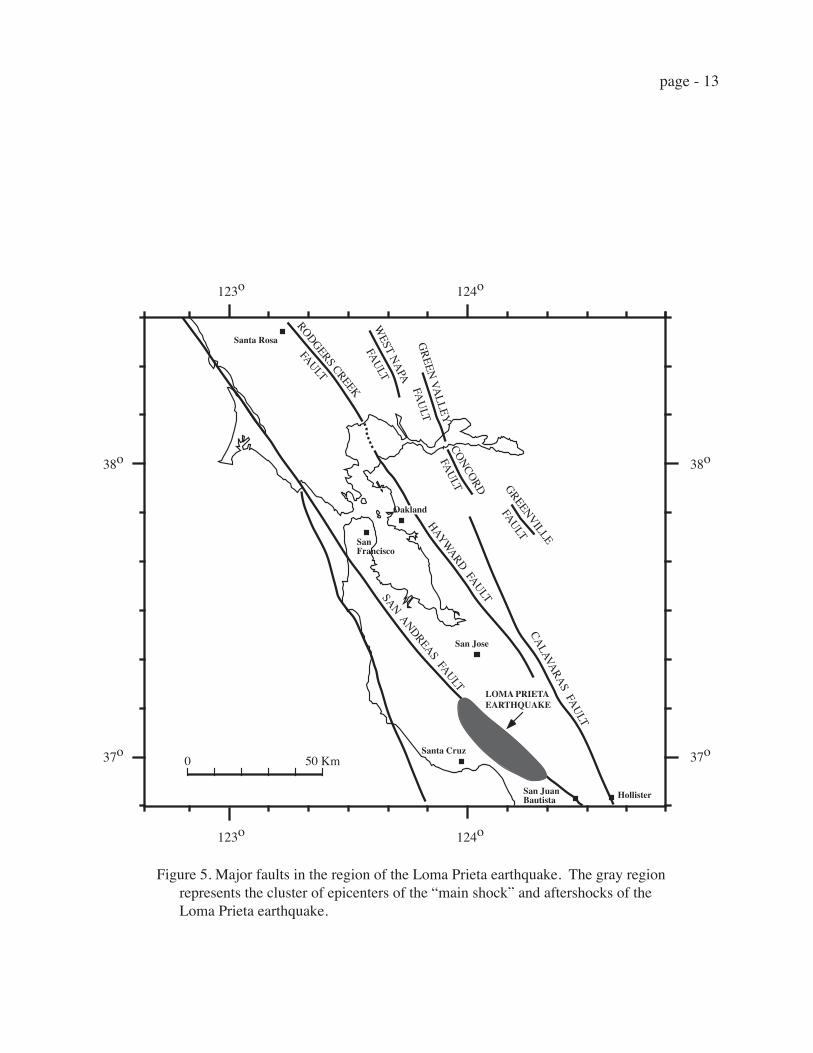
Several factors contribute to the damage suffered by buildings during an earthquake. The strength of shaking is among the most important. Because the strength of shaking decreases rapidly with distance from the fault, this factor is more important near the epicenter than for towns far away. Another factor is the duration of shaking. The longer a building shakes, the greater the damage it is likely to suffer. The shaking from the Loma Prieta earthquake lasted only about 10-15 seconds (Ritcher Magnitude 7.1), yet it caused considerable damage far from the epicenter in the city of San Francisco (Figure 5). Other earthquakes near San Francisco that were comparable in terms of their Richter magnitudes to the Loma Prieta earthquake had caused up to 30-40 seconds of shaking, and were therefore potentially more damaging. A third factor that contributes to building damage is the type of soil. Some especially soft soils can increase the strength of shaking. In other cases, the soils may settle or slide, and damage the foundations
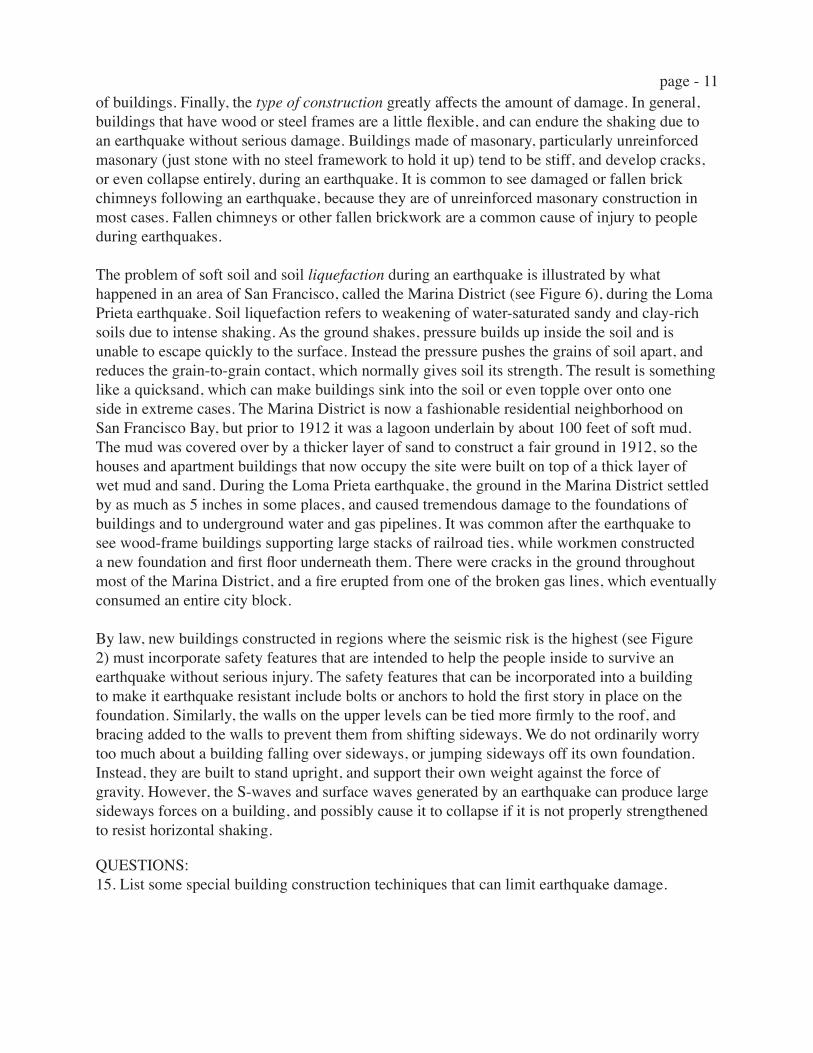
page - 11of buildings. Finally, the type of construction greatly affects the amount of damage. In general, buildings that have wood or steel frames are a little flexible, and can endure the shaking due to an earthquake without serious damage. Buildings made of masonary, particularly unreinforced masonary (just stone with no steel framework to hold it up) tend to be stiff, and develop cracks, or even collapse entirely, during an earthquake. It is common to see damaged or fallen brick chimneys following an earthquake, because they are of unreinforced masonary construction in most cases. Fallen chimneys or other fallen brickwork are a common cause of injury to people during earthquakes.
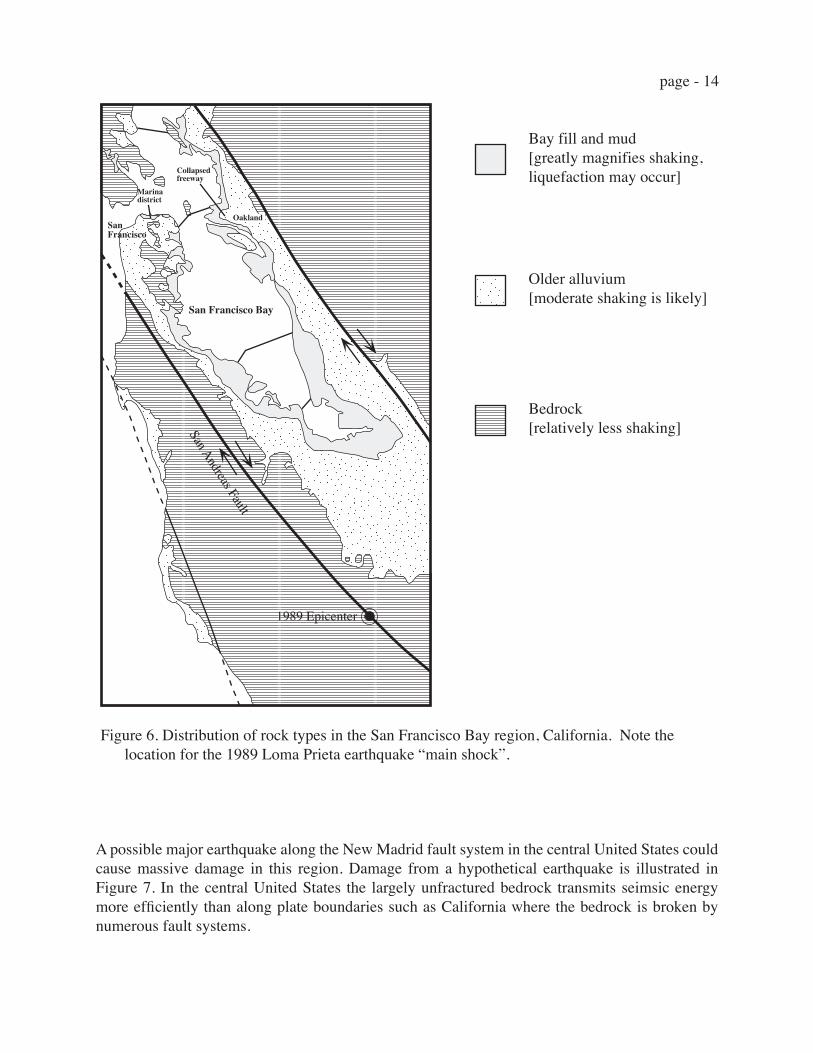
The problem of soft soil and soil liquefaction during an earthquake is illustrated by what happened in an area of San Francisco, called the Marina District (see Figure 6), during the Loma Prieta earthquake. Soil liquefaction refers to weakening of water-saturated sandy and clay-rich soils due to intense shaking. As the ground shakes, pressure builds up inside the soil and is unable to escape quickly to the surface. Instead the pressure pushes the grains of soil apart, and reduces the grain-to-grain contact, which normally gives soil its strength. The result is something like a quicksand, which can make buildings sink into the soil or even topple over onto one side in extreme cases. The Marina District is now a fashionable residential neighborhood on San Francisco Bay, but prior to 1912 it was a lagoon underlain by about 100 feet of soft mud. The mud was covered over by a thicker layer of sand to construct a fair ground in 1912, so the houses and apartment buildings that now occupy the site were built on top of a thick layer of wet mud and sand. During the Loma Prieta earthquake, the ground in the Marina District settled by as much as 5 inches in some places, and caused tremendous damage to the foundations of buildings and to underground water and gas pipelines. It was common after the earthquake to see wood-frame buildings supporting large stacks of railroad ties, while workmen constructed a new foundation and first floor underneath them. There were cracks in the ground throughout most of the Marina District, and a fire erupted from one of the broken gas lines, which eventually consumed an entire city block.
By law, new buildings constructed in regions where the seismic risk is the highest (see Figure 2) must incorporate safety features that are intended to help the people inside to survive an earthquake without serious injury. The safety features that can be incorporated into a building to make it earthquake resistant include bolts or anchors to hold the first story in place on the foundation. Similarly, the walls on the upper levels can be tied more firmly to the roof, and bracing added to the walls to prevent them from shifting sideways. We do not ordinarily worry too much about a building falling over sideways, or jumping sideways off its own foundation. Instead, they are built to stand upright, and support their own weight against the force of gravity. However, the S-waves and surface waves generated by an earthquake can produce large sideways forces on a building, and possibly cause it to collapse if it is not properly strengthened to resist horizontal shaking.
QUESTIONS:15. List some special building construction techiniques that can limit earthquake damage.
page - 1216. What is liquefaction? And describe how it contributes to building failures.
17. Offset along which fault was the trigger for the 1989 Loma Prieta earthquake? Examine Figure 5. ______________________________
18. Why was there much more damage (in terms of total dollars) in San Francisco compared to Santa Cruz even although the epicenter was much closer to Santa Cruz? Hint: Compare the bedrock geology between these two locations.
19. What factors contributed to greater structural damage around the immediate shoreline of the San Francisco Bay area.
20. If you were to build a house in San Francisco select a location on Figure 6 that would offer the greatest protection from earthquake shaking.
21. Is the San Francisco Bay area near a plate boundary and if so what type of plate boundary?
page - 13
Santa Rosa
San Jose
Hollister
Santa Cruz
San JuanBautista
RODGERS CREEK
FAULT
FAULT
FAU
LTFAULT
FAULT
WEST NAPA
GREEN
VALLEY
CONCORD GREENVILLE
HAYWARD FAULT
CALAVARAS FAULT
SAN ANDREAS FAULT
Oakland
SanFrancisco
LOMA PRIETAEARTHQUAKE
38o
37o
123o
123o 124o
124o
37o
38o
0 50 Km
Figure 5. Major faults in the region of the Loma Prieta earthquake. The gray region represents the cluster of epicenters of the “main shock” and aftershocks of the Loma Prieta earthquake.
page - 14
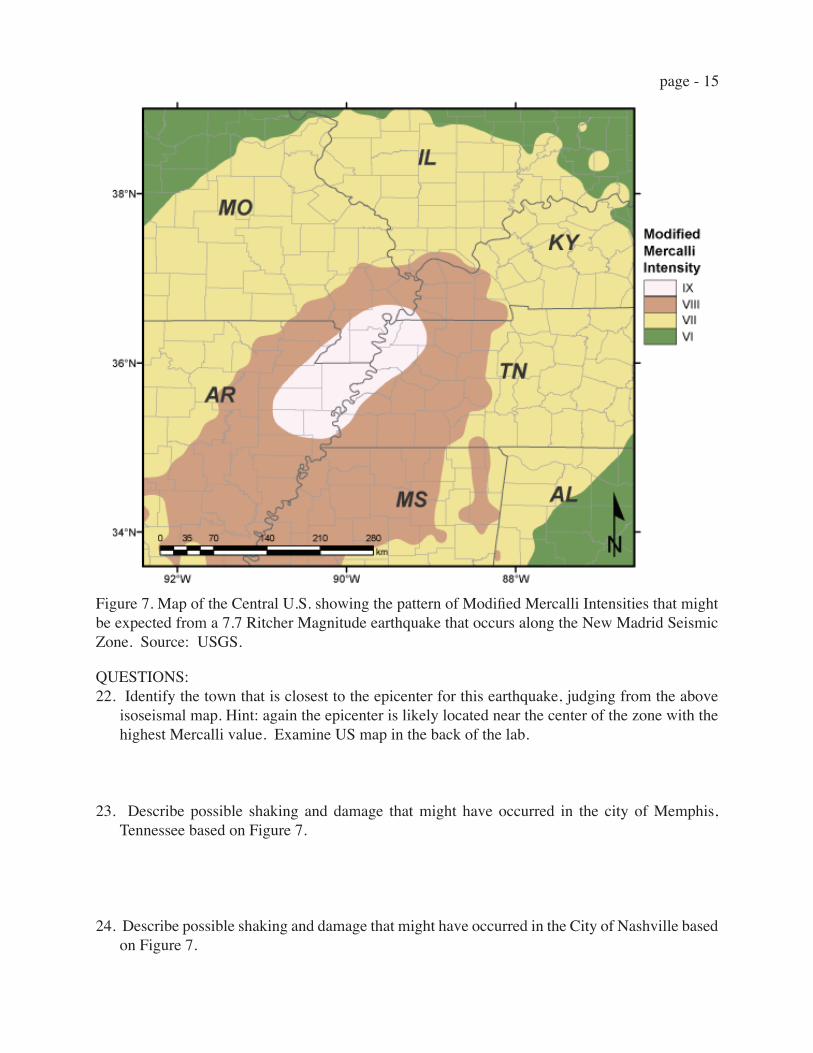
A possible major earthquake along the New Madrid fault system in the central United States could cause massive damage in this region. Damage from a hypothetical earthquake is illustrated in Figure 7. In the central United States the largely unfractured bedrock transmits seimsic energy more efficiently than along plate boundaries such as California where the bedrock is broken by numerous fault systems.
Collapsedfreeway
Oakland
Marinadistrict
San Francisco
San Francisco Bay
San Andreas Fault
1989 Epicenter
Bay fill and mud[greatly magnifies shaking,liquefaction may occur]
Older alluvium[moderate shaking is likely]
Bedrock[relatively less shaking]
Figure 6. Distribution of rock types in the San Francisco Bay region, California. Note the location for the 1989 Loma Prieta earthquake “main shock”.
page - 15
Figure 7. Map of the Central U.S. showing the pattern of Modified Mercalli Intensities that might be expected from a 7.7 Ritcher Magnitude earthquake that occurs along the New Madrid Seismic Zone. Source: USGS.
QUESTIONS:22. Identify the town that is closest to the epicenter for this earthquake, judging from the above
isoseismal map. Hint: again the epicenter is likely located near the center of the zone with the highest Mercalli value. Examine US map in the back of the lab.
23. Describe possible shaking and damage that might have occurred in the city of Memphis, Tennessee based on Figure 7.
24. Describe possible shaking and damage that might have occurred in the City of Nashville based on Figure 7.

page - 16
25. Comment on the geographic extent of earthquake damage associated with the 1989 Loma Prieta earthquake and a potential earthquake along the New Madrid fault. Earthquake damage extends much further in association with movement along which fault?
26. Can you offer to explain the differences in the extent of damage associated with earthquakes along San Amdres and New Madrid faults. Hint: look at the differences in the map scales on Figures 5 and 7 and refer to the bottom of page 14.
27. The New Madrid is associated with a Plate Boundary Fault or Ancient fault system.