environmental evaluation of ccs using life cycle assessment–a synthesis report
TRANSCRIPT

Energy
ProcediaEnergy Procedia 00 (2010) 000–000
www.elsevier.com/locate/XXX
GHGT-10
Environmental evaluation of CCS using Life Cycle Assessment - a synthesis report
Marx, J.a; Schreiber, A.a; Zapp, P.a*; Haines, M.b; Hake, J.-Fr.a, Gale, J.baForschungszentrum Jülich, Institute of Energy Research - Systems Analysis and Technology Evaluation (IEF-STE), D-52425 Jülich, Germany
bIEA Greenhouse Gas R&D Programme, Stoke Orchard, Cheltenham, Glos. GL52 7RZ, UK
Elsevier use only: Received date here; revised date here; accepted date here
Abstract
In the last years several studies have investigated carbon capture and storage (CCS) from a life cycle perspective focusing on the environmental performance. Scope of this study is to compare systematically the different approaches, to summarise the results, address methodological variations and formulate guidelines to assign the various conclusions gathered from the studies. CCS is a wide field with various technological options. All studies show the expected reduction in GWP but often an increase in other impact categories, regardless of capture technology and fuel considered. Three parameter sets have been identified, which have a significant impact on the results: a) development of plant efficiencies and energy penalties; b) capture efficiency and purity of the CO2; c) fuel origin and composition. Although there are still big differences in the underlying assumptions of the studies and also some methodological shortcomings, Life Cycle Assessment (LCA) has proved to be a helpful tool to investigate the environmental consequences related to the introduction of CCS. Nevertheless, the number of existing studies is not sufficient to give a comprehensive picture and there is still a wide field of subjects and technologies which have not been covered yet.© 2010 Elsevier Ltd. All rights reserved
Kewords: Carbon capture and storage; life cycle assessment; methodology approach; technology evaluation; study comparison
1. Introduction
Carbon capture and storage (CCS) is gaining importance as one option to reduce CO2 emissions to protect our climate. Capturing CO2 reduces direct emissions from the power plant but upstream emissions from additional fuel and material supplies and downstream emissions from waste disposal and waste water treatment are usually not captured. A life cycle approach provides a comprehensive evaluation of all environmental effects of the new technology. In recent years, several studies have used Life Cycle Assessment (LCA) as a tool to address the full environmental consequences of applying CCS to power plants. Although they consider the same CCS technologies, the comparability of the study results appears questionable. This study systematically compares 15 different LCA approaches applied to CCS power plants, to evaluate variations in scope, methodology and outcomes and to indicate what the focus of further studies in this area should be (full report see [1]). Nine studies have a European focus, three consider the US situation, one looks at the Japanese situation and two have a global approach.
*Corresponding author. Tel.: *49-2461-615942; fax: +49-2461-612540.E-mail address: [email protected].
c⃝ 2011 Published by Elsevier Ltd.
Energy Procedia 4 (2011) 2448–2456
www.elsevier.com/locate/procedia
doi:10.1016/j.egypro.2011.02.139

2 Author name / Energy Procedia 00 (2010) 000–000
2. Systematic comparison of the selected studies
A comparison of competing energy technologies requires a thorough understanding of each system and its boundaries. The use of the same assumptions regarding system boundaries and generic data is essential. Additionally, the wide range of approved performance possibilities and methodological shortcomings of LCA make a close investigation of the studies and their comparability necessary.
2.1. Technology driven differentiation
Some studies compare di fferent CCS technologies with one another, others concentrate on one specific CCS technology and/or compare CCS routes against alternatives such as renewable energy production.
2.1.1. Capture technologyThe three technology routes, post-combustion, oxyfuel and pre-combustion constitute the fi rst differentiation
criteria of the studies. Mono-ethanolamine (MEA) scrubbing is always the technology of choice. Only three studies investigate other post -combustion technologies [2, 3] and other solvents [4] as well. The oxyfuel process route is described only in three studies [5 - 7]. The IGCC/NGCC technology with integrated pre-combustion technology is the objective of 8 studies [3, 5 - 11] (Table 1). Fuel type is a second major differentiation. Hard coal is considered in 11 studies emphasising the fact, that CO2 capture is most valuable for this fuel. In four studies, which look at the German electricity production [5 - 7, 12], lignite is considered. Natural gas is an important fuel and is considered in 8 studies [3, 5, 7, 9-11, 13, 14] (Table 1).
No common understanding of future efficiency development for commercial power production or energy penalties due to capture is apparent. Often detailed technical assumptions e.g. technological representation or emission reduction efficiencies are unclear. In Figure 1 the range of net efficiencies and energy penalties used in the studies are presented.
0
10
20
30
40
50
60
Korre
Schre
iber 2
010
r.Od
ehM
uram
atsu
MEA
Schre
iber 2
020
r.M
uram
atsu
KS-
1Ko
ornn
eef
Spat
hSc
hreibe
r 202
0 g.
Vieb
ahn
Need
sOd
ehIE
A 20
06Vi
ebah
nLo
mba
rdi
Need
sVi
ebah
nNe
eds
Schre
iber 2
010
r.Pe
hnt
Schre
iber 2
020
r.Vi
ebah
nSc
hreibe
r 202
0 g.
Need
s
Pehn
tNe
eds
Pehn
tNe
eds
Spat
hOd
ehM
odah
lLo
mba
rdi
D'A
ddar
io/M
GC
D'A
ddar
ioIE
A 20
06Vi
ebah
nNe
eds
IEA
2006
D'A
ddar
io
net e
ffici
enc
y [%
]
0
2
4
6
8
10
12
14
16
18
20
effic
ency
loss
es d
ue
to C
O2 c
aptu
re [%
-po
ints
]
net efficiencyenergy penalty
Hard coal Lignite Natural gas
Post Post PostOxy OxyPre Pre Pre
X no values
Figure 1: Net efficiency and energy penalty for different fuels and technologies
Hard coal post-combustion efficiency values range between 29.6 % [12] and 42 % [5]. For the pre-combustion route the difference between the lowest (32 %) [11] and the highest efficiency (48 %) [5] is even higher. The differences originate from different assumptions on time horizons and technological progress. The study with the furthest time horizon 2050 [5] uses the highest net efficiencies. For the oxyfuel process a high share of energy is needed for the oxygen production. The specific demand is still very unclear, figures range from 160 kWh/tO2 [15]
J. Marx et al. / Energy Procedia 4 (2011) 2448–2456 2449

Author name / Energy Procedia 00 (2010) 000–000 3
up to 320 kWh/tO2 [6]. In general, energy penalties for pre-combustion processes are the lowest and for post-combustion the highest. The energy penalty of lignite fuelled post combustion power plants differs most widely (7 % - 18.2 %) due to different technology assumptions. The capture technology can be retrofitted to an existing power plant leading to higher energy penalties or be integrated into an optimised greenfield power plant, as explicitly analysed in [12].
2.1.2. Transport and storageSeveral studies [2, 4 - 7, 12, 13, 16] investigate technologies for CO2 transport and sequestration. The estimated
share of transportation and storage on the environmental impacts sometimes varies one order of magnitude. While the studies [4, 6, 13] calculate a share of transport and storage on the total GWP of less than 1 %, the studies [5, 7, 12, 16] determine between 3 % and 10 %, depending on the choices of system and fuel.
2.2. LCA methodology dri ven differentiation
Although a standard defines the procedure of an LCA [18], the margin of flexibility in how to perform an LCA is still wide. Some choices will have a high impact on the overall results.
2.2.1. Functional unitFor an electricity production process the functional unit typically is 1 kWh of net electricity produced. Looking at
CCS a second product created in power plants is CO2. It is typically regarded as a waste product which has to be stored. C O2 is produced in different purities and pressures by the different capture systems. These different characteristics of CO2 have an impact on energy penalty and therewith on emissions produced. Hardly any information about the purity of CO2 produced is available. This should be kept in mind when comparing apparently equal systems.
2.2.2. Time horizonThe time horizon has an impact on the future technical parameters which are selected for CCS but also for
competing technologies. Almost all studies consider present and future power plant and CCS systems up to the year 2020. Only IEA [9] and NEEDS [5] extrapolate the power plants until 2030 and even 2050. In many studies which consider future systems, the first -order processes (representing the main production processes) are extrapolated into the future. Second and third order processes (background systems) are seldom adjusted in the same way.
Another point of interest is the modification of coal imports in time due to shifts in supply and demand. Two studies [12, 14] consider a change in coal supply. They show, that different coal deposits, exploration requirements and associated routes of coal transport change the environmental impacts of the coal supply chain considerably.
The choice of time horizon also plays an important role in evaluating the storage process and especially possible leakage. In LCAs long-term emissions are implicitly cut off. Comparison between short and long-term emissions is thus an open question in LCA methodology and especially relevant for CCS but is not covered in the selected studies. It is not clear, how far the long-term CO2 emissions from possible storage leakage will have a negative environmental effect in the distant future. Forecasts about climate conditions, CO2 buffer action of o cean and biosphere cannot be made with any certainty. Only two studies [2, 7] consider leakage rates in a sensitivity analysis, to get an idea of the impact. However it seems necessary to find an agreement on a harmonized leakage model.
2.2.3. Spatial representationIn the CCS chain especially the storage sites are highly site specific. However, in those studies where storage is
included, no site specific information beside CO2 transport distances is used to describe the process. Additionally, many products of second order processes are very site specific, such as the fuels or electricity mix.
The different environmental impacts contribute on global (climate change, stratospheric ozone depletion), regional or even local scales (acidification, eutrophication). Related to the geographical location the impacts for regionally or locally scaled emissions can vary widely, depending on the ecosystem sensitivity. Although there are some approaches for including regionally different environmental impacts under discussion [19, 20] no study uses site or region dependent impact factors. A first point to consider regional references is the normalisation step, where each effect is benchmarked against the known total effect for this class of a specific region. Those studies [12, 13,
2450 J. Marx et al. / Energy Procedia 4 (2011) 2448–2456

4 Author name / Energy Procedia 00 (2010) 000–000
21] which include the normalisation step in their analysis use the same approach of CML 2001 [22] but country specific data to set the relation.
2.2.4. Upstream and downstream processesFor conventional power systems it has often been proved, that construction and dismantling of power plants can
be neglected [6, 21]. A share of less than 0.2 % on the total GWP is connected to those life cycle phases. The inclusion of CCS technology increases the values. The studies differ in their estimation of the proportions between 0.34 % for a hard coal based IGCC [10] and 4.9 % for a lignite fuelled oxyfuel system [5].
The analysis of the studies clearly shows the significant influence of the upstream and downstream processes on the overall emissions and their impacts. For power plants with CCS it is in general higher than for power plants without CCS. For the different impact categories the share can vary considerably. The share regarding GWP increases from about 10 % up to 50-60 % for the power plants without and with post -combustion capture. In the cases of a NGCC and a power plant fired by lignite the share of the upstream and downstream processes are markedly smaller and amount to only 30 % and 20 % for the CCS plants, respectively. The reason for that is the higher influence of hard coal supply chain on the score of GWP in comparison to the natural gas and lignite supply chain.
Table 1: Scope of LCA Studies
2.2.5. Impact categoriesFor the comparison, only those categories were chosen for which a sufficient number of studies use the same
impact indicator. The categories are: Global Warming Potential GWP, Acidification Potential AP, Eutrophication Potential EP, Photochemical Oxidation Potential POCP, and Cumulated Energy Demand CED.
One impact category which is significantly affected by CCS technology is Human Toxicity Potential HTP. Those studies which include this category often show an increase from nearly 200 % for systems with CCS. Unfortunately, HTP is one of the impact categories which still needs much research for consolidation of exposure pathways of emissions. However, normalisation shows that HTP for conventional power production systems is quite low even if there is a dramatic increase. Other effects typically connected with CO2 storage are the displacement of reservoir fl uid and the effect of seepage on the marine sediment which are not covered in conventional LCA impact categories yet.
2.2.6. Operational Valuation/weighting methodsNot only the weighting factors, but also the choice of valuation methodology, and the choice of using a valuation
method at all, are influenced by fundamental ethical and ideological valuations. Since there is no consensus on these
J. Marx et al. / Energy Procedia 4 (2011) 2448–2456 2451

Author name / Energy Procedia 00 (2010) 000–000 5
fundamental values, there is no consensus either on weighting factors, or on valuation methods. If no valuation method is used at all, comparisons are made category by category. Only three studies use models to weight and aggregate the results to a single score [2, 5, 13]. Khoo [2] has chosen two (EDIP, Eco-indicator `99) and Modal [13] three (IMPACT 2002+, EDIP, EPS 2000) different aggregation methods to see the robustness of the results.
3. CCS technologies and their impacts
The CCS technologies are compared considering different capture techniques and types of fuel. Therefore, the absolute impact equivalents of each fuel and technology are presented in the first diagram of a figure. The following graphs always show the relative difference due to CO2 capture. As discussed before, a presentation of relative changes in one diagram without further reflection might overvalue impact categories with big changes but small contribution to the total environment. Therefore, a yearly contribution to a specific region is given for reference (normalisation step). As the different studies cover different regions the world average values from CML 2001 are chosen as values for the reference system (Table 2).
Table 2: Normalisation factors world 2000 [22]
Impact category World 2000
Global Warming Potential (GWP 100 years) 4.18E+13 kg CO2 eq.
Acidification Potential (AP) 2.39E+11 kg SO2 eq.
Eutrophication Potential (EP) 1.58E+11 kg phosphate eq.
Photochemical Oxidation Potential (POCP) 4.01E+10 kg ethane eq.
Human Toxicity Potential (HTP) 3.63E+13 kg DCB eq.
Using the electricity generation figures for the different energy sources from 2000 (hard coal: 5296 TWh, lignite: 693 TWh, natural gas: 2676 TWh) [23] a total production by CCS technology is assumed. For all analysis the technologies with the lowest and the highest values are taken to analyse the effect of the best and worst performance. Hence, in each figure (2 – 4) the relative importance of the various impact categories is revealed.
3.1. Hard coal and lignite
The absolute GWP of the pulverised hard coal combustion technology without capture varies from 765 g CO2-eq./kWh to 1092 g CO2-eq./kWh, depending on the estimated efficiency and the coal used (figure 2a, left). The acidification potential values are much more scattered. Koornneef [21] assumes a very high value (2.76 g SO2-eq./kWh) for his “old” average PC plant from 2000, while the lowest value is 0.39 g SO2-eq./kWh [17]. EP, POCP and CED do not vary much.
The normalisation shows, that power generation has a considerable (13.2 %) share of the total world GWP assuming low performance plants. If best available technology (BAT) were used world wide this drops to 10 %. The share of the worlds AP using only worst case technologies is 3.5 % while BAT reduces this to about 1 %. The effects on the EP and POCP are smaller. The LCA results for hard coal power generation systems with CCS clearly indicate a substantial reduction in GWP (figure 2b, left). However, the LCAs show an increase in all the other impact categories (AP, EP, POCP and CED) for post-combustion. The share in the world AP increases from 3.5 % to 5.3 % for the worst case scenario. Thus rises in AP may detract significantly from reductions in GWP. In several LCAs EP and POCP increase up to 100 % and beyond in comparison with the power plants without CCS. But, the normalisation figures show shares of 2 % or less for technologies with high EP and POCP and are negligible for best technologies. The impact assessments of the two studies analysing hard coal oxyfuel power plants do not show consistent results, except for GWP. The values for AP and EP lie between minus 16 % and plus 40 % and minus 9 % and plus 40 %, respectively, for POCP between 23 % and 54 %. This implies that no general conclusions can yet be drawn from the environmental assessment of oxyfuel power plants.
2452 J. Marx et al. / Energy Procedia 4 (2011) 2448–2456
6 Author name / Energy Procedia 00 (2010) 000–000
a) without capture
Hard coal
9,7
13,2
0,10,9 0,2
3,5
0,8 1,3
0
0,5
1
1,5
2
2,5
3
GWP [kg CO2-equiv/kWh]
AP [g SO2-equiv./kWh]
EP [g PO43-equiv./kWh]
POCP [g C2H4-equiv./kWh]
Cumulativeenergy demand
[GJ/kWh]
equi
vale
nt
0
2
4
6
8
10
12
14
[%] n
orm
alis
ed s
hare
of w
orld
wid
impa
cts
Koornneef PC
Koornneef Super-PC
Odeh PC
Odeh Super-PC
Schreiber PC 1990
Schreiber PC 2005
Schreiber PC 2010
Schreiber PC 2020
Viebahn PC
Spath PC
Needs PC 2025
Korre PC (Bittuminous)
Muramatsu PC
Best case
Worst case
Lignite
1,3
0,2
1,5
0,5
0,00,00,10,1
0
0,2
0,4
0,6
0,8
1
1,2
1,4
1,6
1,8
GWP [kg CO2-equiv/kWh]
AP [g SO2-equiv./kWh]
EP [g PO43-equiv./kWh]
POCP [g C2H4-equiv./kWh]
Cumulativeenergy demand
[GJ/kWh]
equi
val
ents
0,0
0,2
0,4
0,6
0,8
1,0
1,2
1,4
1,6
[%] n
orm
alis
ed s
har
e o
f wo
rld
imp
acts
Pehnt PCViebahn PCNeeds PC 2025Schreiber PC 1990Schreiber PC 2005Schreiber PC 2010Schreiber PC 2020Best caseWorst case
b) with capturepost-combustion
2,3
1,0
0,2 0,2
3,4
5,3
1,52,0
-100
-50
0
50
100
150
GWP AP EP POCP Cumulativeenergy demand
[%] r
elat
ive
imp
acts
-4,0
-2,0
0,0
2,0
4,0
6,0
[%] n
orm
alis
ed
shar
e o
f wo
rld
imp
acts
Koornneef PC
Odeh Super-PC
Schreiber 2010 retr.
Schreiber 2020 retr.
Schreiber 2020 greenf.
Viebahn PC
Spath PC
Needs PC
Korre PC
Muramatsu PC KS-1
Muramatsu PC
Best case
Worst case
Hard coalpost-combustion
0,20,2
0,0 0,0
0,3
0,4
0,10,1
-200
-100
0
100
200
300
400
500
600
GWP AP EP POCP Cumulativeenergy demand
[%] r
elat
ive
impa
cts
-0,2
-0,1
0,0
0,1
0,2
0,3
0,4
0,5
0,6
[%] n
orm
alis
ed s
har
e o
f wo
rld
imp
acts
Pehnt
Viebahn
Needs
Schreiber 2010 retr.
Schreiber 2020 retr.
Schreiber 2020 greenf.
Best case
Worst case
Lignite
oxyfuel
1,52,0
0,3 0,4
2,22,5
0,60,3
-100
-80
-60
-40
-20
0
2 0
4 0
6 0
8 0
GWP AP EP POCP Cumulative energydemand
[%]
rela
tive
imp
acts
-5,0
-4,0
-3,0
-2,0
-1,0
0,0
1,0
2,0
3,0
4,0
[%]
norm
alis
ed s
hare
of w
orld
im
pact
s ViebahnNeedsBest caseWorst case
Hard coal oxyfuel
0,1
0,20,13
0,010,00 0,000,020,04
-120
-100
-80
-60
-40
-20
0
20
40
60
GWP AP EP POCP Cumulative energydemand
[%] r
elat
ive
imp
act
-0,6
-0,5
-0,4
-0,3
-0,2
-0,1
0,0
0,1
0,2
0,3
[%] n
orm
alis
ed s
hare
of w
orld
im
pact
s
Pehnt
Needs
Best case
Worst case
Lignite
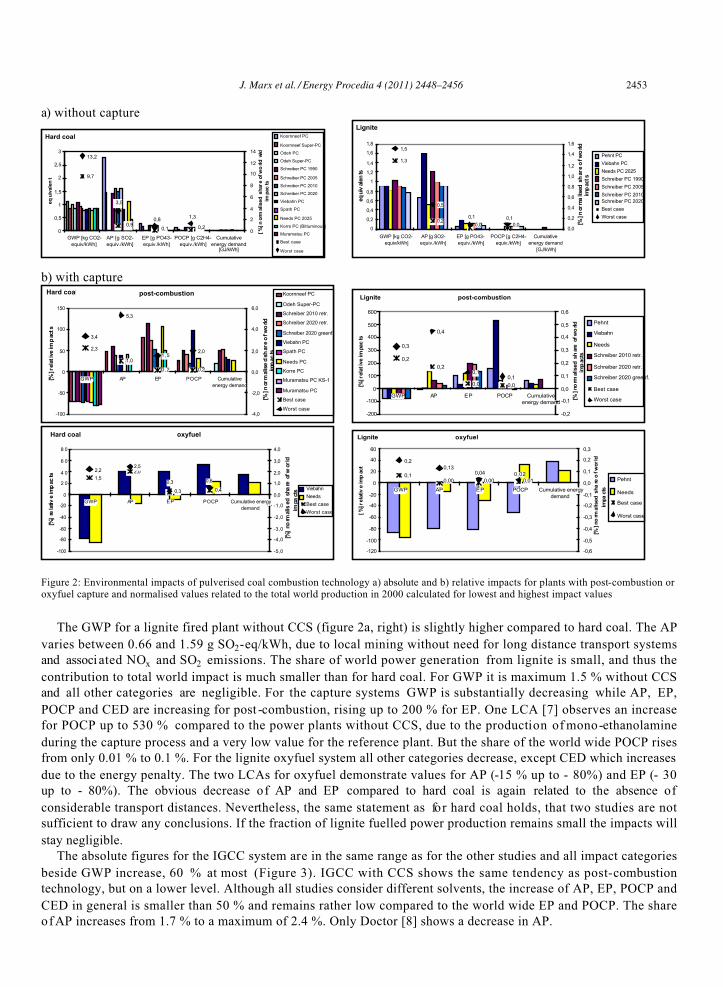
Figure 2: Environmental impacts of pulverised coal combustion technology a) absolute and b) relative impacts for plants with post-combustion or oxyfuel capture and normalised values related to the total world production in 2000 calculated for lowest and highest impact values
The GWP for a lignite fired plant without CCS (figure 2a, right) is slightly higher compared to hard coal. The AP varies between 0.66 and 1.59 g SO2-eq/kWh, due to local mining without need for long distance transport systems and associ ated NOx and SO2 emissions. The share of world power generation from lignite is small, and thus the contribution to total world impact is much smaller than for hard coal. For GWP it is maximum 1.5 % without CCS and all other categories are negligible. For the capture systems GWP is substantially decreasing while AP, EP, POCP and CED are increasing for post -combustion, rising up to 200 % for EP. One LCA [7] observes an increase for POCP up to 530 % compared to the power plants without CCS, due to the production of mono-ethanolamine during the capture process and a very low value for the reference plant. But the share of the world wide POCP rises from only 0.01 % to 0.1 %. For the lignite oxyfuel system all other categories decrease, except CED which increasesdue to the energy penalty. The two LCAs for oxyfuel demonstrate values for AP (-15 % up to - 80%) and EP (- 30 up to - 80%). The obvious decrease of AP and EP compared to hard coal is again related to the absence of considerable transport distances. Nevertheless, the same statement as for hard coal holds, that two studies are not sufficient to draw any conclusions. If the fraction of lignite fuelled power production remains small the impacts will stay negligible.
The absolute figures for the IGCC system are in the same range as for the other studies and all impact categories beside GWP increase, 60 % at most (Figure 3). IGCC with CCS shows the same tendency as post-combustion technology, but on a lower level. Although all studies consider different solvents, the increase of AP, EP, POCP and CED in general is smaller than 50 % and remains rather low compared to the world wide EP and POCP. The share of AP increases from 1.7 % to a maximum of 2.4 %. Only Doctor [8] shows a decrease in AP.
J. Marx et al. / Energy Procedia 4 (2011) 2448–2456 2453

Author name / Energy Procedia 00 (2010) 000–000 7
IGCC without CCS
8,8
1,1
10,9
0,10,3
1,7
0,30,4
0
0,1
0,2
0,3
0,4
0,5
0,6
0,7
0,8
0,9
1
GWP [kg CO2-equiv/kWh]
AP [g SO2-equiv./kWh]
EP [g PO43-equiv./kWh]
POCP [g C2H4-equiv./kWh]
Cumulative energydemand [GJ/kWh]
equi
val
ents
0,0
2,0
4,0
6,0
8,0
10,0
12,0
[%] n
orm
alis
ed
shar
e o
f wo
rld
imp
acts
OdehViebahnNeedsBest caseWorst case
Hard coalIGCC without CCS
1,3
0,08
1,5
0,28
0,010,010,01
0,09
0
0,2
0,4
0,6
0,8
1
1,2
GWP [kg CO2-equiv/kWh]
AP [g SO2-equiv./kWh]
EP [g PO43-equiv./kWh]
POCP [g C2H4-equiv./kWh]
Cumulative energydemand [GJ/kWh]
equ
ival
ents
0,0
0,2
0,4
0,6
0,8
1,0
1,2
1,4
1,6
[%] n
orm
alis
ed
shar
e of
wo
rld
imp
acts
Pehnt
Needs 2025
Best case
Worst case
Lignite
IGCC pre-combustion
2,1
0,7
3,52,4
0,2 0,30,50,3
-100
-80
-60
-40
-20
0
20
40
60
GWP AP EP POCP Cumulativeenergy demand
[%]
rela
tive
impa
cts
-10,0
-8,0
-6,0
-4,0
-2,0
0,0
2,0
4,0
6,0[%
] no
rmal
ised
sh
are
of
wor
ld
impa
cts
Odeh IGCCSelexol
Viebahn IGCCRectisol
Needs IGCC
Doctor IGCCwith CO2 sep.w/o H2prod.IEA 2006 IGCCMDEA
Best case
Worst case
Hard coal IGCC pre-combustion
0,20,10
0,42
0,01 0,010,10 0,02
0,2
-100
-80
-60
-40
-20
0
20
40
60
80
GWP AP EP POCP Cumulativeenergy demand
[%]
rela
tive
impa
cts
-1,0
-0,8
-0,6
-0,4
-0,2
0,0
0,2
0,4
0,6
0,8
[%]
norm
alis
ed s
hare
of
wor
impa
cts
Pehnt Rectisol
Needs
Best case
Worst case
Lignite
Figure 3: Environmental impacts of an integrated gasification system without capture (absolute) and relative impacts for plants with pre-combustion capture and normalised values related to the total world production in 2000 calculated for lowest and highest impact values
3.2. Natural Gas
For natural gas mostly post-combustion systems are investigated. Partly because of their high efficiency the GWP of natural gas fired power plants is much lower. While the power generation amounts to about half of the hard coal fuelled plants their share of the total GWP is less than a quarter (3.2 %, worst case). With CCS it comes down to 1.6 %. Again no coherent picture concerning the other impact categories emerges (figure 4) due to no common understanding of future technology parameters. The increase for AP, EP, POCP and CED is in the range between 15 % and 50 %, except for one study [13]. All normalised impacts are well below 1 % of the world total.
NGCC without CCS
2,3
0,17 0,17
3,2
0,59
0,05
0,280,15
0
0,1
0,2
0,3
0,4
0,5
0,6
GWP [kg CO2-equiv/kWh]
AP [g SO2-equiv./kWh]
EP [g PO43-equiv./kWh]
POCP [g C2H4-equiv./kWh]
Cumulative energydemand [GJ/kWh]
equ
ival
ent
s
0,0
0,5
1,0
1,5
2,0
2,5
3,0
3,5
[%] n
orm
alis
ed s
hare
of
wor
impa
cts
OdehViebahnSpathNeeds 2025ModahlBest caseWorst case
NGCC post-combustion MEA
0,6
1,6
0,740,58
0,060,22
0,27 0,18
-100
-50
0
50
100
150
GWP AP EP POCP Cumulativeenergy demand[%
] re
lativ
e im
pac
-1,2
-0,6
0,0
0,6
1,2
1,8
[%] n
orm
alis
ed
shar
e o
f wo
rld
imp
acts
Odeh
Viebahn
Spath
Needs
IEA 2006
Modahl
Best case
Worst case
Figure 4: Environmental impacts of a natural gas combined cycle without capture (absolute) and relative impacts for plants with post-combustion capture and normalised values related to the total world production in 2000 calculated for lowest and highest impact values
In summary for all fuel types and capture systems only GWP is a robust impact parameter for comparison of LCAs one with the other. For a reliable statement about their environmental impacts the number of studies for oxyfuel power plants, IGCC based on lignite and NGCC is too small.
4. Conclusions
It is difficult to obtain conclusive information about the environmental impacts of CCS technologies by comparing the studies. Also, it is impossible to describe all the underlying assumptions and data in a paper which would be necessary to understand all consequences of choices made. Though several studies exist, the technology
2454 J. Marx et al. / Energy Procedia 4 (2011) 2448–2456

8 Author name / Energy Procedia 00 (2010) 000–000
fi eld of CCS is so broad that as yet only some facets are covered. Nevertheless, with these few studies the sensitive parameters can already be identified:Efficiency and energy penalty
Efficiency and the energy penalty associated with the capture process and their development over time are very important parameters. The studies show no common understanding about how future technologies might look with or even without CCS. The effici ency varies from 37 % to 54 % for a hard coal system without CCS. The range in efficiencies of a lignite system and a natural gas system without CCS are 11 %points and 12 %points, respectively. Energy penalty ranges from 5 %points to 18 %points can be found looking across all capture technologies.Fuel
The studies outcomes are most sensitive to the fuel type, origin and composition. Without all background data it is not possible to answer, which part of the result is related to the technology and which is related to the fuel composition. For comparison of technologies the use of an identical fuel composition would be helpful but is unrealistic. It would thus be helpful always to present the underlying coal parameters.
5. Summary and Outlook
Although several studies have been performed in the last years, there is still not sufficient data to draw robust conclusions. The wide range of possible capture and storage technologies makes it difficult to perform a sufficient number of comparable studies. Especially for the oxyfuel process, but also for the pre-combustion route, the number of investigations must be increased substantially. There are some aspects where an advanced common understanding is necessary to draw a clearer picture. First of all it must be clear which type of technologies should be included into the technology comparison. New, second generation, technologies, such as chilled ammonia, membranes or others, should be covered also. However widening the portfolio of technologies to investigate will cause a great demand for new studies. To guarantee the comparability of the studies, it is helpful to have a set of benchmark information about technologies. A common understanding about efficiency and energy penalty now and in the future is one key parameter set needing better agreement. It would be helpful to present the underlying coal parameters, such as composition, heating value and transport distances.
There are some open methodological questions which will have to be solved including a) agreement on a more realistic leakage model, b) different CO2 qualities captured by different techniques, c) agreement about impact categories and their consideration in an appropriate regional context and d) a fair comparison of CCS with other GHG emission mitigation measures, particularly renewable energies, considering the different availability of 1 kWh of electricity produced by conventional and renewable energies.
References
[1] Marx J, Schreiber A, Zapp P, Haines M, Hake JFr, Gale J. Environmental evaluation of CCS using life cycle assessment (LCA). IEA Greenhouse Gas R&D Programme, Technical Report number 2010/TR2, May 2010
[2] Khoo H H. Life cycle investigation of CO2 recovery and sequestration. Environmental science and technology 2006, Vol. 40, no. 12, p. 4016-24.
[3] D`Addario E, Clerici G, Musicanti M, Pulvirenti G, Serenellini S, Valdiserri MG. Environmental analysis of different options of CO2 capture in power generation from natural gas. Greenhous Gas Control Technologies 2003, Vol. I, p. 63-8, In: Gale J, Kaya Y. Elsevier Science Ltd.
[4] Muramatsu E, Iijima M. Life cycle assessment for CO2 capture technology from exhaust gas of coal power plant. The 6th Greenhouse Gas Control Technologies 2002, Kyoto, Japan, October 1-4.
[5] Bauer C, Heck T, Dones R, Mayer-Spohn O, Blesl M. NEEDS (New Energy Externalities Developments for Sustainability). Final report on technical data, costs, and life cycle inventories of advanced fossil power generation systems. Paul Scherrer Institut (PSI) und Institut für Energiewirtschaft und Rationelle Energieanwendung, Univ. Stuttgart (IER), 2009.
[6] Pehnt M, Henkel J. Life cycle assessment of carbon dioxide capture and storage from lignite power plants. Int. J Greenhouse Gas Control 2008, Vol. 3, no. 1, p. 49-66.
[7] Viebahn P, Nitsch J, Fischedick M, Esken A, Pastowski A, Schuwer D. et al. RECCS Strukturell-ökonomisch-ökologischer Vergleich regenerativer Energietechnologien (RE) mit Carbon Capture and Storage (CCS). Langfassung, Bundesministerium für Umwelt, Naturschutz und Reaktorsicherheit (BMU), Dec. 2007.
[8] Doctor RD, Molburg JC, Brockmeier NF, Lynn M, Victor G, Massood R. et al. Life-Cycle Analysis of a Shell Gasification-Based Multi-Product System with CO2 Recovery. Proceedings of the First National Conference on Carbon Sequestration, Washington, D.C., USA, 2001.
[9] IEA Greenhouse Gas R&D Programme (IEA GHG): Environmental Impact of Solvent Scrubbing of CO2. 2006/14. IEA GHG, October 2006.
J. Marx et al. / Energy Procedia 4 (2011) 2448–2456 2455

Author name / Energy Procedia 00 (2010) 000–000 9
[10] Lombardi L. Life cycle assessment comparison of technical solutions for CO2 emission reduction in power generation. Energy Conversion and Management 2003, Vol. 44, no. 1, p.93-108.
[11] Odeh NA, Cockerill TT. Life cycle GHG assessment of fossil fuel power plants with carbon capture and storage. Energy Policy 2008, Vol. 36, no. 1, p. 367-80.
[12] Schreiber A, Zapp P, Kuckshinrichs W. Environmental Assessment of German Electricity Production from Coal-fired Power Plants with Amine-based Carbon Capture. Int. J Life Cycle Assessment 2009, Vol. 14, p. 547-59.
[13] Modahl IS, Nyland CA, Raadal HL, Karstad O, Torp TA, Hagemann R. LCA as an ecodesign tool for production of electricity, including carbon capture and storage – a study of a gas power plant case with post-combustion CO2 capture at Tjeldbergodden. Proceedings of the Conference: Joint actions on climate change, Aalborg, Den, June 2009.
[14] Spath P, Mann M. Biomass power and conventional fossil systems with and without CO2 sequestration comparing the energy balance, greenhouse gas emissions and economics. National Renewable Energy Laboratory. Golden, Colorado Report no. BB04.4010, 2004.
[15] Doosan Babcock Energy. Oxyfuel Combustion R&D Activities. APGTF Workshop on Carbon Abatement Technologies-Development and Implementation of Future UK Strategy, London, UK, Feb. 2009.
[16] Wildbolz C. Life cycle assessment of selected technologies for CO2 transport and sequestration. Diploma Thesis No. 2007MSO5, Swiss Federal Institute of Technology Zurich.
[17] Korre A, Nie Z, Durucan S. Life cycle modelling of fossil fuel power generation with post combustion. Proceedings of the 9th international conference on Greenhouse Gas Control Technologies, Washington, US, Energy Procedia 1 2009, p. 3771 –8 .
[18] ISO 14040/14044. Environmental management - Life cycle assessment - Principles and framework, - Requirements and guidelines. Deutsches Institut für Normung e. V., 2006.
[19] Posch M, Seppälä J, Hetterlingh JP, Johansson M, Margni M, Jolliet O. The role of atmospheric dispersion models and ecosystem sensitivity in the determination of characterisation factors for acidifying and eutrophying emissions in LCIA. Int J Life Cycle Assessment 2008, Vol. 13, no. 6, p. 477–86.
[20] Seppälä J, Posch M, Johansson M, Hettelingh JP. Country -dependent characterisation factors for acidification and terrestrial eutrophication based on accumulated exceedance as an impact category indicator. Int. J Life Cycle Assessment 2006, Vol. 11, p. 403-46.
[21] Koornneef J, van Keulen T, Faaij A, Turkenburg W. Life cycle assessment of a pulverized coal power plant with post-combustion capture, transport and storage of CO2. Int J Greenhouse Gas Control 2008, Vol. 2, no. 4, p. 448-67.
[22] Guinée, J., et al. Handbook on Life Cycle Assessment: Operational Guide to the ISO Standards. Kluwer Academic Publishers, Dordrecht, 2002.
[23] OECD/IEA World Energy Outlook. OECD/IEA, Paris, 2002, www.energyoutlook.org.
2456 J. Marx et al. / Energy Procedia 4 (2011) 2448–2456