environmental change in barrow, alaska, resulting ... · environmental change in barrow, alaska,...
TRANSCRIPT
meltdate meltdate
meltdate
α<0.70
α<0.70
heatwave
early thaw
snow-in
snow-in
zero curtain
zero curtain
ALD≈66cm
ALD≈60cm
Environmental Change in Barrow, Alaska, Resulting from a 2015 Record Heat WaveDiane Stanitski1, Robert Stone2, Christopher Cox3,4, Geoff Dutton1, Colm Sweeney3, George Divoky5, David Douglas6
1NOAA Earth System Research Laboratory Global Monitoring Division, Boulder, CO; 2Science and Technology Corporation (STC), Boulder, CO; 3Cooperative Institute for Research in Environmental Sciences (CIRES); 4NOAA Earth System Research Laboratory Physical Sciences Division, Boulder, CO; 5Friends of Cooper Island, Barrow, AK; 6Alaska Science Center, Juneau, AK
• The 2015 melt at BRW was very early due mainly to an unusually intense heat wave affecting all of Alaska; this occurred despite above average snow accumulation the previous winter. The May 2015 average temperature set a 90+ year record high.
• Abnormal warmth of the North Pacific and a perturbed jet stream underlie the heat wave and advection of warm air into the Arctic.
• Bird and animal habitats were perturbed by the early melt and biogeochemical cycles were influenced by snow cover and soil temperature.
• Sea ice offshore AK retreated early and farther north due to anomalous warmth, and a local lagoon experienced a record early melt as well.
• BRW permafrost temperatures were warmer than three previous years and the 2015 active layer was deeper by about 6 cm compared with 2014, which may have enhanced the release of methane.
• The surface radiation budget and T-regime were both perturbed. • The primary driver for the anomalous conditions in BRW in 2015 was
atmospheric circulation, affecting many independent variables (e.g., meteorological, radiative, ecological, biogeochemical).
Acknowledgments: The authors appreciate the contributions of Matthew Martinsen, Ross Burgener, and Bryan Thomas for their data collection efforts at BRW, Craig George for sharing his Isaktoak Lake data, and Dave Longenecker for assistance with data processing and archival. This work was supported by the NOAA Climate Program Office and Global Monitoring Division.
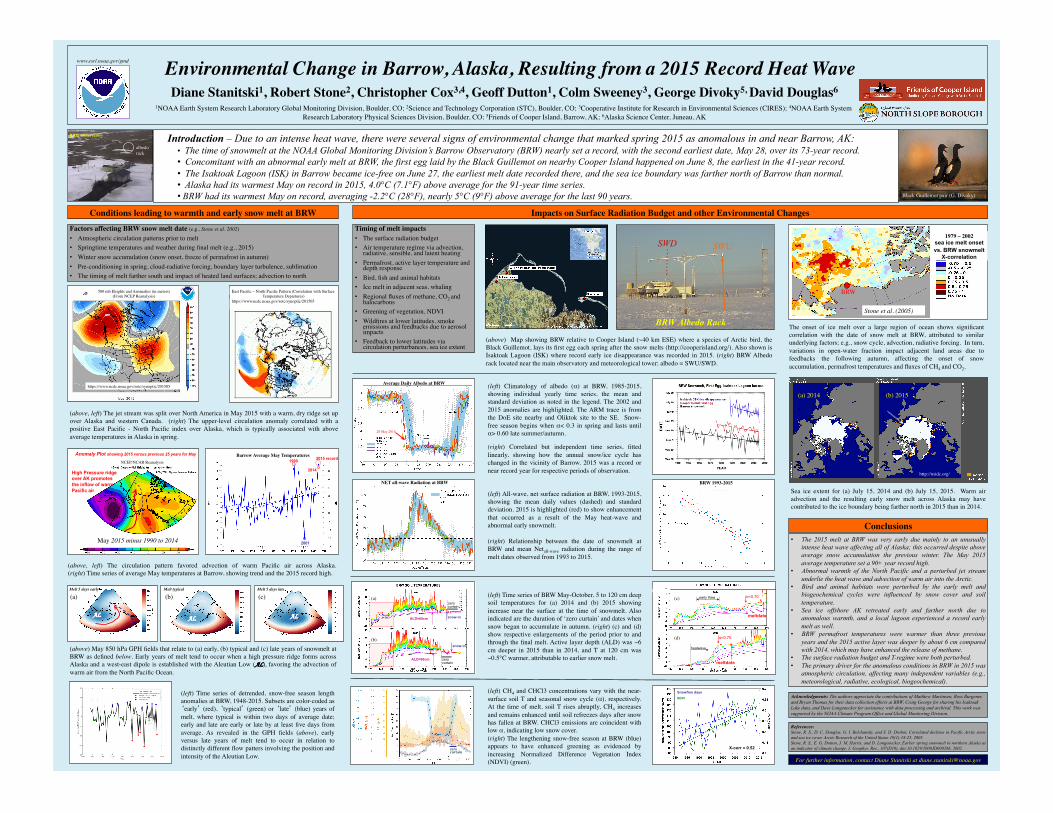
Introduction – Due to an intense heat wave, there were several signs of environmental change that marked spring 2015 as anomalous in and near Barrow, AK: • The time of snowmelt at the NOAA Global Monitoring Division’s Barrow Observatory (BRW) nearly set a record, with the second earliest date, May 28, over its 73-year record. • Concomitant with an abnormal early melt at BRW, the first egg laid by the Black Guillemot on nearby Cooper Island happened on June 8, the earliest in the 41-year record. • The Isaktoak Lagoon (ISK) in Barrow became ice-free on June 27, the earliest melt date recorded there, and the sea ice boundary was farther north of Barrow than normal. • Alaska had its warmest May on record in 2015, 4.0°C (7.1°F) above average for the 91-year time series. • BRW had its warmest May on record, averaging -2.2°C (28°F), nearly 5°C (9°F) above average for the last 90 years.
BRW Albedo Rack
SWU SWD
www.esrl.noaa.gov/gmd
References: Stone, R. S., D. C. Douglas, G. I. Belchansky, and S. D. Drobot, Correlated declines in Pacific Arctic snow and sea ice cover. Arctic Research of the United States 19(1):18-25, 2005. Stone, R. S., E. G. Dutton, J. M. Harris, and D. Longenecker, Earlier spring snowmelt in northern Alaska as an indicator of climate change, J. Geophys. Res., 107(D10), doi:10.1029/2000JD000286, 2002.
Anomaly Plot showing 2015 versus previous 25 years for May
High Pressure ridge over AK promotes the inflow of warm Pacific air
For further information, contact Diane Stanitski at [email protected]
Conditions leading to warmth and early snow melt at BRW Impacts on Surface Radiation Budget and other Environmental Changes
Conclusions
(above) Map showing BRW relative to Cooper Island (~40 km ESE) where a species of Arctic bird, the Black Guillemot, lays its first egg each spring after the snow melts (http://cooperisland.org/). Also shown is Isaktoak Lagoon (ISK) where record early ice disappearance was recorded in 2015. (right) BRW Albedo rack located near the main observatory and meteorological tower; albedo = SWU/SWD.
Factors affecting BRW snow melt date (e.g., Stone et al. 2002)
• Atmospheric circulation patterns prior to melt• Springtime temperatures and weather during final melt (e.g., 2015)• Winter snow accumulation (snow onset, freeze of permafrost in autumn)• Pre-conditioning in spring, cloud-radiative forcing, boundary layer turbulence, sublimation• The timing of melt farther south and impact of heated land surfaces; advection to north
(above, left) The jet stream was split over North America in May 2015 with a warm, dry ridge set up over Alaska and western Canada. (right) The upper-level circulation anomaly correlated with a positive East Pacific - North Pacific index over Alaska, which is typically associated with above average temperatures in Alaska in spring.
(above, left) The circulation pattern favored advection of warm Pacific air across Alaska. (right) Time series of average May temperatures at Barrow, showing trend and the 2015 record high.
East Pacific – North Pacific Pattern (Correlation with Surface Temperature Departures)
https://www.ncdc.noaa.gov/sotc/synoptic/201505
(left) Climatology of albedo (α) at BRW, 1985-2015, showing individual yearly time series, the mean and standard deviation as noted in the legend. The 2002 and 2015 anomalies are highlighted. The ARM trace is from the DoE site nearby and Oliktok site to the SE. Snow-free season begins when α< 0.3 in spring and lasts until α> 0.60 late summer/autumn.
(right) Correlated but independent time series, fitted linearly, showing how the annual snow/ice cycle has changed in the vicinity of Barrow. 2015 was a record or near record year for respective periods of observation.
Black Guillemot pair (G. Divoky)
BRW Observatory
Timing of melt impacts• The surface radiation budget• Air temperature regime via advection,
radiative, sensible, and latent heating• Permafrost, active layer temperature and
depth response• Bird, fish and animal habitats• Ice melt in adjacent seas, whaling• Regional fluxes of methane, CO2 and
halocarbons• Greening of vegetation, NDVI• Wildfires at lower latitudes, smoke
emissions and feedbacks due to aerosol impacts
• Feedback to lower latitudes via circulation perturbances, sea ice extent
500 mb Heights and Anomalies (in meters)(From NCEP Reanalysis)
Barrow 1993-2015
https://www.ncdc.noaa.gov/sotc/synoptic/201505
2015 record
2014
1990
2001
NCEP/NCAR Reanalysis
(above) May 850 hPa GPH fields that relate to (a) early, (b) typical and (c) late years of snowmelt at BRW as defined below. Early years of melt tend to occur when a high pressure ridge forms across Alaska and a west-east dipole is established with the Aleutian Low (AL), favoring the advection of warm air from the North Pacific Ocean.
Melt 5 days early
(a) (b)Melt typical
(c)Melt 5 days late
May 2015 minus 1990 to 2014
(left) Time series of detrended, snow-free season length anomalies at BRW, 1948-2015. Subsets are color-coded as ‘early’ (red), ‘typical’ (green) or ‘late’ (blue) years of melt, where typical is within two days of average date; early and late are early or late by at least five days from average. As revealed in the GPH fields (above), early versus late years of melt tend to occur in relation to distinctly different flow patters involving the position and intensity of the Aleutian Low.
AL AL
(left) All-wave, net surface radiation at BRW, 1993-2015, showing the mean daily values (dashed) and standard deviation. 2015 is highlighted (red) to show enhancement that occurred as a result of the May heat-wave and abnormal early snowmelt.
(right) Relationship between the date of snowmelt at BRW and mean Netall-wave radiation during the range of melt dates observed from 1993 to 2015.
(a)
(b)
(left) Time series of BRW May-October, 5 to 120 cm deep soil temperatures for (a) 2014 and (b) 2015 showing increase near the surface at the time of snowmelt. Also indicated are the duration of ‘zero curtain’ and dates when snow began to accumulate in autumn. (right) (c) and (d) show respective enlargements of the period prior to and through the final melt. Active layer depth (ALD) was ~6 cm deeper in 2015 than in 2014, and T at 120 cm was ~0.5°C warmer, attributable to earlier snow melt.
(left) CH4 and CHCl3 concentrations vary with the near-surface soil T and seasonal snow cycle (α), respectively. At the time of melt, soil T rises abruptly, CH4 increases and remains enhanced until soil refreezes days after snow has fallen at BRW. CHCl3 emissions are coincident with low α, indicating low snow cover.(right) The lengthening snow-free season at BRW (blue) appears to have enhanced greening as evidenced by increasing Normalized Difference Vegetation Index (NDVI) (green).
Sea ice extent for (a) July 15, 2014 and (b) July 15, 2015. Warm air advection and the resulting early snow melt across Alaska may have contributed to the ice boundary being farther north in 2015 than in 2014.
(a) 2014 (b) 2015
albedo rack
meltdate meltdate
meltdate
α<0.70
α<0.70
heatwave
early thaw
snow-in
snow-in
zero curtain
zero curtain
ALD≈66cm
ALD≈60cm
meltdate meltdate
meltdate
α<0.70
α<0.70
heatwave
early thaw
snow-in
snow-in
zero curtain
zero curtain
ALD≈66cm
ALD≈60cm
(c)
(d)
BRW 1993-2015
Barrow Average May Temperatures
The onset of ice melt over a large region of ocean shows significant correlation with the date of snow melt at BRW, attributed to similar underlying factors; e.g., snow cycle, advection, radiative forcing. In turn, variations in open-water fraction impact adjacent land areas due to feedbacks the following autumn, affecting the onset of snow accumulation, permafrost temperatures and fluxes of CH4 and CO2.
1979 – 2002 sea ice melt onset vs. BRW snowmelt
X-correlation
BRW
Stone et al. (2005)
AL
http://nsidc.org/
Snowfree days
NDVI
X-corr = 0.52 zero curtain
Average Daily Albedo at BRW
28 May 2015
NET all-wave Radiation at BRW