environmental and social impacts of oil palm plantation and their implications for biofuel...
TRANSCRIPT
Copyright © 2012 by the author(s). Published here under license by the Resilience Alliance.Obidzinski, K., R. Andriani, H. Komarudin, and A. Andrianto. 2012. Environmental and social impacts ofoil palm plantations and their implications for biofuel production in Indonesia. Ecology and Society 17(1):25.http://dx.doi.org/10.5751/ES-04775-170125
Research, part of a Special Feature on Local, Social, and Environmental Impacts of Biofuels
Environmental and Social Impacts of Oil Palm Plantations and theirImplications for Biofuel Production in IndonesiaKrystof Obidzinski 1, Rubeta Andriani 1, Heru Komarudin 1, and Agus Andrianto 1
ABSTRACT. This paper reviews the development of oil palm with linkages to biofuel in Indonesia and analyzes the associatedenvironmental and socioeconomic impacts. We selected three plantation study sites in West Papua (Manokwari), WestKalimantan (Kubu Raya), and Papua (Boven Digoel) to assess the impacts. Research findings indicate that the development ofoil palm in all three sites has caused deforestation, resulting in significant secondary external impacts such as water pollution,soil erosion, and air pollution. In terms of social impacts, many stakeholder groups, i.e., employees, out-growers, and investinghouseholds, report significant gains. However, we found these benefits were not evenly distributed. Other stakeholders,particularly traditional landowners, experienced restrictions on traditional land use rights and land losses. We observed increasingland scarcity, rising land prices, and conflicts over land in all sites. Three major trade-offs are associated with the developmentof oil palm plantations, including those related to biofuels: unevenly distributed economic benefits are generated at the cost ofsignificant environmental losses; there are some winners but also many losers; and economic gains accrue at the expense ofweak rule of law. To reduce the negative impacts and trade-offs of oil palm plantations and maximize their economic potential,government decision makers need to restrict the use of forested land for plantation development, enforce existing regulationson concession allocation and environmental management, improve monitoring of labor practices, recognize traditional land userights, and make land transfer agreements involving customary land more transparent and legally binding.
Key Words: biofuels, environmental impacts, oil palm, socioeconomic benefits
INTRODUCTIONIn recent years, many countries around the world have beentapping renewable resources to secure stable sources ofenergy. This tendency has been spurred by high fossil fuelprices, rising demand for energy, and increasing concernsabout the implications of fossil fuels on global climate (FAO2008a). The European Union (EU) and United States ofAmerica (USA) are currently the leading markets for, andproducers of, biofuels, but Brazil and the emergent economiesof China and India are not far behind (Emerging MarketsOnline 2008, Biodiesel Magazine Editorial Staff 2010). Thegrowth in biofuels has been achieved primarily by introducingfuel-blending obligations and government subsidies (FAO2008b). Over the past two years, following the initialexcitement over biofuels’ potential as a clean source of energy,increasing concerns have emerged regarding the potentialenvironmental and socioeconomic costs of large-scale biofuelfeedstock cultivation, especially in developing countries(Cotula et al. 2008, Danielsen et al. 2008, Sheil et al. 2009,Gibbs et al. 2010). As a result, some major markets, such asthose in the EU, have adopted production and trade safeguards,e.g., Renewable Energy Directive (RED), that require biofuelsconsumed in the EU to meet defined sustainability standards,regardless of their origin (EU 2006, Ismail and Rossi 2010).
Indonesia is potentially a key supplier of biofuels, especiallyoil palm-based biodiesel, to world markets. In 2006, thecountry had 4.1 million ha of oil palm plantation, 31% of theworld total (Koh and Wilcove 2008). By 2010, the plantation
area increased to about 7.2 million ha of oil palm, whichaccounted for 46% of the world’s crude palm oil (CPO; FAO2008a, Bromokusumo 2009, Bromokusumo and Slette 2010,Teoh 2010).
Currently, Malaysia is the regional leader in biodieselproduction with an output of 540 million liters per annum asof 2009 (Teoh 2010). Indonesia is second with the productionof 400 million liters in 2010 (Slette and Wiyono 2011). By2019, Indonesia and Malaysia are forecast to nearly doubletheir production of biodiesel, respectively (FAO 2008a, Hoh2009, FAPRI 2010). By 2025, it is forecast that biodiesel,mostly from CPO, and other biofuels will constitute 25% ofIndonesia’s national energy mix (Timnas BBN 2007).
Biofuels have increasingly attracted the Indonesiangovernment’s interest because of their potential to reduce thecountry’s reliance on imported fossil fuels (Dillon et al. 2008).As a result, in 2006, the government made use of biofuels fortransport mandatory and established blending targets at 5% in2006, 10% in 2010, and increasing to 25% by 2025. In early2007, the government announced that 60 biofuel projectsworth about US$12 billion would be developed (BusinessWire 2007). However, few of these investments have beenimplemented; the global financial crisis of 2008 and risingCPO prices made biofuels too costly and uncompetitive vis-à-vis fossil fuels. This caused biofuel refineries that had justcommenced operations to reduce production or closeindefinitely (Lacey 2009).
1Center for International Forestry Research (CIFOR)
Ecology and Society 17(1): 25http://www.ecologyandsociety.org/vol17/iss1/art25/
In late 2009 and 2010, as international economic conditionsimproved, the biofuel sector showed signs of revival. At thesame time, country-level policies in Indonesia movedincreasingly toward securing and sustaining the growth ofbiofuels by supporting large-scale plantation investments andprioritizing the development of biofuels on marginal or “idle”land (Hallam 2009). Between 2010 and 2020, experts expectbetween three and seven million ha of new oil palm plantationswill be developed for food and biofuel (Gingold 2010). Someestimates run as high as 20 million ha based on the concessionpermits issued at various administrative levels in Indonesia.Historically, however, only one-third of allocated oil palmplantation concessions has actually been developed becauseof the high-risk business environment (Slette and Wiyono2011).
Expansion plans for oil palm plantations in Indonesia havebecome the subject of political and environmental debates.Some see oil palm as a commodity playing an important rolein mitigating climate change, providing alternative sources ofenergy, and contributing to economic development and rurallivelihoods (Basiron 2007; Y. Basiron, unpublishedmanuscript). Others are concerned about potentially seriousunintended social, economic, and environment implications(Fitzherbert et al. 2008, ICTSD 2008, Marti 2008, Bringezuet al. 2009, Sheil et al. 2009, Sirait 2009, Colchester 2010,FoE 2010).
This ongoing debate is important, and will likely determinethe future of first-generation biofuels. Arguments in favor andagainst oil palm and biofuels are based on sectoral andinstitutional interests and also on different, often superficial,methods to assess the benefits or costs of oil palm. Using asystematic and empirical approach to shed light on the localsocial, economic, and environmental impacts of oil palmdevelopment in Indonesia, we seek to inform the ongoingdebate. We examine oil palm plantations supporting biofuelproduction or undergoing expansion or acquisition processesassociated with bioenergy. We also analyze the impacts of oilpalm plantation development and highlight the potentialimplications of CPO-based biofuels in three sites, one in WestKalimantan with an established tradition of oil palmcultivation, and two in Papua and West Papua provinces withmore recent operations. The impact assessment focuses onlandowners, customary users, investing households,employees, and affected neighbors.
OVERVIEW OF OIL PALM AND BIOFUELDEVELOPMENT IN INDONESIA: PROGRESS ANDISSUES
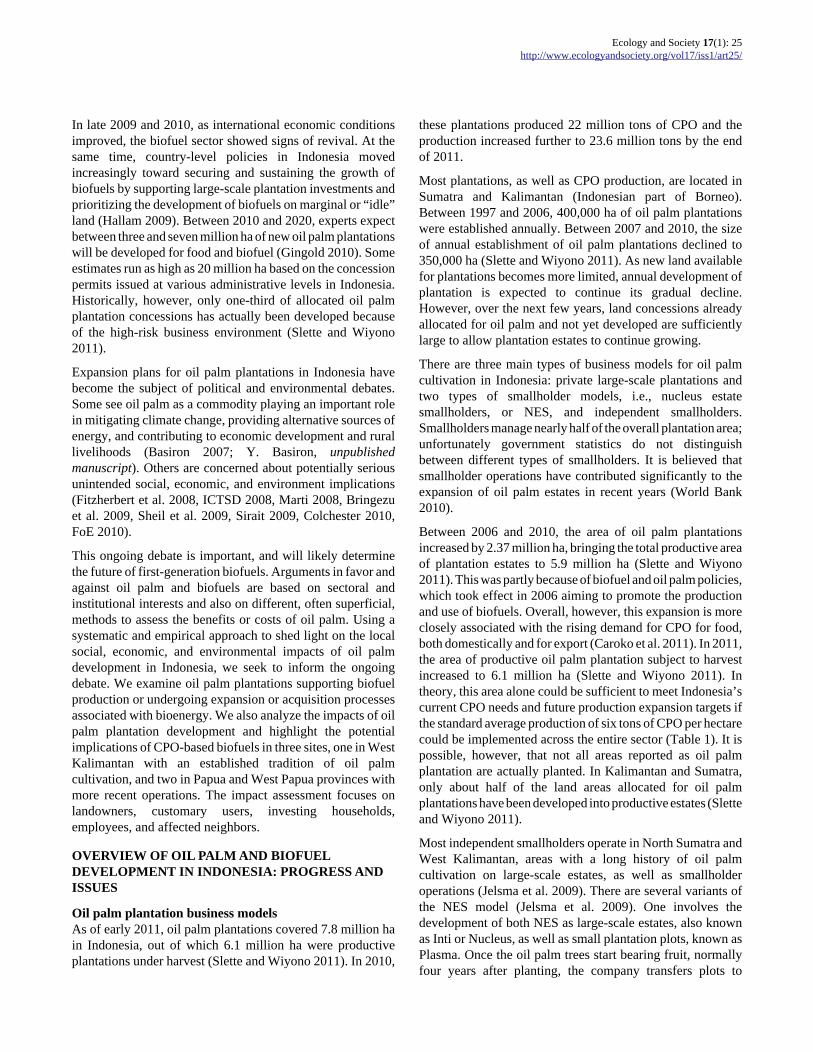
Oil palm plantation business modelsAs of early 2011, oil palm plantations covered 7.8 million hain Indonesia, out of which 6.1 million ha were productiveplantations under harvest (Slette and Wiyono 2011). In 2010,
these plantations produced 22 million tons of CPO and theproduction increased further to 23.6 million tons by the endof 2011.
Most plantations, as well as CPO production, are located inSumatra and Kalimantan (Indonesian part of Borneo).Between 1997 and 2006, 400,000 ha of oil palm plantationswere established annually. Between 2007 and 2010, the sizeof annual establishment of oil palm plantations declined to350,000 ha (Slette and Wiyono 2011). As new land availablefor plantations becomes more limited, annual development ofplantation is expected to continue its gradual decline.However, over the next few years, land concessions alreadyallocated for oil palm and not yet developed are sufficientlylarge to allow plantation estates to continue growing.
There are three main types of business models for oil palmcultivation in Indonesia: private large-scale plantations andtwo types of smallholder models, i.e., nucleus estatesmallholders, or NES, and independent smallholders.Smallholders manage nearly half of the overall plantation area;unfortunately government statistics do not distinguishbetween different types of smallholders. It is believed thatsmallholder operations have contributed significantly to theexpansion of oil palm estates in recent years (World Bank2010).
Between 2006 and 2010, the area of oil palm plantationsincreased by 2.37 million ha, bringing the total productive areaof plantation estates to 5.9 million ha (Slette and Wiyono2011). This was partly because of biofuel and oil palm policies,which took effect in 2006 aiming to promote the productionand use of biofuels. Overall, however, this expansion is moreclosely associated with the rising demand for CPO for food,both domestically and for export (Caroko et al. 2011). In 2011,the area of productive oil palm plantation subject to harvestincreased to 6.1 million ha (Slette and Wiyono 2011). Intheory, this area alone could be sufficient to meet Indonesia’scurrent CPO needs and future production expansion targets ifthe standard average production of six tons of CPO per hectarecould be implemented across the entire sector (Table 1). It ispossible, however, that not all areas reported as oil palmplantation are actually planted. In Kalimantan and Sumatra,only about half of the land areas allocated for oil palmplantations have been developed into productive estates (Sletteand Wiyono 2011).
Most independent smallholders operate in North Sumatra andWest Kalimantan, areas with a long history of oil palmcultivation on large-scale estates, as well as smallholderoperations (Jelsma et al. 2009). There are several variants ofthe NES model (Jelsma et al. 2009). One involves thedevelopment of both NES as large-scale estates, also knownas Inti or Nucleus, as well as small plantation plots, known asPlasma. Once the oil palm trees start bearing fruit, normallyfour years after planting, the company transfers plots to
Ecology and Society 17(1): 25http://www.ecologyandsociety.org/vol17/iss1/art25/
smallholders who then deliver fruits to company mills atagreed upon prices.
Table 1. Oil palm area and palm oil production 1970-2010.
Palm oil area(million of hectares)
Palm oil production(million of tons)
Year Small-holders
Stateowned
Privateestates
Total Small-holders
Stateowned
Privateestates
Total
1970 - 0.09 0.05 0.13 - 0.15 0.07 0.221980 0.01 0.20 0.09 0.29 0.00 0.50 0.22 0.721990 0.29 0.37 0.46 1.13 0.38 1.25 0.79 2.412000 1.17 0.59 2.40 4.16 1.91 1.46 3.63 7.002005 2.36 0.53 2.57 5.45 4.50 1.45 5.91 11.862010 3.31 0.62 3.89 7.82 7.77 2.09 9.98 19.84
Source: Modified from Ministry of Agriculture (2011)
Sometimes smallholder oil palm planting is connected totransmigration programs, which used to stimulate economicdevelopment in remote areas (PIR transmigrasi or NEStransmigration). In this case, a plantation developer plants oilpalm on the land belonging to transmigration settlers (2 ha perfamily) and sells the produce to the plantation company at thespecified price. A more refined version of PIR transmigrasi isPIR KKPA (Kredit Koperasi Primer untuk Anggota, or basiccooperative credit), under which transmigrants can obtainsubsidized bank loans (Potter and Lee 1998).
Slow growth of biofuelsSince 2006, biofuels have increasingly attracted theIndonesian government’s interest because of their potential toreduce the country’s reliance on fossil fuels (BeyondPetroleum 2010). Because Indonesia has long been dependenton fossil-fuel energy for revenues and to finance development,it has become increasingly urgent to conserve remaining oilreserves and look for alternative sources of energy. In 2005,revenue from the oil and gas sector was about US$19.2 billion(24% of Indonesia’s GDP). However, production levels ofIndonesian oil have declined over the past decade whileconsumption has increased. In 2004, Indonesia became a netimporter of oil (Beaton and Lontoh 2010).
The cost of extensive subsidies on fossil fuel products has beena related concern (Dillon et al. 2008). These subsidies areparticularly burdensome because they consume large financialresources that could have been used more effectively fordevelopment or other national needs (Beaton and Lontoh2010). In 2010, the government allocated US$21.9 billion forfuel subsidies; this was about 15% of total governmentspending that year and thus continues to place a significantstrain on the state budget (Kaiser 2011). Consequently,government policy makers have been eager to find ways toreduce these costs; biofuels appeared as a strategy of choice.
As part of the 2006 National Energy Policy, the Ministry ofEnergy set guidelines for the mandatory use of biodiesel by
heavy industries, as well as blending targets. The governmenthas actively encouraged investors to apply for land andindustrial licenses. It was expected that by 2010, the biofuelindustry would have created 3.6 million jobs in rural areas andhelped reduce poverty by 16% (Ministry of Energy andMineral Resources 2006, Dillon et al. 2008, Oxfam 2008, Sheilet al. 2009).
These targets have clearly not been reached. In 2010, biodieselproduction of 400,000 kiloliters required about 410,000 metrictons (MT) of CPO (Slette and Wiyono 2011); this requiredapproximately 100,000 ha of oil palm plantations. A plantationarea of this size would employ between 10,000 and 20,000workers (Sandker et al. 2007), far below official expectations.
In 2007, the first year that Indonesia’s biofuel policy went intoeffect, investment in the biofuel sector was initially significant.In addition to private sector actors, banks and governmentinstitutions supported the growth (Ministry of Energy andMineral Resources 2006). However, in late 2007, theIndonesian Association of Biofuel Producers (APROBI)reported that 17 biodiesel companies had reduced productionor temporarily suspended operations. In 2008, only five millswere operating, which caused biodiesel production to fall by60% (A. Sugiyono, unpublished manuscript). The decline wascaused by the drop in price of fossil fuels on the internationalmarket and the spike in the price of the main biofuel feedstock(crude palm oil, CPO), which made CPO-based biofuelsuncompetitive. The price of CPO on international markets isvariable, but has recently been rising. In March 2008, it peakedat US$1410 per ton. Throughout 2011, it hovered at aroundUS$1000 per ton.
There are other constraints on CPO-based biofueldevelopment in Indonesia as well. Oil palm companies tendto sell most of their CPO production to domestic and foreignfood markets, which offer best prices and the most buyers.About 25.7% of Indonesia’s annual CPO production isconsumed as cooking oil and other edible fats; about 73% isexported, mostly for food; and only 1.3% is used for biofuels.
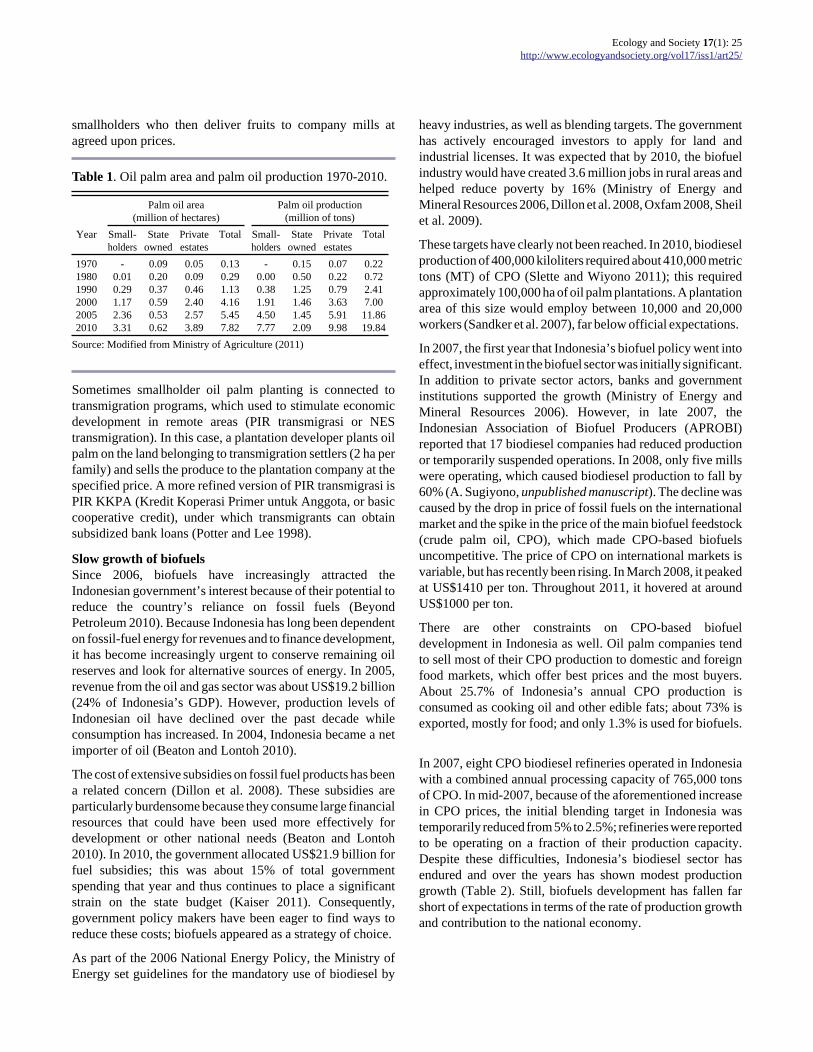
In 2007, eight CPO biodiesel refineries operated in Indonesiawith a combined annual processing capacity of 765,000 tonsof CPO. In mid-2007, because of the aforementioned increasein CPO prices, the initial blending target in Indonesia wastemporarily reduced from 5% to 2.5%; refineries were reportedto be operating on a fraction of their production capacity.Despite these difficulties, Indonesia’s biodiesel sector hasendured and over the years has shown modest productiongrowth (Table 2). Still, biofuels development has fallen farshort of expectations in terms of the rate of production growthand contribution to the national economy.
Ecology and Society 17(1): 25http://www.ecologyandsociety.org/vol17/iss1/art25/
Table 2. Indonesian biodiesel production and the use of palmoil. CPO = crude palm oil.
2006 2007 2008 2009 2010 2011Production (kiloliter)
24,000 35,000 110,000 350,000 400,000 400,000CPO requirement (metric tons)
25,000 36,000 113,000 360,000 410,000 410,000Note: adapted from Slette and Wiyono (2011)
Social implicationsIt is generally accepted that oil palm plantations are animportant driver of economic development in Indonesiabecause they contribute to state revenues and provideemployment in rural areas (Basiron 2007, Bunyamin 2008,Feintrenie et al. 2010). In a study assessing the impacts of thenucleus model of oil palm plantations in West Kalimantan,Bunyamin (2008) found a steady increase in the sector’scontribution to provincial GDP and farmer incomes. Otherstudies also indicate economic benefits for smallholders inIndonesia (Feintrenie et al. 2010). However, because oil palmcultivation requires a significant investment and a certainamount of experience, these benefits seem to accrue to thoseabove a certain threshold of agricultural skill and income.Thus, oil palm development in Kalimantan is likely to benefitmigrant smallholders with prior exposure to oil palm morethan indigenous people with no prior experience, such asnative Papuans (A. Hadianto, F. Kesaulija, personalcommunications).
In some cases, oil palm can also be detrimental to locallivelihoods (L. Potter, unpublished manuscript). Orth (2007)shows that oil palm development in Central Kalimantan hasadversely affected the shifting cultivation practices of the localDayak communities, causing food insecurity. Oil palmplantations, especially large-scale estates, have frequentlybeen associated with negative social impacts on ruralcommunities and indigenous people (Telapak 2000, Marti2008, Sirait 2009, FoE 2010). Although oil palm frequentlyappears to improve income, it affects social relations and landownership in rural areas in ways that may ultimately workagainst the well-being of poor people (McCarthy 2010). Marti(2008) found many cases of human rights abuse by plantationcompanies, especially during land acquisition and plantationdevelopment. Other studies indicate that most conflictsbetween plantation developers and communities occurbecause of lack of recognition of customary rights, breachedagreements, and disregard for the environment (Casson 2002,Colchester et al. 2006, Sawit Watch 2006, as cited in Downto Earth 2007; L. Potter, unpublished manuscript). Colchester(2010) reports that in 2010 no fewer than 630 land disputesbetween palm oil companies and local communities had takenplace in Indonesia.
Environmental concernsDeforestation is one of the key issues faced by the oil palmindustry, especially in Indonesia where lowland rainforestscontain high levels of biodiversity, and peat lands are hometo globally significant carbon reserves. Although it is generallyagreed that oil palm plantations have resulted in deforestationin Indonesia (Zakaria et al. 2007, Ministry of Environment2009, Gibbs et al. 2010), the actual extent, and whether oilpalm has been the prime driver, is subject to debate. Forexample, the Indonesian Oil Palm Research Institute (IOPRI)claims that only 3% of all oil palm plantations have beenestablished in primary forests, whereas 63% have beendeveloped in secondary forests and scrubland (IFCA 2008).Casson (2000) shows that, between 1982 and 1999, about sixmillion ha of forestland were converted into oil palmplantations. Using the ratio of biofuel production to total oilproduction, industry insiders indicate that biofuels currentlyaccount for approximately 6.5% (some 65,000 ha) of annualdeforestation in Indonesia (Y. Gao, personal communication).
In 2008, based on official government statistics, around 22.7million ha of forestlands were available for conversion underthe Hutan Produksi Konversi (HPK) forest land category, i.e.,forest zone allocated for conversion to nonforestry purposes.By 2010, about 11 million ha of land were allocated for oilpalm plantations on the islands of Sumatra and Kalimantan(Slette and Wiyono 2011). Only half of this area has beendeveloped into productive plantation estates. However, largeareas of forest seem to have been cleared but not planted. Thisreflects a trend in the plantations sector in Indonesia to targetforested areas for conversion; the sector generates profits fromtimber either as an end in itself or as a means to generateadditional capital for plantation development (Casson et al.2007, Sheil et al. 2009). Some companies have cleared forest,but eventually ceased operations because of conflicts withlocal communities. However, others have simply not beenmanaged well and either stagnated or went bankrupt.
The conversion of natural forests for oil palm plantations hasbeen associated with the loss of biodiversity, including adecline in populations of iconic species such as Orangutan(Genus Pongo) and the Sumatran Tiger (Panthera tigrissumatrae; Brown and Jacobson 2005, Yaap et al. 2010). Oilpalm is considered a relatively poor replacement for naturaltropical forest. Recent studies indicate that it ranks behindplanted forest, agroforest, and community woodlots in termsof the number of species it can support (Fitzherbert et al. 2008).
Forest conversion and plantation development as currentlypracticed are also significant sources of GHG emissions.Deforestation and land conversion contribute 15% to 25% ofglobal carbon emissions. Converting lowland tropicalrainforest to oil palm plantations is estimated to result in acarbon debt of 610 Mg of CO2 ha-1, which would take between86 to 93 years to repay (PEACE 2007, Danielsen et al. 2008,Fargione et al. 2008). For plantations established in peat lands,
Ecology and Society 17(1): 25http://www.ecologyandsociety.org/vol17/iss1/art25/
the carbon debt would be much higher, 6000 Mg of CO2 ha-1;this would take over 840 years to repay (Fargione et al. 2008)An estimated 1.7 million ha of oil palm plantations inIndonesia have been established on carbon-rich peat land(Kompas 2010a).
METHODS
Stakeholders’ selection and sampling methodsThe research team followed the standard methodology for theanalysis of environmental and socioeconomic impacts,applied consistently in all sites for the purposes of comparison.We selected research sites to represent a variety of businessmodels as well as possible environmental and local socialimpacts from oil palm plantations in Indonesia. For analysisof local social and environmental impacts, we used threedifferent sources of data collection, i.e., household surveys,focus group discussions, and key informant interviews. In thisway, we could triangulate the collected information tominimize uncertainty and error.
Stakeholders were determined to represent the variety ofgroups affected by the oil palm plantations in each type ofbusiness model. We selected stakeholders to represent variousactors that are directly or indirectly affected by oil palmplantations. Five different stakeholder groups were identifiedfor household surveys and focus group discussions:
● employees: nucleus estate laborers or farmer workers; ● former landowners: individual family groups whose
customary land has been converted to nucleus estate andland using community members who are not customarylandowners, but whose land has been converted fornucleus estate;
● customary users: community groups who have de factorights over the lands;
● investing households: independent growers, whovoluntarily invest in oil palm, or participating farmerswho join PIR, PIR-Transmigrasi, and KKPA programs;
● affected neighbors: respondents who do not belong toany of the other groups.
Although all stakeholder groups are found in sites 1 and 2, site3 lacks the investing households’ group because of the natureof the private company’s business model. The employees’group includes mostly unskilled workers employed inplantation nurseries, fruit harvesting, and others. In sites 1 and2, most unskilled workers live in surrounding villages,whereas in site 3 they live in the barracks on the plantationestate.
The household surveys employed generic questionnairesaimed to obtain respondents’ personal experience of theimpacts of oil palm plantation. A snowball sampling method
selected respondents for the household surveys. We firstapproached and interviewed the local influential persons tohelp identify other groups of respondents for householdsurveys in each site. Social relations in sites 1 and 3communities in Papua feature the ‘big man’ concept, whichmeans that clan members are not able to speak and act freelyabout customary land matters (Mansoeben 1995, Zimmer-Tamakoshi 1997). This had implications for how we selectedrespondents, particularly former landowners and lessors. Insite 3, the research team selected clan heads or males assignedby clan leaders to obtain reliable information. In site 1, wherelocal norms for the big man are less pronounced because of arelatively high degree of interactions with the outsiders, theresearch team was able to interview other clan members aswell.
We selected members for focus group discussions (FGD)using purposive sampling to capture as diverse a range ofopinions as possible about the local impacts of oil palm.Through open-ended questions, FGD also helped verifyinformation collected from individuals and households and togather additional relevant data. We tried to reflect the existingdiversity in terms of wealth, age, ethnicity, gender, and thenature of impacts. Separate discussions were held with menand women who were former landowners and investinghouseholds. This ensured that a group with a diversity ofexperience and different stakes in plantations was engaged inthe analysis.
Finally, we collected secondary data and held semistructuredinterviews with key government officials, companyrepresentatives, and civil society organizations to complementthe site-specific survey data. This produced a broader view onimportant issues relevant to oil palm and biofuel development.
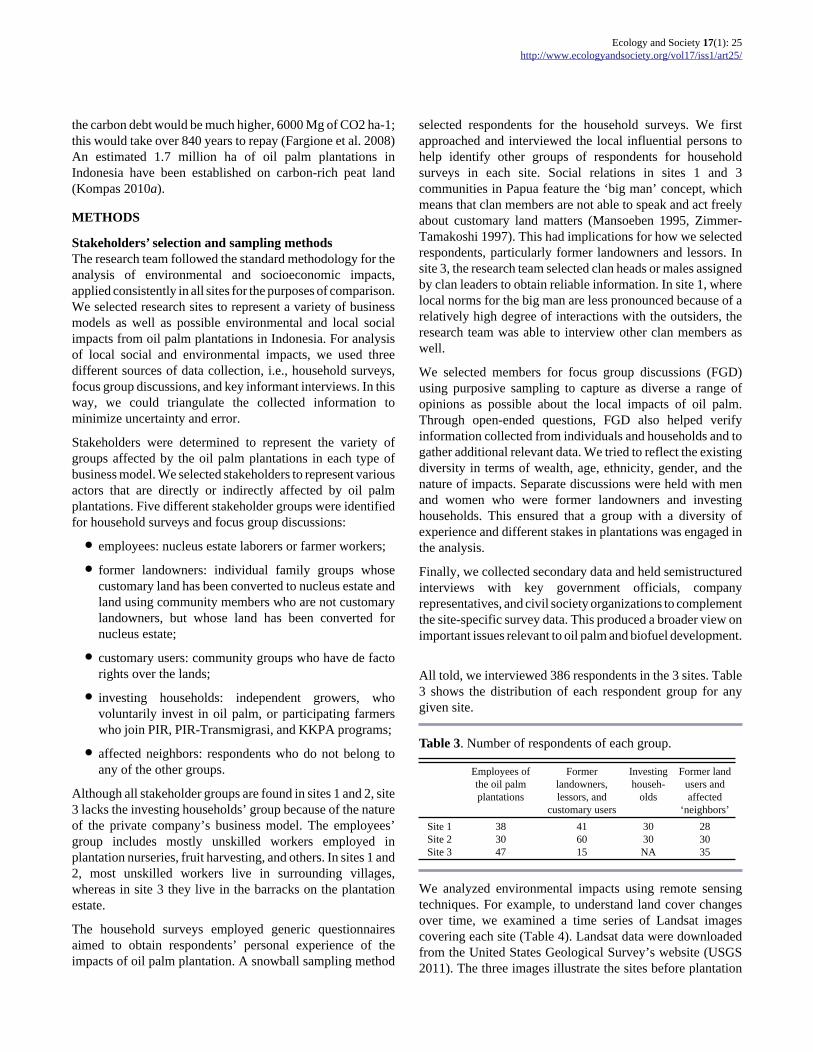
All told, we interviewed 386 respondents in the 3 sites. Table3 shows the distribution of each respondent group for anygiven site.
Table 3. Number of respondents of each group.
Employees ofthe oil palmplantations
Formerlandowners,lessors, and
customary users
Investinghouseh-
olds
Former landusers andaffected
‘neighbors’Site 1 38 41 30 28Site 2 30 60 30 30Site 3 47 15 NA 35
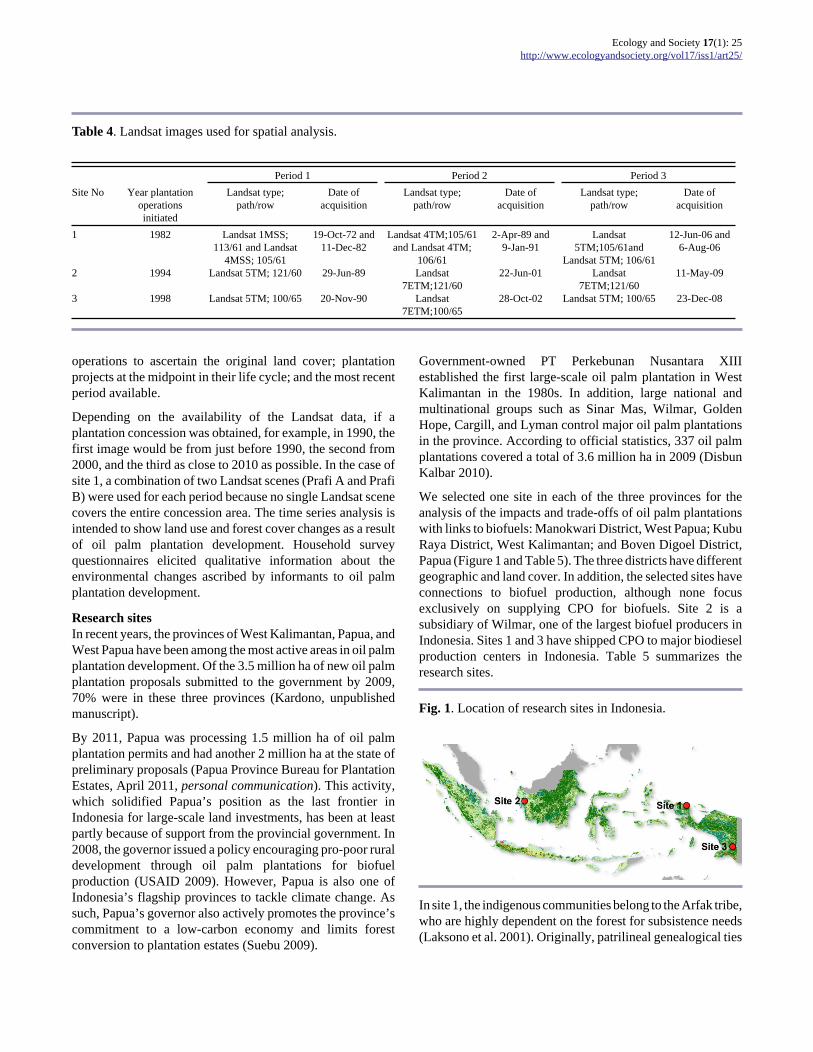
We analyzed environmental impacts using remote sensingtechniques. For example, to understand land cover changesover time, we examined a time series of Landsat imagescovering each site (Table 4). Landsat data were downloadedfrom the United States Geological Survey’s website (USGS2011). The three images illustrate the sites before plantation
Ecology and Society 17(1): 25http://www.ecologyandsociety.org/vol17/iss1/art25/
Table 4. Landsat images used for spatial analysis.
Period 1 Period 2 Period 3Site No Year plantation
operationsinitiated
Landsat type;path/row
Date ofacquisition
Landsat type;path/row
Date ofacquisition
Landsat type;path/row
Date ofacquisition
1 1982 Landsat 1MSS;113/61 and Landsat
4MSS; 105/61
19-Oct-72 and11-Dec-82
Landsat 4TM;105/61and Landsat 4TM;
106/61
2-Apr-89 and9-Jan-91
Landsat5TM;105/61and
Landsat 5TM; 106/61
12-Jun-06 and6-Aug-06
2 1994 Landsat 5TM; 121/60 29-Jun-89 Landsat7ETM;121/60
22-Jun-01 Landsat7ETM;121/60
11-May-09
3 1998 Landsat 5TM; 100/65 20-Nov-90 Landsat7ETM;100/65
28-Oct-02 Landsat 5TM; 100/65 23-Dec-08
operations to ascertain the original land cover; plantationprojects at the midpoint in their life cycle; and the most recentperiod available.
Depending on the availability of the Landsat data, if aplantation concession was obtained, for example, in 1990, thefirst image would be from just before 1990, the second from2000, and the third as close to 2010 as possible. In the case ofsite 1, a combination of two Landsat scenes (Prafi A and PrafiB) were used for each period because no single Landsat scenecovers the entire concession area. The time series analysis isintended to show land use and forest cover changes as a resultof oil palm plantation development. Household surveyquestionnaires elicited qualitative information about theenvironmental changes ascribed by informants to oil palmplantation development.
Research sitesIn recent years, the provinces of West Kalimantan, Papua, andWest Papua have been among the most active areas in oil palmplantation development. Of the 3.5 million ha of new oil palmplantation proposals submitted to the government by 2009,70% were in these three provinces (Kardono, unpublishedmanuscript).
By 2011, Papua was processing 1.5 million ha of oil palmplantation permits and had another 2 million ha at the state ofpreliminary proposals (Papua Province Bureau for PlantationEstates, April 2011, personal communication). This activity,which solidified Papua’s position as the last frontier inIndonesia for large-scale land investments, has been at leastpartly because of support from the provincial government. In2008, the governor issued a policy encouraging pro-poor ruraldevelopment through oil palm plantations for biofuelproduction (USAID 2009). However, Papua is also one ofIndonesia’s flagship provinces to tackle climate change. Assuch, Papua’s governor also actively promotes the province’scommitment to a low-carbon economy and limits forestconversion to plantation estates (Suebu 2009).
Government-owned PT Perkebunan Nusantara XIIIestablished the first large-scale oil palm plantation in WestKalimantan in the 1980s. In addition, large national andmultinational groups such as Sinar Mas, Wilmar, GoldenHope, Cargill, and Lyman control major oil palm plantationsin the province. According to official statistics, 337 oil palmplantations covered a total of 3.6 million ha in 2009 (DisbunKalbar 2010).
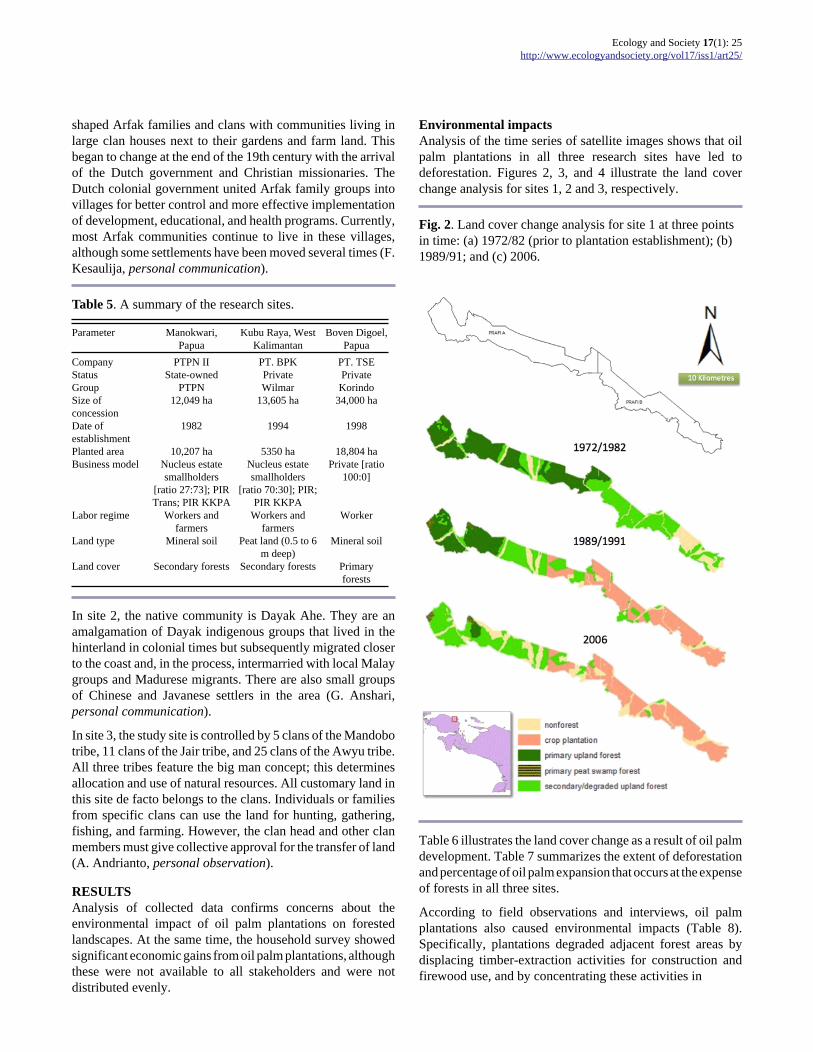
We selected one site in each of the three provinces for theanalysis of the impacts and trade-offs of oil palm plantationswith links to biofuels: Manokwari District, West Papua; KubuRaya District, West Kalimantan; and Boven Digoel District,Papua (Figure 1 and Table 5). The three districts have differentgeographic and land cover. In addition, the selected sites haveconnections to biofuel production, although none focusexclusively on supplying CPO for biofuels. Site 2 is asubsidiary of Wilmar, one of the largest biofuel producers inIndonesia. Sites 1 and 3 have shipped CPO to major biodieselproduction centers in Indonesia. Table 5 summarizes theresearch sites.
Fig. 1. Location of research sites in Indonesia.
In site 1, the indigenous communities belong to the Arfak tribe,who are highly dependent on the forest for subsistence needs(Laksono et al. 2001). Originally, patrilineal genealogical ties
Ecology and Society 17(1): 25http://www.ecologyandsociety.org/vol17/iss1/art25/
shaped Arfak families and clans with communities living inlarge clan houses next to their gardens and farm land. Thisbegan to change at the end of the 19th century with the arrivalof the Dutch government and Christian missionaries. TheDutch colonial government united Arfak family groups intovillages for better control and more effective implementationof development, educational, and health programs. Currently,most Arfak communities continue to live in these villages,although some settlements have been moved several times (F.Kesaulija, personal communication).
Table 5. A summary of the research sites.
Parameter Manokwari,Papua
Kubu Raya, WestKalimantan
Boven Digoel,Papua
Company PTPN II PT. BPK PT. TSEStatus State-owned Private PrivateGroup PTPN Wilmar KorindoSize ofconcession
12,049 ha 13,605 ha 34,000 ha
Date ofestablishment
1982 1994 1998
Planted area 10,207 ha 5350 ha 18,804 haBusiness model Nucleus estate
smallholders[ratio 27:73]; PIRTrans; PIR KKPA
Nucleus estatesmallholders
[ratio 70:30]; PIR;PIR KKPA
Private [ratio100:0]
Labor regime Workers andfarmers
Workers andfarmers
Worker
Land type Mineral soil Peat land (0.5 to 6m deep)
Mineral soil
Land cover Secondary forests Secondary forests Primaryforests
In site 2, the native community is Dayak Ahe. They are anamalgamation of Dayak indigenous groups that lived in thehinterland in colonial times but subsequently migrated closerto the coast and, in the process, intermarried with local Malaygroups and Madurese migrants. There are also small groupsof Chinese and Javanese settlers in the area (G. Anshari,personal communication).
In site 3, the study site is controlled by 5 clans of the Mandobotribe, 11 clans of the Jair tribe, and 25 clans of the Awyu tribe.All three tribes feature the big man concept; this determinesallocation and use of natural resources. All customary land inthis site de facto belongs to the clans. Individuals or familiesfrom specific clans can use the land for hunting, gathering,fishing, and farming. However, the clan head and other clanmembers must give collective approval for the transfer of land(A. Andrianto, personal observation).
RESULTSAnalysis of collected data confirms concerns about theenvironmental impact of oil palm plantations on forestedlandscapes. At the same time, the household survey showedsignificant economic gains from oil palm plantations, althoughthese were not available to all stakeholders and were notdistributed evenly.
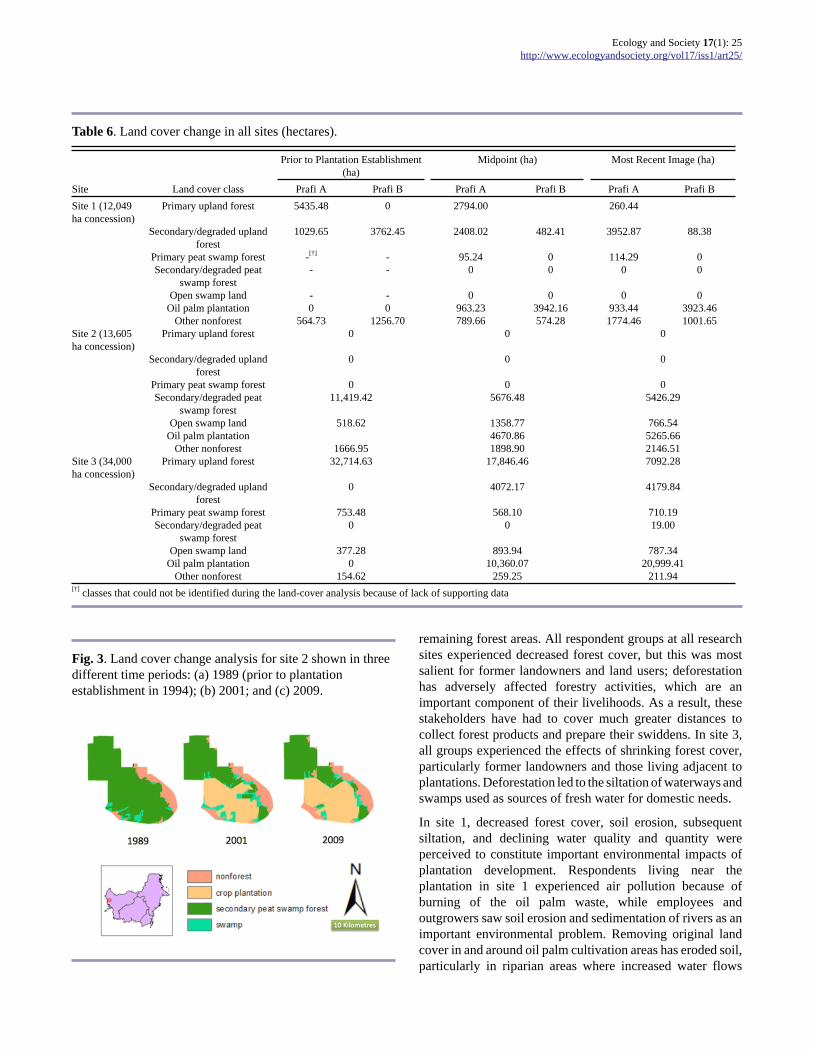
Environmental impactsAnalysis of the time series of satellite images shows that oilpalm plantations in all three research sites have led todeforestation. Figures 2, 3, and 4 illustrate the land coverchange analysis for sites 1, 2 and 3, respectively.
Fig. 2. Land cover change analysis for site 1 at three pointsin time: (a) 1972/82 (prior to plantation establishment); (b)1989/91; and (c) 2006.
Table 6 illustrates the land cover change as a result of oil palmdevelopment. Table 7 summarizes the extent of deforestationand percentage of oil palm expansion that occurs at the expenseof forests in all three sites.
According to field observations and interviews, oil palmplantations also caused environmental impacts (Table 8).Specifically, plantations degraded adjacent forest areas bydisplacing timber-extraction activities for construction andfirewood use, and by concentrating these activities in
Ecology and Society 17(1): 25http://www.ecologyandsociety.org/vol17/iss1/art25/
Table 6. Land cover change in all sites (hectares).
Prior to Plantation Establishment(ha)
Midpoint (ha) Most Recent Image (ha)
Site Land cover class Prafi A Prafi B Prafi A Prafi B Prafi A Prafi BSite 1 (12,049ha concession)
Primary upland forest 5435.48 0 2794.00 260.44
Secondary/degraded uplandforest
1029.65 3762.45 2408.02 482.41 3952.87 88.38
Primary peat swamp forest -[†] - 95.24 0 114.29 0Secondary/degraded peat
swamp forest- - 0 0 0 0
Open swamp land - - 0 0 0 0Oil palm plantation 0 0 963.23 3942.16 933.44 3923.46
Other nonforest 564.73 1256.70 789.66 574.28 1774.46 1001.65Site 2 (13,605ha concession)
Primary upland forest 0 0 0
Secondary/degraded uplandforest
0 0 0
Primary peat swamp forest 0 0 0Secondary/degraded peat
swamp forest11,419.42 5676.48 5426.29
Open swamp land 518.62 1358.77 766.54Oil palm plantation 4670.86 5265.66
Other nonforest 1666.95 1898.90 2146.51Site 3 (34,000ha concession)
Primary upland forest 32,714.63 17,846.46 7092.28
Secondary/degraded uplandforest
0 4072.17 4179.84
Primary peat swamp forest 753.48 568.10 710.19Secondary/degraded peat
swamp forest0 0 19.00
Open swamp land 377.28 893.94 787.34Oil palm plantation 0 10,360.07 20,999.41
Other nonforest 154.62 259.25 211.94[†] classes that could not be identified during the land-cover analysis because of lack of supporting data
Fig. 3. Land cover change analysis for site 2 shown in threedifferent time periods: (a) 1989 (prior to plantationestablishment in 1994); (b) 2001; and (c) 2009.
remaining forest areas. All respondent groups at all researchsites experienced decreased forest cover, but this was mostsalient for former landowners and land users; deforestationhas adversely affected forestry activities, which are animportant component of their livelihoods. As a result, thesestakeholders have had to cover much greater distances tocollect forest products and prepare their swiddens. In site 3,all groups experienced the effects of shrinking forest cover,particularly former landowners and those living adjacent toplantations. Deforestation led to the siltation of waterways andswamps used as sources of fresh water for domestic needs.
In site 1, decreased forest cover, soil erosion, subsequentsiltation, and declining water quality and quantity wereperceived to constitute important environmental impacts ofplantation development. Respondents living near theplantation in site 1 experienced air pollution because ofburning of the oil palm waste, while employees andoutgrowers saw soil erosion and sedimentation of rivers as animportant environmental problem. Removing original landcover in and around oil palm cultivation areas has eroded soil,particularly in riparian areas where increased water flows
Ecology and Society 17(1): 25http://www.ecologyandsociety.org/vol17/iss1/art25/
during the rainy season cause abrasion. Flash floods alsodamaged the oil estate significantly, making parts of itinaccessible, and thus delaying and reducing harvest.
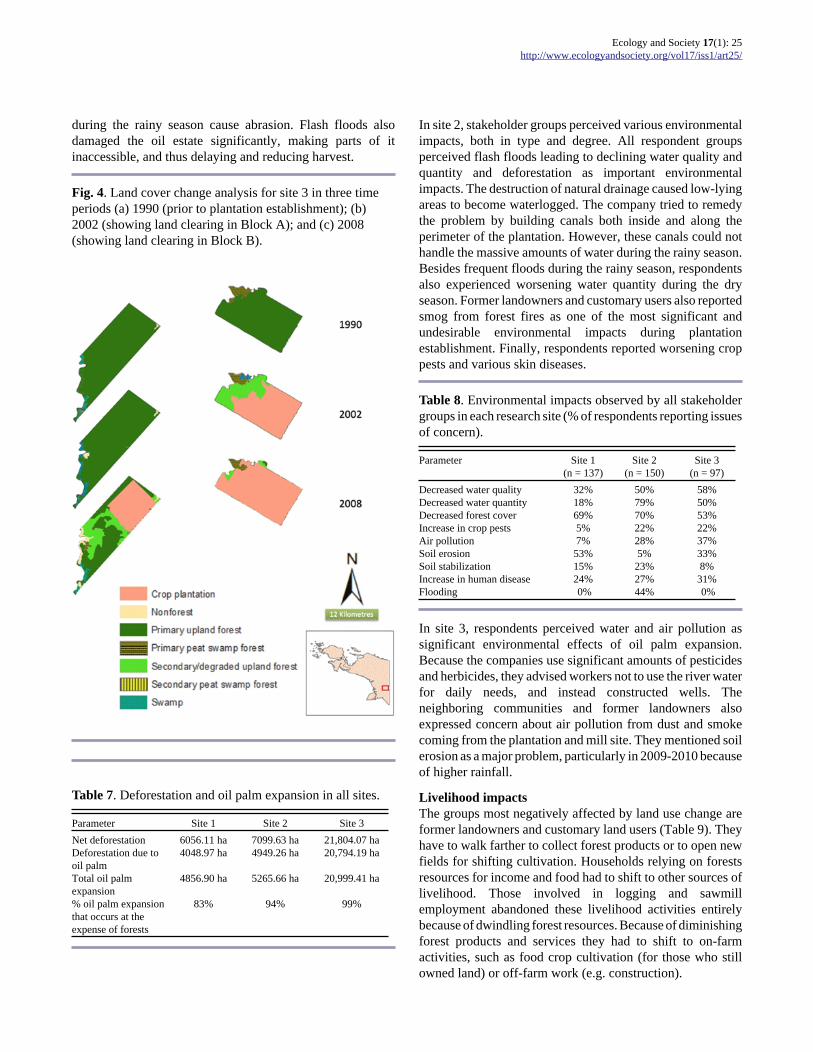
Fig. 4. Land cover change analysis for site 3 in three timeperiods (a) 1990 (prior to plantation establishment); (b)2002 (showing land clearing in Block A); and (c) 2008(showing land clearing in Block B).
Table 7. Deforestation and oil palm expansion in all sites.
Parameter Site 1 Site 2 Site 3Net deforestation 6056.11 ha 7099.63 ha 21,804.07 haDeforestation due tooil palm
4048.97 ha 4949.26 ha 20,794.19 ha
Total oil palmexpansion
4856.90 ha 5265.66 ha 20,999.41 ha
% oil palm expansionthat occurs at theexpense of forests
83% 94% 99%
In site 2, stakeholder groups perceived various environmentalimpacts, both in type and degree. All respondent groupsperceived flash floods leading to declining water quality andquantity and deforestation as important environmentalimpacts. The destruction of natural drainage caused low-lyingareas to become waterlogged. The company tried to remedythe problem by building canals both inside and along theperimeter of the plantation. However, these canals could nothandle the massive amounts of water during the rainy season.Besides frequent floods during the rainy season, respondentsalso experienced worsening water quantity during the dryseason. Former landowners and customary users also reportedsmog from forest fires as one of the most significant andundesirable environmental impacts during plantationestablishment. Finally, respondents reported worsening croppests and various skin diseases.
Table 8. Environmental impacts observed by all stakeholdergroups in each research site (% of respondents reporting issuesof concern).
Parameter Site 1(n = 137)
Site 2(n = 150)
Site 3(n = 97)
Decreased water quality 32% 50% 58%Decreased water quantity 18% 79% 50%Decreased forest cover 69% 70% 53%Increase in crop pests 5% 22% 22%Air pollution 7% 28% 37%Soil erosion 53% 5% 33%Soil stabilization 15% 23% 8%Increase in human disease 24% 27% 31%Flooding 0% 44% 0%
In site 3, respondents perceived water and air pollution assignificant environmental effects of oil palm expansion.Because the companies use significant amounts of pesticidesand herbicides, they advised workers not to use the river waterfor daily needs, and instead constructed wells. Theneighboring communities and former landowners alsoexpressed concern about air pollution from dust and smokecoming from the plantation and mill site. They mentioned soilerosion as a major problem, particularly in 2009-2010 becauseof higher rainfall.
Livelihood impactsThe groups most negatively affected by land use change areformer landowners and customary land users (Table 9). Theyhave to walk farther to collect forest products or to open newfields for shifting cultivation. Households relying on forestsresources for income and food had to shift to other sources oflivelihood. Those involved in logging and sawmillemployment abandoned these livelihood activities entirelybecause of dwindling forest resources. Because of diminishingforest products and services they had to shift to on-farmactivities, such as food crop cultivation (for those who stillowned land) or off-farm work (e.g. construction).
Ecology and Society 17(1): 25http://www.ecologyandsociety.org/vol17/iss1/art25/
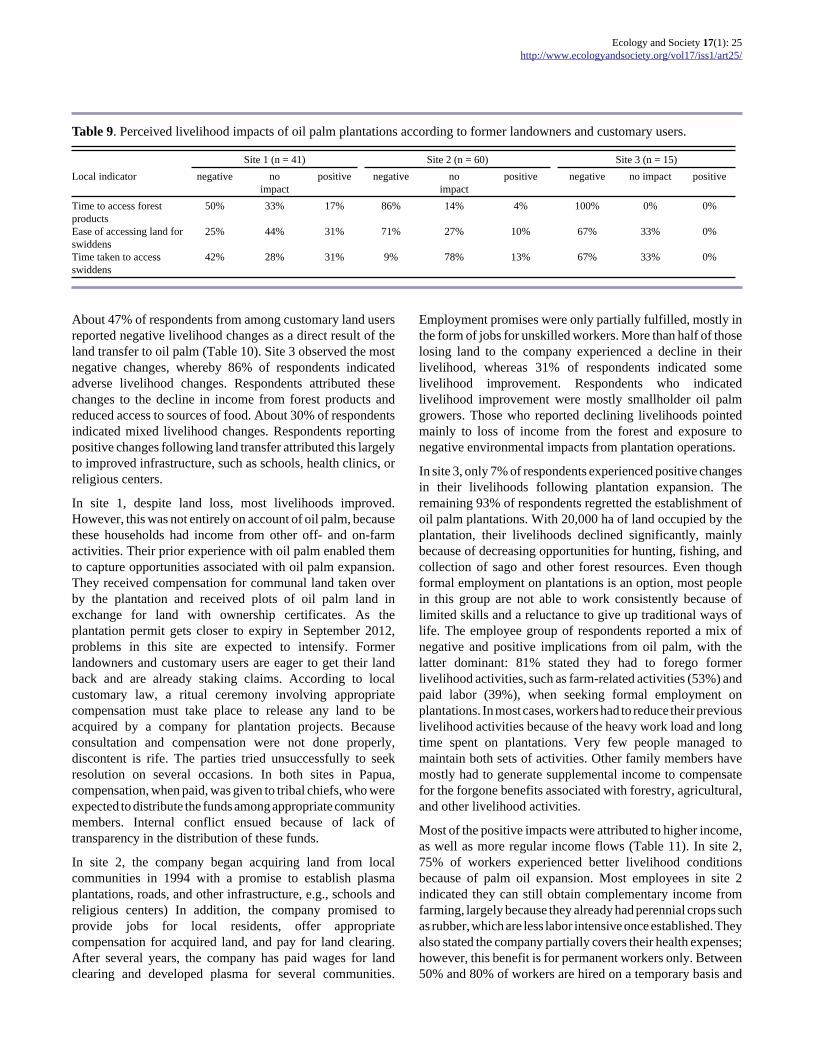
Table 9. Perceived livelihood impacts of oil palm plantations according to former landowners and customary users.
Site 1 (n = 41) Site 2 (n = 60) Site 3 (n = 15)Local indicator negative no
impactpositive negative no
impactpositive negative no impact positive
Time to access forestproducts
50% 33% 17% 86% 14% 4% 100% 0% 0%
Ease of accessing land forswiddens
25% 44% 31% 71% 27% 10% 67% 33% 0%
Time taken to accessswiddens
42% 28% 31% 9% 78% 13% 67% 33% 0%
About 47% of respondents from among customary land usersreported negative livelihood changes as a direct result of theland transfer to oil palm (Table 10). Site 3 observed the mostnegative changes, whereby 86% of respondents indicatedadverse livelihood changes. Respondents attributed thesechanges to the decline in income from forest products andreduced access to sources of food. About 30% of respondentsindicated mixed livelihood changes. Respondents reportingpositive changes following land transfer attributed this largelyto improved infrastructure, such as schools, health clinics, orreligious centers.
In site 1, despite land loss, most livelihoods improved.However, this was not entirely on account of oil palm, becausethese households had income from other off- and on-farmactivities. Their prior experience with oil palm enabled themto capture opportunities associated with oil palm expansion.They received compensation for communal land taken overby the plantation and received plots of oil palm land inexchange for land with ownership certificates. As theplantation permit gets closer to expiry in September 2012,problems in this site are expected to intensify. Formerlandowners and customary users are eager to get their landback and are already staking claims. According to localcustomary law, a ritual ceremony involving appropriatecompensation must take place to release any land to beacquired by a company for plantation projects. Becauseconsultation and compensation were not done properly,discontent is rife. The parties tried unsuccessfully to seekresolution on several occasions. In both sites in Papua,compensation, when paid, was given to tribal chiefs, who wereexpected to distribute the funds among appropriate communitymembers. Internal conflict ensued because of lack oftransparency in the distribution of these funds.
In site 2, the company began acquiring land from localcommunities in 1994 with a promise to establish plasmaplantations, roads, and other infrastructure, e.g., schools andreligious centers) In addition, the company promised toprovide jobs for local residents, offer appropriatecompensation for acquired land, and pay for land clearing.After several years, the company has paid wages for landclearing and developed plasma for several communities.
Employment promises were only partially fulfilled, mostly inthe form of jobs for unskilled workers. More than half of thoselosing land to the company experienced a decline in theirlivelihood, whereas 31% of respondents indicated somelivelihood improvement. Respondents who indicatedlivelihood improvement were mostly smallholder oil palmgrowers. Those who reported declining livelihoods pointedmainly to loss of income from the forest and exposure tonegative environmental impacts from plantation operations.
In site 3, only 7% of respondents experienced positive changesin their livelihoods following plantation expansion. Theremaining 93% of respondents regretted the establishment ofoil palm plantations. With 20,000 ha of land occupied by theplantation, their livelihoods declined significantly, mainlybecause of decreasing opportunities for hunting, fishing, andcollection of sago and other forest resources. Even thoughformal employment on plantations is an option, most peoplein this group are not able to work consistently because oflimited skills and a reluctance to give up traditional ways oflife. The employee group of respondents reported a mix ofnegative and positive implications from oil palm, with thelatter dominant: 81% stated they had to forego formerlivelihood activities, such as farm-related activities (53%) andpaid labor (39%), when seeking formal employment onplantations. In most cases, workers had to reduce their previouslivelihood activities because of the heavy work load and longtime spent on plantations. Very few people managed tomaintain both sets of activities. Other family members havemostly had to generate supplemental income to compensatefor the forgone benefits associated with forestry, agricultural,and other livelihood activities.
Most of the positive impacts were attributed to higher income,as well as more regular income flows (Table 11). In site 2,75% of workers experienced better livelihood conditionsbecause of palm oil expansion. Most employees in site 2indicated they can still obtain complementary income fromfarming, largely because they already had perennial crops suchas rubber, which are less labor intensive once established. Theyalso stated the company partially covers their health expenses;however, this benefit is for permanent workers only. Between50% and 80% of workers are hired on a temporary basis and
Ecology and Society 17(1): 25http://www.ecologyandsociety.org/vol17/iss1/art25/
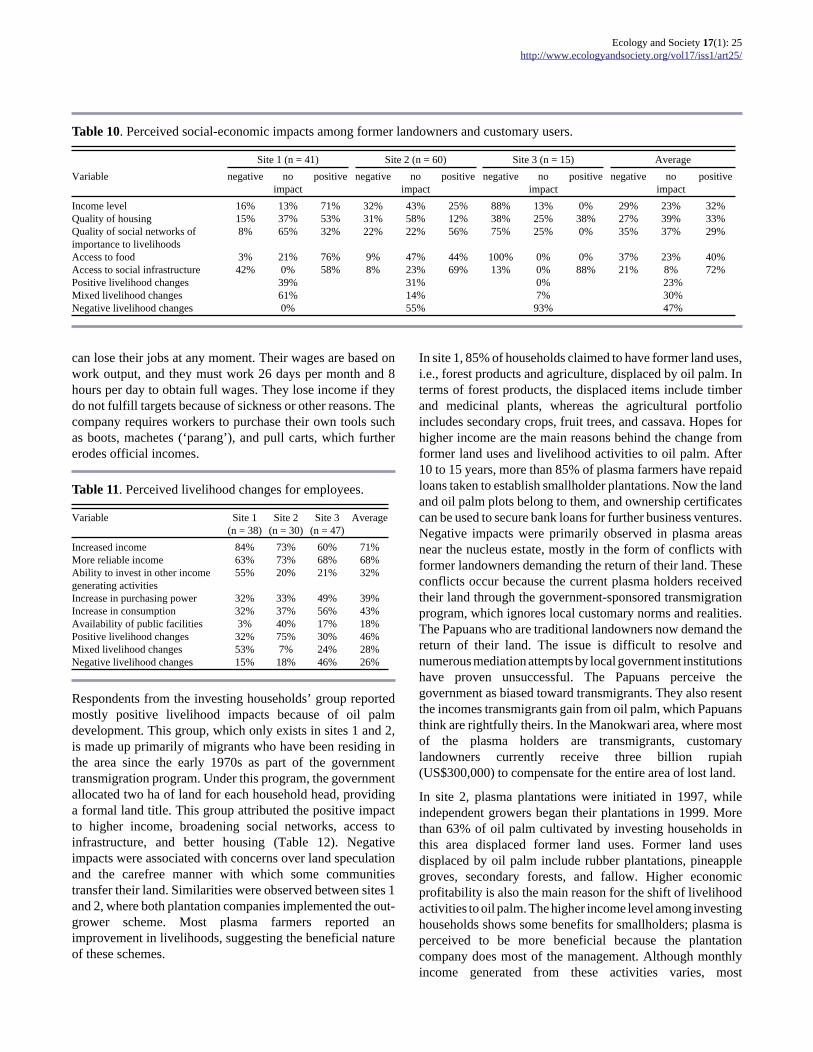
Table 10. Perceived social-economic impacts among former landowners and customary users.
Site 1 (n = 41) Site 2 (n = 60) Site 3 (n = 15) AverageVariable negative no
impactpositive negative no
impactpositive negative no
impactpositive negative no
impactpositive
Income level 16% 13% 71% 32% 43% 25% 88% 13% 0% 29% 23% 32%Quality of housing 15% 37% 53% 31% 58% 12% 38% 25% 38% 27% 39% 33%Quality of social networks ofimportance to livelihoods
8% 65% 32% 22% 22% 56% 75% 25% 0% 35% 37% 29%
Access to food 3% 21% 76% 9% 47% 44% 100% 0% 0% 37% 23% 40%Access to social infrastructure 42% 0% 58% 8% 23% 69% 13% 0% 88% 21% 8% 72%Positive livelihood changes 39% 31% 0% 23%Mixed livelihood changes 61% 14% 7% 30%Negative livelihood changes 0% 55% 93% 47%
can lose their jobs at any moment. Their wages are based onwork output, and they must work 26 days per month and 8hours per day to obtain full wages. They lose income if theydo not fulfill targets because of sickness or other reasons. Thecompany requires workers to purchase their own tools suchas boots, machetes (‘parang’), and pull carts, which furthererodes official incomes.
Table 11. Perceived livelihood changes for employees.
Variable Site 1(n = 38)
Site 2(n = 30)
Site 3(n = 47)
Average
Increased income 84% 73% 60% 71%More reliable income 63% 73% 68% 68%Ability to invest in other incomegenerating activities
55% 20% 21% 32%
Increase in purchasing power 32% 33% 49% 39%Increase in consumption 32% 37% 56% 43%Availability of public facilities 3% 40% 17% 18%Positive livelihood changes 32% 75% 30% 46%Mixed livelihood changes 53% 7% 24% 28%Negative livelihood changes 15% 18% 46% 26%
Respondents from the investing households’ group reportedmostly positive livelihood impacts because of oil palmdevelopment. This group, which only exists in sites 1 and 2,is made up primarily of migrants who have been residing inthe area since the early 1970s as part of the governmenttransmigration program. Under this program, the governmentallocated two ha of land for each household head, providinga formal land title. This group attributed the positive impactto higher income, broadening social networks, access toinfrastructure, and better housing (Table 12). Negativeimpacts were associated with concerns over land speculationand the carefree manner with which some communitiestransfer their land. Similarities were observed between sites 1and 2, where both plantation companies implemented the out-grower scheme. Most plasma farmers reported animprovement in livelihoods, suggesting the beneficial natureof these schemes.
In site 1, 85% of households claimed to have former land uses,i.e., forest products and agriculture, displaced by oil palm. Interms of forest products, the displaced items include timberand medicinal plants, whereas the agricultural portfolioincludes secondary crops, fruit trees, and cassava. Hopes forhigher income are the main reasons behind the change fromformer land uses and livelihood activities to oil palm. After10 to 15 years, more than 85% of plasma farmers have repaidloans taken to establish smallholder plantations. Now the landand oil palm plots belong to them, and ownership certificatescan be used to secure bank loans for further business ventures.Negative impacts were primarily observed in plasma areasnear the nucleus estate, mostly in the form of conflicts withformer landowners demanding the return of their land. Theseconflicts occur because the current plasma holders receivedtheir land through the government-sponsored transmigrationprogram, which ignores local customary norms and realities.The Papuans who are traditional landowners now demand thereturn of their land. The issue is difficult to resolve andnumerous mediation attempts by local government institutionshave proven unsuccessful. The Papuans perceive thegovernment as biased toward transmigrants. They also resentthe incomes transmigrants gain from oil palm, which Papuansthink are rightfully theirs. In the Manokwari area, where mostof the plasma holders are transmigrants, customarylandowners currently receive three billion rupiah(US$300,000) to compensate for the entire area of lost land.
In site 2, plasma plantations were initiated in 1997, whileindependent growers began their plantations in 1999. Morethan 63% of oil palm cultivated by investing households inthis area displaced former land uses. Former land usesdisplaced by oil palm include rubber plantations, pineapplegroves, secondary forests, and fallow. Higher economicprofitability is also the main reason for the shift of livelihoodactivities to oil palm. The higher income level among investinghouseholds shows some benefits for smallholders; plasma isperceived to be more beneficial because the plantationcompany does most of the management. Although monthlyincome generated from these activities varies, most
Ecology and Society 17(1): 25http://www.ecologyandsociety.org/vol17/iss1/art25/
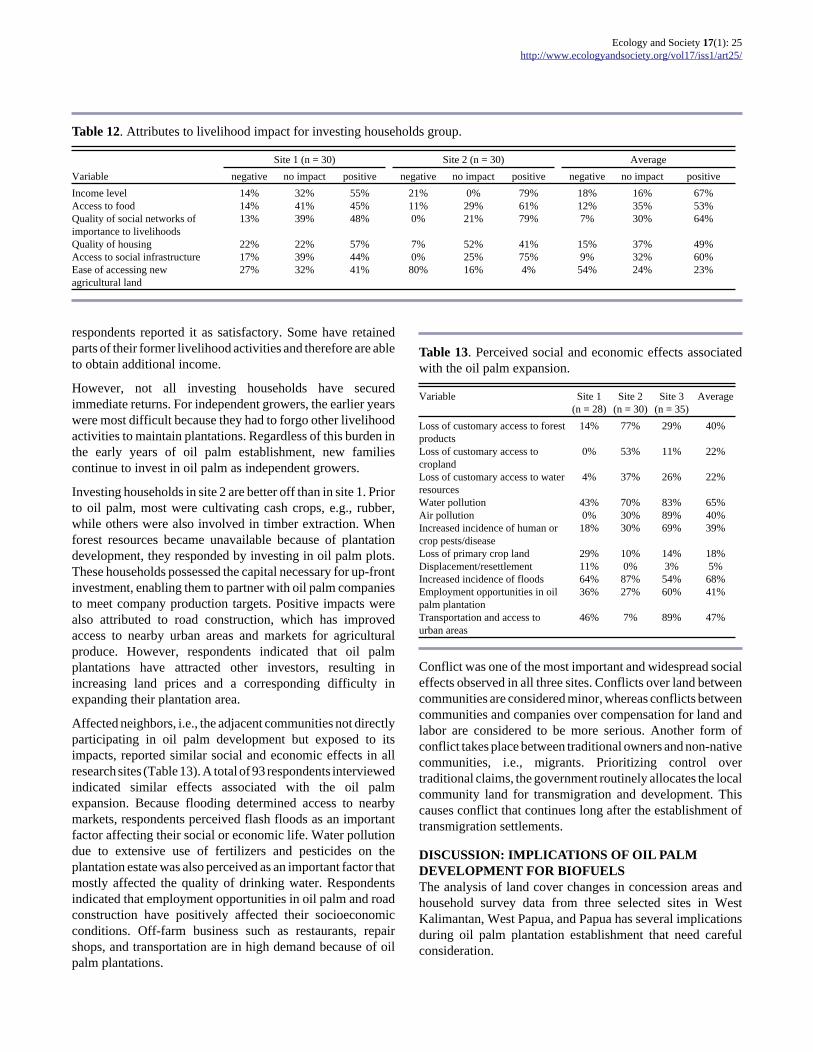
Table 12. Attributes to livelihood impact for investing households group.
Site 1 (n = 30) Site 2 (n = 30) AverageVariable negative no impact positive negative no impact positive negative no impact positiveIncome level 14% 32% 55% 21% 0% 79% 18% 16% 67%Access to food 14% 41% 45% 11% 29% 61% 12% 35% 53%Quality of social networks ofimportance to livelihoods
13% 39% 48% 0% 21% 79% 7% 30% 64%
Quality of housing 22% 22% 57% 7% 52% 41% 15% 37% 49%Access to social infrastructure 17% 39% 44% 0% 25% 75% 9% 32% 60%Ease of accessing newagricultural land
27% 32% 41% 80% 16% 4% 54% 24% 23%
respondents reported it as satisfactory. Some have retainedparts of their former livelihood activities and therefore are ableto obtain additional income.
However, not all investing households have securedimmediate returns. For independent growers, the earlier yearswere most difficult because they had to forgo other livelihoodactivities to maintain plantations. Regardless of this burden inthe early years of oil palm establishment, new familiescontinue to invest in oil palm as independent growers.
Investing households in site 2 are better off than in site 1. Priorto oil palm, most were cultivating cash crops, e.g., rubber,while others were also involved in timber extraction. Whenforest resources became unavailable because of plantationdevelopment, they responded by investing in oil palm plots.These households possessed the capital necessary for up-frontinvestment, enabling them to partner with oil palm companiesto meet company production targets. Positive impacts werealso attributed to road construction, which has improvedaccess to nearby urban areas and markets for agriculturalproduce. However, respondents indicated that oil palmplantations have attracted other investors, resulting inincreasing land prices and a corresponding difficulty inexpanding their plantation area.
Affected neighbors, i.e., the adjacent communities not directlyparticipating in oil palm development but exposed to itsimpacts, reported similar social and economic effects in allresearch sites (Table 13). A total of 93 respondents interviewedindicated similar effects associated with the oil palmexpansion. Because flooding determined access to nearbymarkets, respondents perceived flash floods as an importantfactor affecting their social or economic life. Water pollutiondue to extensive use of fertilizers and pesticides on theplantation estate was also perceived as an important factor thatmostly affected the quality of drinking water. Respondentsindicated that employment opportunities in oil palm and roadconstruction have positively affected their socioeconomicconditions. Off-farm business such as restaurants, repairshops, and transportation are in high demand because of oilpalm plantations.
Table 13. Perceived social and economic effects associatedwith the oil palm expansion.
Variable Site 1(n = 28)
Site 2(n = 30)
Site 3(n = 35)
Average
Loss of customary access to forestproducts
14% 77% 29% 40%
Loss of customary access tocropland
0% 53% 11% 22%
Loss of customary access to waterresources
4% 37% 26% 22%
Water pollution 43% 70% 83% 65%Air pollution 0% 30% 89% 40%Increased incidence of human orcrop pests/disease
18% 30% 69% 39%
Loss of primary crop land 29% 10% 14% 18%Displacement/resettlement 11% 0% 3% 5%Increased incidence of floods 64% 87% 54% 68%Employment opportunities in oilpalm plantation
36% 27% 60% 41%
Transportation and access tourban areas
46% 7% 89% 47%
Conflict was one of the most important and widespread socialeffects observed in all three sites. Conflicts over land betweencommunities are considered minor, whereas conflicts betweencommunities and companies over compensation for land andlabor are considered to be more serious. Another form ofconflict takes place between traditional owners and non-nativecommunities, i.e., migrants. Prioritizing control overtraditional claims, the government routinely allocates the localcommunity land for transmigration and development. Thiscauses conflict that continues long after the establishment oftransmigration settlements.
DISCUSSION: IMPLICATIONS OF OIL PALMDEVELOPMENT FOR BIOFUELSThe analysis of land cover changes in concession areas andhousehold survey data from three selected sites in WestKalimantan, West Papua, and Papua has several implicationsduring oil palm plantation establishment that need carefulconsideration.
Ecology and Society 17(1): 25http://www.ecologyandsociety.org/vol17/iss1/art25/
Uneven economic benefitsOil palm plantations generate uneven economic benefits at thecost of significant environmental losses. As shown in theprevious section, the economic livelihood gains for somestakeholders can be substantial, although not equitablydistributed. In all three sites, the employees of oil palmplantations reported positive livelihood changes mainlybecause of salaried income and other job-related benefits,although employment terms had their drawbacks. In sites 1and 2, the households investing in oil palm holdings allreported beneficial livelihood outcome as well. However, notall are able to raise the capital to develop smallholder oil palm.Therefore, in sites 1 and 2 this remains a livelihood option forthe privileged; in site 3, in Boven Digoel, the investinghouseholds’ group does not exist at all.
More established plantations correlate to strongerbenefitsThe variation between the sites in terms of reported positivechanges correlates with the history of oil palm in each site,stakeholder familiarity with oil palm management practices,and their oil palm-related skills. West Kalimantan has acomparatively long history of oil palm plantationdevelopment; the positive report about livelihood changesamong the employees and investing households in site 2 isthus more uniform, whereas negative feedback is lesspronounced. West Papua also has been exposed to oil palmplantation estates. However, Papua’s more remote locationand limited interaction with other oil palm centers results inlimited management skills; they have less success ingenerating benefits. In site 3 in Papua, oil palm is a very newcrop found in a very remote location. It is therefore likely thelocal population has not yet developed the knowledge, skills,and means to manage plantations effectively.
Benefits come with significant environmental costEmployee and investing household benefits are generated atsignificant environmental cost through deforestation andsecondary impacts such as air and water pollution. In all threesites, plantation concessions were covered with primary andsecondary forest, leading to the clearing of about 70,000 ha offorest in exchange for economic benefits to a relativelycircumscribed set of stakeholders. Our findings also indicatesignificant problems with air pollution, water pollution, soilerosion, waterway siltation, and flooding. Similar studiescorroborate these findings (Dudgeon et al. 2006, Danielsen etal. 2008, Fitzherbert et al. 2008, Hartemink 2006, Henson2003, World Bank 2010).
Winners and losersAlthough plantation employees and investing householdshave benefited from oil palm, there are losers as well aswinners. Customary land users and former landowners areamong the most negatively affected by plantation expansionbecause they are often unfamiliar with oil palm as a crop,
cannot develop oil palm smallholdings, and possess neitherthe necessary knowledge nor skills to obtain plantationemployment (McCarthy 2010, Colchester and Chao 2011).The process of land transfer to plantation developers is a majorproblem that often leaves customary land users and formerlandowners on the losing end. Most of the time, governmentagencies simply issue concession permits; they emphasize theneed for prior community acceptance of plantation investmentplans, but let the companies and communities negotiate thelevel and nature of compensation. Companies often claimexaggerated benefits of plantation development for localcommunities. They also tend to focus on village elite duringnegotiations causing problems of representation and elitecapture. Government authorities should be aware of theseproblems and participate in negotiations to ensure thatagreements are fair, not one-sided. Although affectedneighbors indicate they have also experienced positiveimpacts from the presence of plantations, we found this to betrue for only a small number of people. The main concerns ofthis group relate to plantation expansion plans and the potentialfor more reductions of their customary land.
Companies clear land years before developingplantationsThe economic gains accrue at the expense of weak rule of law(Kartodihardjo and Supriono 2000, Wakker 2005, Reinhardtet al. 2007). The plantation companies in three selected siteshave acquired concession areas that have taken several years,in some cases decades, to be partially developed intoplantations. Yet timber extraction has proceeded more rapidly.This illustrates the broad tendency of plantation investors inIndonesia to acquire large areas of forested land at once foreconomies of scale, long-term planning, and investment riskmitigation.
Historically, oil palm companies in Indonesia have developedplantations on just a fraction of the land they have been given.For instance, Sumatra and Kalimantan islands combined havemore than 11 million ha of concessions to be developed intoplantations. However, as of 2010, less than half of this areahad been developed (Slette and Wiyono 2011); others areas,allegedly developed, have actually been abandoned.
Plantation development commonly lags for years or decades,but the removal of forest cover is considerably faster (Koh andWilcove 2008, McCarthy and Cramb 2009; A. Casson, L.Taccioni, and K. Deddy, unpublished manuscript). Plantationcompanies do this to generate up-front capital, offsetplantation investment costs, secure land immediately forfuture expansion, or simply to benefit from timber only(Casson et al. 2007, Hunt 2010, Schwarz 2010).
Land clearing has direct and indirect environmentalimpactsThe clearance of forests not only destroys forest cover, it alsoleads to a range of associated indirect environmental impacts.
Ecology and Society 17(1): 25http://www.ecologyandsociety.org/vol17/iss1/art25/
Although some of these occur naturally, with or without thepresence of plantations, many adverse impacts are clearly dueto poor oil palm plantation practices. This raises the questionof whether the concerned companies have implementedenvironmental impact assessment (EIA) guidelineseffectively.
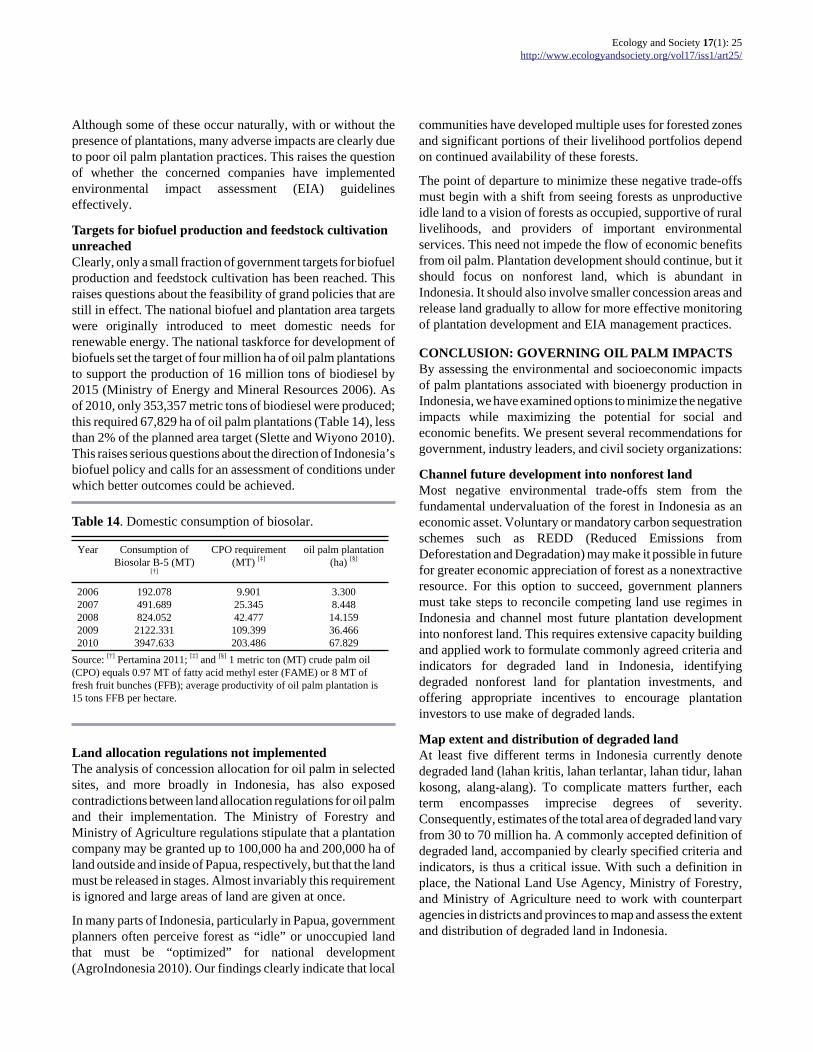
Targets for biofuel production and feedstock cultivationunreachedClearly, only a small fraction of government targets for biofuelproduction and feedstock cultivation has been reached. Thisraises questions about the feasibility of grand policies that arestill in effect. The national biofuel and plantation area targetswere originally introduced to meet domestic needs forrenewable energy. The national taskforce for development ofbiofuels set the target of four million ha of oil palm plantationsto support the production of 16 million tons of biodiesel by2015 (Ministry of Energy and Mineral Resources 2006). Asof 2010, only 353,357 metric tons of biodiesel were produced;this required 67,829 ha of oil palm plantations (Table 14), lessthan 2% of the planned area target (Slette and Wiyono 2010).This raises serious questions about the direction of Indonesia’sbiofuel policy and calls for an assessment of conditions underwhich better outcomes could be achieved.
Table 14. Domestic consumption of biosolar.
Year Consumption ofBiosolar B-5 (MT)
[†]
CPO requirement(MT) [‡]
oil palm plantation(ha) [§]
2006 192.078 9.901 3.3002007 491.689 25.345 8.4482008 824.052 42.477 14.1592009 2122.331 109.399 36.4662010 3947.633 203.486 67.829
Source: [†] Pertamina 2011; [‡] and [§] 1 metric ton (MT) crude palm oil(CPO) equals 0.97 MT of fatty acid methyl ester (FAME) or 8 MT offresh fruit bunches (FFB); average productivity of oil palm plantation is15 tons FFB per hectare.
Land allocation regulations not implementedThe analysis of concession allocation for oil palm in selectedsites, and more broadly in Indonesia, has also exposedcontradictions between land allocation regulations for oil palmand their implementation. The Ministry of Forestry andMinistry of Agriculture regulations stipulate that a plantationcompany may be granted up to 100,000 ha and 200,000 ha ofland outside and inside of Papua, respectively, but that the landmust be released in stages. Almost invariably this requirementis ignored and large areas of land are given at once.
In many parts of Indonesia, particularly in Papua, governmentplanners often perceive forest as “idle” or unoccupied landthat must be “optimized” for national development(AgroIndonesia 2010). Our findings clearly indicate that local
communities have developed multiple uses for forested zonesand significant portions of their livelihood portfolios dependon continued availability of these forests.
The point of departure to minimize these negative trade-offsmust begin with a shift from seeing forests as unproductiveidle land to a vision of forests as occupied, supportive of rurallivelihoods, and providers of important environmentalservices. This need not impede the flow of economic benefitsfrom oil palm. Plantation development should continue, but itshould focus on nonforest land, which is abundant inIndonesia. It should also involve smaller concession areas andrelease land gradually to allow for more effective monitoringof plantation development and EIA management practices.
CONCLUSION: GOVERNING OIL PALM IMPACTSBy assessing the environmental and socioeconomic impactsof palm plantations associated with bioenergy production inIndonesia, we have examined options to minimize the negativeimpacts while maximizing the potential for social andeconomic benefits. We present several recommendations forgovernment, industry leaders, and civil society organizations:
Channel future development into nonforest landMost negative environmental trade-offs stem from thefundamental undervaluation of the forest in Indonesia as aneconomic asset. Voluntary or mandatory carbon sequestrationschemes such as REDD (Reduced Emissions fromDeforestation and Degradation) may make it possible in futurefor greater economic appreciation of forest as a nonextractiveresource. For this option to succeed, government plannersmust take steps to reconcile competing land use regimes inIndonesia and channel most future plantation developmentinto nonforest land. This requires extensive capacity buildingand applied work to formulate commonly agreed criteria andindicators for degraded land in Indonesia, identifyingdegraded nonforest land for plantation investments, andoffering appropriate incentives to encourage plantationinvestors to use make of degraded lands.
Map extent and distribution of degraded landAt least five different terms in Indonesia currently denotedegraded land (lahan kritis, lahan terlantar, lahan tidur, lahankosong, alang-alang). To complicate matters further, eachterm encompasses imprecise degrees of severity.Consequently, estimates of the total area of degraded land varyfrom 30 to 70 million ha. A commonly accepted definition ofdegraded land, accompanied by clearly specified criteria andindicators, is thus a critical issue. With such a definition inplace, the National Land Use Agency, Ministry of Forestry,and Ministry of Agriculture need to work with counterpartagencies in districts and provinces to map and assess the extentand distribution of degraded land in Indonesia.
Ecology and Society 17(1): 25http://www.ecologyandsociety.org/vol17/iss1/art25/
Assess life-cycle costs of plantationsOnce more is known about the extent, location, and availabilityof degraded land for investment, the Ministry of Finance andthe National Investment Board need to work with otherrelevant government agencies to assess necessary incentivesfor stimulating use of this land for economic purposes. Stillrelatively little is known about the actual financial andtechnical inputs needed to establish productive plantationestates on degraded land. Even less is known about how thesecosts evolve over the life cycle of oil palm plantations. Moreresearch is needed in this area to enable government policymakers to understand these issues better and structureappropriate incentives.
Make deforestation the exception to the ruleIt will not always be possible to avoid deforestation in thedevelopment of oil palm plantations. After all, it is legal inIndonesia to allocate areas within the Conversion Forest Zonefor clearing. However, deforestation should be an exceptionrather than the rule. Greater care should be taken to prioritizethe use of extensive areas of nonforest land. In this context, itis encouraging that the Government of Indonesia has recentlytaken steps to limit the release of forested land for plantations,instead encouraging investors to use land without forest cover(Kompas 2011).
Enforce regulations and standardsGovernment authorities must also ensure that companiesadhere to relevant legal, environmental, and managementstandards. This will not be easy because poor law enforcementis a recurring problem in the plantations sector leading towidespread infractions. Most oil palm plantations in CentralKalimantan Province are technically illegal because theyeither do not possess the plantation business license (HGU,‘Hak Guna Usaha’) or have not secured the permit from theMinistry of Forestry in Jakarta for the release of forested landfor clear-cuts (Kompas 2010b). At the very least, stricterchecks of EIA implementation should be emphasized tosupport the current two-year moratorium on forest conversion.
Monitor and mediate community-company negotiationsmore activelyGiven livelihood changing implications of oil palm forcustomary communities and frequent conflict, plantationinvestments must be built on legally binding contracts betweeninvestors and local community landowners. This means thatlocal government agencies must monitor and mediatecommunity-company negotiations of land transfer moreactively. Once negotiations are successfully completed, thegovernment should release the land gradually, making theavailability of additional land for plantations contingent uponsatisfactory development of oil palm on the first concession.This will reduce the incentives for timber- oriented business,land banking, and speculation, encouraging participation bylegitimate oil palm plantation entrepreneurs.
Adhere to industry standardsOil palm sector supervisory organizations such as GAPKI(Indonesian Association of Oil Palm Companies) should alsopurse broader adherence and implementation of relevant codesof conduct or industry standards to improve plantationmanagement practices among oil palm growers. The mostreadily available mechanisms are the recently introducedISPO (Indonesia Sustainable Palm Oil) and RSPO(Roundtable on Sustainable Palm Oil) standards. Seriousimplementation of either standard should help plantationcompanies progress significantly toward sustainableplantation practices.
Monitor enforcement of labor regulationsIn terms of socioeconomic benefits, oil palm plantationsundoubtedly improve income among certain groups ofstakeholders. The plantations also generate opportunities foremployment and lead to improved public infrastructure.However, in many cases, oil palm plantations fail to deliverthese benefits to a sufficiently large spectrum of actors. Thosebenefitting most are individuals with some prior experience,knowledge, or skills associated with oil palm, cash crops, orother plantations estates. Those who should gain the most, forexample, unskilled workers, local landowners, and remoteindigenous communities, are unable to reap significantbenefits. Unskilled workers receive minimal compensationand must seek complementary income-generating activitieson their own. Local landowners end up with a shrinkingcommunal land base, limited compensation for land releasedfor plantations, increasing time and labor investment neededto collect forest resources, and very few plantations jobs. It isimperative, therefore, that government institutions and civilsociety organizations push for better monitoring andenforcement of existing labor regulations in the plantationsector.
Strengthen customary land rightsAmong key unresolved issues in Indonesia’s oil palm sectoris the lack of legal recognition of customary land rights. Thefailure to recognize the traditional land use/ownerships systemresults in persistent conflicts. Customary landowners in allresearch sites are mostly native communities dependent onforests and other natural resources for their livelihoods, andtherefore unaccustomed to intensive farming practices.Inability to adapt to the changing legal and economicenvironment renders these groups susceptible to negativeimpacts of oil palm development, e.g., economicmarginalization and damage to resources upon which theirlivelihoods depend. As a result, it is critical that the Ministriesof Forestry, Agriculture, and Land Use Planning produceoptions to strengthen customary land rights in Indonesia. Thisis important not only for oil palm but also for REDD and othereconomic sectors and conservation initiatives.
Ecology and Society 17(1): 25http://www.ecologyandsociety.org/vol17/iss1/art25/
Responses to this article can be read online at:http://www.ecologyandsociety.org/vol17/iss1/art25/responses/
Acknowledgments:
This paper has been produced with the financial assistance ofthe European Union, under a project entitled, ‘Bioenergy,sustainability and trade-offs: Can we avoid deforestationwhile promoting bioenergy?’ Additional funding were alsoprovided by CGIAR System wide on Collective Action andProperty Rights (CAPRi) and Cordaid. The objective of theproject is to contribute to sustainable bioenergy developmentthat benefits local people in developing countries, minimizesnegative impacts on local environments and rural livelihoods,and contributes to global climate change mitigation. Theproject is managed by Center for International ForestryResearch and implemented in collaboration with the Councilon Scientific and Industrial Research (South Africa),Joanneum Research (Austria), the Universidad Autónoma deMéxico, and the Stockholm Environment Institute. The viewsexpressed herein can in no way be taken to reflect the officialopinion of the European Union and other donors. The authorswould like to thank our project partners: Gusti Z. Anshari ofCenter for Wetlands People and Biodiversity of TanjungpuraUniversity in Pontianak, West Kalimantan; Max Tokede ofPapua State University in Manokwari, West Papua;BarnabasF Sedik of District Forestry Office of Boven Digoel, Papuaand Habel Waridjo of District Agriculture Office of BovenDigoel, Papua for their kind collaboration on the project. Weare also grateful to all staff affiliated with these institutions,who have taken part in field surveys, and to respondents fromcommunities and oil palm companies. The authors would alsolike to thank the reviewers, especially Andrew Wardell,Director of CIFOR Forests and Governance Programme,Laura German and George Schoneveld for their candidassessment of earlier drafts of this paper.
LITERATURE CITEDAgroIndonesia. 2010. Tak Mudah Bangun ‘Food Estate’. [Itis not easy to establish food estates]. AgroIndonesia, 24 March.[online] URL: http://agroindonesia.co.id/2010/03/24/tak-mudah-bangun-%E2%80%98food-estate%E2%80%99/
Basiron, Y. 2007. Palm oil production through sustainableplantations. European Journal of Lipid Science Technology 109:289-295. http://dx.doi.org/10.1002/ejlt.200600223
Beaton, C., and L. Lontoh. 2010. Lessons learned fromIndonesia’s attempts to reform fossil-fuel subsidies. International Institute for Sustainable Development,Winnipeg, Manitoba, Canada.
Beyond Petroleum. 2010. BP statistical review of worldenergy. British Petroleum, London, UK. [online] URL: http://www.bp.com/liveassets/bp_internet/globalbp/globalbp_uk_english/
reports_and_publications/statistical_energy_review_2008/STAGING/local_assets/2010_downloads/statistical_review_of_world_energy_full_report_2010.pdf
Biodiesel Magazine Editorial Staff. 2010. Global biodieselproduction and market report. Biodiesel Magazine, 01September. [online] URL: http://www.biodieselmagazine.com/articles/4447/global-biodiesel-production-and-market-report
Bringezu, S., H. Schutz, M. O’Brien, L. Kauppi, R. W.Howarth, and J. McNeely. 2009. Towards sustainableproduction and use of resources: assessing biofuels. UnitedNations Environment Programme, Nairobi, Kenya.
Bromokusumo, A. K. 2009. Indonesia: biofuels annual report2009. USDA Foreign Agricultural Service, Washington, D.C., USA. [online] URL: http://gain.fas.usda.gov/Recent%20GAIN%20Publications/General%20Report_Jakarta_Indonesia_6-1-2009.pdf
Bromokusumo, A. K., and J. P. Slette. 2010. Indonesia:oilseeds and products 2010. USDA Foreign AgriculturalService, Washington, D.C., USA. [online] URL: http://gain.fas.usda.gov/Recent%20GAIN%20Publications/Oilseeds%20and%20Products%20Annual_Jakarta_Indonesia_3-18-2010.pdf
Brown, E., and M. Jacobson. 2005. Cruel oil: how palm oilharms health, rainforest and wildlife. Center for Science inthe Public Interest, Washington, D.C., USA.
Bunyamin, B. 2008. Dampak pengembangan PIR kelapa sawitterhadap perekonomian regional Kalimantan Barat. [Impactsof oil palm plantations on the regional economy of WestKalimantan region]. Untan Press, Pontianak, Indonesia.
Business Wire. 2007. Biofuel goes big with Indonesia’s $12billion investments including over $5 billion from China.Business Wire, 12 January. [online] URL: http://www.businesswire.com/news/home/20070112005168/en/Biofuel-Big-Indonesias-12-Billion-Investments-Including
Caroko, W., H. Komarudin, K. Obidzinski, and P. Gunarso.2011. Policy and institutional frameworks for the developmentof palm oil-based biodiesel in Indonesia. Working Paper No.62. Center for International Forestry Research, Bogor,Indonesia.
Casson, A. 2000. The hesitant boom: Indonesia’s oil palm sub-sector in an era of economic crisis and political change. Occasional Paper No. 29. Center for International ForestryResearch, Bogor, Indonesia.
Casson, A. 2002. The political economy of Indonesia’s oilpalm sub-sector. Pages 221-245 in C. J. P. Colfer and I. A. P.Resosudarmo, editors. Which way forward? People, forestsand policy making in Indonesia. Resources for the Future,Washington, D.C., USA.
Casson, A., L. Tacconi, K. Deddy. 2007. Strategies to reducecarbon emissions from the oil palm sector in Indonesia.
Ecology and Society 17(1): 25http://www.ecologyandsociety.org/vol17/iss1/art25/
Working Paper No. 62. Center for International ForestryResearch, Bogor, Indonesia.
Colchester, M. 2010. Land acquisition, human rightsviolations, and indigenous peoples on the palm oil frontier. Forest Peoples Programme, Moreton-in-Marsh, UK.
Colchester, M., and S. Chao, editors. 2011. Oil palm expansionin South East Asia: trends and implications for localcommunities and indigenous peoples. Forest PeoplesProgramme, Moreton-in-Marsh, UK.
Colchester, M., N. Jiwan, Andiko, M. Sirait, A. Y. Firdaus,A. Surambo, and H. Pane. 2006. Promised land: palm oil andland acquisition in Indonesia: implications for localcommunities and indigenous peoples. Forest PeoplesProgramme and Perkumpulan Sawit Watch, Moreton-in-Marsh, UK and Bogor, Indonesia. [online] URL: http://www.forestpeoples.org/sites/fpp/files/publication/2010/08/promisedlandeng.pdf
Cotula, L., N. Dyer, and S. Vermeulen. 2008. Fuellingexclusion? The biofuels boom and poor people’s access toland. Food and Agriculture Organization and InternationalInstitute for Environment and Development, London, UK.
Danielsen, F., H. Beukema, N. D. Burgess, F. Parish, C. A.Brühl, P. F. Donald, D. Murdiyarso, B. Phalan, L. Reijnders,M. Struebig, and E. B. Fitzherbert. 2008. Biofuel plantationson forested lands: double jeopardy for biodiversity andclimate. Conservation Biology 23(2):348-358. http://dx.doi.org/10.1111/j.1523-1739.2008.01096.x
Dillon, H. S., T. Laan, and H. S. Dillon. 2008. Biofuel at whatcost? Government support for ethanol and biodiesel inIndonesia. Global Subsidies Initiative-International Institutefor Sustainable Development, Geneva, Switzerland.
Dinas Perkebunan Kalimantan Barat (Disbun Kalbar). 2010.Perkembangan perizinan perusahaan perkebunan besar diKalimantan Barat (keadaan s/d Desember 2009). [Development of large-scale estate crop plantation companiesin West Kalimantan province as of December 2009]. EstateCrops Agency of West Kalimantan Province, Pontianak,Indonesia.
Down To Earth. 2007. New investment law is not pro-poor.Down to Earth, No. 73 May. [online] URL: http://dte.gn.apc.org/73.pdf
Dudgeon, D., A. H. Arthington, M. O. Gessner, Z.-I.Kawabata, D. J. Knowler, C. Lévêque, R. J. Naiman, A.-H.Prieur-Richard, D. Soto, M. L. J. Stiassny, and C. A. Sullivan.2006. Freshwater biodiversity: importance, threats, status, andconservation challenges. Biological Reviews of the CambridgePhilosophical Society 81:163-182. http://dx.doi.org/10.1017/S1464793105006950
Emerging Markets Online. 2008. Biodiesel 2020: globalmarket survey, feedstock trends and forecasts. EmergingMarkets Online, Houston, Texas, USA. [online] URL: http://www.emerging-markets.com/biodiesel/
European Union (EU). 2006. An EU strategy for biofuels:communication from the Commission. European Commission,Brussels, Belgium.
Fargione, J., J. Hill, D. Tilman, S. Polasky, and P. Hawthorne.2008. Land clearing and the biofuel carbon debt. Science 319(5867):1235-1238. http://dx.doi.org/10.1126/science.1152747
Feintrenie, L., W. K. Chong, and P. Levang. 2010. Why dofarmers prefer oil palm? Lessons learnt from Bungo district,Indonesia. Small-Scale Forestry 9(3):379-396. http://dx.doi.org/10.1007/s11842-010-9122-2
Fitzherbert, E. B., M. J. Struebig, A. Morel, F. Danielsen, C.A. Brühl, P. F. Donald, and B. Phalan. 2008. How will oilpalm expansion affect biodiversity? Trends in Ecology &Evolution 23(10):538-545. http://dx.doi.org/10.1016/j.tree.2008.06.012
Food and Agriculture Organization of the United Nations(FAO). 2008a. Biofuels: prospects, risks and opportunities. FAO, Rome, Italy.
Food and Agriculture Organization of the United Nations(FAO). 2008b. Bioenergy, food security and sustainability:towards an international framework. Paper presented at theHigh-Level Conference on World Food Security: TheChallenges of Climate Change and Bioenergy, 3-5 June, FAO,Rome, Italy. [online] URL: http://www.fao.org/fileadmin/user_upload/foodclimate/HLCdocs/HLC08-inf-3-E.pdf
Food and Agricultural Policy Research Institute (FAPRI).2010. FAPRI 2010 U.S. and World Agricultural Outlook. FAPRI, Iowa State University, Ames, Iowa, USA. [online]URL: http://www.fapri.iastate.edu/outlook/2010/
Friends of the Earth Europe (FoE). 2010. Too green to be true:IOI Corporation in Ketapang District, West Kalimantan. Milieudefensie and Friends of the Earth Europe, Brussels,Belgium. [online] URL: http://www.foeeurope.org/publications/2010/Too_Green_to_be_True0310.pdf
Gibbs, H. K., A. S. Ruesch, F. Achard, M. K. Clayton, P.Holmgren, N. Ramankutty, and J. A. Foley. 2010. Tropicalforests were the primary sources of new agricultural land inthe 1980s and 1990s. Proceedings of the National Academyof Sciences of the United States of America 107(38):16732-16737. http://dx.doi.org/10.1073/pnas.0910275107
Gingold, B. 2010. Degraded land, sustainable palm oil, andIndonesia’s future. World Resources Institute, Washington, D.
Ecology and Society 17(1): 25http://www.ecologyandsociety.org/vol17/iss1/art25/
C., USA. [online] URL: http://www.wri.org/stories/2010/07/degraded-land-sustainable-palm-oil-and-indonesias-future
Hallam, D. 2009. International investments in agricultureproduction. Pages 27-38 in M. Kugelman and S. L. Levenstein,editors. Land grab? The race for the world’s farmland.Woodrow Wilson Center for Scholars, Washington, D.C.,USA.
Hartemink, A. E. 2006. Soil erosion: perennial cropplantations. Pages 1613-1617 in R. Lal, editor. Soil Science. Taylor & Francis, London, UK.
Henson, I. E. 2003. Oil palm: can it substitute the tropicalrainforest? Planter 79:437-450.
Hoh, R. 2009. Malaysia: biofuels annual report 2009. USDAForeign Agricultural Service, Washington, D.C., USA.[online] URL: http://gain.fas.usda.gov/Recent%20GAIN%20Publications/General%20Report_Kuala%20Lumpur_Malaysia_6-12-2009.pdf
Hunt, C. 2010. The costs of reducing deforestation inIndonesia. Bulletin of Indonesian Economic Studies 46(2):187-192. http://dx.doi.org/10.1080/00074918.2010.503563
Indonesia Forest Climate Alliance (IFCA). 2008. Reducingemissions from deforestation and forest degradation inIndonesia. The Ministry of Forestry, Jakarta, Indonesia.
International Centre for Trade and Sustainable Development(ICTSD). 2008. Biofuel production, trade and sustainabledevelopment: policy discussion paper. ICTSD, Geneva,Switzerland.
Ismail, M., and A. Rossi. 2010. A compilation of bioenergysustainability initiatives. Food and Agriculture Organizationof the United Nations, Rome, Italy.
Jelsma I., K. Giller, and T. Fairhurst. 2009. Smallholder oilpalm production systems in Indonesia: lessons from the NESPOphir Project. Report by the Plant Sciences Group,Wageningen University, Wageningen, The Netherlands.
Kaiser, E. 2011. Fuel subsidies, South East Asia’s ‘opium’habit, hard to break. Manila Bulletin, 31 May. [online] URL:http://www.mb.com.ph/articles/320579/fuel-subsidies-south-east-asias-opium-habit-hard-break
Kartodihardjo, H., and S. Supriono. 2000. The impact ofsectoral development on natural forest conversion anddegradation: the case of timber and tree crop plantations inIndonesia. Occasional Paper No. 26(E). Center forInternational Forestry Research, Bogor, Indonesia.
Koh, L. P., and D. S. Wilcove. 2008. Is oil palm agriculturereally destroying tropical biodiversity? Conservation Letters 1:60-64. http://dx.doi.org/10.1111/j.1755-263X.2008.00011.x
Kompas. 2010a. 1,7 Juta hektar sawit di lahan gambut. [1.7million ha of oil palm plantation in peatland]. Kompas, 9September. [online] URL: http://nasional.kompas.com/read/2010/09/09/02453534/
Kompas. 2010b. Perkebunan Sawit Tanpa Izin Marak. [Oilpalm plantations without permits rife]. Kompas, 22 February.[online] URL: http://female.kompas.com/read/2010/02/22/03254493/perkebunan.sawit.tanpa.izin.marak
Kompas. 2011. Izin Pelepasan Hutan untuk PerkebunanDihentikan. [Release of the state forestland for plantationsceased]. Kompas, 13 July.
Lacey, T. 2009. Biofuels: Indonesian dilemma. Asia Sentinel, 30 January. [online] URL: http://www.asiasentinel.com/index.php?option=com_content&task=view&id=1694&Itemid=426
Laksono, P. M., A. Rianti, A. Hendrijani, B. Gunawan, A.Mandacan, and M. Mansoara. 2001. Igya Ser HanjopMasyarakat Arfak dan Konsep Konservasi. [Igya Ser Hanjop:a conservation concept of Arfak Community]. KEHATI,PSAP-UGM, YBLBC. Yogyakarta, Indonesia.
Mansoeben, J. R. 1995. Sistem politik tradisional di Irian Jaya,Indonesia. [The traditional political system in Irian Jaya,Indonesia]. Lembaga Ilmu Pengetahuan Indonesia dan RIJKSUniversiteit te Leiden, Jakarta, Indonesia.
Marti, S. 2008. Losing ground: the human rights impacts ofoil palm plantation expansion in Indonesia. Friends of theEarth, Life Mosaic and Sawit Watch, London, UK.
McCarthy, J. F., 2010. Processes of inclusion and adverseincorporation: oil palm and agrarian change in Sumatra,Indonesia. Journal of Peasant Studies 37(4):821-850. http://dx.doi.org/10.1080/03066150.2010.512460
McCarthy, J. F., and R. A. Cramb. 2009. Policy narratives,landholder engagement, and oil palm expansion on theMalaysian and Indonesian frontiers. Geographical Journal 175(2):112-113. http://dx.doi.org/10.1111/j.1475-4959.2009.00322.x
Ministry of Agriculture. 2011. Statistik Perkebunan2008-2010. [Tree Crop Estate Statistics 2008-2010].Directorate General of Estate Crops, Ministry of Agriculture,Jakarta, Indonesia.
Ministry of Energy and Mineral Resources. 2006. BlueprintPengembangan Bahan Bakar Nabati untuk PercepatanPengurangan Kemiskinan dan Pengangguran 2006-2025.[Blueprint for biofuel development to reduce poverty andunemployment 2006-2025]. Ministry of Energy and MineralResources, Jakarta, Indonesia.
Ecology and Society 17(1): 25http://www.ecologyandsociety.org/vol17/iss1/art25/
Ministry of Environment. 2009. Report on the convention onbiological diversity (the fourth national report). Ministry ofEnvironment, Jakarta, Indonesia.
Orth, M. 2007. Subsistence foods to export goods: the impactof an oil palm plantation on local food sovereignty NorthBarito, Central Kalimantan, Indonesia. Sawit Watch, Bogor,Indonesia.
Oxfam. 2008. Another inconvenient truth: how biofuelpolicies are deepening poverty and accelerating climatechange. Oxfam Briefing Paper. Oxfam, Oxford, UK.
PEACE. 2007. Indonesia and climate charge: current statusand policies. PEACE, Jakarta, Indonesia. [online] URL: http://siteresources.worldbank.org/INTINDONESIA/Resources/Environment/ClimateChange_Full_EN.pdf
Pertamina. 2011. Kepastian Pembelian Biofuel OlehPertamina. [Assurances of the purchase of biofuels byPertamina]. Pertamina, Jakarta, Indonesia. [online] URL: http://www.kadin-indonesia.or.id/doc/energy/9%20-%20Presentasi%20Biofuel%20(Pertamina).pdf
Potter, L., and J. Lee. 1998. Tree planting in Indonesia: trends,impacts and directions. Occasional Paper No. 18. Center forInternational Forestry Research, Bogor, Indonesia.
Reinhardt, G., N. Rettenmaier, S. Gärtner, and A. Pastowski.2007. Rain forest for biodiesel? Ecological effects of usingpalm oil as a source of energy. WWF, Frankfurt, Germany.
Sandker, M., A. Suwarno, and B. M. Campbell. 2007. Willforests remain in the face of oil palm expansion? Simulatingchange in Malinau, Indonesia. Ecology and Society 12(2): 37.[online] URL: http://www.ecologyandsociety.org/vol12/iss2/art37/
Schwarz, A. 2010. Low carbon growth in Indonesia. Bulletinof Indonesian Economic Studies 46(2):181-185. http://dx.doi.org/10.1080/00074918.2010.503562
Sheil, D., A. Casson, E. Meijaard, M. van Nordwijk, J. Gaskell,J. Sunderland-Groves, K. Wertz, and M. Kanninen. 2009. Theimpacts and opportunities of oil palm in Southeast Asia: whatdo we know and what do we need to know? Occasional PaperNo. 51. Center for International Forestry Research, Bogor,Indonesia.
Sirait, M. 2009. Indigenous peoples and oil palm plantationexpansion in West Kalimantan, Indonesia. Universiteit vanAmsterdam, The Hague, the Netherlands.
Slette, J. P., and I. E. Wiyono. 2011. Oilseeds and productsupdate 2011. USDA Foreign Agricultural Service,Washington, D.C., USA. [online] URL: http://www.usdaindonesia.org/public/uploaded/Oilseeds%20and%20Products%20Update_Jakarta_Indonesia_1-28-2011.pdf
Suebu, B. 2009. A global solution: building a low-carboneconomy for Papua province, Indonesia. Papua ProvincialGovernment, Jayapura, Indonesia.
Telapak. 2000. Planting disaster: biodiversity, socialeconomy, and human rights issues in large-scale oil palmplantation in Indonesia. Telapak Indonesia, Bogor, Indonesia.
Teoh, C. H. 2010. Key sustainability issues in the palm oilsector: a discussion paper for multi-stakeholdersconsultations. World Bank Group, Washington D.C., USA.
Tim Nasional Pengembangan Bahan Bakat Nabati (TimnasBBN). 2007. Bahan Bakar Nabati: Bahan Bakar Alternatifdari Tumbuhan sebagai Pengganti Minyak Bumi dan Gas.[Biofuels: renewable fuels as an alternative to oil and gas].Penebar Swadaya, Jakarta, Indonesia.
United States Geological Survey (USGS). 2011. Landsatarchive. USGS, Sioux Falls, South Dakota, USA. [online]URL: http://glovis.usgs.gov/
USAID. 2009. Kebijakan umum provinsi Papua untukmempromosikan penanaman modal di bidang bahan bakarnabati (BBN). [The policy and regulatory framework in Papuato promote investment in biofuels]. USDA EnvironmentalService Program, Jakarta, Indonesia.
Wakker, E. 2005. Greasy palms: the social and ecologicalimpacts of large-scale oil palm plantation development inSoutheast Asia. Friends of the Earth, London, UK.
World Bank. 2010. Environmental, economic, and socialimpacts of oil palm in Indonesia: a synthesis of opportunitiesand challenges. Discussion Paper. World Bank, WashingtonD.C., USA.
Yaap, B., M. J. Struebig, G. Paoli, and L. P. Koh. 2010.Mitigating the biodiversity impacts of oil palm development.CAB Reviews: Perspectives in Agriculture, VeterinaryScience, Nutrition and Natural Resources 5(019):1-11. http://dx.doi.org/10.1079/PAVSNNR20105019
Zakaria, A., C. Theile, and L. Khaimur. 2007. Policy, practice,pride and prejudice: review of legal, environmental and socialpractices of oil palm plantation companies of the WilmarGroup in Sambas District, West Kalimantan (Indonesia). Friends of the Earth Netherlands, Lembaga Gemawan, andKONTAK Rakyat Borneo, Amsterdam, the Netherlands.
Zimmer-Tamakoshi, L. 1997. The last big man: developmentand men’s discontents in the Papua New Guinea highlands.Oceania 68(2):107-122. [online] URL: http://www.jstor.org/stable/40331612