environmental adaptation and stability relationships between grain yield and some agronomic traits...
TRANSCRIPT
J. Agronomy & Crop Science 170, 128—135 (1993)© 1993 Paul Parey Scientific Publishers, Berlin and HamburgISSN 0931-2250
Department of Field Crops, Faculty of Agriculture, University of Ankara, Ankara, Turkey
Environmental Adaptation and Stability Relationshipsbetween Grain Yield and some Agronomic Traits in Winter Oat
M. OZGEN
Author's address: Assoc. Prof. Dr. MURAT OzGEN, University of Ankara, Faculty of Agriculture, Depart-ment of Field Crops. 06110 Di§kapi, Ankara, Turkey.
With 5 figures and 4 tables
Received June 11, 1992; accepted September 19, 1992
Abstract
This study was conducted to determine the stability of grain yield, harvest index, plant height, and paniclelength and to determine the association of grain yield with these traits in winter white oat (Avena sativa L.)genotypes. The genotypes were grown in replicated tests in Ankara in 1985—1991. Each experiment year wasregarded as an environment, and entry mean of each year was used as the environmental index. Stabilityparameters were estimated from the regression analysis as linear regression coefficient (b), deviations fromregression (S'd) and coefficient of determination (r^).
Genotypes differed significantly for all traits and significant genotypes x environment interactionsoccurred for these traits. On the basis of estimates of stability parameters, A-24 genotype was stable for grainyield. Correlation coefficients between traits were inconsistent in good and poor environments exceptbetween grain yield and panicle length. The study suggested that these traits are differently affected byenvironmental changes and selection for panicle length might be effective as selection for grain yield inimproving oats with high grain yield for diverse environments.
Key words: Avena sativa L., oat, stability, adaptation, repeatability, stability parameters.
Introduction
Interactions between genotype and environ-ment are of major concern to plant breeders fordeveloping improved cultivars. New cultivarsshould have stable performance. As SHARMA etal. (1987) stated, the presence of genotype Xenvironment interactions reduces the correla-tions between phenotype and genotype, andmakes it difficult to judge the genetic potentialof a genotype.
Although the existence of the correlationbetween the genotype and environment wasknown since many years, YATES and COCHRAN
(1938) were the first ones to put forward thatthe correlations could be determined statisti-cally by making use of regression analysis.Later modified by FINLAY and WILKINSON
(1963), EBERHART and RUSSELL (1966), and PER-
KINS and JINKS (1968). FINLAY and WILKINSON
(1963) used as an adaptation criterion of geno-types, linear regression of each genotype on anenvironmental index that is determined by themean performance of all genotypes grown ineach environment. This method was developedby EBERHART and RUSSELL (1966) who added anextra parameter that measures the deviationfrom linear regression.
Stability parameters have been used differ-ently depending on the researchers in manycrops. JOHNSON et al. (1968) made use of re-gression analysis to determine general adapta-tion criteria of winter wheat cultivars and em-ployed average yield of each nursery as envi-ronmental index. BILBRO and RAY (1976) re-
U.S. Copyright Clearance Center Code Statement; 0931-2250/93/7002-0128$02.50/0
Environmental Adaptation and Stability Relationships 129
ported that regression coefficient was an im-portant criterion for the determination ofadaptability in cotton. But they preferred thecoefficient of determination to deviation fromregression because its easily calculated, inde-pendent of units of measure and easily inter-preted. LANGER et al. (1979) suggested that theregression coefficient was a measure of re-sponse to varying environments in oat varie-ties. BECKER et al. (1982) regarded deviationfrom regression to be the most appropriatecriterion for measuring phenotypic stability inan agronomic sense because this parametermeasures predictability of genetic reaction toenvironments in winter rye. LEON and BECKER
(1988) stated that in wheat, barley and oatsenvironmental variance (S^ could be made useof adaptation measure of genotype apart fromregression coefficient, whereas ecovalence val-ue (W) could be used in addition to coefficientof determination and deviation from regres-sion. OzGEN (1991 a and 1991 b), in addition tohigh yield, used regression coefficient as thecriterion of genotype's responsiveness to di-verse environments whereas determinationcoefficient and deviation from regression asstability parameters in winter wheat andbarley.
The present experiment involved a study ofadaptation and stability of grain yield, harvestindex, plant height and panicle length in a setof white oat {Avena sativa L.) cultivars andlines. Harvest index is the ratit) of grain yieldto total biomass yield (DONALD 1962), and isconsidered as a potential criterion in selectionindirectly for increased grain yield in cereals(RosiELLE and FREY 1975, NASS 1980). In earlierreported studies, selection for harvest indexover year was also no more effective thaneither direct selection (WHAN et al. 1981) orvisual selection (NASS 1983) for grain yield inwheat. On the other hand, SHARMA et al. (1987)suggested that harvest index and grain yieldwere significantly influenced by changes inenvironmental conditions and selection forgrain yield per se might be as effective asselection for harvest index in wheat in diverseenvironments. But, little information is avail-able on the stability of harvest index and yieldrelated traits as plant height and panicle lengthin winter oats.
The major objectives of this study were: i) todetermine the range of variability for grain
yield, harvest index, plant height and paniclelength, ii) to estimate the stability parametersfor these traits, iii) to identify superior oatcultivars or lines based on stability parameters,and iv) to determine the relationships betweengrain yield, harvest index, plant height, andpanicle length in the diverse environments.
Materials and Methods
The study were conducted at the Department ofField Crops, Faculty of Agriculture, in Ankara in1985—1991 period. In seven-year field trials, the 10winter white oat {A. sativa L.) cultivars {Ankara 76and Ankara 84) and lines {A-3, A-4, A-5, A-21, A-23,A-24 and A-25) were used. The genotypes have beendeveloped by pedigree and selection methods forCentral Anatolian conditions and have sufficientwinter hardiness for this region. Parents of the geno-types had been provided from various ecologicalregions of Turkey. These genotypes were chosenbecause they represented a range in grain yield po-tential, plant type and genetic background.
The field plot design was a randomized completeblock with three replications. Plot size was1.2 X 14 m = 16.S m". Seeding was made by plotdrill according to commercially recommended seed-ing rate in fall. The plots had a common bordersowing of an oat cultivar. Accepted cultural practicesand fertilizations were applied. At maturity, onesample consisting of a 1.0 m part of row was har-vested from the center of each plot with a hand sickle(20 mm aboveground level). The remainder of eachplot was harvested by a plot combine han'ester toobtain grain yield. Prior to har\'est, plant height andpanicle length were measured in each plot. Thesickle-harvested samples were dried in a greenhouseand biomass yield of each sample recorded. Afterthreshing, grain weight of individual samples wasalso recorded. The harvest index value for eachsample was calculated as the ratio of grain weight tobiomass weight X 100.
During the evaluation, linear regression coefficient(b) was considered to be a criterion of responsivenessindicating how cultivar yield and the other traitsresponds to varying environments while deviationfrom regression (S~d) and coefficient of determina-tion (r ) were considered as criteria of stability (FlN-LAY and WILKINSON 1963, EBERHART and RUSSELL1966, BILBRO and RAY 1976, TE[CH 1983). In thestudy, each experiment year was assumed as anenvironment and average value of each year was usedas an environmental index. The linear regressioncoefficient (b) of an entry mean on the average of allentries in the particular environment and other para-meters (S'd and r ) were estimated from the regres-sion analysis. Simple correlation coefficients were
130 OZGEN
calculated based on the mean values of environmentsfor each genotype.
Results and Discussion
According to analysis of variance, differencesamong genotypes for grain yield, harvest in-dex, plant height and panicle length were high-ly significant, Genotype x environment in-teractions were also statistically significant,which allowed evaluation of genotypes for sta-bility of performance across different environ-ments (Table 1).
Stability parameters were estimated by themethods described by FINLAY and WILKINSON
(1963), and EBERHART and RUSSELL (1966).These methods defined a stable cultivar as onewhich had a regression coefficient of 1.0, largedetermination coefficient and small deviationfrom regression. According to EBERHART andRUSSELL (1966), an ideal cultivar would haveboth a high average performance over a widerange of environments plus stability.
The regression coefficient (b) values of the10 genoc}'pes used in the study ranged differ-ently for all traits (Table 2). These variations inb values suggested that the 10 genotypes re-sponded differently to the different environ-ments. Variability among enyironments as animportant factor and in large part determinesthe usefulness of b values (PFAHLER and LINS-
KENS 1979). Statistically significant environ-mental effects indicated that variability of envi-ronments was large enough for a proper esti-mation of b values (Table 1). The coefficient ofdetermination (r") also ranged differently forall traits. FREY (1972) observed that grain yield
of oat isolines varied in b and S^d. EAGLES et al.(1977) suggested that regression coefficientsfor grain yield did not vary significantly, whilefor straw yield the lines converged at yieldlevels below those normally used for oats pro-duction.
Upon individual examination of adaptationand stability parameters for traits of genotypesit was established that seven-year averageyield, harvest index, plant height and paniclelength of all genotypes were 329 kg/da, %23.8, 92.8 cm and 23.3 cm, respectively. A-24,A-4, A-23 and A-22 showed the highest valuefor grain yield, har\^est index, plant height andpanicle length among the 10 genotypes, respec-tively. All traits were differently affected byenvironmental changes.
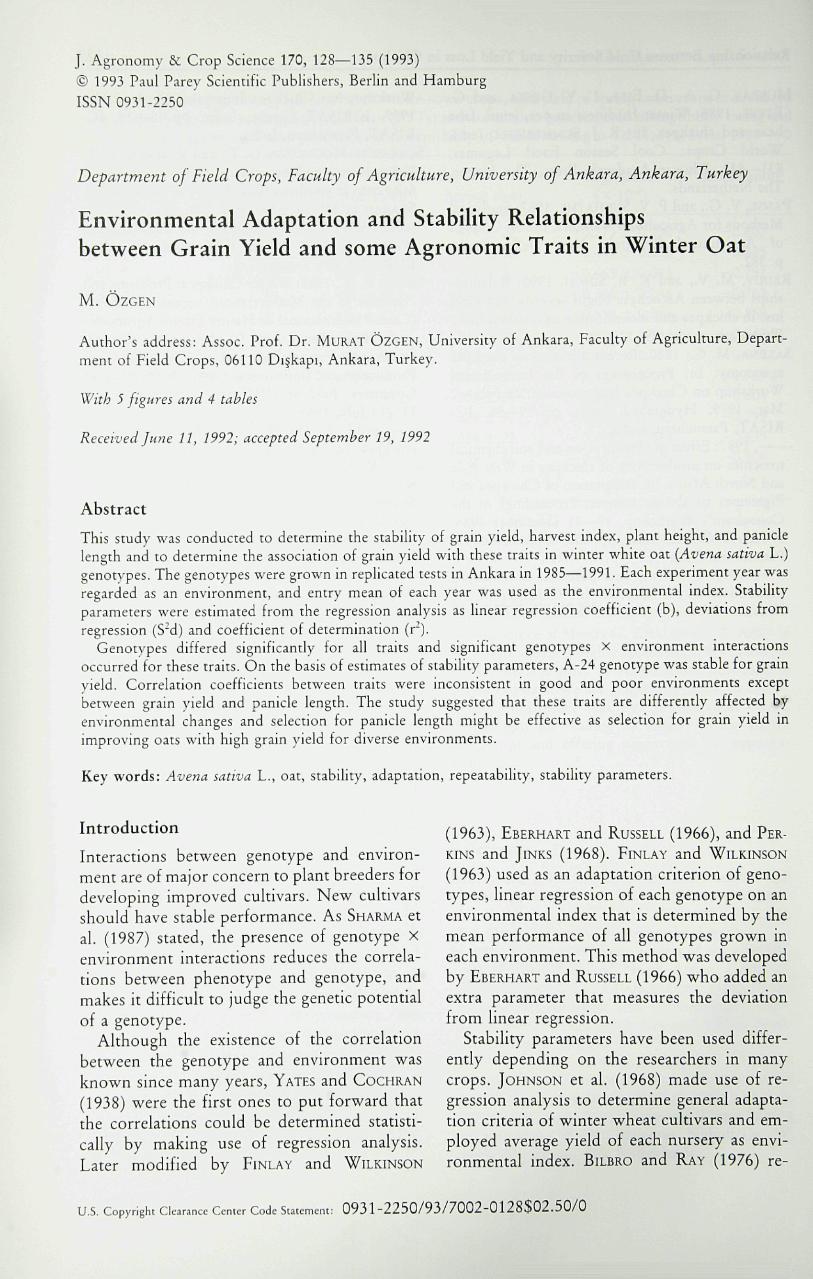
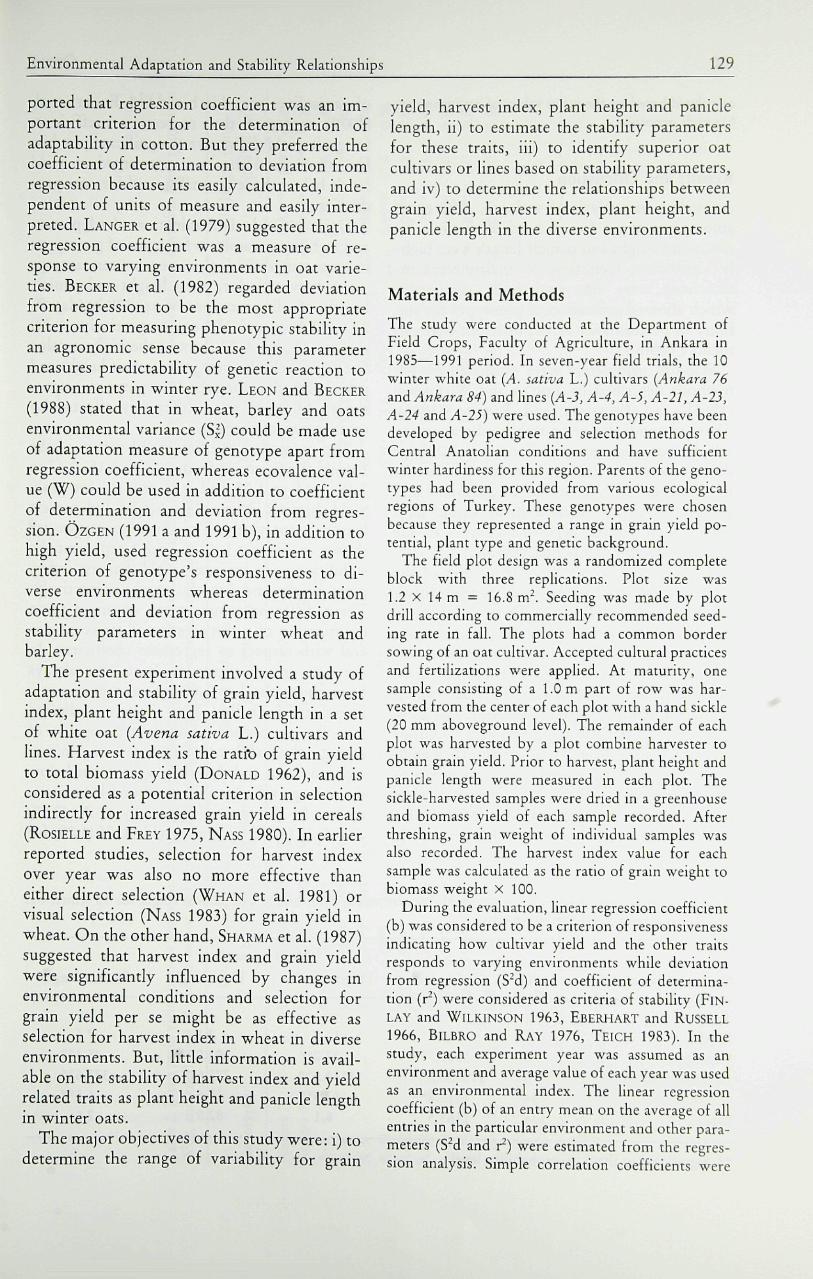
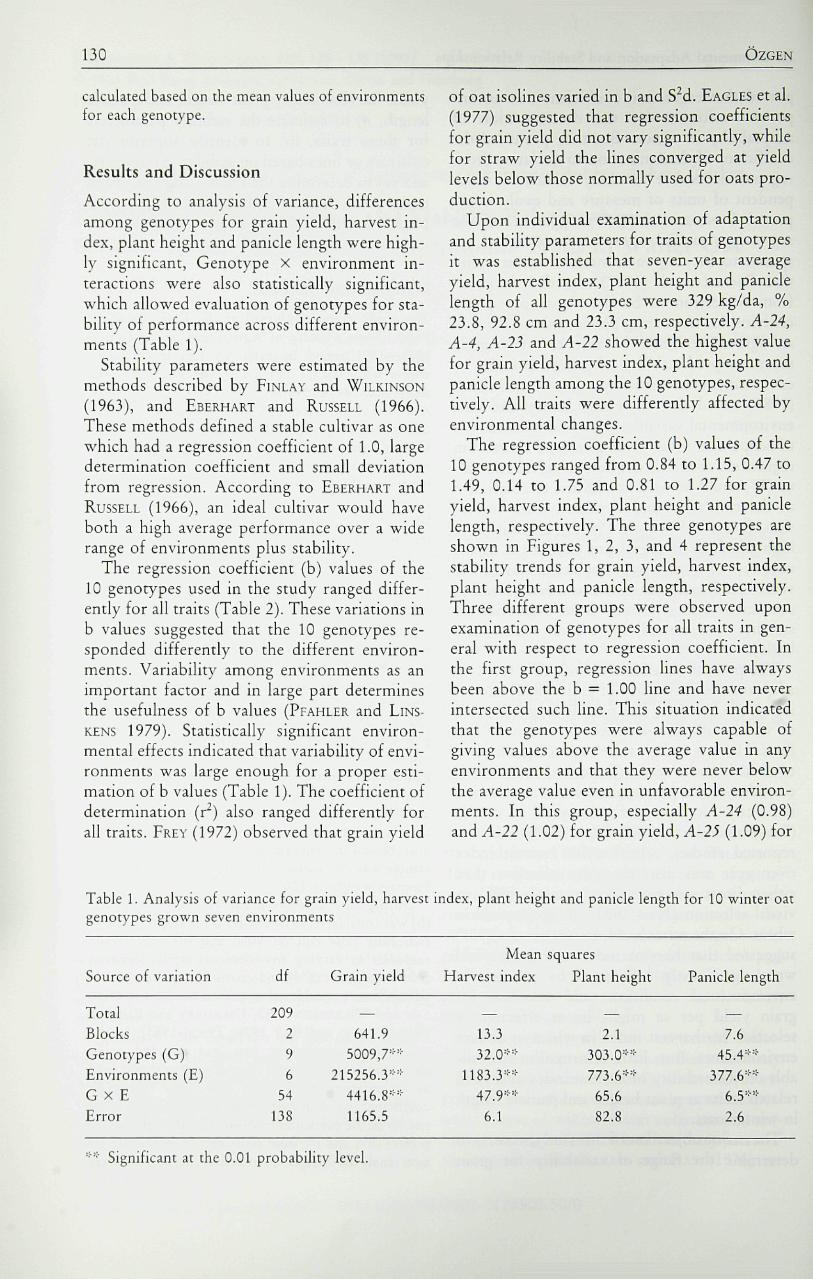
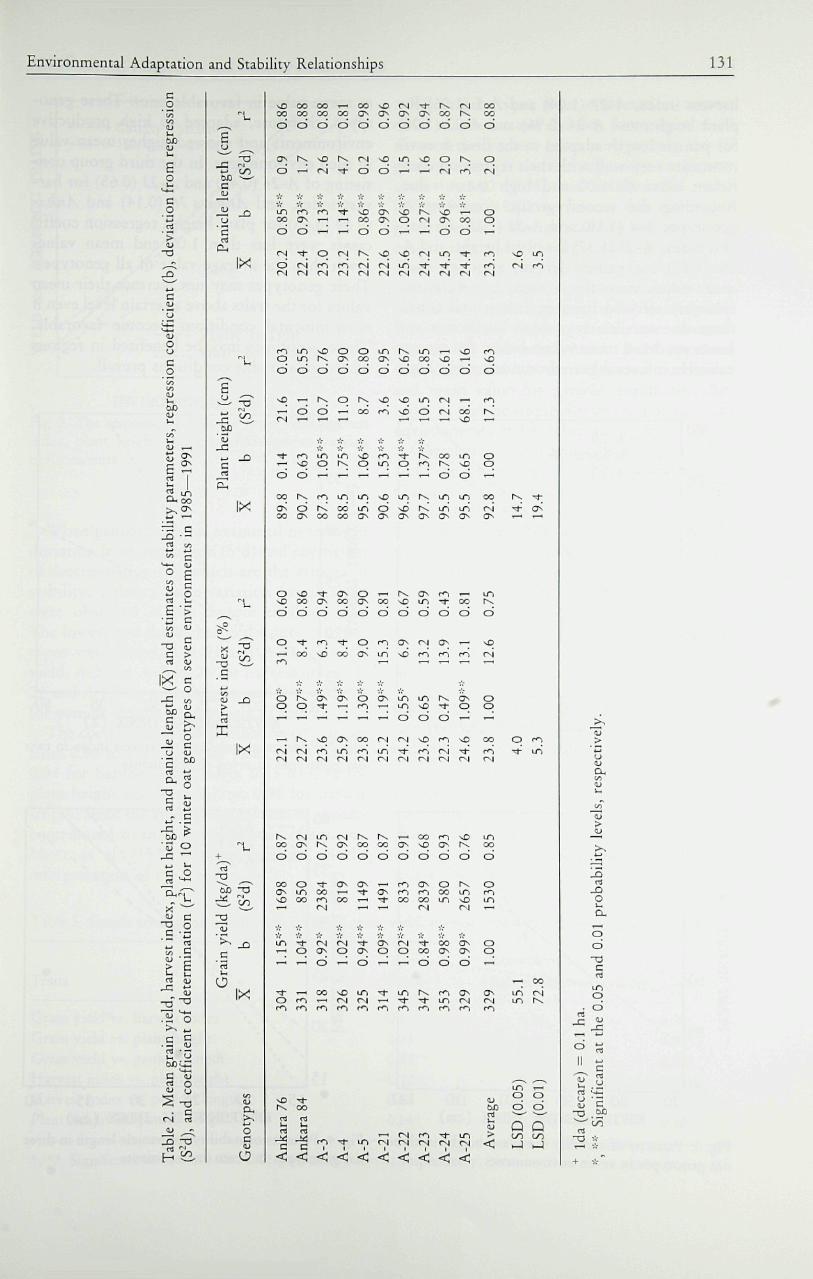
The regression coefficient (b) values of the10 genotypes ranged from 0.84 to 1.15, 0.47 to1.49, 0.14 to 1.75 and 0.81 to 1.27 for grainyield, harvest index, plant height and paniclelength, respectively. The three genotypes areshown in Figures 1, 2, 3, and 4 represent thestability trends for grain yield, harvest index,plant height and panicle length, respectively.Three different groups were observed uponexamination of genotypes for all traits in gen-eral with respect to regression coefficient. Inthe first group, regression hnes have alwaysbeen above the b = 1.00 line and have neverintersected such line. This situation indicatedthat the genotypes were always capable ofgiving values above the average value in anyenvironments and that they were never belowthe average value even in unfavorable environ-ments. In this group, especially A-24 (0.98)and A'22 (1.02) for grain yield, A-23 (1.09) for
Table 1. Analysis of variance for grain yield, harvest index, plant height and panicle length for 10 winter oatgenotypes grown seven environments
Source of variation df Gram yieldMean squares
Har\^est index Plant height Panicle length
TotalBlocksGenotypes (G)Environments (E)G X EError
209296
54138
—641.9
5009,7---==-
215256.3'-^'^
4416.8'^'-
1165.5
—13.3
32.0=- =
1183.3=^='-
47.9--=^
6.1
—2.1
303.0
771>,(3
65.682.8
7.6
2.6
'••"'•• Significant at the 0.01 probability level.
Environmental Adaptation and Stabihty Relationships 131
to
^^ c
3 ch* Ort k.4
E •>
C >rt u
ci.
0 0
o
C un O
B
u
"5rt
IX
rt
IX
ocO
CO
O O O O O O O O O O O
ON
o
in00
—' (1
ON ^
~t- o
^ OO
o
ONON
Ln
o tN
O
.96=
OO
o
.00
o o O O '—''—' O O '—'
d d d c D o c D c i d d o d
CO
o o — — — —— —
O rs| CO r-.!
o o
Oo
(NON
o o o o o o o o o o o
OO
r s | r s |
OO
o
1698
oo
850
in
o
2384
o'o
CO
o
1149
CO
o
1491
ON
o
833
CO
o
2839
ON
o
580
o
2657
OO
o
1530
r s i f ^ i - ^ - O N r - | T j - o o O N CDO N O O N O O C O O N O N O
d - ^ d — ~ ^ c > d d —
o \O in
ON
inod• • —
Q
po..Q
ex
rt
O
o,pd
p
d
+ *
132 OzGEN
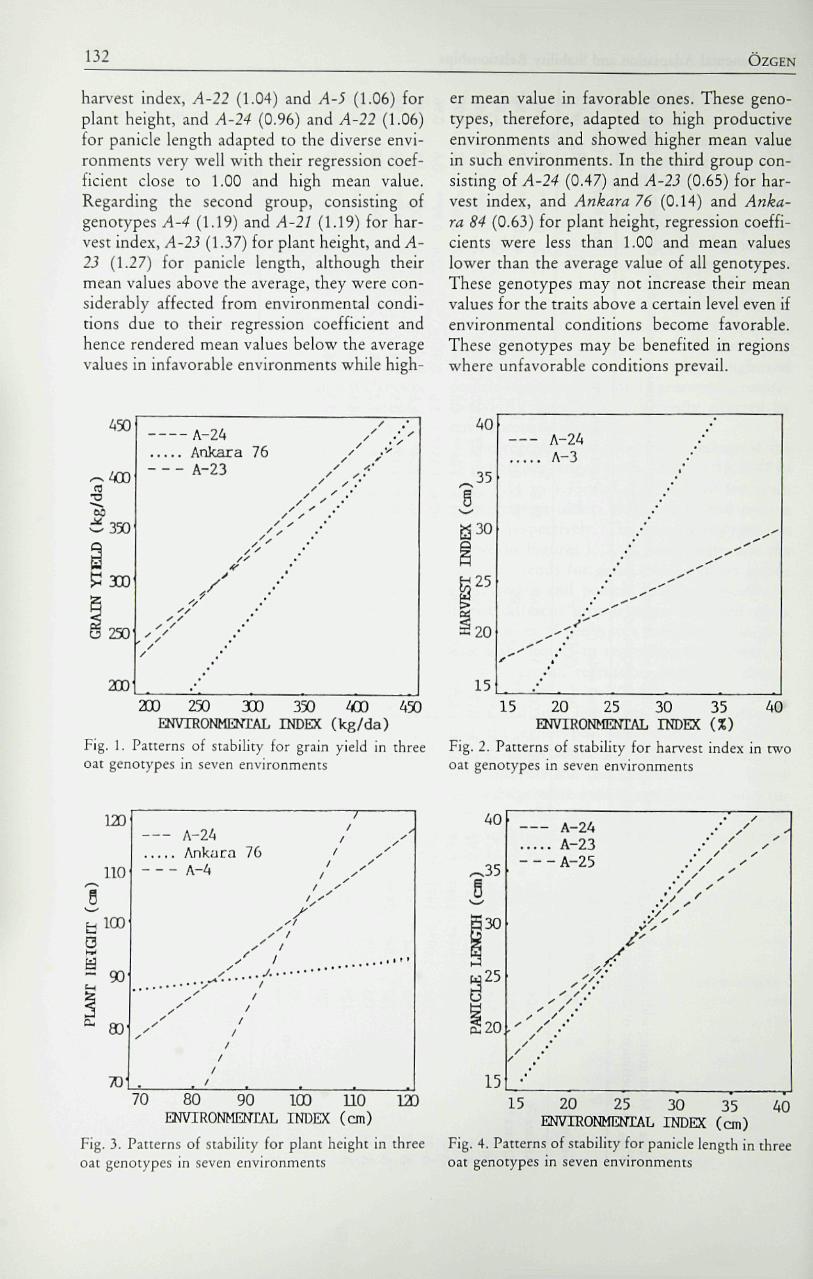
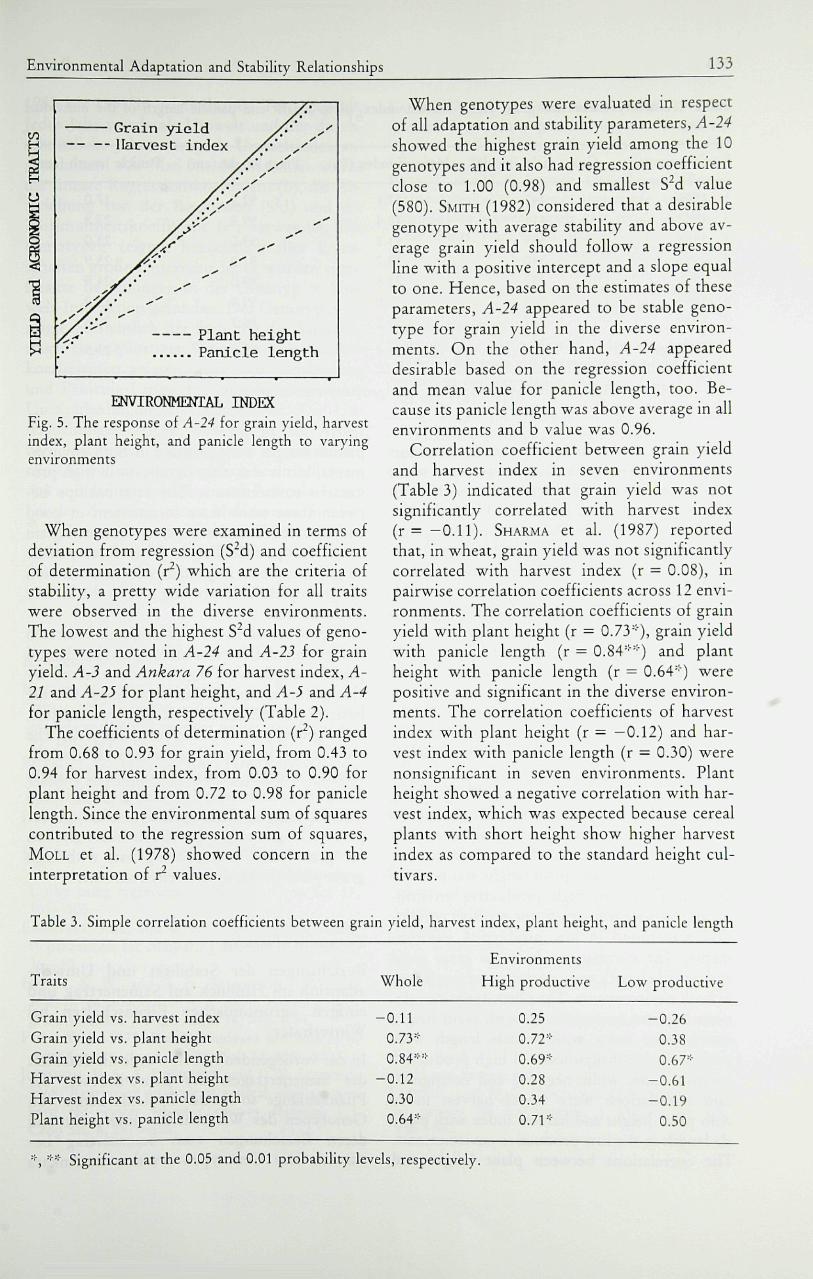
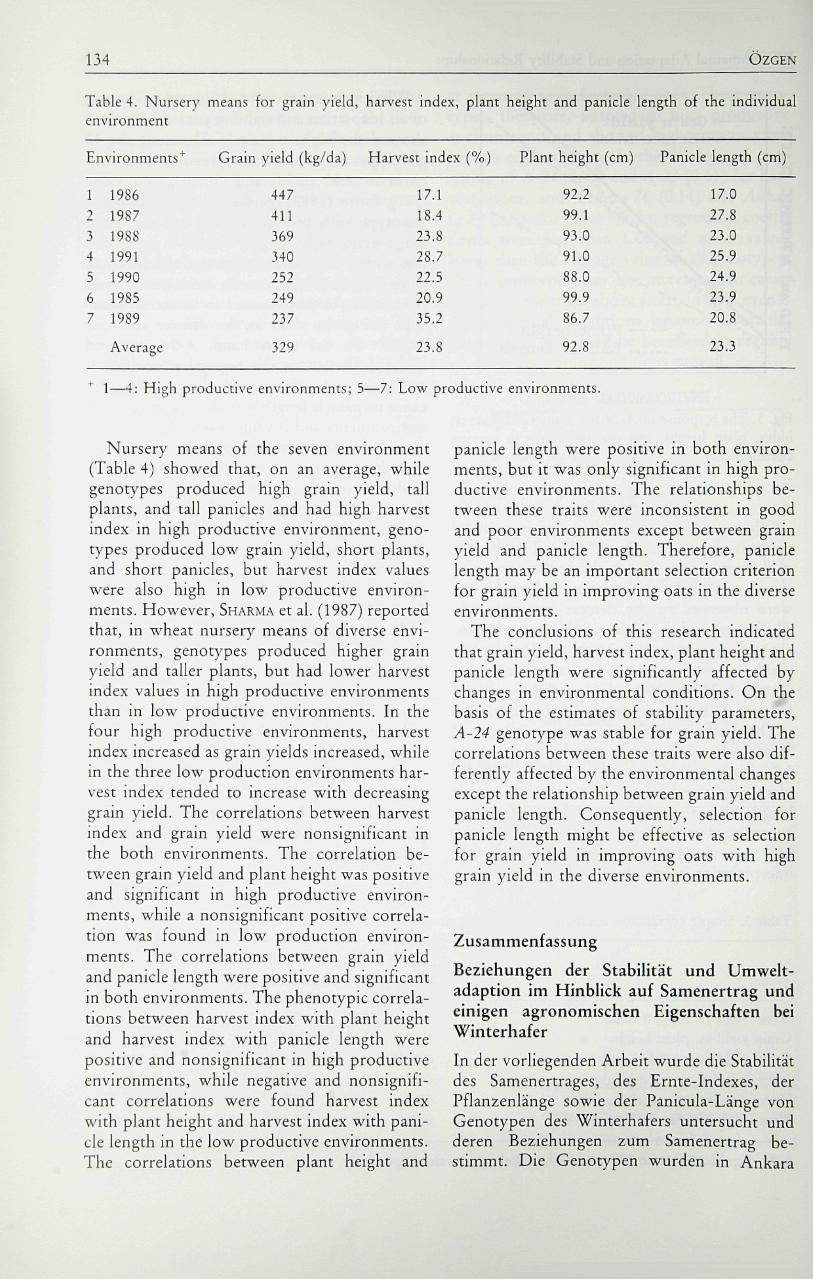
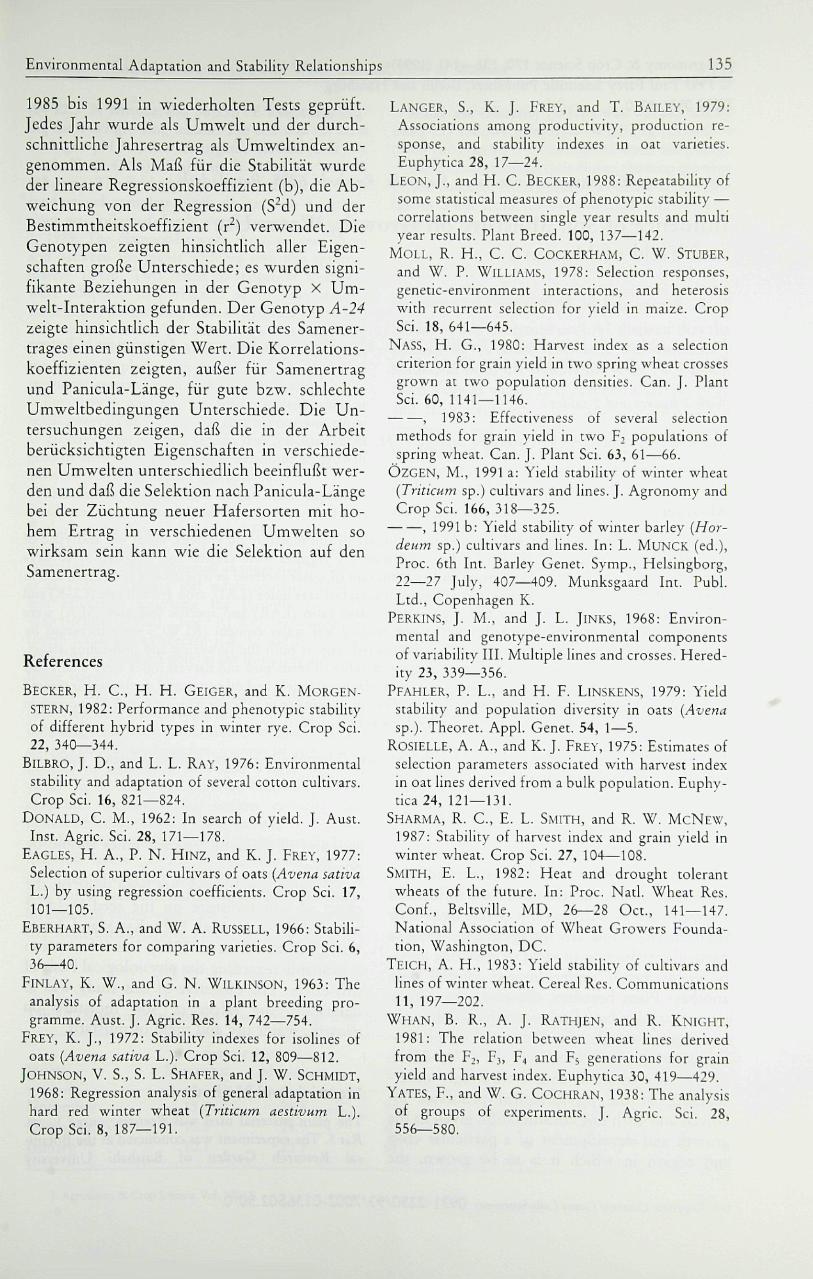
harvest index, A-22 (1.04) and A-5 (1.06) forplant height, and A-24 (0.96) and A-22 (1.06)for panicle length adapted to the diverse envi-ronments very well with their regression coef-ficient close to 1.00 and high mean value.Regarding the second group, consisting ofgenotypes A-4 (1.19) and A-21 (1.19) for har-vest index, A-23 (1.37) for plant height, and A-23 (1.27) for panicle length, although theirmean values above the average, they were con-siderably affected from environmental condi-tions due to their regression coefficient andhence rendered mean values below the averagevalues in infavorable environments while high-
er mean value in favorable ones. These geno-types, therefore, adapted to high productiveenvironments and showed higher mean valuein such environments. In the third group con-sisting o f / - 2 ^ (0.47) and A-23 (0.65) for har-vest index, and Ankara 76 (0.14) and Anka-ra 84 (0.63) for plant height, regression coeffi-cients were less than 1.00 and mean valueslower than the average value of all genotypes.These genotypes may not increase their meanvalues for the traits above a certain level even ifenvironmental conditions become favorable.These genotypes may be benefited in regionswhere unfavorable conditions prevail.
450
400
350
300
250
230
A-24Ankara 76A-23
2X1 250 300 350 400 450ENVIRONMENTAL INDEX (kg/da)
Fig. 1. Patterns ot stabihty for grain yield in threeoat genotypes in seven environments
1515 20 25 30 35
ENVIRONMENTAL INDEX (%)Eig. 2. Patterns of stabihty for harvest index in twooat genotypes m seven environments
123
- 90
A-24Anktira
A-4
yy
yy
/
t
76
/]/f
//
f/ / ^
/ y^
/ y/y
• • •7D170 80 90 100 UO 123
ENVIRONMENTAL INDEX (cm)Fig. 3. Patterns of stability for plant height in threeoat genotypes in seven environments
40
35
30
25
20,
15
A-24A-23A-25
y//
•,' y y/ y
.' / y
.V y
V y/y
15 20 25 30 35 40ENVTRONMEOTAL INDEX (cm)
Fig. 4. Patterns of stability for panicle length in threeoat genotypes in seven environments
Environmental Adaptation and Stability Relationships 133
yieldHarvest index
Plant heightPanicle length
ENVIRONMENTAL INDEXFig. 5. The response oi A-24 for grain yield, harvestindex, plant height, and panicle length to varyingenvironments
When genot}^pes were examined in terms ofdeviation from regression (S"d) and coefficientof determination (r~) which are the criteria ofstability, a pretty wide variation for all traitswere observed in the diverse environments.The lowest and the highest S d values of geno-types were noted in A-24 and A-23 for grainyield. A-3 and Ankara 76 for harvest index, A-21 and A-25 for plant height, and A-5 and A-4for panicle length, respectively (Table 2).
The coefficients of determination (r^) rangedfrom 0.68 to 0.93 for grain yield, from 0.43 to0.94 for harvest index, from 0.03 to 0.90 forplant height and from 0.72 to 0.98 for paniclelength. Since the environmental sum of squarescontributed to the regression sum of squares,MOLL et al. (1978) showed concern in theinterpretation of r values.
When genotypes were evaluated in respectof all adaptation and stability parameters, A-24showed the highest grain yield among the 10genotypes and it also had regression coefficientclose to 1.00 (0.98) and smallest S'd value(580). SMITH (1982) considered that a desirablegenotype with average stability and above av-erage grain yield should follow a regressionhne with a positive intercept and a slope equalto one. Hence, based on the estimates of theseparameters, A-24 appeared to be stable geno-type for grain yield in the diverse environ-ments. On the other hand, A-24 appeareddesirable based on the regression coefficientand mean value for panicle length, too. Be-cause its panicle length was above average in allenvironments and b value was 0.96.
Correlation coefficient ber^'een grain yieldand harvest index in seven environments(Table 3) indicated that grain yield was notsignificantly correlated with harvest index( r = - 0 . 1 1 ) . SHARJVIA et al. (1987) reportedthat, in wheat, grain yield was not significantlycorrelated with harvest index (r - 0.08), inpairwise correlation coefficients across 12 envi-ronments. The correlation coefficients of grainyield with plant height (r = 0.73=-'), grain yieldwith panicle length (r = 0.84='"='") and plantheight with panicle length (r = 0.64='') werepositive and significant in the diverse environ-ments. The correlation coefficients of harvestindex with plant height (r = —0.12) and har-vest index with panicle length (r = 0.30) werenonsignificant in seven environments. Plantheight showed a negative correlation with har-vest index, which was expected because cerealplants with short height show higher harvestindex as compared to the standard height cul-tivars.
Table 3. Simple correlation coefficients between grain yield, harvest index, plant height, and panicle length
Environments
Traits Whole High productive Low productive
Grain yield vs. harvest indexGrain yield vs. plant heightGrain yield vs. panicle lengthHarvest index vs. plant heightHarvest index vs. panicle lengthPlant height vs. panicle length
-0 .110.73=--0.84'--'
-0.120.300.64'
0.250.72'--
0.69=-
0.28
0.34
0 . 7 1 =••
-0.260.380.67
-0.61-0.19
0.50
Significant at the 0.05 and 0.01 probability levels, respectively.
134 OZGEN
Table 4. Nursery means for grain yield, harvest index, plant height and panicle length of the individualenvironment
Environments^
1 19862 19S73 19SS4 19915 19906 19857 1989
Average
Grain yield (kg/da)
447411369340252249237
329
Harvest index (%)
17.118.423.828.722.520.935.2
23.8
Plant height (cm)
92.299.193.091.088.099.986.7
92.8
Panicle length (cm)
17.027.823.025.924.923.920.8
23.3
1—4: High productive environments; 5—7: Low productive environments.
Nursery means of the seven environment(Table 4) showed that, on an average, whilegenotypes produced high grain yield, tallplants, and tall panicles and had high harvestindex in high productive environment, geno-types produced low grain yield, short plants,and short panicles, but harvest index valueswere also high in low productive environ-ments. However, SHARMA et al. (1987) reportedthat, in wheat nurser)' means of diverse envi-ronments, genotypes produced higher grainyield and taller plants, but had lower harvestindex values in high productive environmentsthan in low productive environments. In thefour high productive environments, harvestindex mcreased as grain yields increased, whilein the three low production environments har-vest index tended to increase with decreasinggram yield. The correlations between harvestindex and grain yield were nonsignificant inthe both environments. The correlation be-tween grain yield and plant height was positiveand significant in high productive environ-ments, while a nonsignificant positive correla-tion was found in low production environ-ments. The correlations between grain yieldand panicle length were positive and significantm both environments. The phenotypic correla-tions between harvest index with plant heightand harvest index with panicle length werepositive and nonsignificant in high productiveenvironments, while negative and nonsignifi-cant correlations were found harvest indexwith plant height and harvest index with pani-cle length in the low productive environments.The correlations between plant height and
panicle length were positive in both environ-ments, but it was only significant in high pro-ductive environments. The relationships be-tween these traits were inconsistent in goodand poor environments except between gramyield and panicle length. Therefore, paniclelength may be an important selection criterionfor grain yield in improving oats in the diverseenvironments.
The conclusions of this research indicatedthat grain yield, harvest index, plant height andpanicle length were significantly affected bychanges in environmental conditions. On thebasis of the estimates of stability parameters,A-24 genotype was stable for grain yield. Thecorrelations between these traits were also dif-ferently affected by the environmental changesexcept the relationship between grain yield andpanicle length. Consequently, selection forpanicle length might be effective as selectionfor grain yield in improving oats with highgrain yield in the diverse environments.
Zusammenfassung
Beziehungen der Stabilitat und Umwelt-adaption im Hinblick auf Samenertrag undcinigen agronomischen Eigenschaften beiWinterhafer
In der vorliegenden Arbeit wurde die Stabilitatdes Samenertrages, des Ernte-Indexes, derPflanzenlange sowie der Panicula-Lange vonGenotypen des Winterhafers untersucht undderen Beziehungen zum Samenertrag be-stimmt. Die Genotypen wurden in Ankara
Environmental Adaptation and Stability Relationships 135
1985 bis 1991 in wiederholten Tests gepriift.Jedes Jahr wurde als Umwelt und der durch-schnittliche Jahresertrag als Umweltindex an-genommen. Als Mai? fur die Stabilitat wurdeder lineare Regressionskoeffizient (b), die Ab-weichung von der Regression (S'd) und derBestimmtheitskoeffizient (r^) verwendet. DieGenotypen zeigten hinsichtlich aller Eigen-schaften grof e Unterschiede; es wurden signi-fikante Beziehungen in der Genotyp X Um-welt-Interaktion gefunden. Der Genotyp A-24zeigte hinsichthch der Stabilitat des Samener-trages einen giinstigen Wert. Die Korrelations-koeffizienten zeigten, au£er fur Samenertragund Panicula-Lange, fiir gute bzw. schlechteUmweltbedingungen Unterschiede. Die Un-tersuchungen zeigen, daf? die in der Arbeitberiicksichtigten Eigenschaften in verschiede-nen Umwelten unterschiedlich beeinfluftt wer-den und daE die Selektion nach Panicula-Langebei der Zuchtung neuer Hafersorten mit ho-hem Ertrag m verschiedenen Umwelten sowirksam sein kann wie die Selektion auf denSamenertrag.
References
BECKER, H . C , H . H . GEIGER, and K. MORGEN-
STERN, 1982: Performance and phenotypic stabilityof different hybrid types in winter rye. Crop Sci.22, 340—344.
BILBRO, J. D., and L. L. RAY, 1976; Environmentalstabihty and adaptation of several cotton cultivars.Crop Sci. 16, 821—824.
DONALD, C . M., 1962: In search of yield. J. Aust.Inst. Agric. Sci. 28, 171—178.
EAGLES, H . A., P. N. HINZ, and K. J. FREY, 1977:
Selection of superior cultivars of oats {Avena sativaL.) by using regression coefficients. Crop Sci. 17,101—105.
EBERHART, S. A., and W. A. RUSSELL, 1966: Stabili-ty parameters for comparing varieties. Crop Sci. 6,36—40.
EiNLAY, K. W., and G. N. WILKINSON, 1963: Theanalysis of adaptation in a plant breeding pro-gramme. Aust. J. Agric. Res. 14, 742—754.
EREY, K. J., 1972: Stability indexes for isolines ofoats {Avena sativa L.). Crop Sci. 12, 809—812.
JOHNSON, V. S., S. L. SHAFER, and J. W. SCHMIDT,
1968: Regression analysis of general adaptation inhard red winter wheat {Triticum aestivum. L.).Crop Sci. 8, 187—191.
LANGER, S., K. J. FREY, and T. BAILEY, 1979:
Associations among productivity, production re-sponse, and stability indexes in oat varieties.Euphytica28, 17—24.
LEON, J., and H. C. BECKER, 1988: Repeatability ofsome statistical measures of phenotypic stability —correlations between single year results and multiyear results. Plant Breed. 100, 137-142.
MOLL, R. H . , C . C . COCKERHAM, C. W. STUBER,
and W. P. WILLIAMS, 1978: Selection responses,genetic-environment interactions, and heterosiswith recurrent selection for yield in maize. CropSci. 18, 641—645.
NASS, H . C , 1980: Har\'est index as a selectioncriterion for grain yield in two spring wheat crossesgrown at two population densities. Can. J. PlantSci. 60, 1141—1146.
, 1983: Effectiveness of several selectionmethods for grain yield in two ET populations ofspring wheat. Can. J. Plant Sci. 63, 61—66.
OZGEN, M., 1991 a: Yield stability of winter wheat{Triticum sp.) cultivars and lines. J. Agronomy andCrop Sci. 166, 318—325.
, 1991 b: Yield stability of winter barley {Hor-deiim sp.) cultivars and hnes. In: L. MUNGK (ed.),Proc. 6th Int. Barley Genet. Symp., Helsingborg,22—27 July, 407—409. Munksgaard Int. Publ.Ltd., Copenhagen K.
PERKINS, J. M., and J. L. JINKS, 1968: Environ-mental and genotype-environmental componentsof variability III. Multiple lines and crosses. Hered-ity 23, 339—356.
PFAHLER, P. L., and H. F. LINSKENS, 1979: Yieldstability and population diversity in oats {Avenasp.). Theoret. Appl. Genet. 54, 1—5.
RosiELLE, A. A., and K. J. FREY, 1975: Estimates ofselection parameters associated with harvest indexin oat lines derived from a bulk population. Euphy-tica24, 121—131.
SHARMA, R. C , E. L. SMITH, and R. W. MCNEW,
1987: Stabihty of har\'est index and grain yield inwinter wheat. Crop Sci. 27, \0-\—108.
SMITH, E. L., 1982: Heat and drought tolerantwheats of the future. In: Proc. Natl. Wheat Res.Conf., Beltsville, MD, 26—28 Oct., 141—147.National Association of Wheat Growers Founda-tion, Washington, DC.
TEICH, A. H . , 1983: Yield stability of cultivars andlines of winter wheat. Cereal Res. Communications11, 197—202.
WHAN, B. R., A. J. RATHJEN, and R. KNIGHT,
1981: The relation between wheat lines derivedfrom the Fj, F3, F4 and F<; generations for grainyield and harvest index. Euphytica 30, 419—429.
YATES, F., and W. G. COCHRAN, 1938: The analysisof groups of experiments. J. Agric. Sci. 28,556—580.