enterprise team—ft. collins remote sensing interim … · interim project report liaison and...
TRANSCRIPT

Digital Aerial Sketchmapping
US Department of Agriculture Forest Service—Engineering Forest Health Technology Enterprise Team—Ft. Collins Remote Sensing Applications Center September 2003 RSAC-1202-RPT2
Interim Project Report Liaison and Special Projects
Forest Health Protection
Charlie Schrader-Patton Remote Sensing Applications Center 2222 West 2300 South Salt Lake City, Utah 84119 [email protected]
Prepared for the Forest Health Technology Enterprise Team (FHTET) Forest Health Protection (FHP) USDA Forest Service

The Forest Service, United States Department of Agriculture (USDA), has developed this information for the guidance of its employees, its contractors, and its cooperating Federal and State agencies, and is not responsible for the interpretation or use of this information by anyone except its own employees. The use of trade, firm, or corporation names in this document is for the information and convenience of the reader. Such use does not constitute an official evaluation, conclusion, recommendation, endorsement, or approval by the department of any product or service to the exclusion of others that may be suitable.
The U.S. Department of Agriculture (USDA) prohibits discrimination in all its programs and activities on the basis of race, color, national origin, sex, religion, age, disability, political beliefs, sexual orientation, or marital or family status. (Not all prohibited bases apply to all programs). Persons with disabilities who require alternative means for communication of program information (Braille, large print, audiotape, etc.) should contact USDA’s TARGET Center at 202-720-2600 (voice and TDD).
To file a complaint of discrimination, write USDA, Director, Office of Civil Rights, Room 326-W. Whitten Building, 1400 Independence Avenue, SW, Washington, DC 20250-9410 or call 202-720-5964 (Voice and TDD). USDA is an equal opportunity provider and employer. For additional information, contact Paul Ishikawa, Remote Sensing Applications Center, 2222 West 2300 South, Salt Lake City, UT 84119; phone: 801-975-3750; e-mail: [email protected]. This publication can be downloaded from our Web site: http://fsweb.rsac.fs.fed.us

TABLE OF CONTENTS
Abstract .....................................................................................................................................1
Introduction ...............................................................................................................................2
Background ...............................................................................................................................3
System Development —Software ................................................................................4
System Development —Hardware ...............................................................................7
Demonstration Trips and Field Support .....................................................................12
Recent Advances ........................................................................................................13
Summary and Conclusion ......................................................................................................13
References .............................................................................................................................14

Abstract Aerial sketchmapping is the geo-locating of features that are seen on the ground below the aircraft, and the subsequent recording of these features on maps or photographs. The currently used method of aerial sketchmapping requires hand-sketching on hardcopy maps or photos, and translation of that information to a digital file. This report describes a project to develop a digital aerial sketchmapping (D-ASM) system to replace or augment the current system. Recent advances in microprocessor speed and PC system performance now make possible the use of portable computers to aid with aerial sketchmapping. The USDA Forest Service Remote Sensing Applications Center (RSAC) and Forest Health and Technology Enterprise Team (FHTET) worked with a software vendor, Michael Baker, Jr., Inc. to develop a product that will meet the needs of forest health aerial surveyors. Several hardware and software options were investigated. Advantages to the D-ASM system include automatic tracking of the aircraft’s position on the map base through a link to a GPS receiver and reduction of time spent digitizing data into a GIS. Future enhancements to the system include software modifications to the user interface, developing a dual-input system, and expanding the types of data used as background maps. Close cooperation with the sketchmapping community is critical to the on-going success of this project.
1

Introduction This report documents our efforts to develop a digital aerial sketchmapping (D-ASM) system for forest health aerial surveyors. A brief history of the project is presented, including the software and hardware investigated. The current system is described and possible future work is discussed.
A manual system for aerial sketchmapping for forest health protection has been used since the 1940s. Typically, sketchmappers fly over the area to be surveyed in a high-winged, high-performance monoplane such as a Cessna 206 (figure 1) at elevations of 1,000-3,000 feet above ground. The sketchmapper tracks the plane’s location on a hardcopy map or aerial photograph and sketches areas of forest that have been damaged by insects, disease, or weather events (figure 2). These hardcopy products are then provided to the geographic information system (GIS) specialist at the Forest Service office for data entry. The sketched features (points, lines, and polygons) are then digitized on-screen into a GIS; these data are used to prepare reports at the forest, region, and national levels. Problems with this manual system include numerous hardcopy maps to manage in the cockpit, the inaccuracy of sketched features, and the office staff time (and therefore, cost) required to digitize sketched features.
2
Figure 1—High-winged monoplane typical of the type used in aerial sketchmapping.
The accuracy of sketched features is determined by the ability of the sketchmapper to keep track of the aircraft’s position on the map and to correctly relate features seen on the ground to the map. This can be especially difficult in unfamiliar and/or flat terrain. At typical airspeeds of 90-120 knots, a sketchmapper has approximately 15 seconds per square mile to accurately locate, sketch and attribute features (assuming a visual mapping distance of two miles from the aircraft). Accuracy is a relative term and the end use of the data must be considered. If the data collected during a sketchmap mission is for general monitoring purposes, then more error can be tolerated than if field crews need to locate the affected stands using the sketchmapped data. After the survey flight, the hardcopy maps are delivered to GIS technicians who then must accurately digitize and attribute the features into a GIS.

Advances in GIS, the Global Positioning System (GPS), and in computer technology have led to interest in developing a digital system of data collection that might help solve some of the problems with the manual method. It is important to note that even with its inefficiencies and lack of accuracy, the current manual system does work. Digital enhancements to this system must result in substantial improvement over the current methods to be justified.
Background Interest in the development of a digital aerial sketchmapping application led to a request in FY 1995 by the Pacific Northwest Region to the Forest Health and Technology Enterprise Team (FHTET) and the Missoula Technology Development Center (MTDC) to assess the feasibility of developing a D-ASM system. As a part of this project, forest units throughout the US were surveyed to determine the needs of the sketchmapping community. A trip to the British Columbia Forest Service in Williams Lake, BC, was taken in June 1996 to examine and test their digital sketchmapping system.
The system developed by the BC Forest Service operates on a laptop PC linked to a GPS receiver. It allows the user to sketch on the screen using a standard trackball mouse. The software used in this system was developed by the BC Forest Service using Microstation MDL programming language and requires a full installation of Microstation software. Data input and user-interface features include aircraft position displayed on-screen as an icon, background map rotation based on the aircraft’s direction of travel, and attributing of features using pre-programmed function keys. Disadvantages identified were the small size of the screen on the laptop computer, lack of screen brightness, awkwardness of the mouse pointing device, and data incompatibilities between Microstation and ESRI Arc/Info. Arc/Info is the standard GIS software for the USDA Forest Service. In general, the system was slow and cumbersome to use.
Two other systems were also reviewed, AvCan Technologies of Pitt Meadows, BC, and ArNav of Puyallup, WA. These reviews provided a look at functioning systems and the current state-of-the-art technology. For a complete discussion of this information-gathering project, see Thistle et al., 1996.
Figure 2—Damaged areas observed from the aircraft are sketched on the base maps.
3

The team developed a list of requirements for a D-ASM system:
1. The map display must be linked to a GPS receiver so that an icon on the display represents the current position of the aircraft.
2. The map display must update quickly at ground speeds of 130 mph. 3. The screen must be viewable under a variety of lighting conditions, including
full sunlight, and also display in full (256) color. 4. The viewable screen size must be at least 10.4” measured diagonally. 5. The software must have the capability to:
(a) Digitize points, lines, and polygons - including nested and overlapping polygons;
(b) Attribute digitized features (points, lines, and polygons) quickly and easily;
(c) Edit feature attributes; (d) Allow the user to define the feature attributes to be collected; (e) Collect the GPS log file of the flight; (f) Allow the user to zoom to different map scales; (g) Accept common raster and vector data types as background maps; (h) Export files in a format that is easily imported into ESRI Arc/Info; (i) Save data automatically to the computer’s disk; (j) Update the screen map display based on the GPS position and heading of
the aircraft. 6. The hardware should be operational in moderately harsh conditions (32-120°F,
high humidity, dusty conditions). 7. The primary input device must be a touchscreen with a stylus.
System Development—Software Using these requirements, RSAC began an extensive search for hardware and software adequate to the task. Our initial investigation into software focused on commercial off-the-shelf (COTS) products that came close to meeting our criteria. We focused on the following software:
Aspen Card by Trimble DynaMo-GIS by GeoFocus FieldNotes by PenMetrics,Inc GPS-Pro Map by MPN Components PenMap by Condor Earth Technologies GeoLink PowerMap by Michael Baker, Jr., Inc.
The above companies were asked if they could modify their COTS products to meet our criteria.
4
Based on this investigation, we selected GeoLink PowerMap by Michael Baker, Jr., Inc. of Jackson, MS. Michael Baker, Jr., Inc. agreed to make the necessary modifications to their COTS product to meet our sketchmapping needs. These modifications were done under a GSA special services contract.
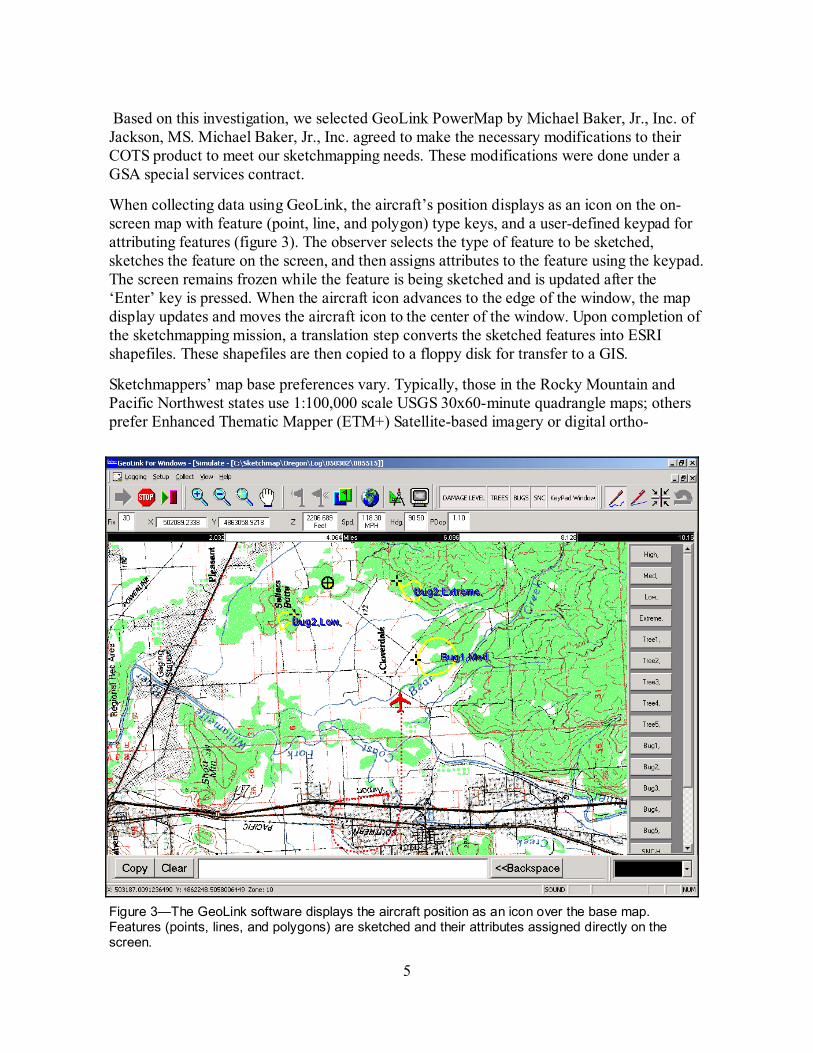
When collecting data using GeoLink, the aircraft’s position displays as an icon on the on-screen map with feature (point, line, and polygon) type keys, and a user-defined keypad for attributing features (figure 3). The observer selects the type of feature to be sketched, sketches the feature on the screen, and then assigns attributes to the feature using the keypad. The screen remains frozen while the feature is being sketched and is updated after the ‘Enter’ key is pressed. When the aircraft icon advances to the edge of the window, the map display updates and moves the aircraft icon to the center of the window. Upon completion of the sketchmapping mission, a translation step converts the sketched features into ESRI shapefiles. These shapefiles are then copied to a floppy disk for transfer to a GIS.
Sketchmappers’ map base preferences vary. Typically, those in the Rocky Mountain and Pacific Northwest states use 1:100,000 scale USGS 30x60-minute quadrangle maps; others prefer Enhanced Thematic Mapper (ETM+) Satellite-based imagery or digital ortho-
5
Figure 3—The GeoLink software displays the aircraft position as an icon over the base map. Features (points, lines, and polygons) are sketched and their attributes assigned directly on the screen.

photography. The GeoLink software is able to display many different types of geo-spatial data as the background map and thus is able to accommodate various preferences (figure 4). Using large map files requires the CPU to reorient these files in response to changing GPS position. The resulting drain on computer resources (memory, and virtual memory) caused screen refresh times to be unacceptably slow. This problem was partially addressed by acquiring computers with additional memory, but we sought a more robust software solution. Michael Baker, Jr., Inc. engineers developed a built-in utility that divides large map files into tiles that represent commonly used zoom scales. Instead of rotating and displaying the whole map file, the software now displays only the map tiles adjacent to the current GPS position. Because this utility was so successful, a similar one was developed for large vector shapefiles. Surveyors often want to display large shapefiles over their raster map data; these shapefiles may be the previous seasons’ survey data, administration boundaries, or section lines. These large files can slow the display refresh rate considerably, so a utility was developed that displays only those vector features that are in the current display window.
Based upon input from surveyors, Michael Baker, Jr., Inc. engineers have developed software enhancements such as editing of polygons, multiple user-defined keypad sets for attributing features, display of feature attributes, and editing of feature attributes.
Using the hardcopy method of data collection, the surveyor will typically edit his/her data after the survey flight using a pencil and eraser and perhaps transcribe the collected features to a clean map for delivery to the GIS shop for digitization. Using the digital system, this data clean-up and post-processing procedure has changed. We needed to develop some tools to perform these same editing functions on digital files, rather than on paper maps. ESRI’s
Figure 4—Digital ortho-photos and satellite imagery can be used as background maps in GeoLink.
6

ArcView software is the platform of choice for editing shapefiles. We have developed a suite of utilities that add specific functionality to ArcView to post-process digital sketchmap data. This ArcView extension is called SketchTools. SketchTools enables the user to create a polygon coverage by buffering points, dissolve boundaries between polygons, calculate acres, and format feature tables (figure 5). Hopefully, these tools will ease the transition between hardcopy and softcopy editing of aerial survey data.
7
Figure 5—SketchTools utilities facilitate processing of survey data in ESRI ArcView software.
System Development—Hardware Initially, we tested a touchscreen computer manufactured by Computer Dynamics of Greenville, SC. Although the screen size and brightness were adequate with this computer, its size, weight, and heat output prohibited its use in a small aircraft.
Next, we tested the GeneSys 133 from Xplore Technologies of Austin, TX. This computer was attractive because the CPU and touchscreen are housed in a single, compact unit. Preliminary tests were promising, but the touchscreen was not bright enough to be visible in direct sunlight and the processor speed and memory capacity were inadequate.
The current hardware setup consists of a laptop PC with the fastest available processor (currently 1GHz) and at least 512MB of RAM, an external touchscreen monitor, and a GPS receiver (figure 6). The system is powered from the aircraft using a specially-designed power distribution board that draws from the 28VDC supply on the aircraft (figure 7).

We have tested three types of touchscreens, which vary in screen size, brightness, and touchscreen technology. The first touchscreen was manufactured by Cascade Technology Corporation of Farmington Hills, MI, and was fitted with an ELO Accutouch resistive touchscreen. The screen is 10.4” measured diagonally, 500 nits in brightness, 800x600 in resolution, and weighs 7.5 pounds. Resistive touchscreens have a membrane layer installed over a fine wire mesh grid in the screen; when this membrane is pressed on to the grid, a signal is sent to the computer and the cursor jumps to that spot on the screen. Virtually any object can be used on the screen — your finger, an eraser, stylus, etc. This can be a disadvantage for sketchmapping, because any inadvertent touch to the screen may result in undesired actions. The Cascade screen was also rather small in screen size (10.4”), which limited the amount of map area visible on the screen.
KDS PixelTouch of Ontario, CA (figure 8) manufactured several screens to our specifications. These screens have 1024 x 768 resolution, 12.1” diagonal screen size, 1500 nits brightness, and capacitive touchscreens. This type of touchscreen is activated by completion of an electrical circuit using a tethered stylus. This technology avoids the inadvertent activation problem of the resistive touchscreen because the screen can only be activated with the tethered pen. All active D-ASM systems are currently using KDS screens.
8
Figure 6—Current hardware configuration for digital sketchmapping.
Figure 7—Custom power distribution boards were developed by FHTET for powering the system using the aircraft’s electrical system.
Figure 8—KDS Touchscreen, by KDS PixelTouch of Ontario, CA. This is the predominant screen in use today.

We have tested many GPS receivers, and it seems that any receiver capable of producing an NMEA 0813 output string will be compatible with the software (figure 9). Expensive, survey-grade receivers are not necessary; Garmin recreation-grade units are adequate to the task. The GPS signal enters the PC via a COM port (USB or Serial) connection. Newer USB GPS units have the advantage of drawing power from the laptop PC.
Most of the hardware is installed in the cargo area of the aircraft or in the rear passenger seat (figures 10 and 11) for safety reasons. Once the system is up and running, the sketchmapper operates the software holding the touchscreen on his/her lap (figures 12 and 13).
Figure 10—The laptop PC can be stowed behind in the passenger seat for easy in-flight access.
Figure 11—The system must be carefully installed in the plane to prevent damage to cables and connections during flight.
9
Figure 9—GPS receivers used include USB units (top) and the Garmin 12XL with antenna (bottom).

Figure 13—The touchscreen is visible in full sunlight.
Figure 12—The sketchmapper operates the software via the touchscreen.
The advantages to the laptop-based hardware setup are low cost and flexibility. Assuming the sketchmapper already has a suitable GPS receiver, the cost would be approximately $8,100 - $10,100, depending largely upon which touchscreen monitor is preferred (table 1). This cost estimate does not include the purchase of background map data or the purchase of ESRI ArcView software for post-processing. The laptop PC can be used for other general computing purposes and also can be upgraded as faster processors and more memory become available. This flexibility also applies to the GPS receiver, which can be used for field data collection as well as sketchmapping.
Since most laptop PCs only have one serial port installed, it is necessary to purchase and install a serial port adapter device. Two serial ports are necessary, one for the GPS and one for the touchscreen monitor. We continue to test serial port adaptor devices; currently we are equipping D-ASM systems with USB serial adaptor devices. The USB GPS eliminates the need for a separate serial adaptor device.
Item Cost
Laptop PC $2,000 - $4,000
KDS PixelTouch Touchscreen Monitor $4,000
GeoLink PowerMap and Mapping Companion Software
$1,600
Power distribution equipment, Serial port adapter $500
Total $8,100 - $10,100
Table 1—Estimated costs of digital sketchmapping hardware/software 2002
10

The disadvantage to this laptop-based hardware setup is that it is somewhat awkward and cumbersome with many different components and cables in the confined space of a small aircraft. Care must be taken so that all connections are stable during flight. Installing the components in a rack which can be secured in the cargo space of the aircraft, and routing and securing the cables are recommended. This is only practical if the same aircraft is going to be used throughout the sketchmapping season.
Some other advantages may be realized if the same aircraft can be used consistently. Connections to the aircraft’s GPS and power supply could be established; this would eliminate the need for an external GPS receiver, antenna, batteries, and an inverter. The portable power supply distribution system (figure 7) requires installation of a standard 3-pin FirePack radio plug into the aircraft’s electrical system. Installation of this plug is simple and all aircraft contractors to date have willingly made the installation. These connections could be a specification in the sketchmapping aircraft procurement contract.
We are currently investigating and testing pen tablet PCs as a platform for the system. The pen tablet PC is the next emerging technology, according to PC market analysts. Advantages for use in D-ASM include smaller, simpler hardware profile; disadvantages include marginally adequate processor speeds and RAM capacity, and poor readability in full sunlight (figure 14). This technology is rapidly advancing, however, and hopefully within the next year a model will be in production that negates the disadvantages of the current models.
11
Figure 14—The HammerHead 3 from Walkabout Computers, Inc. The PC and transflective active touchscreen display are integrated into the rugged housing.

Demonstration Trips and Field Support Demonstration trips focus on presenting the system and teaching survey personnel how to set up and operate system components. Trips were conducted this year to Flagstaff, AZ, Susanville, CA, Madison, WI, Pineville, LA, Morgantown, WV, and Albuquerque, NM. Also, the system was presented in Israel as part of a short course on Remote Sensing and GIS for Foresters.
Repeated testing of new hardware and software in flight was also necessary; these tests were conducted in Salem, OR with the help of USFS Region 6 and Oregon Deptartment of Forestry personnel. Input from the many sketchmappers that have used the system in flight continues to be very important to identify useful modifications to the software and hardware of the system.
During past demonstration trips, the subject of the accuracy of the sketched features was discussed. In the Southern Region (R8), sketchmapping flights are conducted intensively throughout the growing season to locate small outbreaks of southern pine beetle infestation. The goal is to treat these spots before they increase in size. These small areas are typically sketchmapped as points. GIS Technicians “heads-up” digitize these points and the coordinates are used by the field crews to navigate to the area to assess the damage. The accuracy of these points must allow crews to find these infested areas, which may be as small as three trees.
In order to test the accuracy of points sketched with the digital system, experienced sketchmappers digitized known features such as road intersections and bridges during the flight tests. The resulting coordinates were loaded as waypoints into a GPS receiver and crews navigated on the ground to the mapped features. These test features were inaccurate by 3 - 500 feet; this was considered unacceptable because locating the infested areas with this much uncertainty would be difficult given the thick undergrowth that is characteristic of the region. Accuracy is especially important to achieve the goal of treating selected infested areas within 30 days of detection.
We discussed ways to improve the accuracy of the sketched data. Real-time differential correction of the GPS signal is possible but will likely have negligible effects on the accuracy since the points are sketched using ground features that are visible on the background map as reference, rather than sketching points right in the GPS-recorded flight line. National Map Accuracy Standards for the 1:100,000 scale maps used as background data specify that point features may be off by up to 166 feet; thus nearly one-third of the observed error may be accounted for by the maps. We concluded that using digital ortho quads (DOQs) would improve accuracy by providing more features for the sketchmapper to reference than the digital raster graphics (DRGs), including existing harvest units and small spur roads. Also, the DOQs would meet the National Map Accuracy Standards for 7.5-minute quadrangles, which corresponds to error of no more than 40 feet for point features. We agreed that the use of DOQs as background data should be investigated. Subsequent tests have confirmed that point features sketched using DOQs as a background map were significantly more accurate that those sketched using the DRGs as a background map.
12

Recent Advances RSAC has gained a lot of experience from setting up the system with a variety of computers, operating systems, and serial adapters. This experience, plus information on preparing background maps, use of GeoLink software, and data post-processing, is captured in the D-ASM guide:
http://www.fs.fed.us/foresthealth/id/id_tech.html
This manual is intended to complement the hardware and software manuals. RSAC continues to test new operating systems and hardware in an effort to keep pace with the latest technology available.
Summary and Conclusion This project began with a survey of the sketchmapping community to identify their needs and concerns. Next, trips were made to investigate currently functioning systems. The result of these two efforts was a list of the desired features for the prototype system. After researching available hardware and software options, we contracted for the necessary software modifications and assembled a functioning hardware setup. Our demonstrations of this prototype system to sketchmappers have resulted in a list of modifications to the system; RSAC is currently pursuing these modifications. This system is a work in progress and, with each step, we are closer to developing a system that will be a tremendous leap forward for aerial sketchmapping.
Feedback from field personnel indicates that a major advantage to the use of the D-ASM system is quick delivery of survey data to land managers. In most regions, there is a significant time lag of four to six months between the time the data is collected and when it is delivered to the end user. By directly digitizing the data using the system, the time between aerial detection and delivery to the district or Forest Service office is now measured in weeks. Region 6 (Oregon and Washington) has developed a website (http://www.fs.fed.us/r6/nr/fid/as/quad/) that provides draft and final maps as printable Adobe Acrobat files. Managers can now view and download maps of insect and disease damage within weeks of the detection survey. Because of this quick turnaround, surveyors are reporting an increase in requests for detection surveys.
In addition to fire management teams, other managers — such as those in vegetation management, law enforcement and wildlife management — have shown an interest in the system. Any aerial geo-spatial data collection activity where the data will be placed into a GIS will probably save substantial time and dollars using this system.
The keys to successful development of an application are clear communication with the end- user group, and thorough investigation of the current and anticipated technology. Through continued clear communication with the sketchmapping community and awareness of available technology, we have produced a system that will increase the efficiency and accuracy of aerial sketchmapping.
13

References Thistle, H., Greenfield, P., McConnell, T., Myhre, R., and Rankin, L., 1996. Sketchmapping
Interim Report. Tech. Rep. FHTET 96-31 (xref 9634-2855-mtdc). Davis, CA: U.S. Department of Agriculture, Forest Service, Forest Health Protection. 40 p.
14