enterprise architecture management pattern catalog · usingtheeampc 9 2.1 ... togaf 1 1995 togaf...
TRANSCRIPT
Enterprise Architecture Management Pattern Catalog
Version 2.0November 2015
Pouya Aleatrati Khosroshahi, Matheus Hauder, Alexander W. Schneider, Prof. Dr. FlorianMatthes
Software Engineering for Business Information Systems (sebis)Ernst Denert-Stiftungslehrstuhl
Chair for Informatics 19Technische Universität München
Boltzmannstraße 3, 85748 Garching b. München, Germany

About sebis
Software Engineering for Business Information Systems (sebis) is a research chair at the Insti-tute for computer science of the Technische Universität München. Sebis has been establishedin 2002 with funding of the Ernst Denert-Stiftung and is headed by Professor Dr. FlorianMatthes. Main research areas of sebis are:
• Enterprise Architecture Management: Development of methods that support the strate-gic planning, analysis, and enactment of holistic models for business processes, informa-tion systems, and IT infrastructure with their relationships.
• Social Software Engineering: Development of social software solutions that improve thecollaborative organization of information and processes.
Copyright
Copyright © 2015 Technische Universität München, sebis, Germany. All rights reserved.
No part of this publication may be reproduced, stored, archived, or transmitted in any formby any means (electronical, mechanical, by photocopying, or otherwise) without the priorprinted permission of the publisher, Technische Universität München, sebis. The informationcontained and opinions expressed herein may be changed without prior notice.
Trademarks
All trademarks or registered trademarks are the property of their respective owners.
Disclaimer
The information contained herein has been obtained from sources believed to be reliable atthe time of publication but cannot be guaranteed. Please note that the findings, conclusionsand recommendations that Technische Universität München, sebis delivers will be based oninformation gathered in good faith from both primary and secondary sources, whose accuracycannot always be guaranteed by Technische Universität München, sebis.
Technische Universität München, sebis disclaims all warranties as to the accuracy, complete-ness, or adequacy of such information. Technische Universität München, sebis shall have noliability for errors, omissions, or inadequacies in the information contained herein or for in-terpretations thereof. In no event shall Technische Universität München, sebis be liable forany damage of any kind (e.g. direct, indirect, special, incidental, consequential, or punitivedamages) whatsoever, including without limitation lost revenues, or lost profits, which mayresult from the use of these materials. The reader assumes sole responsibility for the selectionof these materials to achieve its intended results.
There will be no warranty that the results of this publication will be economically and tech-nically exploitable and unencumbered by third-party proprietary rights.
II
Abstract
There ist no denying that the Enterprise Architecture Management (EAM) func-tion is gaining increased attention in today’s organizations: Upcoming trends invarious branches and the increased focus on the demands of single customers,leads to entire new business requirements, fundamental changes in organizationalstrategies and thus in the operating IT landscapes. EAM focuses on steering suchIT transformation projects by supporting with smart EAM methods, transparentvisualizations and fast provisioning of information.
Based on several years of research experience and EAM projects, the sebis chairof the Universität München has a concrete perception of what kind of conceptsconstitute EAM functions in large organizations: EAM functions address variousconcerns of multiple stakeholders by using concrete EAM methods and visual-ize the current state of the respective concern visualizations. Moreover archi-tecture principles, and branch and organization specific influence factors impactthe organizational and operational structure and thus the EAM function of theorganization.
In 2008, the sebis chair published the Enterprise Architecture Management Pat-tern Catalog, a EAM best practice and pattern collection. After seven years, theEAM function might has changed in today’s organizations and thus new EAMpatterns have been observed. For this reason, the Enterprise Architecture Man-agement Catalog V2 (EAMPC V2) picks up this topic again and focuses on iden-tifying new EAM patterns and best practices. We conducted an online survey andsingle expert interviews with 31 practitioners and identified various new trends intoday’s EAM functions. This catalog includes our observed EAM patterns.
III

IV

Acknowledgments
Since the majority of gathered information originate from practitioners, we thankour industry partners which shared their knowledge and provided useful insights.
Last but not least, we want to thank Daniel Elsner, Ömer Uludag and SimonPigat for their support in documenting and compiling the catalog’s content.
Garching b. München, November 2015
Pouya Aleatrati KhosroshahiMatheus Hauder
Alexander W. SchneiderProf. Dr. Florian Matthes
V

VI
Contents
1. Introduction 11.1. Research objectives . . . . . . . . . . . . . . . . . . . . . . . . . . . . . . . . . . 21.2. Research design . . . . . . . . . . . . . . . . . . . . . . . . . . . . . . . . . . . . 41.3. Extending the language of the EAMPC . . . . . . . . . . . . . . . . . . . . . . 51.4. Miscellaneous information . . . . . . . . . . . . . . . . . . . . . . . . . . . . . . 7
2. Using the EAMPC 92.1. Implementing an organization-specific EAM . . . . . . . . . . . . . . . . . . . . 102.2. Performing benchmarks with the EAMPC . . . . . . . . . . . . . . . . . . . . . 112.3. The EAMPC as basis for academic research . . . . . . . . . . . . . . . . . . . . 112.4. How to read the EAM pattern graph . . . . . . . . . . . . . . . . . . . . . . . . 12
3. Influence Factors 133.1. Overview of influence factors . . . . . . . . . . . . . . . . . . . . . . . . . . . . 143.2. Interpretation of results . . . . . . . . . . . . . . . . . . . . . . . . . . . . . . . 15
4. Stakeholders 174.1. Overview of stakeholders . . . . . . . . . . . . . . . . . . . . . . . . . . . . . . . 184.2. Amount of mentioned concerns for each stakeholder . . . . . . . . . . . . . . . . 19
5. Concerns 215.1. Overview of concerns . . . . . . . . . . . . . . . . . . . . . . . . . . . . . . . . . 225.2. Amount of allocated stakeholders for every concern . . . . . . . . . . . . . . . . 23
6. Methodology Patterns and Principles 256.1. Overview of architecture principles . . . . . . . . . . . . . . . . . . . . . . . . . 266.2. Identification of architecture principle sets . . . . . . . . . . . . . . . . . . . . . 266.3. Overview of used methodologies . . . . . . . . . . . . . . . . . . . . . . . . . . . 28
7. Viewpoint Patterns 417.1. Viewpoint V-107 . . . . . . . . . . . . . . . . . . . . . . . . . . . . . . . . . . . 427.2. Viewpoint V-108 . . . . . . . . . . . . . . . . . . . . . . . . . . . . . . . . . . . 46
© Technische Universität München, sebis, 2015. All rights reserved. VII
Contents
7.3. Viewpoint V-109 . . . . . . . . . . . . . . . . . . . . . . . . . . . . . . . . . . . 517.4. Viewpoint V-110 . . . . . . . . . . . . . . . . . . . . . . . . . . . . . . . . . . . 527.5. Viewpoint V-111 . . . . . . . . . . . . . . . . . . . . . . . . . . . . . . . . . . . 537.6. Viewpoint V-112 . . . . . . . . . . . . . . . . . . . . . . . . . . . . . . . . . . . 577.7. Viewpoint V-113 . . . . . . . . . . . . . . . . . . . . . . . . . . . . . . . . . . . 587.8. Viewpoint V-114 . . . . . . . . . . . . . . . . . . . . . . . . . . . . . . . . . . . 627.9. Viewpoint V-115 . . . . . . . . . . . . . . . . . . . . . . . . . . . . . . . . . . . 667.10. Viewpoint V-116 . . . . . . . . . . . . . . . . . . . . . . . . . . . . . . . . . . . 677.11. Viewpoint V-117 . . . . . . . . . . . . . . . . . . . . . . . . . . . . . . . . . . . 687.12. Viewpoint V-118 . . . . . . . . . . . . . . . . . . . . . . . . . . . . . . . . . . . 697.13. Viewpoint V-119 . . . . . . . . . . . . . . . . . . . . . . . . . . . . . . . . . . . 707.14. Viewpoint V-120 . . . . . . . . . . . . . . . . . . . . . . . . . . . . . . . . . . . 71
8. Information Model Patterns 738.1. Information model I-99 . . . . . . . . . . . . . . . . . . . . . . . . . . . . . . . . 748.2. Information model I-100 . . . . . . . . . . . . . . . . . . . . . . . . . . . . . . . 758.3. Information model I-101 . . . . . . . . . . . . . . . . . . . . . . . . . . . . . . . 768.4. Information model I-102 . . . . . . . . . . . . . . . . . . . . . . . . . . . . . . . 778.5. Information model I-103 . . . . . . . . . . . . . . . . . . . . . . . . . . . . . . . 788.6. Information model I-104 . . . . . . . . . . . . . . . . . . . . . . . . . . . . . . . 798.7. Information model I-105 . . . . . . . . . . . . . . . . . . . . . . . . . . . . . . . 808.8. Information model I-106 . . . . . . . . . . . . . . . . . . . . . . . . . . . . . . . 818.9. Information model I-107 . . . . . . . . . . . . . . . . . . . . . . . . . . . . . . . 828.10. Information model I-108 . . . . . . . . . . . . . . . . . . . . . . . . . . . . . . . 848.11. Information model I-109 . . . . . . . . . . . . . . . . . . . . . . . . . . . . . . . 858.12. Information model I-110 . . . . . . . . . . . . . . . . . . . . . . . . . . . . . . . 868.13. Information model I-111 . . . . . . . . . . . . . . . . . . . . . . . . . . . . . . . 878.14. Information model I-112 . . . . . . . . . . . . . . . . . . . . . . . . . . . . . . . 888.15. Information model I-113 . . . . . . . . . . . . . . . . . . . . . . . . . . . . . . . 898.16. Information model I-114 . . . . . . . . . . . . . . . . . . . . . . . . . . . . . . . 908.17. Information model I-115 . . . . . . . . . . . . . . . . . . . . . . . . . . . . . . . 918.18. Information model I-116 . . . . . . . . . . . . . . . . . . . . . . . . . . . . . . . 928.19. Information model I-117 . . . . . . . . . . . . . . . . . . . . . . . . . . . . . . . 938.20. Information model I-118 . . . . . . . . . . . . . . . . . . . . . . . . . . . . . . . 948.21. Information model I-119 . . . . . . . . . . . . . . . . . . . . . . . . . . . . . . . 958.22. Information model I-120 . . . . . . . . . . . . . . . . . . . . . . . . . . . . . . . 968.23. Information model I-121 . . . . . . . . . . . . . . . . . . . . . . . . . . . . . . . 97
9. Data Collection Patterns 999.1. Overview of data collection patterns . . . . . . . . . . . . . . . . . . . . . . . . 1009.2. Interpretation of results . . . . . . . . . . . . . . . . . . . . . . . . . . . . . . . 101
10.Summary 103
Bibliography 107
A. Appendix 115
VIII © Technische Universität München, sebis, 2015. All rights reserved.
Contents
A.1. General Company Information . . . . . . . . . . . . . . . . . . . . . . . . . . . 116A.2. Influence Factors Overview . . . . . . . . . . . . . . . . . . . . . . . . . . . . . 119A.3. Stakeholders Overview . . . . . . . . . . . . . . . . . . . . . . . . . . . . . . . . 120A.4. Concerns Overview . . . . . . . . . . . . . . . . . . . . . . . . . . . . . . . . . . 121A.5. Data Collection Patterns . . . . . . . . . . . . . . . . . . . . . . . . . . . . . . . 123
© Technische Universität München, sebis, 2015. All rights reserved. IX

X
CHAPTER 1
Introduction
Contents1.1. Research objectives . . . . . . . . . . . . . . . . . . . . . . . . . . . 21.2. Research design . . . . . . . . . . . . . . . . . . . . . . . . . . . . . 41.3. Extending the language of the EAMPC . . . . . . . . . . . . . . . 51.4. Miscellaneous information . . . . . . . . . . . . . . . . . . . . . . . 7
Organizations are forced to constantly transform due to changing market requirements, in-creasing digitization of business models as well as restructuring through mergers and acquisi-tions. Enterprise architecture (EA) matured to a widely accepted discipline in practice thatsupports decision makers with holistic information about core organizational elements andtheir relationships for this purpose [Ro03, AGW11, Ro13]. EA management (EAM) seeks toimprove the alignment between business and IT, realize cost saving potentials, and increasefault tolerance [LW04]. In this report, we present the second version of the EAMPC thataggregates data from 31 organizations to reflect the current status of the discipline in prac-tice. The initial version has been published in 2008 as EAMPC v1.0[Bu08] and found muchappeal by practitioners and researchers. The second version incorporates our findings frommany industry and research projects related to EAM over the last seven years since the initialrelease. In the second version the underlying pattern language is extended with new conceptsand the integration of patterns is improved through more flexible associations. With theseimprovements organizations can tailor their approach to EAM based on relevant stakehold-ers and influence factors. The EAMPC is primarily developed as reference for practitionersaiming to introduce or enhance EAM initiatives in organizations. In addition, researchers canutilize this report to investigate the evolution of the discipline and develop approaches forEAM that can be iteratively enhanced.
© Technische Universität München, sebis, 2015. All rights reserved. 1

1. Introduction
1.1. Research objectives
The main research objective of the EAMPC is to provide the foundation for an approach thatallows the stepwise creation and adaptation of EAM initiatives that are tailored to thecontext of an organization, e.g., industry sector, maturity level, size of the organization ororganizational culture. Figure 1.1 provides an overview about the most prominent EA frame-works. Our approach distinguishes the EAMPC from other EA frameworks, which predefinethe entire method in advance and provide no conductable instructions for practitioners. Ac-cording to a study on issues in enterprise architecting presented in [LKL10], one of the mainchallenges in this domain is that current frameworks are not rigid enough and no formal stepsfor defining, maintaining, and implementing an EA exist. Properly used the EAMPC can fillthis gap by integrating applicable solution building blocks with EA frameworks.
© sebis150417 Hauder EAM PC 2015 1
Existing Frameworks for Enterprise Architecture
Management
1985 1990 1995 2000 2005 2010
PERA
1989
GRAI/GIM 1.0
1992
GERAM
1994
PERA
2001
GERAM 1.6.3
1999
CIMOSA
1984
CIMOSA
1999
ARIS
1991
ARIS 7.1
2008
JTA 1.0
1996
JTA 7.0
2005
TAFIM 1.3
1992
TAFIM 2.0
1994
TAFIM 3.0
1996
TAFIM
2000
DoD EA TRM 0.4
2005
C4ISR 1.0
1996
C4ISR 2.0
1997
DoDAF 1.0
2003
DoDAF 1.5
2007
DoDAF 2.0
2009
TOGAF 1
1995
TOGAF 8.1
2003
TOGAF 9
2009
TISAF 1.0
1997
TEAF 1.0
2000
MODAF
2005
MODAF 1.2
2008
EAP
1992
EAP
1996
FEAF 1.1
1999
FEA 1.0
2001
NIST EA
1989NC3SAF
2000
NAF 2.0
2004
NAF 3.0
2007
Zachmann
1987
Zachmann
1992
Zachmann 2.0.1
2008
IAF
1993
E2AF
2003
E2AF 1.5
2006
IAF 1
1995
IAF 2
1997
IAF v3
2001
IAF 4.0
2007
sebis EAMPC
2008
sebis EAMPC wiki
2009
Sebis EAMPC
2015
Legend:
superseeded by
influenced by
Start of
development
Current
version
No further
development
Intermediate
version
Figure 1.1.: Overview on EA frameworks and the earlier version of the EAMPC based on[Er10]
Another research objective of the EAMPC is to provide a consistent terminology for theintegration of patterns. Organizations can document their current process for the manage-ment of the EA using this structure. The standardized terminology fosters the exchange andcommunication of practice proven solutions for recurring problems. These solutions are col-lected through an established pattern community that revolves around the EAMPC since2008. Every pattern candidate is documented with its unique id and can be traced back to itsorigin, i.e., pattern candidates from the previous release are evaluated again in this version.In the future, the pattern catalog will be expanded and revised with the growing knowledgebase in EAM.
2 © Technische Universität München, sebis, 2015. All rights reserved.

1. Introduction
Fundamental concepts that are common for all EA management processes are illustrated inFigure 1.2. At the core of the figure the EA team is shown that is responsible for the over-all EA management process. The EA team applies various methods that are illustratedwithin the surrounding circle. These methods describe recurring activities that we groupedinto three categories. The first category summarizes methods that are related to the modelingand description of the EA. Depending on the maturity level of the organization the degreeof structure can vary from unstructured documents to more formal languages, e.g., Archi-Mate [LPJ09]. The data collection processes can be either manual or automated throughthe integration of existing information sources [Fa13]. The second category contains methodsthat are related to the communication of the created artifacts. This category is illustratedmuch larger since we think that this should take up most of the time in the EA managementprocess. The third category captures methods for the adaptation and reflection of the processbased on feedback.Management von EA in today’s organizations
Top management
Business stakeholders
Software development
IT operations
Project managers
Software architects
Software developers
Top management
Strategy office Views
Business owners
Application owners
IT operations
Metrics
Reportsreflect
adapt EA Team
model
describe
Figure 1.2.: Fundamental concepts that are common for all EA management processes
The EA team uses methods to address concerns of stakeholders by using specific visualiza-tions. Concerns describe information demands of individual stakeholders that are necessaryto fulfill management goals. To answers these concerns stakeholders provide input duringmodeling and description of the EA, e.g., top management, business owners, and applicationowners. Although existing information sources can be used to collect data about the existingEA, knowledge about relationships and planned states of the EA have to be gathered frominformation providers. Based on this input the EA team creates specific visualizations fordecision makers, i.e., metrics, views, and reports. At the bottom of Figure 1.2 the communi-cation of the EA team with members of project teams is illustrated. The EA team providesarchitecture blueprints and approves the adherence to architectural requirements. Changeson the architecture made by software developers are communicated back to the EA team.The manifestation of the EA management process needs to be tailored for every organization.Influence factors determine which stakeholders, concerns and patterns have to be chosen.
© Technische Universität München, sebis, 2015. All rights reserved. 3
1. Introduction
1.2. Research design
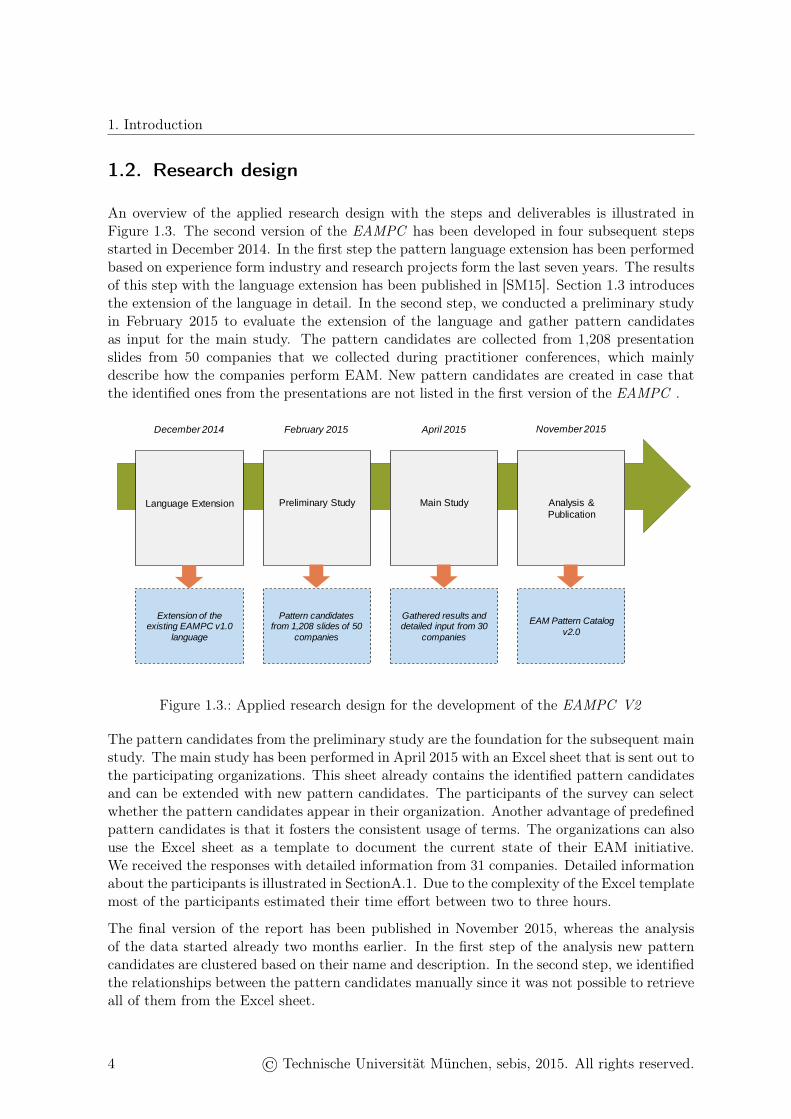
An overview of the applied research design with the steps and deliverables is illustrated inFigure 1.3. The second version of the EAMPC has been developed in four subsequent stepsstarted in December 2014. In the first step the pattern language extension has been performedbased on experience form industry and research projects form the last seven years. The resultsof this step with the language extension has been published in [SM15]. Section 1.3 introducesthe extension of the language in detail. In the second step, we conducted a preliminary studyin February 2015 to evaluate the extension of the language and gather pattern candidatesas input for the main study. The pattern candidates are collected from 1,208 presentationslides from 50 companies that we collected during practitioner conferences, which mainlydescribe how the companies perform EAM. New pattern candidates are created in case thatthe identified ones from the presentations are not listed in the first version of the EAMPC .
Language Extension Preliminary Study Main Study Analysis &
Publication
December 2014 February 2015 April 2015 November 2015
Extension of the existing EAMPC v1.0
language
Pattern candidates from 1,208 slides of 50
companies
Gathered results and detailed input from 30
companies
EAM Pattern Catalog
v2.0
Figure 1.3.: Applied research design for the development of the EAMPC V2
The pattern candidates from the preliminary study are the foundation for the subsequent mainstudy. The main study has been performed in April 2015 with an Excel sheet that is sent out tothe participating organizations. This sheet already contains the identified pattern candidatesand can be extended with new pattern candidates. The participants of the survey can selectwhether the pattern candidates appear in their organization. Another advantage of predefinedpattern candidates is that it fosters the consistent usage of terms. The organizations can alsouse the Excel sheet as a template to document the current state of their EAM initiative.We received the responses with detailed information from 31 companies. Detailed informationabout the participants is illustrated in SectionA.1. Due to the complexity of the Excel templatemost of the participants estimated their time effort between two to three hours.
The final version of the report has been published in November 2015, whereas the analysisof the data started already two months earlier. In the first step of the analysis new patterncandidates are clustered based on their name and description. In the second step, we identifiedthe relationships between the pattern candidates manually since it was not possible to retrieveall of them from the Excel sheet.
4 © Technische Universität München, sebis, 2015. All rights reserved.
1. Introduction
1.3. Extending the language of the EAMPC
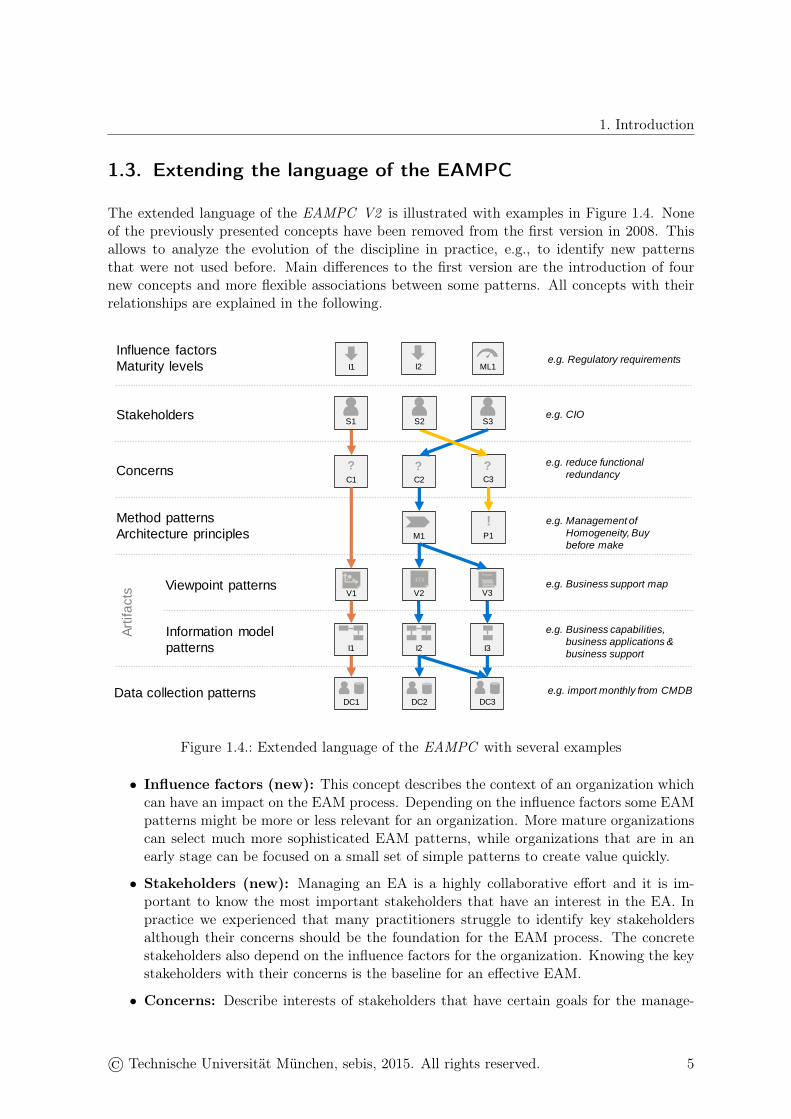
The extended language of the EAMPC V2 is illustrated with examples in Figure 1.4. Noneof the previously presented concepts have been removed from the first version in 2008. Thisallows to analyze the evolution of the discipline in practice, e.g., to identify new patternsthat were not used before. Main differences to the first version are the introduction of fournew concepts and more flexible associations between some patterns. All concepts with theirrelationships are explained in the following.
© sebis150312 Schneider Extending the EAM Pattern Catalog for 2015 1
Stakeholders
Viewpoint patterns
Information model
patterns
Art
ifa
cts
DC1
C1
?
V2
123
V3
Report
V1
I1 I3
DC2
S3
I2
DC3
C2
?C3
?
S1 S2
Concerns
e.g. CIO
e.g. reduce functional
redundancy
e.g. Business support map
e.g. Business capabilities,
business applications &
business support
e.g. import monthly from CMDB
Method patterns
Architecture principlese.g. Management of
Homogeneity, Buy
before makeM1 P1
!
Influence factors
Maturity levels I2 ML1e.g. Regulatory requirements
Data collection patterns
I1
Figure 1.4.: Extended language of the EAMPC with several examples
• Influence factors (new): This concept describes the context of an organization whichcan have an impact on the EAM process. Depending on the influence factors some EAMpatterns might be more or less relevant for an organization. More mature organizationscan select much more sophisticated EAM patterns, while organizations that are in anearly stage can be focused on a small set of simple patterns to create value quickly.
• Stakeholders (new): Managing an EA is a highly collaborative effort and it is im-portant to know the most important stakeholders that have an interest in the EA. Inpractice we experienced that many practitioners struggle to identify key stakeholdersalthough their concerns should be the foundation for the EAM process. The concretestakeholders also depend on the influence factors for the organization. Knowing the keystakeholders with their concerns is the baseline for an effective EAM.
• Concerns: Describe interests of stakeholders that have certain goals for the manage-
© Technische Universität München, sebis, 2015. All rights reserved. 5

1. Introduction
ment of the EA. This concept has been taken from the first version of the pattern catalog.One adaptation in the second version is the association to the new stakeholder conceptand more flexible associations allowing direct links to viewpoints.
• Method patterns: Describe concrete steps that are performed to address the concernsof stakeholders. Methods can be hierarchically structured to break down high levelsteps to concrete tasks for the EA team. In the second version we introduce architectureprinciples which are rather similar to methods, i.e., they are also related to concerns andinfluence the EA. Methods and architecture principles are not always necessary and itis possible to relate concerns directly to viewpoints.
• Viewpoint patterns: Viewpoint patterns illustrate important aspects of the EA toaddress concerns of specific stakeholders. Similar to the previous two concepts, viewpointpatterns have been taken form the first version of the pattern catalog. Although almostall organizations today use viewpoints for their EA, it is important to identify the mostfrequently used viewpoints in practice to avoid unnecessary collection of data. Our goalis to identify a core set of viewpoints that are inevitable for a successful EAM.
• Information model patterns: Viewpoints require certain data for the visualizationof the EA. The information model patterns capture which data is necessary for whichviewpoint pattern. Main advantage of this approach is that it avoids one large informa-tion model that might be difficult to maintain. Depending on the required viewpoints itis possible to incrementally extend the information model. Nevertheless, all informationmodel patterns are based on a common glossary and can be integrated.
• Data collection patterns (new): The provision of data for the information modelpatterns is a time consuming and error prone effort. Data collection patterns describehow this data can be gathered in an organization efficiently, i.e., by integrating existinginformation systems that already contain some data about the EA. Data collectionpatterns also capture best practices about how often certain data needs to be updated.
The underlying conceptual model for the documentation of these concepts is illustrated inFigure 1.5. The V- and I-patterns are summarized since both represent artifacts that arecreated by the EA team. For the sake of brevity not all associations are presented in themodel, e.g., the immediate association from concern to v-pattern. An approach how EAMprocesses can be supported is described in the PhD thesis of Hauder in [Ha16].
Stakeholder Concern1..* 1..*
M-Pattern V-Pattern I-Pattern
**
1..* * 1..* * 1..* *
artefacts
**
**
is layer for
1..* *
visualizes addressed by utilizeshas
DC-Pattern
provided by
uses results of uses concepts of
Figure 1.5.: Conceptual diagram describing the extended language of the second version
6 © Technische Universität München, sebis, 2015. All rights reserved.
1. Introduction
1.4. Miscellaneous information
The EAMPC V2 has an own homepage with further information about the project. It alsocontains the Excel template for the documentation of the EAM patterns. Organizations thatwant to contribute to the knowledge base of EAM patterns are cordially invited to provide ustheir data. More information how to participate and contribute can be found on this page.The homepage is available under the following link:
• https://wwwmatthes.in.tum.de/pages/ugsyi19wmmvl/EAM-Pattern-Catalog-v2
New versions of the EAM patterns are published as a technical report for major releases.In the technical report only patterns are considered that appear at least three times in theorganizations. The EAM Pattern Catalog Wiki is an additional source that contains the latestEAM patterns and pattern candidates. Pattern candidates are not observed three times, butthey might still be valuable for some organizations. The EAM Pattern Catalog Wiki can bereached through the following link:
• https://wwwmatthes.in.tum.de/pages/3b4t6l34g936/EAM-Pattern-Catalog-Wiki
Appropriate tool support is essential for an successful EAM in practice, e.g., for the creationof visualizations and documentation of the EA. The market for EAM tools has been evolvingsimilar to the evolution of the EAM patterns that we observed in practice. Based on ourinitial EAM Tool Study from 2008, we created an update based on the same methodologywith new innovative tool solutions. The EAM Tool Study 2014 Update is available under thefollowing link:
• https://wwwmatthes.in.tum.de/pages/lw3g9moh1o0c/Enterprise-Architecture-Management-Tool-Survey-2014-Update
Due to the importance of visualizations for effective EAM, our group conducted a separate toolsurvey related to EA visualizations in 2014. This EA Visualization Tool Survey 2014 capturesthe visualization capabilities of leading tool solutions and the current practice in industry. Forevery tool solution the survey provides the supported visualizations with example screenshots.Together with the EAMPC it is possible to determine which tool provides the best support forthe required viewpoint patterns that are relevant for an organization. The EA VisualizationTool Survey 2014 is available under the following link:
• https://wwwmatthes.in.tum.de/pages/6u8f5ki1t2yz/EAVTS2014-Enterprise-Architecture-Visualization-Tool-Survey
© Technische Universität München, sebis, 2015. All rights reserved. 7

8

CHAPTER 2
Using the EAMPC
Contents2.1. Implementing an organization-specific EAM . . . . . . . . . . . . 102.2. Performing benchmarks with the EAMPC . . . . . . . . . . . . . 112.3. The EAMPC as basis for academic research . . . . . . . . . . . . 112.4. How to read the EAM pattern graph . . . . . . . . . . . . . . . . 12
Main research objectives of the EAMPC are (1) the stepwise creation and adaptation ofEAM initiatives, (2) the provision of a consistent terminology and (3) the establishment of apattern community. In this chapter three application scenarios are illustrated that describehow practitioners and researchers can benefit from this research. In the first applicationscenario the EAMPC is used to implement an organization-specific EA management. Thisscenario is relevant for organizations that want to establish an approach from the scratchor improve an existing effort. Patterns can be selected step by step in order to identifystakeholders and address their concerns. The main advantage of this approach is that theinitial data collection effort is reduced and benefits are visible early. In the second applicationscenario the pattern catalog can be used as foundation for benchmarks, e.g., in order toidentify gaps in the current approach. This analysis can also be used to eliminate waste andidentify unnecessary data collection efforts that promote a lean EA management. The thirdapplication scenario uses the EAMPC as basis for academic research. Due to the consistentdocumentation it is possible to retrace all patterns throughout all versions of the patterncatalog, i.e., it is possible to identify new patterns. This allows researchers and pracitcionersto evaluate scientific considerations like the evolving scope of EA management in practice anddifferences related to the size, industry sector, maturity etc. of the organization.
© Technische Universität München, sebis, 2015. All rights reserved. 9
2. Using the EAMPC
2.1. Implementing an organization-specific EAM
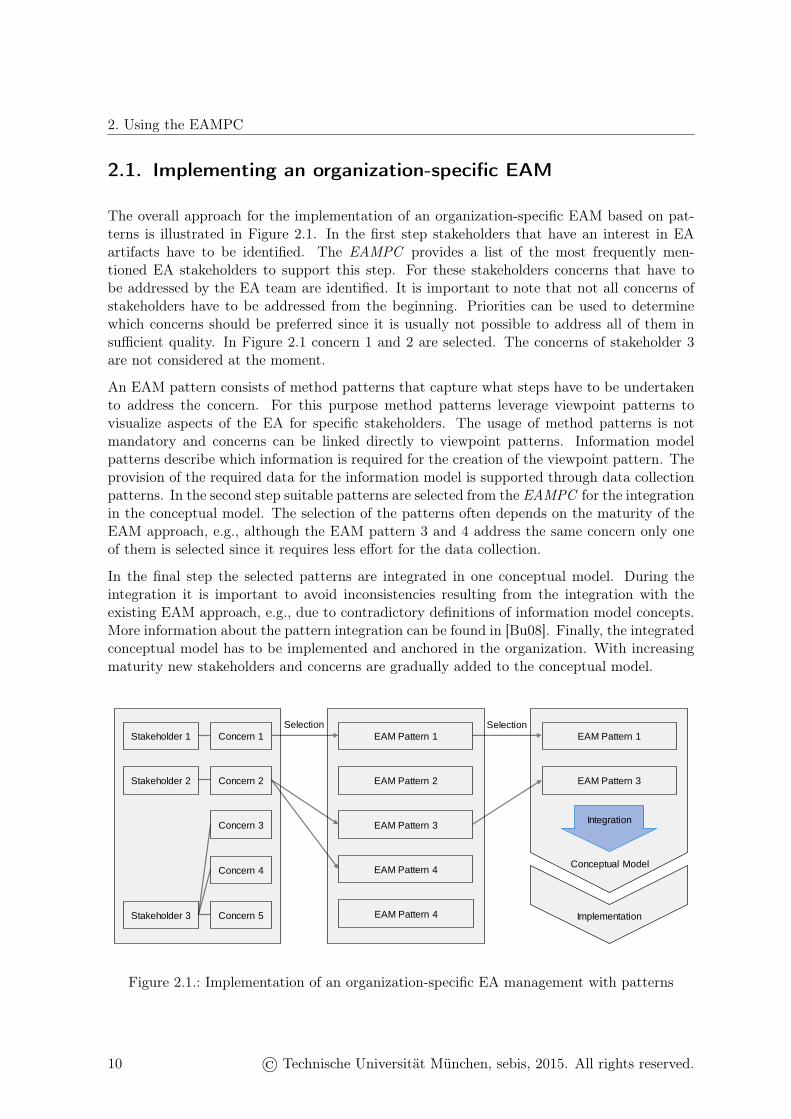
The overall approach for the implementation of an organization-specific EAM based on pat-terns is illustrated in Figure 2.1. In the first step stakeholders that have an interest in EAartifacts have to be identified. The EAMPC provides a list of the most frequently men-tioned EA stakeholders to support this step. For these stakeholders concerns that have tobe addressed by the EA team are identified. It is important to note that not all concerns ofstakeholders have to be addressed from the beginning. Priorities can be used to determinewhich concerns should be preferred since it is usually not possible to address all of them insufficient quality. In Figure 2.1 concern 1 and 2 are selected. The concerns of stakeholder 3are not considered at the moment.
An EAM pattern consists of method patterns that capture what steps have to be undertakento address the concern. For this purpose method patterns leverage viewpoint patterns tovisualize aspects of the EA for specific stakeholders. The usage of method patterns is notmandatory and concerns can be linked directly to viewpoint patterns. Information modelpatterns describe which information is required for the creation of the viewpoint pattern. Theprovision of the required data for the information model is supported through data collectionpatterns. In the second step suitable patterns are selected from the EAMPC for the integrationin the conceptual model. The selection of the patterns often depends on the maturity of theEAM approach, e.g., although the EAM pattern 3 and 4 address the same concern only oneof them is selected since it requires less effort for the data collection.
In the final step the selected patterns are integrated in one conceptual model. During theintegration it is important to avoid inconsistencies resulting from the integration with theexisting EAM approach, e.g., due to contradictory definitions of information model concepts.More information about the pattern integration can be found in [Bu08]. Finally, the integratedconceptual model has to be implemented and anchored in the organization. With increasingmaturity new stakeholders and concerns are gradually added to the conceptual model.
EAM Pattern 1
EAM Pattern 2
EAM Pattern 3
EAM Pattern 4
Stakeholder 1 Concern 1
Concern 2
Concern 3
Concern 4
EAM Pattern 4Concern 5Stakeholder 3
Stakeholder 2
EAM Pattern 1
EAM Pattern 3
Implementation
Conceptual Model
SelectionSelection
Integration
Figure 2.1.: Implementation of an organization-specific EA management with patterns
10 © Technische Universität München, sebis, 2015. All rights reserved.

2. Using the EAMPC
2.2. Performing benchmarks with the EAMPC
As outlined before, a spreadsheet-based practitioner survey has been conducted, to documentthe current practices in the field of EAM. Given the resulting patterns as well as their relationsdocumented in this catalog, the survey can now be used by practitioners to assess the gapbetween their current EAM function and the observed EAM patterns. Such a gap analysiscannot only provide a confirmation in cases where the benefits of a particular EAM design aredoubted. In addition, it can also provide hints to currently unaddressed but maybe relevantconcerns, unconsidered stakeholders or complementary visualizations.
By submitting the spreadsheet used for this self assessment to the researches of the sebischair, such a benchmark can be used to extend the foundation of the EAMPC as well. Thespreadsheet can be downloaded via the EAMPC project website:
https://wwwmatthes.in.tum.de/pages/ugsyi19wmmvl/EAM-Pattern-Catalog-v2
The completed assessment can be sent via Email to one of the involved research assistantsnamed on the project’s web page. Thereby, a continuous extension of the EAMPC can berealized.
2.3. The EAMPC as basis for academic research
In addition to the application of the EAMPC in practice, it may also be seen as a basis forfuture academic research. The plethora of EAM frameworks and methodologies (see [Bu11]for a comprehensive list) is still a challenge on the track towards a commonly agreed-uponterminology as well as a corresponding theory. To develop a theory about how to design anEAM function researchers need to account for both, rigor and relevance [He04]. Following theidea of pattern-based theory building [BMS10], the pattern-based design research method pro-poses a research approach balancing rigor and relevance [Bu13]. Therefore, the pattern-basedapproach to EAM is especially suitable if rigor and relevance should be addressed simulta-neously. The EAMPC forms an intermediate step by documenting a pattern language fromwhich design theories can be derived. In addition, if knowledge available in practice shouldbe used to develop design theories, research activities are subject to special requirements. Ifresearch should be conducted in close cooperation with industry, results need to be deliveredtimely and understandable by practitioners. Both can be achieved by the documentation ofEAM patterns. In addition, the pattern based approach to EAM offers the possibility toimprove single EAM patterns without having to create a completely new approach. Likewise,new patterns concerning new topics can be added easily.
Although common solutions to recurring problems can be observed in the EAM field, the actualimpact of the organizational and the enterprise context on the selection of specific patternshas not been assessed properly yet. Moreover, the information from practitioners gatheredin course of the development of this catalog shows further demands regarding the design ofEAM methods to handle upcoming issues, such as the definition of a business capability map.In addition to that issue, practitioners are looking for meaningful KPI’s to steer EA’s moreefficiently. The sebis chair already published a collection of EAM KPI’s (see [Mo14]), wherebythe definition of more sophisticated KPI’s to measure the complexity of EA’s is still at the
© Technische Universität München, sebis, 2015. All rights reserved. 11

2. Using the EAMPC
very beginning and requires further analysis. The interested reader should also refer to theEnterprise Architecture Visualization Tool Survey describing how typical EAM visualizationsare implemented by different tools [RZM14].
Given these research challenges, we are currently establishing a community which will governthe future development of the EAMPC, by performing reviews, improvements, extensions,etc.
2.4. How to read the EAM pattern graph
As illustrated in Figure 1.4, we extended the EAM pattern graph with further concepts inorder to identify further trends and patterns in the EAM practice. The pattern graph used inthis catalog to illustrate the relationships between different EAM patterns includes also thenovel stakeholder and data collection concepts. Figure 7.35 illustrates this graph for viewpointV-113.3.
V-113.3 I-114C-157
M-29 M-71
M-87 M-114
S-45
S-4 S-10
S-22
S-126
Stakeholders MethodologiesConcerns Viewpoint Informationmodel Datacollection
DC-1 DC-2 DC-3
DC-4 DC-5 DC-6
DC-7 DC-8 DC-9
DC-10
Figure 2.2.: Viewpoint V-113.3 graph
The EAM pattern graph in the EAMPC V2 includes six concepts. The methodologies, stake-holders and data collection patterns are not mandatory: A concern can be related to variousstakeholders, whereby a connection between one particular stakeholder and a concern is onlydocumented if it has been observed more than three times. Otherwise, the respective con-nection cannot be regarded to be a pattern and is not included in the graph. However, mostof the observed and documented pattern graphs in this catalog include all six concepts. Thesame principle can be adapted for the relationship between information model patterns anddata collection patterns as well as the relationship between concerns and methods.
The concern, viewpoint and information model concepts are included in every EAM patterngraph. In case of a missing methodology, the concern is addressed directly by a viewpoint andthe respective EAM pattern graph includes and edge between the concern and the viewpoint.The EAM pattern graph does not include different varieties of edges: All edges reveal that oneconcrete manifestation of the respective concept is addressed by one or more other conceptmanifestations (Concern C-157 is addressed by stakeholders S-4, S-20, S-22, etc.). To omitredundancies, the EAM pattern graphs are only documented within the viewpoint patterns inChapter 7.
12 © Technische Universität München, sebis, 2015. All rights reserved.
CHAPTER 3
Influence Factors
Contents3.1. Overview of influence factors . . . . . . . . . . . . . . . . . . . . . 143.2. Interpretation of results . . . . . . . . . . . . . . . . . . . . . . . . 15
In this chapter, we provide an overview of the influence factors mentioned by the industrypartners. Influence factors have the distinction of having a comprehensive impact on the orga-nizational and operational structure of the whole organization, including strategic decisions,prioritized projects within the organizational units and also on EAM activities. We asked theparticipants, what kind of influence factors are relevant for their respective organization andpresent an aggregated view on the results within Section3.1 whereas the figure only includesthe predefined influence factors within the online survey. The predefined influence factors weregathered from the preliminary study, illustrated in figure 1.1 and includes 17 entries.
We also received 10 further influence factors by the selected industry partners, whereas theseinformation represent individually mentioned influence factors and thus are not representativefor further statistical evaluations. A list of all influence factors, also including influence factors,mentioned by single participants are illustrated within A.2.
© Technische Universität München, sebis, 2015. All rights reserved. 13
3. Influence Factors
3.1. Overview of influence factors
2
2
5
5
7
8
10
10
11
13
13
14
15
16
16
18
28
23
12
10
7
10
9
10
8
11
6
11
10
8
9
5
10
2
3
0
0
1
1
1
4
0
2
5
1
1
0
1
4
1
1
3
17
16
18
13
13
7
13
7
7
6
6
8
5
6
2
0
1 6 11 16 21 26 31
Fusion,Carve-out,M&A
Cultural aspectswithinorganization
Staffagedistribution (e.g.missing juniors)
Expectations ofjunior staff
Restaffingofuppermanagement
Growthoforganization
Changing conditionsofthemarket
Changing priceand incomestructure
Innovation ofbusiness
Changing businessmodelduetomarket trends
Re-organization ofthecompany
Newvision forthebusiness
Industrycompetition
Digitalization andcustomerjourney
ITcost-cutting Initiatives
Technical innovations
Regulatory requirements
High Minor Planned No
E
E
E
E
E
E
E External influence factor
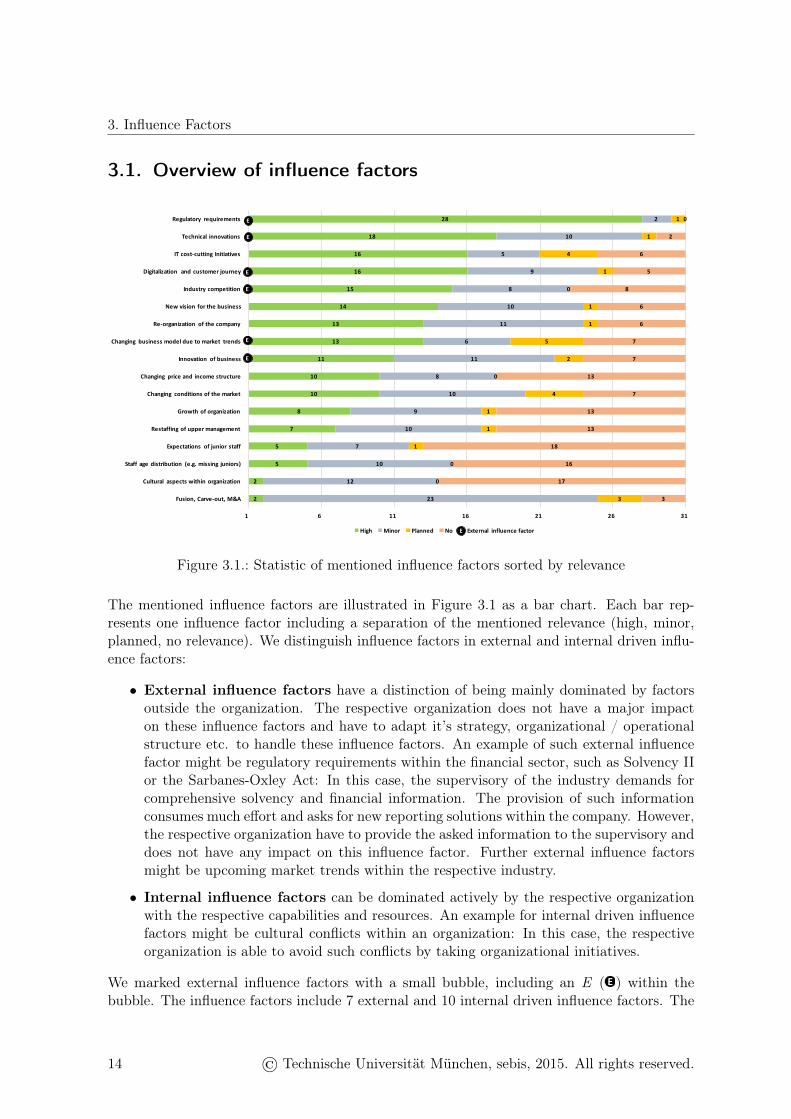
Figure 3.1.: Statistic of mentioned influence factors sorted by relevance
The mentioned influence factors are illustrated in Figure 3.1 as a bar chart. Each bar rep-resents one influence factor including a separation of the mentioned relevance (high, minor,planned, no relevance). We distinguish influence factors in external and internal driven influ-ence factors:
• External influence factors have a distinction of being mainly dominated by factorsoutside the organization. The respective organization does not have a major impacton these influence factors and have to adapt it’s strategy, organizational / operationalstructure etc. to handle these influence factors. An example of such external influencefactor might be regulatory requirements within the financial sector, such as Solvency IIor the Sarbanes-Oxley Act: In this case, the supervisory of the industry demands forcomprehensive solvency and financial information. The provision of such informationconsumes much effort and asks for new reporting solutions within the company. However,the respective organization have to provide the asked information to the supervisory anddoes not have any impact on this influence factor. Further external influence factorsmight be upcoming market trends within the respective industry.
• Internal influence factors can be dominated actively by the respective organizationwith the respective capabilities and resources. An example for internal driven influencefactors might be cultural conflicts within an organization: In this case, the respectiveorganization is able to avoid such conflicts by taking organizational initiatives.
We marked external influence factors with a small bubble, including an E ( E ) within thebubble. The influence factors include 7 external and 10 internal driven influence factors. The
14 © Technische Universität München, sebis, 2015. All rights reserved.
3. Influence Factors
separation of mentioned relevance for a specific influence factor is realized by using differentcolors within every bar. Every influence factor was assessed by 31 participants. The statisticconsiders all answers of the participants, regardless of further organization characteristics suchas the operating industry, the maturity of the EAM or the number of employees.
3.2. Interpretation of results
As mentioned in Section 6.1, each influence factor where marked, whether it illustrates anexternal or internal driven influence factor. The statistic of the mentioned influence factorsshows that external driven influence factors have a higher relevance in today’s organization:Especially regulatory requirements have an major impact on 90% of the participatedorganizations. Due to the fact that the results within Figure 3.1 includes the mentionedinfluence factors, regardless of any industry or further organization characteristic, it turned outthat regulatory requirements influence organizations across all industries. Moreover, the issueof digitalization and customer journey is mentioned as an assessed influence factor by over50% of the participants: Requirements by single customers attract a major attention in today’sorganizations and demands for the implementation of digitalization strategies and solutions.Major cooperation activities including the EAM function of the respective organization mightget an major success factor in the next years.
On the other hand the statistic shows that social aspects, such as cultural aspects within anorganization do not influence today’s organizations in their strategic planning and commonlyon their EAM activities. Also further internal influence factors, such as the restaffing ofthe upper management or the staff age distribution do not have a high impact withintoday’s organizations. Furthermore, the statistic shows that a majority of influence factors arenot clearly marked as an influence factor with high or no relevance: Major influence factorswere marked with a minor relevance, such as fusion, carve-out and M&A (over 70% ofparticipants) activities. Moreover, only a minority of the influence factors were assessed asplanned. This shows that today’s organizations evaluate, whether an influence factor mightimpact their corporate strategy and EAM: Organizations pay attention on influence factorswith high or minor relevance or exclude the influence factors from their strategy and EAMplanning activities.
The results of the survey show clearly that specific influence factors, such as regulatory re-quirements or the customer journey, have a major impact in organizations, regardless on theirindustry. However, to handle these influence factors, organizations have to consider increasedEAM activities, including the definition and refinement of the respective methods and ca-pabilities. [Ha13c] already evaluated influence factors and challenges on EAM functions intoday’s organizations, such as missing understanding of EAM by other organizational units orthe difficulty of oversized EAM models. For further information about these influence factorsand challenges, we refer to the respective publication.
© Technische Universität München, sebis, 2015. All rights reserved. 15

16
CHAPTER 4
Stakeholders
Contents4.1. Overview of stakeholders . . . . . . . . . . . . . . . . . . . . . . . . 184.2. Amount of mentioned concerns for each stakeholder . . . . . . . 19
As mentioned in Section 1.1, the EA team uses methods to address concerns of stakeholdersby using specific viewpoints. Every of these provides the opportunity to present the currentstatus and progress of one or multiple concerns (see Section 5 for further information aboutthe concerns). In the domain of EAM, a stakeholder represents a specific party or a staffedrole, which is interested in the success or failure of the EAM activities within the respectiveorganization [Ha13a]. A stakeholder does not need to be employed within the respective orga-nization: Further external parties, such as external auditors or the supervision of a respectiveindustry might also be interested in specific EAM topics.
In this section, we provide an overview of the mentioned stakeholder by the industry partners interms of EAM. Moreover, we highlight identified patterns of stakeholder in terms of mentionedconcerns. We identified 23 stakeholders within the preliminary study, whereas the list ofentries includes IT related and business related stakeholders. We also received four furtherstakeholders by selected industry partners, whereas these information represent individuallymentioned stakeholders and thus are not representative for further statistical evaluations.A list of all stakeholders, also including stakeholders, mentioned by single participants areillustrated within A.3.
© Technische Universität München, sebis, 2015. All rights reserved. 17

4. Stakeholders
4.1. Overview of stakeholders
When proceeding the online survey, participants were asked to answer, whether specific EAMconcerns receive attention in the respective organization. The participants were also asked tomap relevant stakeholders to interested / responsible stakeholders, whereas the survey providesthe opportunity to select three different stakeholders for every concern. Figure 4.1 illustratethe amount of the mentioned stakeholder for one or multiple concerns by the participants.
1
2
2
2
3
4
4
6
8
8
8
9
10
12
15
17
23
24
25
26
27
30
30
0 5 10 15 20 25 30
Consultants
Internal / External audit
Requirements engineer
Business analyst
Corp. development / governance
Software developer
Process owner
Data owner
Controller (business or IT)
Project manager business
Business owner
Portfolio manager (business or IT)
COO
Application owner
Business / Process architect
Head of Dep. IT
CFO
Domain / Solution architect
Head of dep. business
Project manager IT
Enterprise architect
CIO
Technical architect
Figure 4.1.: Mentioned stakeholders for concerns sorted by incidences
The illustrated statistic in Figure 4.1 shows that nowadays EAM receives increased attractionby the upper management of organizations: The CIO, CFO as well as the COO appears in thestatistics. Even business related stakeholders such as the head of dep. business (25 matches)and the CFO (23 matches) get involved in EAM activities, which shows that nowadays EAMdoes not only relate to IT functions of organizations, but also business functions identifiedthe added value of EAM for their business. The statistic also shows that EAM illustrate anorganization intern related topic: External parties, the auditors or consultants, have less touchpoints with EAM activities.
18 © Technische Universität München, sebis, 2015. All rights reserved.
4. Stakeholders
4.2. Amount of mentioned concerns for each stakeholder
1
2
2
2
2
2
2
5
6
7
9
13
15
18
19
20
22
26
28
32
32
37
39
0 5 10 15 20 25 30 35 40
Consultants
Requirements engineer
Data owner
Software developer
Internal / External audit
Process owner
Business analyst
Corpoprate development / governance
Project manager business
Controller (business or IT)
Portfolio manager (business or IT)
Business owner
CFO
Application owner
COO
Business / Process architect
Project manager IT
Head of dep. business
Technical architect
CIO
Head of dep. IT
Enterprise architect
Domain / Solution architect
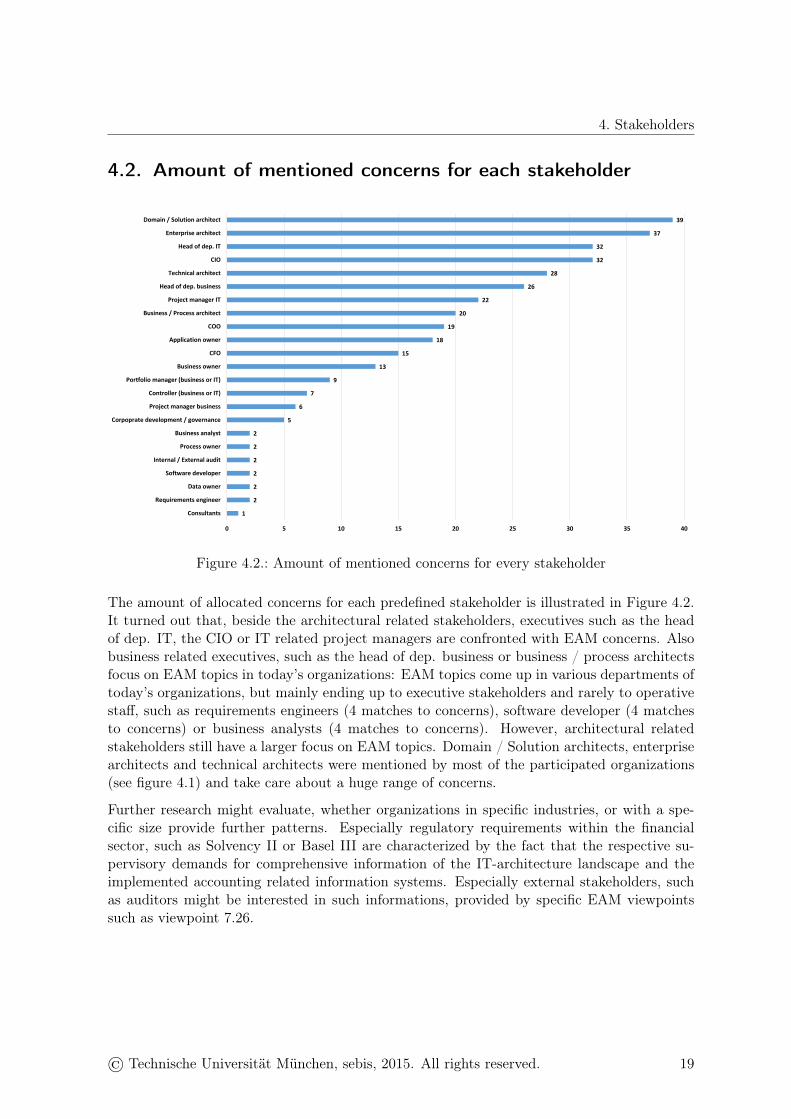
Figure 4.2.: Amount of mentioned concerns for every stakeholder
The amount of allocated concerns for each predefined stakeholder is illustrated in Figure 4.2.It turned out that, beside the architectural related stakeholders, executives such as the headof dep. IT, the CIO or IT related project managers are confronted with EAM concerns. Alsobusiness related executives, such as the head of dep. business or business / process architectsfocus on EAM topics in today’s organizations: EAM topics come up in various departments oftoday’s organizations, but mainly ending up to executive stakeholders and rarely to operativestaff, such as requirements engineers (4 matches to concerns), software developer (4 matchesto concerns) or business analysts (4 matches to concerns). However, architectural relatedstakeholders still have a larger focus on EAM topics. Domain / Solution architects, enterprisearchitects and technical architects were mentioned by most of the participated organizations(see figure 4.1) and take care about a huge range of concerns.
Further research might evaluate, whether organizations in specific industries, or with a spe-cific size provide further patterns. Especially regulatory requirements within the financialsector, such as Solvency II or Basel III are characterized by the fact that the respective su-pervisory demands for comprehensive information of the IT-architecture landscape and theimplemented accounting related information systems. Especially external stakeholders, suchas auditors might be interested in such informations, provided by specific EAM viewpointssuch as viewpoint 7.26.
© Technische Universität München, sebis, 2015. All rights reserved. 19

20

CHAPTER 5
Concerns
Contents5.1. Overview of concerns . . . . . . . . . . . . . . . . . . . . . . . . . . 225.2. Amount of allocated stakeholders for every concern . . . . . . . 23
As mentioned in section 1.1, the EA team uses methods to address concerns of stakeholdersby using specific viewpoints and each of them provides the opportunity to present the currentstatus and progress of one or multiple concerns (see section 4 for further information aboutthe stakeholders). In case of EAM, In accordance with the ISO Standard 42010 concernsare defined as those areas of interests which pertain to the system’s enterprise development,its operation or any other aspect that are critical or otherwise important to one or morestakeholders [Int07]. [Bu10] provide a more pragmatic definition of concerns: "A concern canbe understood as the area of the enterprise that the respective stakeholder is interestedin." We also state that a concern focus on interest of respective stakeholder, but concretize thearea of the enterprise to specific architecture related issues and interests, such as architecturalstandardization, KPI measurement or further topics that have an direct impact to the EAMof an organization.
In this section, we provide an overview of the mentioned concerns by the industry partners interms of EAM. Moreover we highlight identified patterns of concerns in terms of mentionedstakeholders. A pattern is characterized by the fact that the respective constellation werementioned at least three times; in this case a specific stakeholder were named not less thanthree times combined with a specific concern. We identified 37 concerns within the preliminarystudy. We also received three further concerns by single industry partners, whereas theseinformation represent individually mentioned concerns and thus are not representative forfurther statistical evaluations.
© Technische Universität München, sebis, 2015. All rights reserved. 21
5. Concerns
5.1. Overview of concerns
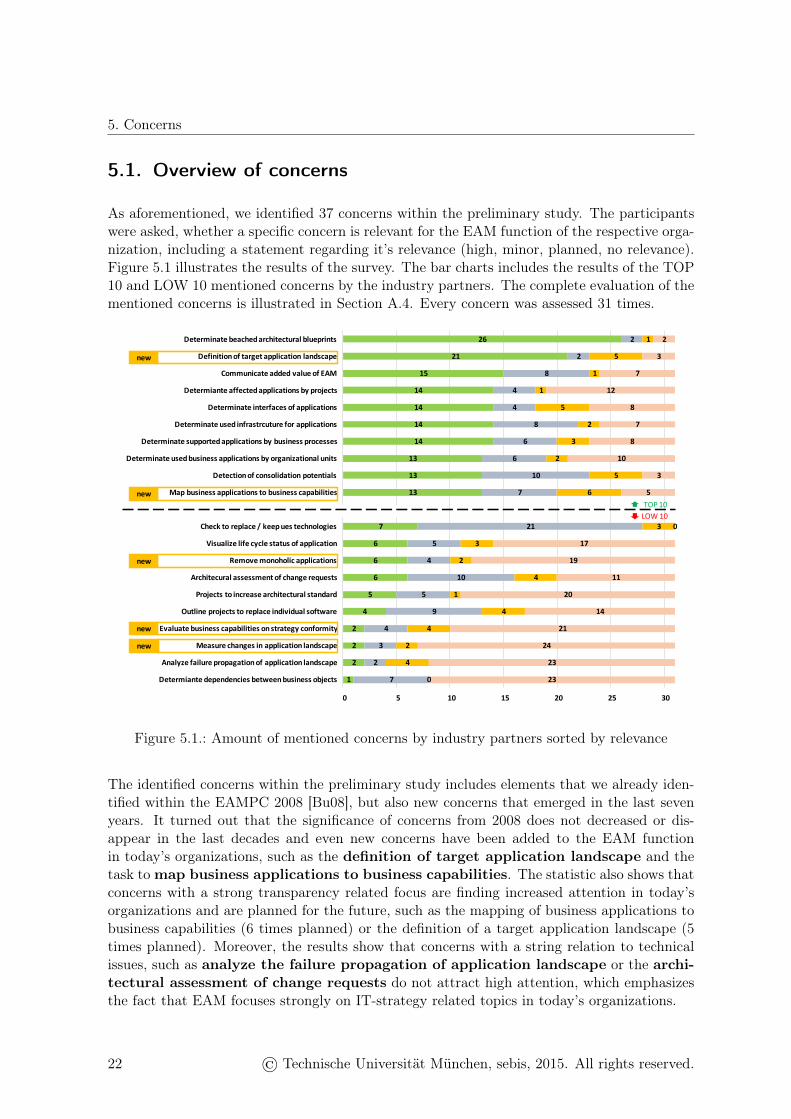
As aforementioned, we identified 37 concerns within the preliminary study. The participantswere asked, whether a specific concern is relevant for the EAM function of the respective orga-nization, including a statement regarding it’s relevance (high, minor, planned, no relevance).Figure 5.1 illustrates the results of the survey. The bar charts includes the results of the TOP10 and LOW 10 mentioned concerns by the industry partners. The complete evaluation of thementioned concerns is illustrated in Section A.4. Every concern was assessed 31 times.
1
2
2
2
4
5
6
6
6
7
0
13
13
13
14
14
14
14
15
21
26
7
2
3
4
9
5
10
4
5
21
0
7
10
6
6
8
4
4
8
2
2
0
4
2
4
4
1
4
2
3
3
0
6
5
2
3
2
5
1
1
5
1
23
23
24
21
14
20
11
19
17
0
0
5
3
10
8
7
8
12
7
3
2
0 5 10 15 20 25 30
Determiantedependenciesbetweenbusinessobjects
Analyzefailurepropagationofapplicationlandscape
Measurechangesinapplicationlandscape
Evaluatebusinesscapabilitiesonstrategyconformity
Outlineprojectstoreplaceindividualsoftware
Projectstoincreasearchitecturalstandard
Architecuralassessmentofchangerequests
Removemonoholicapplications
Visualizelifecyclestatusofapplication
Checktoreplace/keepuestechnologies
CUT
Mapbusinessapplicationstobusinesscapabilities
Detectionofconsolidationpotentials
Determinateusedbusinessapplicationsbyorganizationalunits
Determinatesupportedapplicationsbybusinessprocesses
Determinateusedinfrastrcutureforapplications
Determinateinterfacesofapplications
Determianteaffectedapplicationsbyprojects
CommunicateaddedvalueofEAM
Definitionoftargetapplicationlandscape
Determinatebeachedarchitecturalblueprints
High Minor Planned No
TOP10LOW10
new
new
new
new
new
Figure 5.1.: Amount of mentioned concerns by industry partners sorted by relevance
The identified concerns within the preliminary study includes elements that we already iden-tified within the EAMPC 2008 [Bu08], but also new concerns that emerged in the last sevenyears. It turned out that the significance of concerns from 2008 does not decreased or dis-appear in the last decades and even new concerns have been added to the EAM functionin today’s organizations, such as the definition of target application landscape and thetask to map business applications to business capabilities. The statistic also shows thatconcerns with a strong transparency related focus are finding increased attention in today’sorganizations and are planned for the future, such as the mapping of business applications tobusiness capabilities (6 times planned) or the definition of a target application landscape (5times planned). Moreover, the results show that concerns with a string relation to technicalissues, such as analyze the failure propagation of application landscape or the archi-tectural assessment of change requests do not attract high attention, which emphasizesthe fact that EAM focuses strongly on IT-strategy related topics in today’s organizations.
22 © Technische Universität München, sebis, 2015. All rights reserved.
5. Concerns
5.2. Amount of allocated stakeholders for every concern
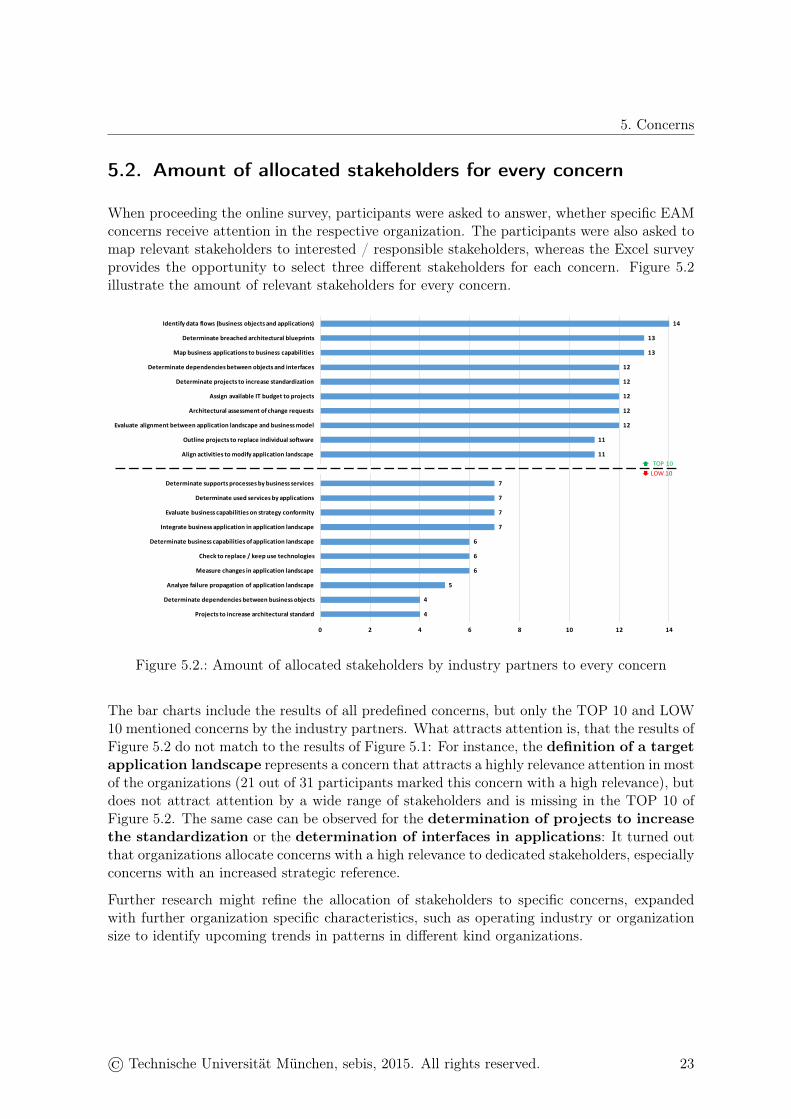
When proceeding the online survey, participants were asked to answer, whether specific EAMconcerns receive attention in the respective organization. The participants were also asked tomap relevant stakeholders to interested / responsible stakeholders, whereas the Excel surveyprovides the opportunity to select three different stakeholders for each concern. Figure 5.2illustrate the amount of relevant stakeholders for every concern.
4
4
5
6
6
6
7
7
7
7
0
11
11
12
12
12
12
12
13
13
14
0 2 4 6 8 10 12 14
Projectstoincreasearchitecturalstandard
Determinatedependenciesbetweenbusinessobjects
Analyzefailurepropagationofapplicationlandscape
Measurechangesinapplicationlandscape
Checktoreplace/keepusetechnologies
Determinatebusinesscapabilitiesofapplicationlandscape
Integratebusinessapplicationinapplicationlandscape
Evaluatebusinesscapabilitiesonstrategyconformity
Determinateusedservicesbyapplications
Determinatesupportsprocessesbybusinessservices
CUT
Alignactivitiestomodifyapplicationlandscape
Outlineprojectstoreplaceindividualsoftware
Evaluatealignmentbetweenapplicationlandscapeandbusinessmodel
Architecturalassessmentofchangerequests
AssignavailableITbudgettoprojects
Determinateprojectstoincreasestandardization
Determinatedependenciesbetweenobjectsandinterfaces
Mapbusinessapplicationstobusinesscapabilities
Determinatebreachedarchitecturalblueprints
Identifydataflows(businessobjectsandapplications)
TOP10LOW10
Figure 5.2.: Amount of allocated stakeholders by industry partners to every concern
The bar charts include the results of all predefined concerns, but only the TOP 10 and LOW10 mentioned concerns by the industry partners. What attracts attention is, that the results ofFigure 5.2 do not match to the results of Figure 5.1: For instance, the definition of a targetapplication landscape represents a concern that attracts a highly relevance attention in mostof the organizations (21 out of 31 participants marked this concern with a high relevance), butdoes not attract attention by a wide range of stakeholders and is missing in the TOP 10 ofFigure 5.2. The same case can be observed for the determination of projects to increasethe standardization or the determination of interfaces in applications: It turned outthat organizations allocate concerns with a high relevance to dedicated stakeholders, especiallyconcerns with an increased strategic reference.
Further research might refine the allocation of stakeholders to specific concerns, expandedwith further organization specific characteristics, such as operating industry or organizationsize to identify upcoming trends in patterns in different kind organizations.
© Technische Universität München, sebis, 2015. All rights reserved. 23

24
CHAPTER 6
Methodology Patterns and Principles
Contents6.1. Overview of architecture principles . . . . . . . . . . . . . . . . . . 266.2. Identification of architecture principle sets . . . . . . . . . . . . . 266.3. Overview of used methodologies . . . . . . . . . . . . . . . . . . . 28
In this section, we provide an overview of architecture principles, mentioned by the industrypartners and explain the methodologies, which are used to provide the viewpoints as illustratedin Section 7.
Architecture principles and methodologies have in common that both constructs are used tocontrol EAs in organizations, whereas architecture principles provide foundational directionsof impact on a strategic level. They represent the essence of architectures and can be seen asa glue between high-level strategic intentions and concrete design decisions [GP11]. Method-ologies are used on an operational level to align the EA to these architectural principles andimpact how far a concrete architectural solution fits to the defined architectural principles. Inthe first part of the section, we provide a statistical overview of the mentioned architectureprinciples, including an interpretation of the results. In the second part of the chapter, we ex-plain the used methodologies in detail. The single methodologies were grouped to methodologytopics.
© Technische Universität München, sebis, 2015. All rights reserved. 25
6. Methodology Patterns and Principles
6.1. Overview of architecture principles
6
3
7
5
8
8
8
7
9
14
11
16
16
18
18
21
22
26
27
3
5
4
7
6
5
5
6
8
3
9
4
7
4
4
6
5
2
3
1
2
1
1
0
0
1
1
0
0
1
5
2
4
4
1
2
1
0
21
21
19
18
17
18
17
17
14
14
10
6
6
5
5
3
2
2
1
0 5 10 15 20 25 30
Seperatedmodelingofprocesses,organizationandIT
Systemshavepredefinedruntime,Removalofoldsystemsismandatory
Toolsupportforproductdevelopmentanddirectchangeopportunitiesforfunctionalareas
Functionaltargetimageasaframeworkforthedeploymentofsystems
Commondevelopmentofcommonsourcecodeforgroup-wideinformationsystems
Provisionoftargetgroupspecificfunctionalities
Process- andtask-orientedarchitecturalsolutions
Subsidiariesareresponsibleforowndata;commondatamodelforgroup-wideinformation
Analysesareconductedbyacentraldatawarehousesystem
Highavailabilityofsales&andcustomerportals
Preventionofreplicationofinventorydata
Service-orientationofarchitecture
Considerarchitectureprinciplesinfutureapplicationlandscapedevelopment
Loosecouplingofsystemsorservices
Highflexibility,efficencyandmodularityofarchitecturalsolutions
Buybeforemake
Reuseoffunctionality
Technologyportfolioisbasedonfewtechnologies
Compliancewithsecurityregulations
High Minor Planned No
Figure 6.1.: Statistics of mentioned architecture principles, sorted by relevance
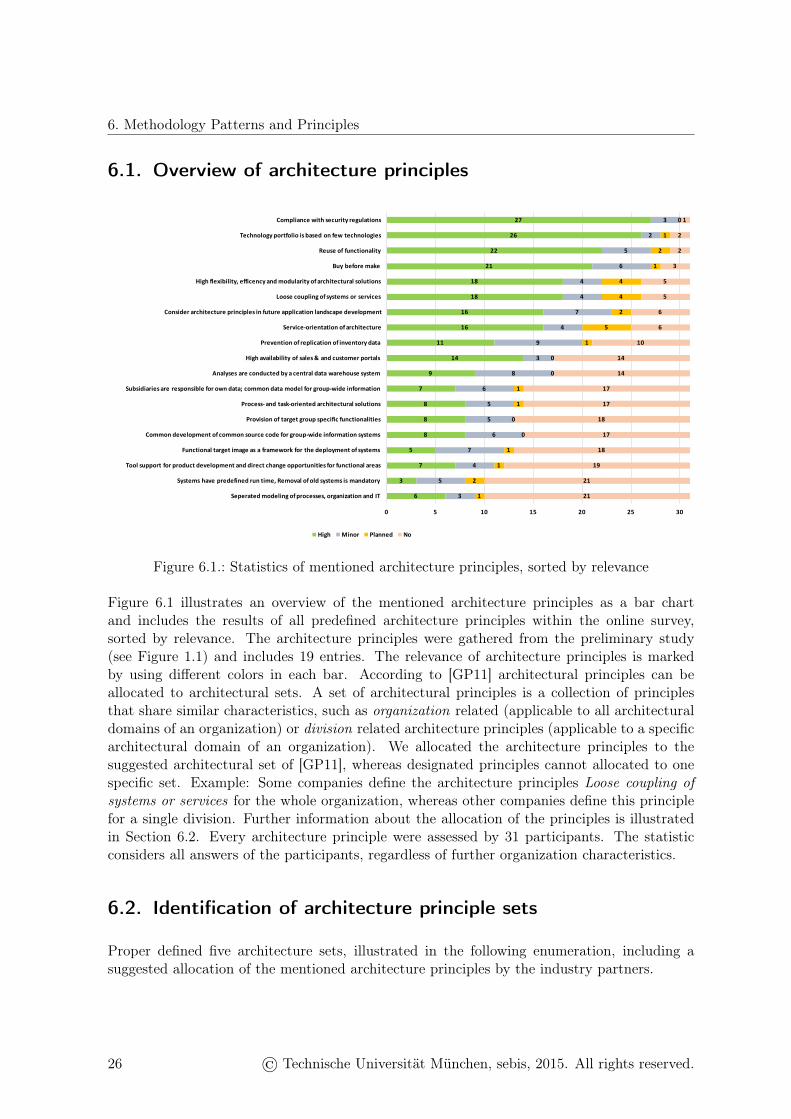
Figure 6.1 illustrates an overview of the mentioned architecture principles as a bar chartand includes the results of all predefined architecture principles within the online survey,sorted by relevance. The architecture principles were gathered from the preliminary study(see Figure 1.1) and includes 19 entries. The relevance of architecture principles is markedby using different colors in each bar. According to [GP11] architectural principles can beallocated to architectural sets. A set of architectural principles is a collection of principlesthat share similar characteristics, such as organization related (applicable to all architecturaldomains of an organization) or division related architecture principles (applicable to a specificarchitectural domain of an organization). We allocated the architecture principles to thesuggested architectural set of [GP11], whereas designated principles cannot allocated to onespecific set. Example: Some companies define the architecture principles Loose coupling ofsystems or services for the whole organization, whereas other companies define this principlefor a single division. Further information about the allocation of the principles is illustratedin Section 6.2. Every architecture principle were assessed by 31 participants. The statisticconsiders all answers of the participants, regardless of further organization characteristics.
6.2. Identification of architecture principle sets
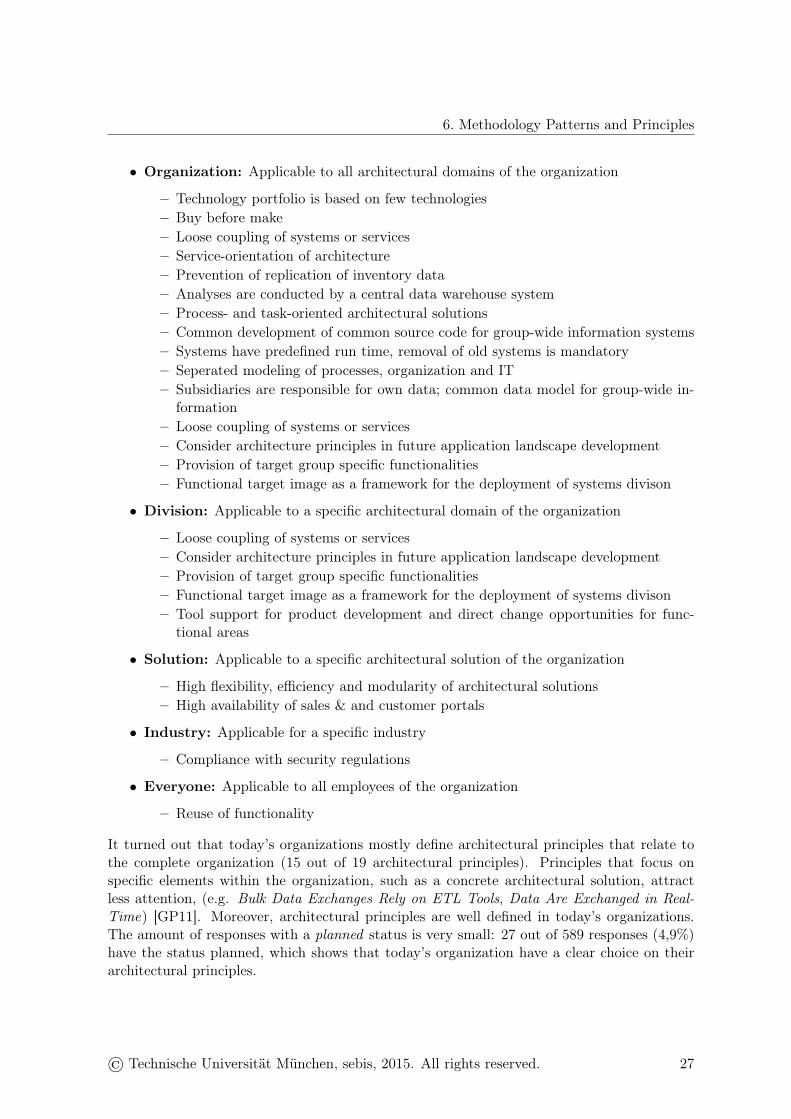
Proper defined five architecture sets, illustrated in the following enumeration, including asuggested allocation of the mentioned architecture principles by the industry partners.
26 © Technische Universität München, sebis, 2015. All rights reserved.
6. Methodology Patterns and Principles
• Organization: Applicable to all architectural domains of the organization
– Technology portfolio is based on few technologies– Buy before make– Loose coupling of systems or services– Service-orientation of architecture– Prevention of replication of inventory data– Analyses are conducted by a central data warehouse system– Process- and task-oriented architectural solutions– Common development of common source code for group-wide information systems– Systems have predefined run time, removal of old systems is mandatory– Seperated modeling of processes, organization and IT– Subsidiaries are responsible for own data; common data model for group-wide in-
formation– Loose coupling of systems or services– Consider architecture principles in future application landscape development– Provision of target group specific functionalities– Functional target image as a framework for the deployment of systems divison
• Division: Applicable to a specific architectural domain of the organization
– Loose coupling of systems or services– Consider architecture principles in future application landscape development– Provision of target group specific functionalities– Functional target image as a framework for the deployment of systems divison– Tool support for product development and direct change opportunities for func-
tional areas
• Solution: Applicable to a specific architectural solution of the organization
– High flexibility, efficiency and modularity of architectural solutions– High availability of sales & and customer portals
• Industry: Applicable for a specific industry
– Compliance with security regulations
• Everyone: Applicable to all employees of the organization
– Reuse of functionality
It turned out that today’s organizations mostly define architectural principles that relate tothe complete organization (15 out of 19 architectural principles). Principles that focus onspecific elements within the organization, such as a concrete architectural solution, attractless attention, (e.g. Bulk Data Exchanges Rely on ETL Tools, Data Are Exchanged in Real-Time) [GP11]. Moreover, architectural principles are well defined in today’s organizations.The amount of responses with a planned status is very small: 27 out of 589 responses (4,9%)have the status planned, which shows that today’s organization have a clear choice on theirarchitectural principles.
© Technische Universität München, sebis, 2015. All rights reserved. 27
6. Methodology Patterns and Principles
6.3. Overview of used methodologies
6.3.1. Methodology M-2: Analysis of standard conformity of the applicationlandscape
Methodology overview
Id M-2Name Analysis of standard conformity of the application landscapeSummary This M-Pattern provides a procedure to analyze, whether the appli-
cation landscape of the respective organization corresponds to thedefined IT standards.
Methodology topic Technology HomogenityAddressed concerns C-4, C-5, C-44, C-101, C-110, C-120, C-124, C-141, C-169
As already mentioned within the EAMPC 2008, today’s organizations address the issue ofapplication landscapes of growing complexity, including various technologies, architectures,platforms, etc.: The complexity of application landscapes is characterized by various facts,such as missing transparency of the used infrastructure and applications, the increased numberof transitive interfaces, etc. Moreover, an increasing number of different technologies providefundamental security issues in terms of possible outages, vulnerability by external users andincreased regulatory requirements. Thus, larger organizations attempt to define clear stan-dards within the application landscape regarding approved technologies.
Process steps
1. Provide initial overview: The scope of application landscape standardization mighthave a wide range: Some organization might consider only the standardization of databasesand platforms, whereas further organizations might also define standards for interfacetechnologies, application platforms or programming languages. Before starting to de-fine the scope of the standardization, organizations should gather further IT applicationlandscape information to determine commonly used elements within the applicationlandscape and exclude rarely used elements. Roth already evaluated EA informationcollection strategies and it turned out that the typical practice in today’s organizationsis the manual collection of information from databases and repositories or the con-duction of interviews and workshops with various stakeholders [Ro13].
2. Scoping and selecting standards: Based on the acquired information about the EA,organizations have to define, what kind of architecture elements have to be consideredwithin the standardization scope. Moreover, organizations have to choose standardtechnologies within their IT portfolio. Scope and selection of standards might dependon the following characteristics:
• Amount of specific elements: Organizations should consider largely used elementswithin the standardization scope. Example: When running 250 database systemswithin the organization on 19 different database technologies, the databases shouldbe considered within the standardization scope. On the other hand, databasesmight be excluded from the standardization scope, when running only 23 databases
28 © Technische Universität München, sebis, 2015. All rights reserved.
6. Methodology Patterns and Principles
on 3 different technologies.
• Business and security requirements: Depending on the business requirements of therespective departments, the applications need to run on a respective infrastructure.For instance, the choice of the database might depend on the required performance(e.g. high performance needed, when analyzing huge data packages). Moreover,the supervisory of the respective organization demands for increased security anddocumentation requirements.
• Current use: Especially large organizations have to consider, what kind of tech-nologies are currently running within their application landscape. Example: whenalready running 80% of the database systems on Oracle solutions, it might bereasonable to define Oracle database products as a standard solution.
3. Prioritize, roll-out and measure: The used information systems are servant of twomasters: On the one hand, the executive board of large organizations demands for costcutting initiatives in terms of IT operations and projects, but also asks for innovativeIT solutions to support the respective business requirements and to enable innovativeproducts. The prioritization of standardization initiatives has to be discussed betweenvarious stakeholder (business and IT), including different aspects, such as markettrends, customer demands and regulatory requirements. The roll-out of standardizationinitiatives is realized by respective project proposals, including a clear defined blueprintprocess. Specific viewpoints, such as viewpoint V-107.1 (Section 7.1.1) to measure thesuccess of standardization initiatives.
© Technische Universität München, sebis, 2015. All rights reserved. 29
6. Methodology Patterns and Principles
6.3.2. Methodology M-58: Interpretation of architecture KPIs over time tomake application landscape changes visible
Methodology overview
Id M-58Name Interpretation of architecture KPIs over time to make application
landscape changes visibleSummary This M-Pattern provides an overview of KPI’s to provide an overview
of changes within the application landscapeMethodology topic Application Landscape PlanningAddressed concerns C-4, C-5, C-44, C-101, C-110, C-120, C-124, C-141, C-169
Key Performance Indicators (KPI) illustrate an upcoming trend in case of EAM methods:Over 70% of the participants plan to implement EA specific KPIs within their organizationsto measure the performance and complexity of application and infrastructure landscapes.When defining EAM KPIs, organizations have to choose, what kind of EA layer and topicshould be measured and what kind of stakeholder should be addressed with the respectiveKPI. Possible layers are:
• Strategies & projects
• Principles & standards
• Business capabilities
• Organization & processes
• Business-IT alignment
• Application & information
• Infrastructure services
• Infrastructure & data
Moreover, each KPI should include a measurement frequency, a target, planned and toleratedvalue and clear escalation rules. The enterprise architect has to provide the needed informationfrom the available data sources to realize the implementation of the KPI.
The chair for Software Engineering for Business Information Systems already published acomprehensive EAM KPI Catalog, including various KPIs for each EAM layer / topic andalready filled out best practices.
https://wwwmatthes.in.tum.de/pages/19kw70p0u5vwv/EAM-KPI-Catalog
30 © Technische Universität München, sebis, 2015. All rights reserved.
6. Methodology Patterns and Principles
6.3.3. Methodology M-69: Management of application landscape complexity
Methodology overview
Id M-69Name Management of application landscape complexitySummary This M-Pattern provides a summary of how to manage the complexity
of application landscapes in today’s organizationsMethodology topic Application Landscape PlanningAddressed concerns C-4, C-5, C-44, C-101, C-110, C-120, C-124, C-141, C-169
One of the fundamental problems to be addressed in this method is the growing complexityof the application landscape induced by several different reasons. This might include localdecision making, the inherent complexity of the business, technological progress, legal require-ments and short-term optimization [SM14]. Controlling this growth is thereby supposed todecrease costs, incidents, skill dependence and shadow IT while agility is increased [SM14].
A typical solution to this problem is based on a three-stage process:
1. Define complexity: In the first stage, relevant aspects of complexity need to be definedand brought into agreement with all stakeholders. Thereby, aspects related to singleapplications should be considered in addition to aspects related to the whole applicationlandscape. Furthermore, business complexity needs to be defined as well or declared tobe out of scope. If possible, target directions for complexity evolution should be definedfor each domain individually.
2. Implement measures: In the second stage, measures to increase or decrease appli-cation landscape complexity need to be implemented. This includes, for example, theretirement of business applications, a simplification of the architecture and the definitionof an appropriate target architecture.
3. Measure progress: In the third stage, organizational learning should be enabled byquantifying application landscape complexity and assess, whether the previously im-plemented measures take the intended effect. Therefore, it is essential that regularsnap-shots of the enterprise architecture description are stored separately to generatetime-line charts.
Managing application landscape complexity is a continuous task due to the constant imple-mentation of changes within the application landscape. Therefore, stages two and three needto be carried out iteratively. To measure application landscape complexity, the followingmetrics can be used [Sc15]: number of applications (V-117), number of information flows(V-115), standard conformity (V-118), number of infrastructure elements (V-119), functionalscope (V-120) and functional redundancy (V-116). In addition, scientific indicators can alsobe used [Mo09, SWK13]. If more than one metric is used, a comprehensive overview can beprovided by using a complexity dashboard to visualize all metrics next to each other.
© Technische Universität München, sebis, 2015. All rights reserved. 31

6. Methodology Patterns and Principles
6.3.4. Methodology M-71: Elimination of functional redundancies
Methodology overview
Id M-71Name Elimination of functional redundanciesSummary This M-Pattern provides a procedure of how to analyze functional
redundancies in large application landscapesMethodology topic Application Landscape PlanningAddressed concerns C-2, C-4, C-124, C-157
Large organizations often tackle the problem of running redundant applications in their cur-rent application portfolio. This issue does not represent a risk for the executability of therespective daily business, but rather causes avoidable additional efforts. However, the removalof redundant applications within the application portfolio asks for high transparency withinthe enterprise architecture as a prerequisite.
Process steps
1. Definition of a capability map: Before starting to remove redundant applicationswithin the application portfolio, the EA team has to provide an overview of the usedapplications for each business process. It turned out, that the definition of a capabilitymap, including an allocation of each business application to a defined business capa-bility represents an appropriate method. Each business capability comprises a specificamount of skills or resources to support dedicated business functions [Ha14a]. After thedefinition of a capability map and the allocation of the productive business applicationsto one business capability, the EA team is able to evaluate each business applicationon it’s support function for the respective business capability. The definition of thecapability map and the identification of functional redundancies demands for high col-laboration between various stakeholders including EA, business and IT departments.Further information about the definition of capability maps can be found in [Ha14b].
2. Prioritization of initiatives: After the definition of the capability map and the iden-tification of functional redundancies, the EA team has to prioritize potential removalcandidates within the application landscape. This prioritization has to consider definedstandard technologies, needed effort and potential cost savings and further re-quirements from the business stakeholders.
3. Monitoring function: To make sure that the performed activities were on no purpose,the respective organizations have to define transparent governance principles in order tokeep the application landscapes free from functional redundancies. When implementingnew applications within IT landscape, this governance principles should consider theconformance of standard technologies, the sign-off from the respective business capabilityresponsibility and continuous maintenance of the business capability map.
32 © Technische Universität München, sebis, 2015. All rights reserved.
6. Methodology Patterns and Principles
6.3.5. Methodology M-114: Analysis of which capability is supported by whichbusiness application
Methodology overview
Id M-114Name Analysis of which capability is supported by which business applica-
tionSummary This M-Pattern provides a parameters and hints that should be con-
sidered, when allocating business applications to an existing businesscapability map
Methodology topic Application Landscape PlanningAddressed concerns C-4, C-51, C-62, C-87, C-119, C-122, C-127, C-142, C157
After defining a business capability map for the organization and the initial allocation of theproductive business applications to appropriate business capabilities, the EAM team has toprovide clear principles of how to allocate business applications that are implemented after-wards to appropriate business capabilities. One industry partner already conducted a businesscapability map definition and provided us detailed information of what kind of parametershas to be considered when allocating a business application to the business capability map:
• Challenge of fitting: When defining a business capability map, organizations alreadyconsidered the range of functions within the productive business applications: the EAMteam aimed to define the business capability map in a way that all business applicationscan be allocated to one exclusive business capability. However, the business capabilitymap illustrates the building blocks of an organization and have to fit to the respectivebusiness strategy. Thus, the respective organization faced the challenge of aligning thebusiness capabilities to the respective business strategy, but also defining the businesscapabilities in a way that all business applications can be allocated to one exclusive busi-ness capability. It turned out that the organization extended the amount of businesscapabilities: in this case, the business capability map fits to the business strategy andprovided enough flexibility to allocate all business applications to one respective businesscapability. When implementing a new business application, the respective organizationconsiders the defined business capability map within the software solution selection pro-cess: The chosen solution should fulfill the business requirements and also be assignableto one respective business capability. A double occupancy of business applications tocapabilities should only be applied in exceptional cases.
• Communicate and sign-off: The final choice of allocation has to be communicated toan architectural board within the organization. All concerned persons have to sign-offthe respective allocation. The suggestion for the allocation is provided by the EAMteam.
© Technische Universität München, sebis, 2015. All rights reserved. 33
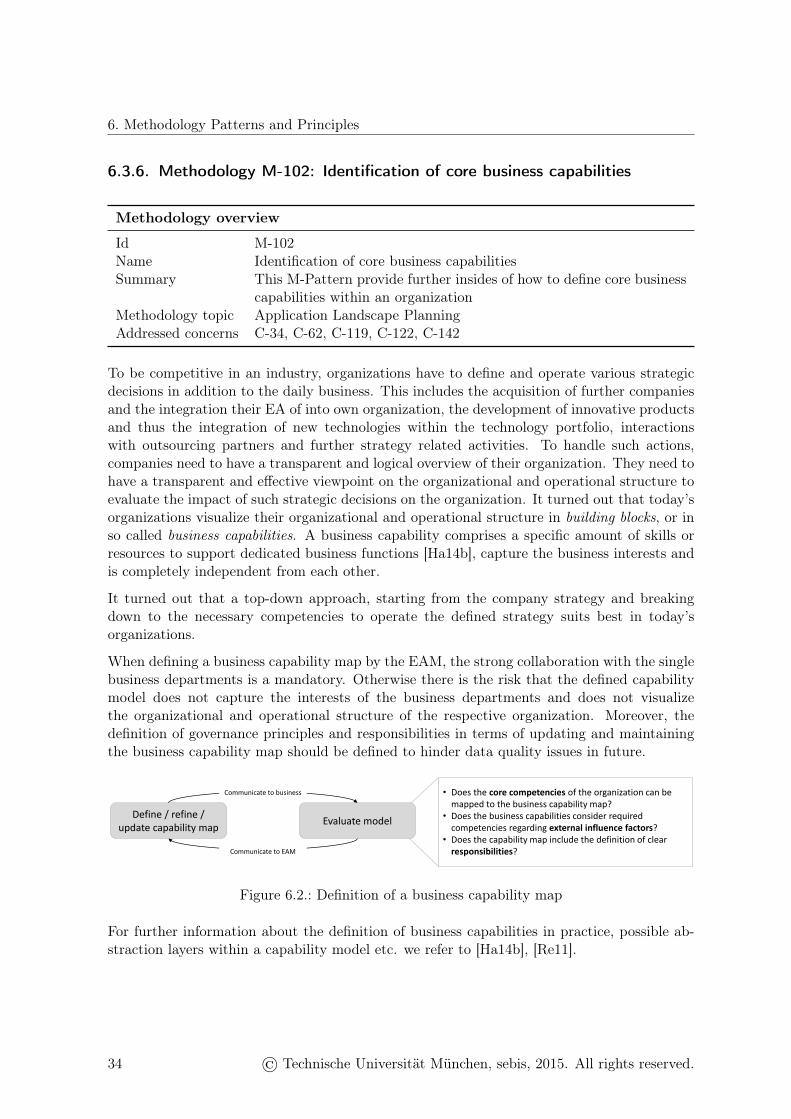
6. Methodology Patterns and Principles
6.3.6. Methodology M-102: Identification of core business capabilities
Methodology overview
Id M-102Name Identification of core business capabilitiesSummary This M-Pattern provide further insides of how to define core business
capabilities within an organizationMethodology topic Application Landscape PlanningAddressed concerns C-34, C-62, C-119, C-122, C-142
To be competitive in an industry, organizations have to define and operate various strategicdecisions in addition to the daily business. This includes the acquisition of further companiesand the integration their EA of into own organization, the development of innovative productsand thus the integration of new technologies within the technology portfolio, interactionswith outsourcing partners and further strategy related activities. To handle such actions,companies need to have a transparent and logical overview of their organization. They need tohave a transparent and effective viewpoint on the organizational and operational structure toevaluate the impact of such strategic decisions on the organization. It turned out that today’sorganizations visualize their organizational and operational structure in building blocks, or inso called business capabilities. A business capability comprises a specific amount of skills orresources to support dedicated business functions [Ha14b], capture the business interests andis completely independent from each other.
It turned out that a top-down approach, starting from the company strategy and breakingdown to the necessary competencies to operate the defined strategy suits best in today’sorganizations.
When defining a business capability map by the EAM, the strong collaboration with the singlebusiness departments is a mandatory. Otherwise there is the risk that the defined capabilitymodel does not capture the interests of the business departments and does not visualizethe organizational and operational structure of the respective organization. Moreover, thedefinition of governance principles and responsibilities in terms of updating and maintainingthe business capability map should be defined to hinder data quality issues in future.
Define / refine / update capability map
Evaluate model
• Does the core competencies of the organization can be mapped to the business capability map?
• Does the business capabilities consider required competencies regarding external influence factors?
• Does the capability map include the definition of clear responsibilities?
Communicate to business
Communicate to EAM
Figure 6.2.: Definition of a business capability map
For further information about the definition of business capabilities in practice, possible ab-straction layers within a capability model etc. we refer to [Ha14b], [Re11].
34 © Technische Universität München, sebis, 2015. All rights reserved.
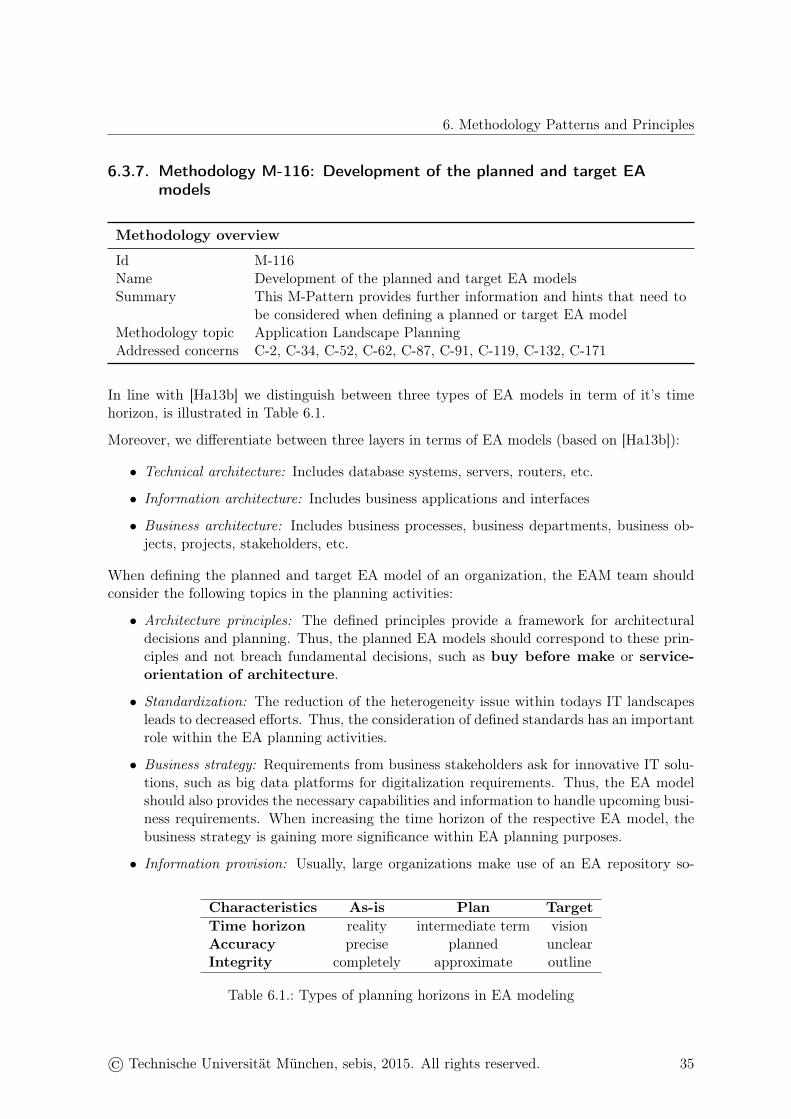
6. Methodology Patterns and Principles
6.3.7. Methodology M-116: Development of the planned and target EAmodels
Methodology overview
Id M-116Name Development of the planned and target EA modelsSummary This M-Pattern provides further information and hints that need to
be considered when defining a planned or target EA modelMethodology topic Application Landscape PlanningAddressed concerns C-2, C-34, C-52, C-62, C-87, C-91, C-119, C-132, C-171
In line with [Ha13b] we distinguish between three types of EA models in term of it’s timehorizon, is illustrated in Table 6.1.
Moreover, we differentiate between three layers in terms of EA models (based on [Ha13b]):
• Technical architecture: Includes database systems, servers, routers, etc.
• Information architecture: Includes business applications and interfaces
• Business architecture: Includes business processes, business departments, business ob-jects, projects, stakeholders, etc.
When defining the planned and target EA model of an organization, the EAM team shouldconsider the following topics in the planning activities:
• Architecture principles: The defined principles provide a framework for architecturaldecisions and planning. Thus, the planned EA models should correspond to these prin-ciples and not breach fundamental decisions, such as buy before make or service-orientation of architecture.
• Standardization: The reduction of the heterogeneity issue within todays IT landscapesleads to decreased efforts. Thus, the consideration of defined standards has an importantrole within the EA planning activities.
• Business strategy: Requirements from business stakeholders ask for innovative IT solu-tions, such as big data platforms for digitalization requirements. Thus, the EA modelshould also provides the necessary capabilities and information to handle upcoming busi-ness requirements. When increasing the time horizon of the respective EA model, thebusiness strategy is gaining more significance within EA planning purposes.
• Information provision: Usually, large organizations make use of an EA repository so-
Characteristics As-is Plan TargetTime horizon reality intermediate term visionAccuracy precise planned unclearIntegrity completely approximate outline
Table 6.1.: Types of planning horizons in EA modeling
© Technische Universität München, sebis, 2015. All rights reserved. 35
6. Methodology Patterns and Principles
lution to document the productive instances, including detailed attribute informationof the defined EA models. When planning future EA models, the amount of used at-tributes and classes of the EA meta model might change. Thus, enterprise architectshave to consider the preparation of the necessary information. [Ro13] and [Fa13] alreadyevaluated best practices in EA documentation and information provision.
Enterprise architects are the responsible stakeholders for EA model planning and documenta-tion purposes. However, EA models should not only support IT-related stakeholders, but alsoserve information for use cases from business departments, such as regulatory requirementsand the included IT report for the supervisory. Thus, the definition of EA models should takeplace in strong collaboration with business stakeholder. The definition of the EA modelillustrates an iterative optimization process, similar to business capability definition in Figure6.2.
36 © Technische Universität München, sebis, 2015. All rights reserved.

6. Methodology Patterns and Principles
6.3.8. Methodology M-13: Analysis of current EA model
Methodology overview
Id M-13Name Analysis of current EA modelSummary This M-pattern provides best practices and guidelines to analyze the
as-is EA model regarding existing gaps compared to the target EAmodel.
Methodology topic Application Landscape PlanningAddressed concerns C-2, C-34, C-41, C-51, C-52, C-61, C-62, C-65, C-66, C-67, C-132,
C-171, C-172
As mentioned in Section 6.3.7, EAM functions define three types of EA models: The as-is, theplanned and the target EA model. The transformation of the as-is EA model to the targetEA model is one major objective and challenge of today’s organizations. The definition ofconcrete initiatives requires the identification of gaps between the as-is and the target EAmodel. One of the survey participants already defined concrete EA methods to analyze theas-is EA model regarding existing gaps. Figure 6.3 provides an overview of the process stepsand the key initiatives to conduct a gap analysis of the as-is EA model.
• EArepository• Businessdepartments• Applicationmanagement
• Architecturalcheck• Deep-diveanalysis
• Conformitycheck• Discussweakness• Summarizefindings
Gatherinput Analyze Evaluateoutput
Figure 6.3.: Gap analysis procedure of as-is EA model regarding the target EA model
Before starting the concrete analysis phase of the as-is EA model, the respective EAM functionhas to gather various information regarding the operative information systems, the upcomingrequirements of the business departments, and the current issues of the application land-scape.
• EA repository: The EA repository provides information about the implemented plat-forms, physical components, business applications, the respective instances etc. of theEA. This information should be evaluated by the EAM team to identify upcoming trendsand to identify breached standards within the EA. For further best practices of EA doc-umentation, we refer to [Ro13] and [Fa13].
• Business departments: Various business requirements, such as digital products, upcom-ing regulatory requirements etc. have to be considered when defining a target EA model.
© Technische Universität München, sebis, 2015. All rights reserved. 37
6. Methodology Patterns and Principles
Moreover, business departments might provide further information about the satisfac-tion of the used business applications. The EAM team has to consider these informationwithin the gap analysis of the as-is EA model.
• Application management: The application management of an organization provides in-formation about error-prone business applications, consolidation potentials within theapplication landscape and concrete KPI’s to measure the efficiency of the EA.
After gathering comprehensive information about the application landscape, EAM starts withit’s analysis to identify weaknesses and gaps by conducting architectural checks and selectivedeep-dive analyses.
• Architectural checks: The EAM team has to evaluate how far the as-is EA model deviatesfrom the target EA model. This deviations arise when single components are missing tofulfill concrete business requirements, architectural standards are breached or businessapplications do not correspond to business capability map policies. The EAM teamshould also analyze, which business applications support which business processes withinthe organization to identify redundancies.
• Deep-dive analysis: Business applications and business components that breaches archi-tectural standards represent redundant components or occur a high amount of incidents,and have to be evaluated in terms of concrete initiatives.
After analyzing the as-is EA model and the operative information systems, the EAM teamconducts a conformity check regarding the target EA model. The findings and issues aremarked within the as-is EA model (by using different colors) for concrete initiatives, such asreplace, keep, remove and renew. The identified weaknesses and findings should be discussedwith further stakeholders, especially with the application management team and the users ofthe information systems (business stakeholders).
38 © Technische Universität München, sebis, 2015. All rights reserved.

6. Methodology Patterns and Principles
6.3.9. Methodology M-112: Definition of a transformation roadmap for theEA
Methodology overview
Id M-112Name Definition of a transformation roadmap for the EASummary This M-Pattern provides best practices for defining a transformation
roadmap for a specific topicMethodology topic Project Portfolio ManagementAddressed concerns C-4, C-5, C-34, C-91, C-101, C-89, C-127
As mentioned in Section 6.1, today’s organizations face various influence factors, such as digi-talization and customer journey or regulatory requirements that demand for large transforma-tions of the EA. Depending on the respective business requirement, transformation initiativesmight change. Digitalization issues ask for integrative information of customer characteristicsand concrete analytics solutions to bring the organization closer to the customers, whereasregulatory requirements ask for reporting solutions, including information about the solvencyor risk issues of the organization. However, all of these business requirements ask for concretetransformation activities. [Ni09] provides a framework for transformation activities, indepen-dent from any business requirement or specific industry. The suggested framework includessuggestions to setup an enterprise transformation roadmap and an architecting framework.
Figure 4. Enterprise Strategic Analysis for Transformation 2.E Lean Enterprise Self Assessment Tool (LESAT) LESAT is a tool for assessing the maturity of an organization and its readiness to change (Nightingale and Mize, 2002). It includes a capability maturity model that addresses key integrative and strategic issues in life cycle, leadership and enabling processes. The 54 practices are employed to determine both the current state as well as desired future state of the enterprise. LESAT is linked to the Enterprise Transformation Roadmap and is based on the Seven Enterprise Principles. It has been downloaded from the LAI website nearly 3500 times on a global basis. When used in conjunction with ESAT it is a powerful tool for assessing gaps in enterprise performance.
3. Integrated Enterprise Transformation Framework
The above described enterprise transformation principles, methodologies and tools when used together comprise an integrated framework for enterprise transformation. The Seven Principles and the EA views provide a holistic way of thinking about and analyzing enterprises. The Enterprise Transformation Roadmap provides a framework for effective and efficient transformation strategy, planning and execution. The Enterprise Strategic Analysis for Transformation through its eight steps creates an environment for understanding the current state, creating a future state vision and developing an action plan for prioritized transformation. LESAT and the EA views are used in concert with ESAT to analyze and assess both the current
8
Figure 6.4.: Enterprise strategic analysis for transformation [Ni09]
Figure 6.4 shows the analysis steps to define a concrete transformation plan. As alreadymentioned, these steps could serve as a blueprint for transformation roadmap definitions. For
© Technische Universität München, sebis, 2015. All rights reserved. 39

6. Methodology Patterns and Principles
detailed information about the steps and further information about the framework, we referto [Ni09].
40 © Technische Universität München, sebis, 2015. All rights reserved.
CHAPTER 7
Viewpoint Patterns
Contents7.1. Viewpoint V-107 . . . . . . . . . . . . . . . . . . . . . . . . . . . . . 427.2. Viewpoint V-108 . . . . . . . . . . . . . . . . . . . . . . . . . . . . . 467.3. Viewpoint V-109 . . . . . . . . . . . . . . . . . . . . . . . . . . . . . 517.4. Viewpoint V-110 . . . . . . . . . . . . . . . . . . . . . . . . . . . . . 527.5. Viewpoint V-111 . . . . . . . . . . . . . . . . . . . . . . . . . . . . . 537.6. Viewpoint V-112 . . . . . . . . . . . . . . . . . . . . . . . . . . . . . 577.7. Viewpoint V-113 . . . . . . . . . . . . . . . . . . . . . . . . . . . . . 587.8. Viewpoint V-114 . . . . . . . . . . . . . . . . . . . . . . . . . . . . . 627.9. Viewpoint V-115 . . . . . . . . . . . . . . . . . . . . . . . . . . . . . 667.10. Viewpoint V-116 . . . . . . . . . . . . . . . . . . . . . . . . . . . . . 677.11. Viewpoint V-117 . . . . . . . . . . . . . . . . . . . . . . . . . . . . . 687.12. Viewpoint V-118 . . . . . . . . . . . . . . . . . . . . . . . . . . . . . 697.13. Viewpoint V-119 . . . . . . . . . . . . . . . . . . . . . . . . . . . . . 707.14. Viewpoint V-120 . . . . . . . . . . . . . . . . . . . . . . . . . . . . . 71
In this section, we provide an overview of the observed viewpoint patterns. Each patternvisualizes the current state of one or multiple concerns (see A.4), including an EAM patterngraph and information model (see section 8). A viewpoint might illustrate the current stateof concerns that differ in their content. Thus, a viewpoint can include different variations,all documented in the respective section of the viewpoint. We identified 14 new viewpointsillustrated in 25 different variations. The used examples for the information model attributesmake use of the repository of the SyCa store [Ma]. Each illustrated example is independentin its logical structure from other visualizations.
© Technische Universität München, sebis, 2015. All rights reserved. 41
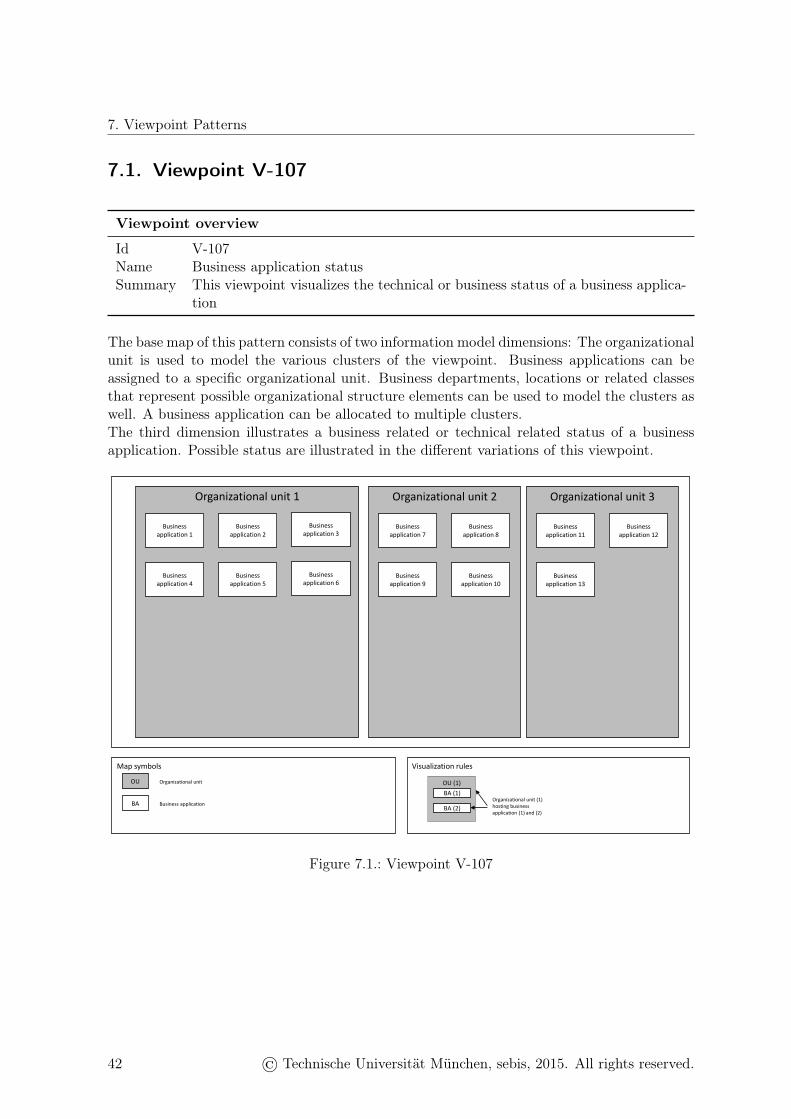
7. Viewpoint Patterns
7.1. Viewpoint V-107
Viewpoint overview
Id V-107Name Business application statusSummary This viewpoint visualizes the technical or business status of a business applica-
tion
The base map of this pattern consists of two information model dimensions: The organizationalunit is used to model the various clusters of the viewpoint. Business applications can beassigned to a specific organizational unit. Business departments, locations or related classesthat represent possible organizational structure elements can be used to model the clusters aswell. A business application can be allocated to multiple clusters.The third dimension illustrates a business related or technical related status of a businessapplication. Possible status are illustrated in the different variations of this viewpoint.
Organizational unit 1
Business application 1
Map symbols Visualization rules
OU (1)
Organizational unit (1) hosting business application (1) and (2)
Organizational unitOU
BA Business application
Business application 2
Business application 3
Business application 4
Business application 5
Business application 6
Organizational unit 2
Business application 7
Business application 8
Business application 9
Business application 10
BA (1)
BA (2)
Organizational unit 3
Business application 11
Business application 12
Business application 13
Figure 7.1.: Viewpoint V-107
42 © Technische Universität München, sebis, 2015. All rights reserved.
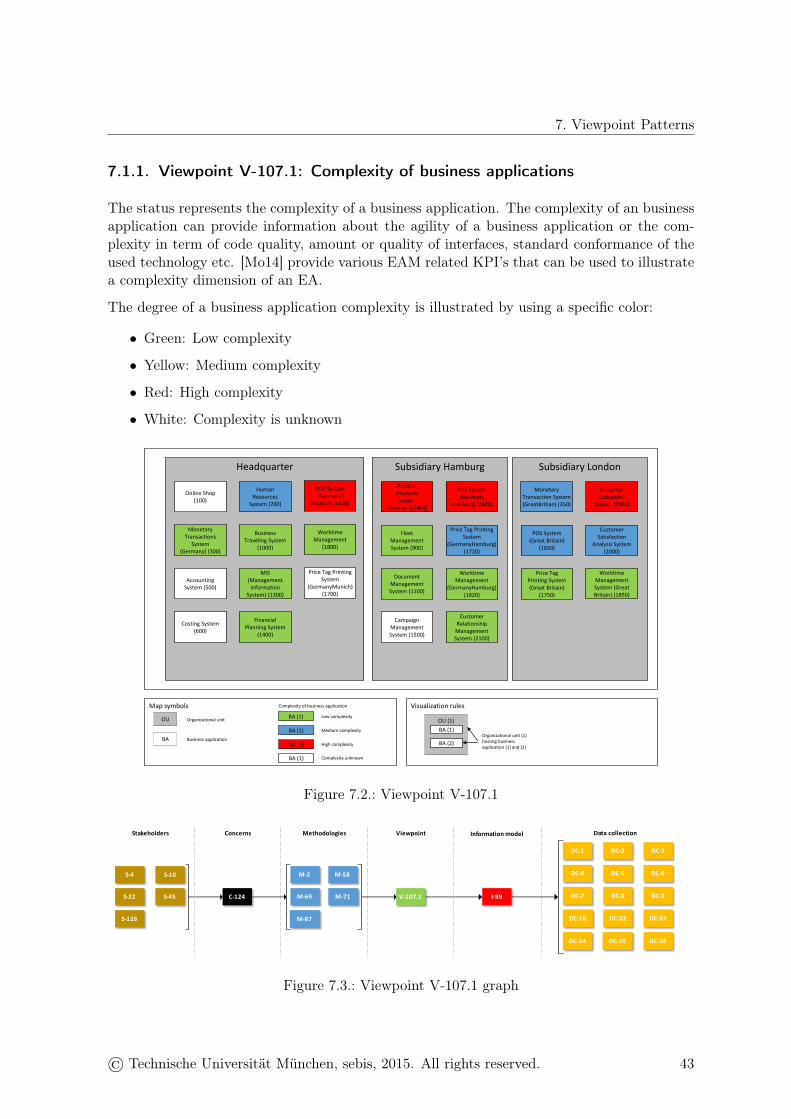
7. Viewpoint Patterns
7.1.1. Viewpoint V-107.1: Complexity of business applications
The status represents the complexity of a business application. The complexity of an businessapplication can provide information about the agility of a business application or the com-plexity in term of code quality, amount or quality of interfaces, standard conformance of theused technology etc. [Mo14] provide various EAM related KPI’s that can be used to illustratea complexity dimension of an EA.
The degree of a business application complexity is illustrated by using a specific color:
• Green: Low complexity
• Yellow: Medium complexity
• Red: High complexity
• White: Complexity is unknown
Headquarter
Online Shop (100)
Map symbols Visualization rules
OU (1)
Organizational unit (1) hosting business application (1) and (2)
Organizational unitOU
BA Business application
Human Resources
System (700)
POS System (Germany/
Munich) (1600)
Monetary Transactions
System (Germany) (300)
Business Traveling System
(1000)
Worktime Management
(1800)
Accounting System (500)
MIS (Management Information
System) (1300)
Price Tag Printing System
(GermanyMunich)(1700)
Costing System (600)
Financial Planning System
(1400)
Subsidiary Hamburg
Product Shipment
System (Germany) (400)
POS System (Germany
Hamburg) (1620)
Fleet Management System (900)
Price Tag Printing System
(GermanyHamburg) (1720)
Document Management System (1100)
Worktime Management
(GermanyHamburg) (1820)
Campaign Management System (1500)
Customer Relationship Management System (2100)
BA (1)
BA (2)
Subsidiary London
Monetary Transaction System (GreatBritian) (350)
Customer Complaint
System (1900)
POS System (Great Britain)
(1650)
Customer Satisfaction
Analysis System (2000)
Price Tag Printing System (Great Britain)
(1750)
Worktime Management System (Great Britain) (1850)
BA (1)
BA (1)
BA (1)
Complexity of business application
Low complexity
Medium complexity
High complexity
BA (1) Complexity unknown
Figure 7.2.: Viewpoint V-107.1
M-2 M-58
M-69 M-71
M-87
V-107.1 I-99C-124
S-4 S-10
S-126
S-22 S-45
Stakeholders MethodologiesConcerns Viewpoint Informationmodel Datacollection
DC-1 DC-2 DC-3
DC-4 DC-5 DC-6
DC-7 DC-8 DC-9
DC-10 DC-32 DC-33
DC-34 DC-35 DC-36
Figure 7.3.: Viewpoint V-107.1 graph
© Technische Universität München, sebis, 2015. All rights reserved. 43
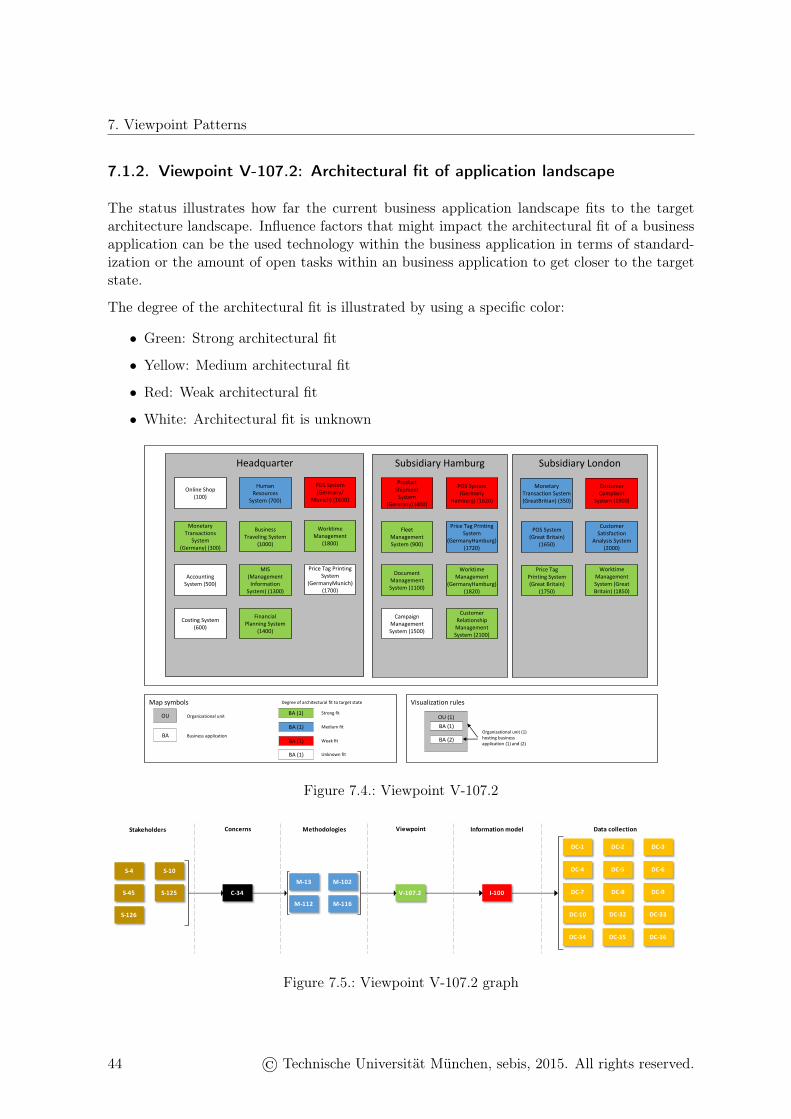
7. Viewpoint Patterns
7.1.2. Viewpoint V-107.2: Architectural fit of application landscape
The status illustrates how far the current business application landscape fits to the targetarchitecture landscape. Influence factors that might impact the architectural fit of a businessapplication can be the used technology within the business application in terms of standard-ization or the amount of open tasks within an business application to get closer to the targetstate.
The degree of the architectural fit is illustrated by using a specific color:
• Green: Strong architectural fit
• Yellow: Medium architectural fit
• Red: Weak architectural fit
• White: Architectural fit is unknown
Headquarter
Online Shop (100)
Human Resources
System (700)
POS System (Germany/
Munich) (1600)
Monetary Transactions
System (Germany) (300)
Business Traveling System
(1000)
Worktime Management
(1800)
Accounting System (500)
MIS (Management Information
System) (1300)
Price Tag Printing System
(GermanyMunich)(1700)
Costing System (600)
Financial Planning System
(1400)
Subsidiary Hamburg
Product Shipment
System (Germany) (400)
POS System (Germany
Hamburg) (1620)
Fleet Management System (900)
Price Tag Printing System
(GermanyHamburg) (1720)
Document Management System (1100)
Worktime Management
(GermanyHamburg) (1820)
Campaign Management System (1500)
Customer Relationship Management System (2100)
Subsidiary London
Monetary Transaction System (GreatBritian) (350)
Customer Complaint
System (1900)
POS System (Great Britain)
(1650)
Customer Satisfaction
Analysis System (2000)
Price Tag Printing System (Great Britain)
(1750)
Worktime Management System (Great Britain) (1850)
Map symbols Visualization rules
OU (1)
Organizational unit (1) hosting business application (1) and (2)
Organizational unitOU
BA Business application
BA (1)
BA (1)
BA (1)
Degree of architectural fit to target state
Strong fit
Medium fit
Weak fit
BA (1)
BA (2)
BA (1) Unknown fit
Figure 7.4.: Viewpoint V-107.2
M-13 M-102
M-112 M-116V-107.2 I-100C-34
S-4 S-10
S-126
S-45 S-125
Stakeholders MethodologiesConcerns Viewpoint Informationmodel Datacollection
DC-1 DC-2 DC-3
DC-4 DC-5 DC-6
DC-7 DC-8 DC-9
DC-10 DC-32 DC-33
DC-34 DC-35 DC-36
Figure 7.5.: Viewpoint V-107.2 graph
44 © Technische Universität München, sebis, 2015. All rights reserved.

7. Viewpoint Patterns
7.1.3. Viewpoint V-107.3: Architectural health of business applications
The architectural health of a business application illustrates how much effort is necessary tolift the quality of the business application to an appropriate maturity level. The health of abusiness application can be represented by e.g. the amount of incident or change tickets, themeasured performance of the used technology or the implemented security mechanism andcontrols.
The degree of the architectural health is illustrated by using a specific color:
• Green: Good architectural health
• Yellow: Medium architectural health
• Red: Weak architectural health
• White: Architectural health is unknown
Headquarter
Online Shop (100)
Human Resources
System (700)
POS System (Germany/
Munich) (1600)
Monetary Transactions
System (Germany) (300)
Business Traveling System
(1000)
Worktime Management
(1800)
Accounting System (500)
MIS (Management Information
System) (1300)
Price Tag Printing System
(GermanyMunich)(1700)
Costing System (600)
Financial Planning System
(1400)
Subsidiary Hamburg
Product Shipment
System (Germany) (400)
POS System (Germany
Hamburg) (1620)
Fleet Management System (900)
Price Tag Printing System
(GermanyHamburg) (1720)
Document Management System (1100)
Worktime Management
(GermanyHamburg) (1820)
Campaign Management System (1500)
Customer Relationship Management System (2100)
Subsidiary London
Monetary Transaction System (GreatBritian) (350)
Customer Complaint
System (1900)
POS System (Great Britain)
(1650)
Customer Satisfaction
Analysis System (2000)
Price Tag Printing System (Great Britain)
(1750)
Worktime Management System (Great Britain) (1850)
Map symbols Visualization rules
OU (1)
Organizational unit (1) hosting business application (1) and (2)
Organizational unitOU
BA Business application
BA (1)
BA (1)
BA (1)
Architectural health of business application
Good health
Medium health
Bad health
BA (1)
BA (2)
BA (1) health unknown
Figure 7.6.: Viewpoint V-107.3
M-13 M-71
M-116V-107.3 I-101C-2
S-2 S-22
S-45 S-113
S-125 S-126
Stakeholders MethodologiesConcerns Viewpoint Informationmodel Datacollection
DC-1 DC-2 DC-3
DC-4 DC-5 DC-6
DC-7 DC-8 DC-9
DC-10 DC-32 DC-33
DC-34 DC-35 DC-36
Figure 7.7.: Viewpoint V-107.3 graph
© Technische Universität München, sebis, 2015. All rights reserved. 45
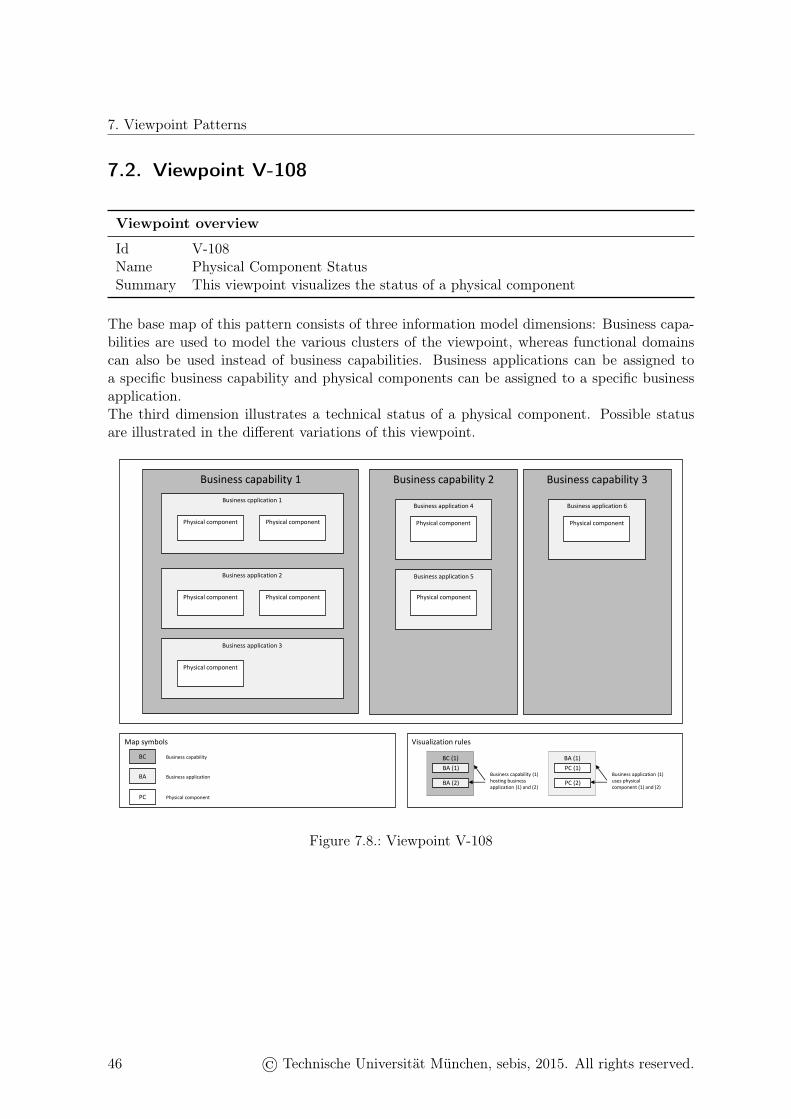
7. Viewpoint Patterns
7.2. Viewpoint V-108
Viewpoint overview
Id V-108Name Physical Component StatusSummary This viewpoint visualizes the status of a physical component
The base map of this pattern consists of three information model dimensions: Business capa-bilities are used to model the various clusters of the viewpoint, whereas functional domainscan also be used instead of business capabilities. Business applications can be assigned toa specific business capability and physical components can be assigned to a specific businessapplication.The third dimension illustrates a technical status of a physical component. Possible statusare illustrated in the different variations of this viewpoint.
Business capability 1
Map symbols Visualization rules
BC (1)
Business capability (1) hosting business application (1) and (2)
Business capabilityBC
BA Business application
Business capability 2
BA (1)
BA (2)
Business capability 3Business cpplication 1
Physical component Physical component
Business application 2
Physical component Physical component
Business application 3
Physical component
Business application 4
Physical component
Business application 6
Physical component
Business application 5
BA (1)
Business application (1) uses physical component (1) and (2)
PC (1)
PC (2)
PC Physical component
Physical component
Figure 7.8.: Viewpoint V-108
46 © Technische Universität München, sebis, 2015. All rights reserved.
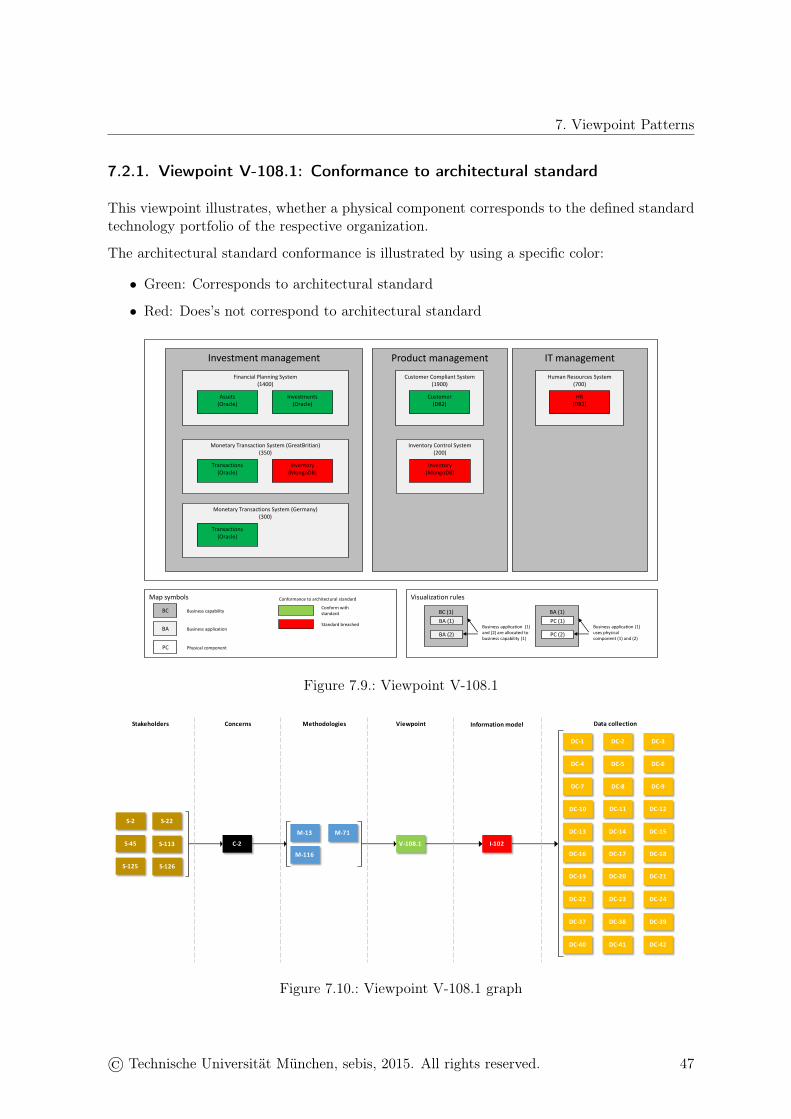
7. Viewpoint Patterns
7.2.1. Viewpoint V-108.1: Conformance to architectural standard
This viewpoint illustrates, whether a physical component corresponds to the defined standardtechnology portfolio of the respective organization.
The architectural standard conformance is illustrated by using a specific color:
• Green: Corresponds to architectural standard
• Red: Does’s not correspond to architectural standard
Investment management
Map symbols Visualization rules
BC (1)
Business application (1) and (2) are allocated to business capability (1)
Business capabilityBC
BA Business application
Product management
BA (1)
BA (2)
IT managementFinancial Planning System
(1400)
Assets (Oracle)
Investments (Oracle)
Monetary Transaction System (GreatBritian)(350)
Transactions (Oracle)
Inventory (MongoDB)
Monetary Transactions System (Germany)(300)
Transactions (Oracle)
Customer Compliant System (1900)
Customer(DB2)
Human Resources System(700)
HR(DB2)
Inventory Control System(200)
BA (1)
Business application (1) uses physical component (1) and (2)
PC (1)
PC (2)
PC Physical component
Inventory (MongoDB)
Conformance to architectural standard
Conform with standard
Standard breached
Figure 7.9.: Viewpoint V-108.1
M-13 M-71
M-116V-108.1 I-102C-2
S-2 S-22
S-45 S-113
S-125 S-126
Stakeholders MethodologiesConcerns Viewpoint Informationmodel Datacollection
DC-1 DC-2 DC-3
DC-4 DC-5 DC-6
DC-7 DC-8 DC-9
DC-10 DC-11 DC-12
DC-13 DC-14 DC-15
DC-16 DC-17 DC-18
DC-19 DC-20 DC-21
DC-22 DC-23 DC-24
DC-37 DC-38 DC-39
DC-40 DC-41 DC-42
Figure 7.10.: Viewpoint V-108.1 graph
© Technische Universität München, sebis, 2015. All rights reserved. 47
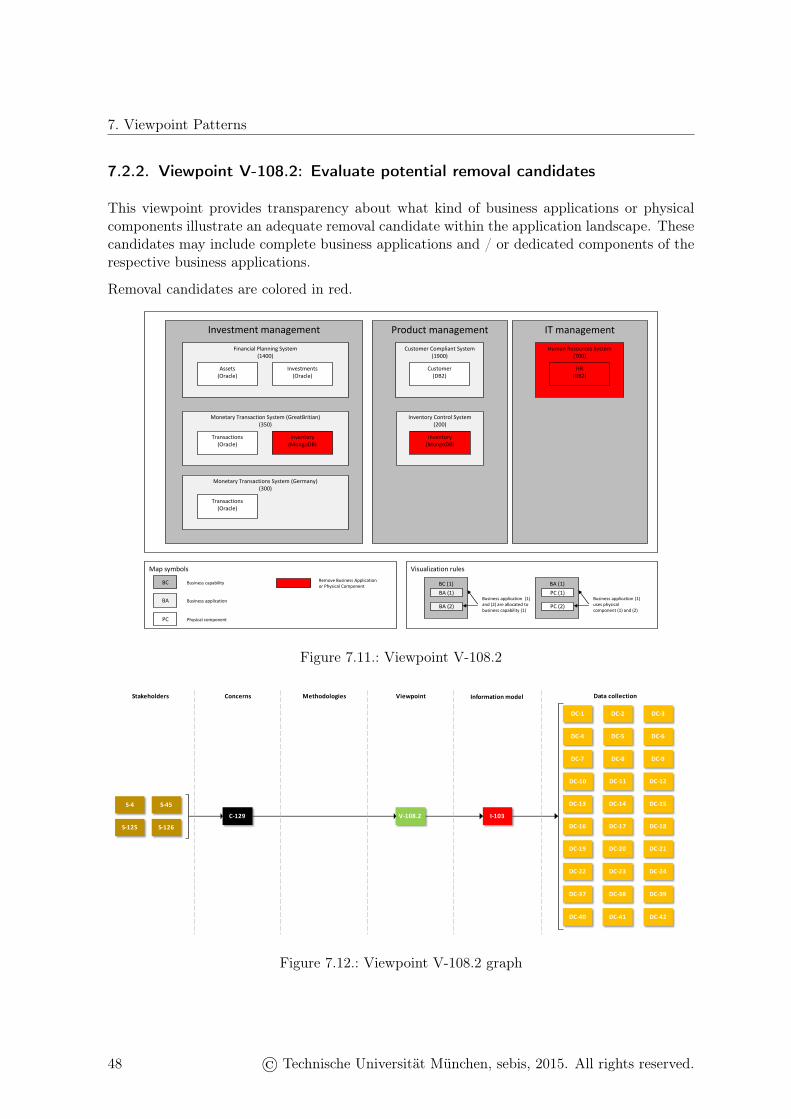
7. Viewpoint Patterns
7.2.2. Viewpoint V-108.2: Evaluate potential removal candidates
This viewpoint provides transparency about what kind of business applications or physicalcomponents illustrate an adequate removal candidate within the application landscape. Thesecandidates may include complete business applications and / or dedicated components of therespective business applications.
Removal candidates are colored in red.
Investment management
Map symbols Visualization rules
BC (1)
Business application (1) and (2) are allocated to business capability (1)
Business capabilityBC
BA Business application
Product management
BA (1)
BA (2)
IT managementFinancial Planning System
(1400)
Assets (Oracle)
Investments (Oracle)
Monetary Transaction System (GreatBritian)(350)
Transactions (Oracle)
Inventory (MongoDB)
Monetary Transactions System (Germany)(300)
Transactions (Oracle)
Customer Compliant System (1900)
Customer(DB2)
Human Resources System(700)
HR(DB2)
Inventory Control System(200)
BA (1)
Business application (1) uses physical component (1) and (2)
PC (1)
PC (2)
PC Physical component
Inventory (MongoDB)
Remove Business Application or Physical Component
Figure 7.11.: Viewpoint V-108.2
V-108.2 I-103C-129
S-4 S-45
S-125 S-126
Stakeholders MethodologiesConcerns Viewpoint Informationmodel Datacollection
DC-1 DC-2 DC-3
DC-4 DC-5 DC-6
DC-7 DC-8 DC-9
DC-10 DC-11 DC-12
DC-13 DC-14 DC-15
DC-16 DC-17 DC-18
DC-19 DC-20 DC-21
DC-22 DC-23 DC-24
DC-37 DC-38 DC-39
DC-40 DC-41 DC-42
Figure 7.12.: Viewpoint V-108.2 graph
48 © Technische Universität München, sebis, 2015. All rights reserved.
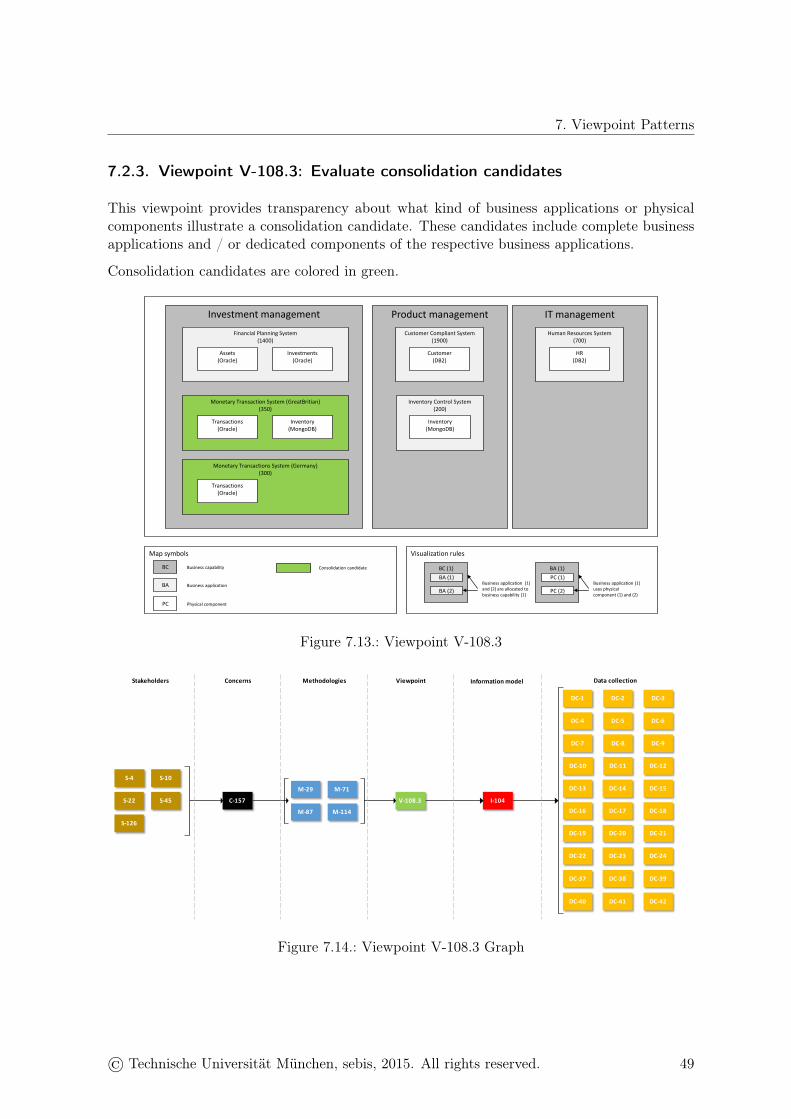
7. Viewpoint Patterns
7.2.3. Viewpoint V-108.3: Evaluate consolidation candidates
This viewpoint provides transparency about what kind of business applications or physicalcomponents illustrate a consolidation candidate. These candidates include complete businessapplications and / or dedicated components of the respective business applications.
Consolidation candidates are colored in green.
Investment management
Map symbols Visualization rules
BC (1)
Business application (1) and (2) are allocated to business capability (1)
Business capabilityBC
BA Business application
Product management
BA (1)
BA (2)
IT managementFinancial Planning System
(1400)
Assets (Oracle)
Investments (Oracle)
Monetary Transaction System (GreatBritian)(350)
Transactions (Oracle)
Inventory (MongoDB)
Monetary Transactions System (Germany)(300)
Transactions (Oracle)
Customer Compliant System (1900)
Customer(DB2)
Human Resources System(700)
HR(DB2)
Inventory Control System(200)
BA (1)
Business application (1) uses physical component (1) and (2)
PC (1)
PC (2)
PC Physical component
Inventory (MongoDB)
Consolidation candidate
Figure 7.13.: Viewpoint V-108.3
V-108.3 I-104C-157
M-29 M-71
M-87 M-114
Stakeholders MethodologiesConcerns Viewpoint Informationmodel Datacollection
DC-1 DC-2 DC-3
DC-4 DC-5 DC-6
DC-7 DC-8 DC-9
DC-10 DC-11 DC-12
DC-13 DC-14 DC-15
DC-16 DC-17 DC-18
DC-19 DC-20 DC-21
DC-22 DC-23 DC-24
DC-37 DC-38 DC-39
DC-40 DC-41 DC-42
S-4 S-10
S-22 S-45
S-126
Figure 7.14.: Viewpoint V-108.3 Graph
© Technische Universität München, sebis, 2015. All rights reserved. 49
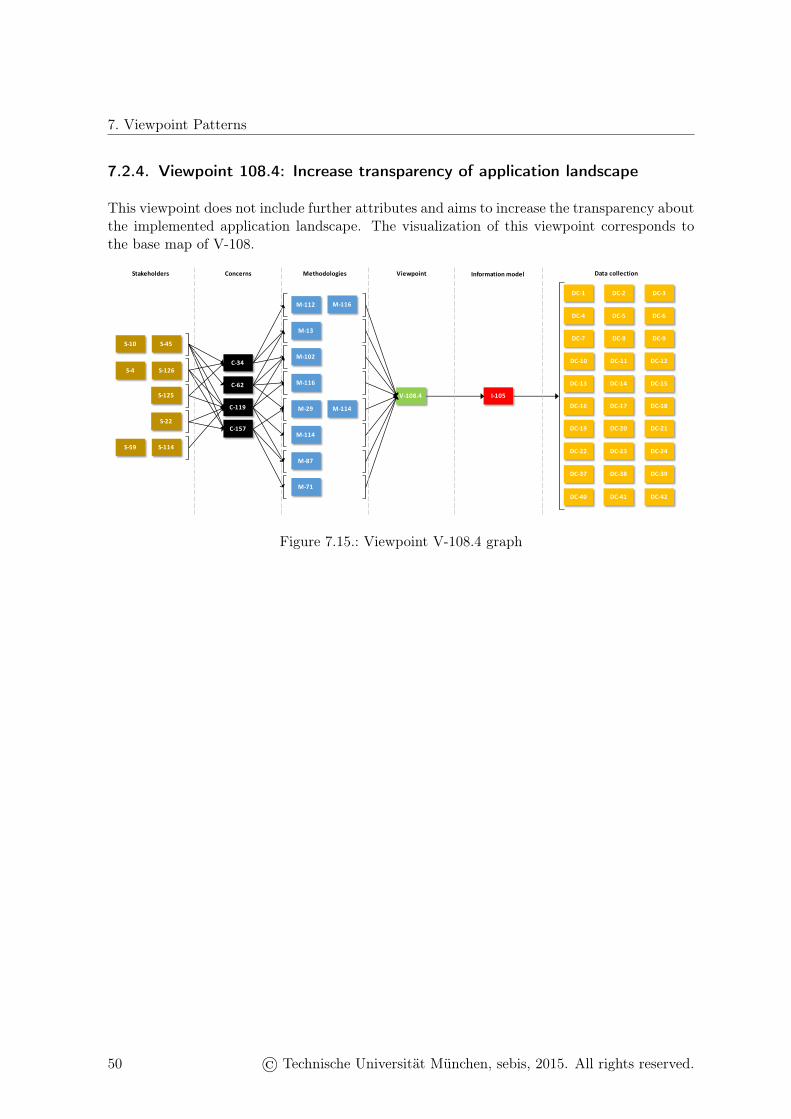
7. Viewpoint Patterns
7.2.4. Viewpoint 108.4: Increase transparency of application landscape
This viewpoint does not include further attributes and aims to increase the transparency aboutthe implemented application landscape. The visualization of this viewpoint corresponds tothe base map of V-108.
V-108.4 I-105
C-34
C-62
C-119
C-157
S-125
S-126
S-22
S-114S-59
S-45S-10
S-4
M-112
M-13
M-102
M-116
M-116
M-29 M-114
M-114
M-87
M-71
Stakeholders MethodologiesConcerns Viewpoint Informationmodel Datacollection
DC-1 DC-2 DC-3
DC-4 DC-5 DC-6
DC-7 DC-8 DC-9
DC-10 DC-11 DC-12
DC-13 DC-14 DC-15
DC-16 DC-17 DC-18
DC-19 DC-20 DC-21
DC-22 DC-23 DC-24
DC-37 DC-38 DC-39
DC-40 DC-41 DC-42
Figure 7.15.: Viewpoint V-108.4 graph
50 © Technische Universität München, sebis, 2015. All rights reserved.
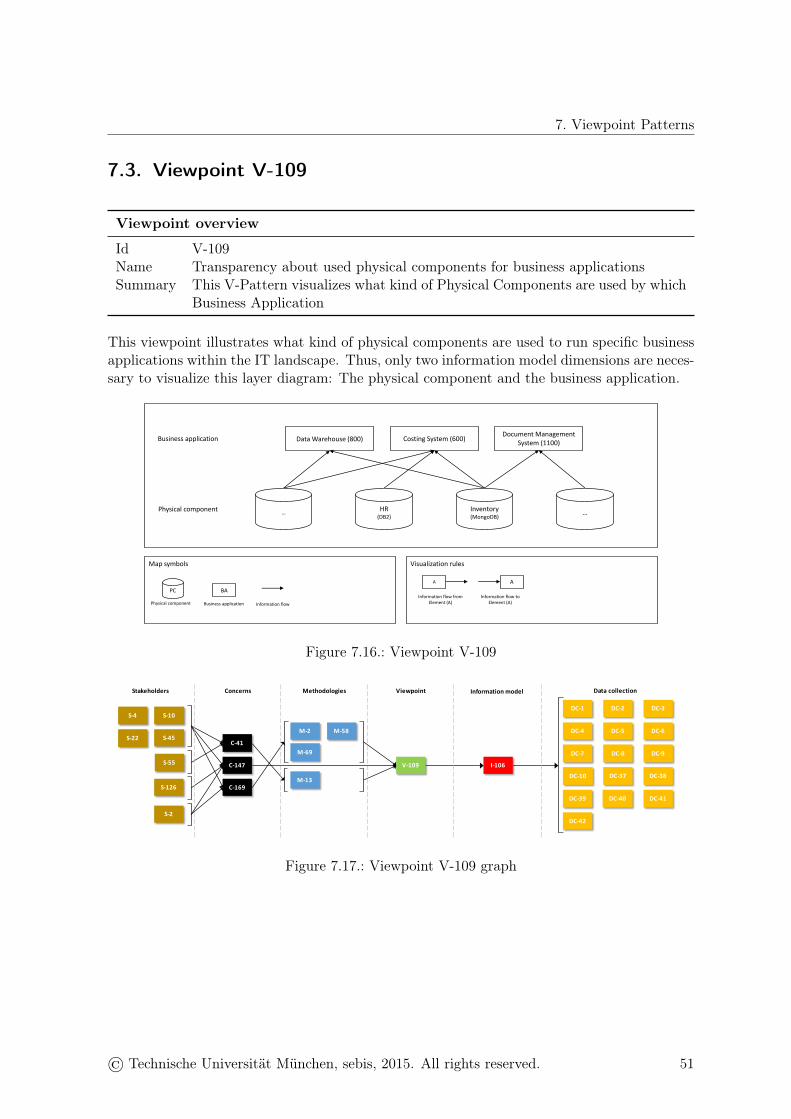
7. Viewpoint Patterns
7.3. Viewpoint V-109
Viewpoint overview
Id V-109Name Transparency about used physical components for business applicationsSummary This V-Pattern visualizes what kind of Physical Components are used by which
Business Application
This viewpoint illustrates what kind of physical components are used to run specific businessapplications within the IT landscape. Thus, only two information model dimensions are neces-sary to visualize this layer diagram: The physical component and the business application.
… HR(DB2)
Inventory(MongoDB) …
Costing System (600) Document Management System (1100)Data Warehouse (800)
Physical component
Business application
Map symbols Visualization rules
PC
Physical component
BAA A
Information flow fromElement (A)
Information flow toElement (A)Business application Information flow
Figure 7.16.: Viewpoint V-109
V-109 I-106
C-41
C-147
C-169
S-10
S-126
S-4
S-22 S-45
S-55
S-2
M-2 M-58
M-69
M-13
Stakeholders MethodologiesConcerns Viewpoint Informationmodel Datacollection
DC-1 DC-2 DC-3
DC-4 DC-5 DC-6
DC-7 DC-8 DC-9
DC-10 DC-37 DC-38
DC-39 DC-40 DC-41
DC-42
Figure 7.17.: Viewpoint V-109 graph
© Technische Universität München, sebis, 2015. All rights reserved. 51
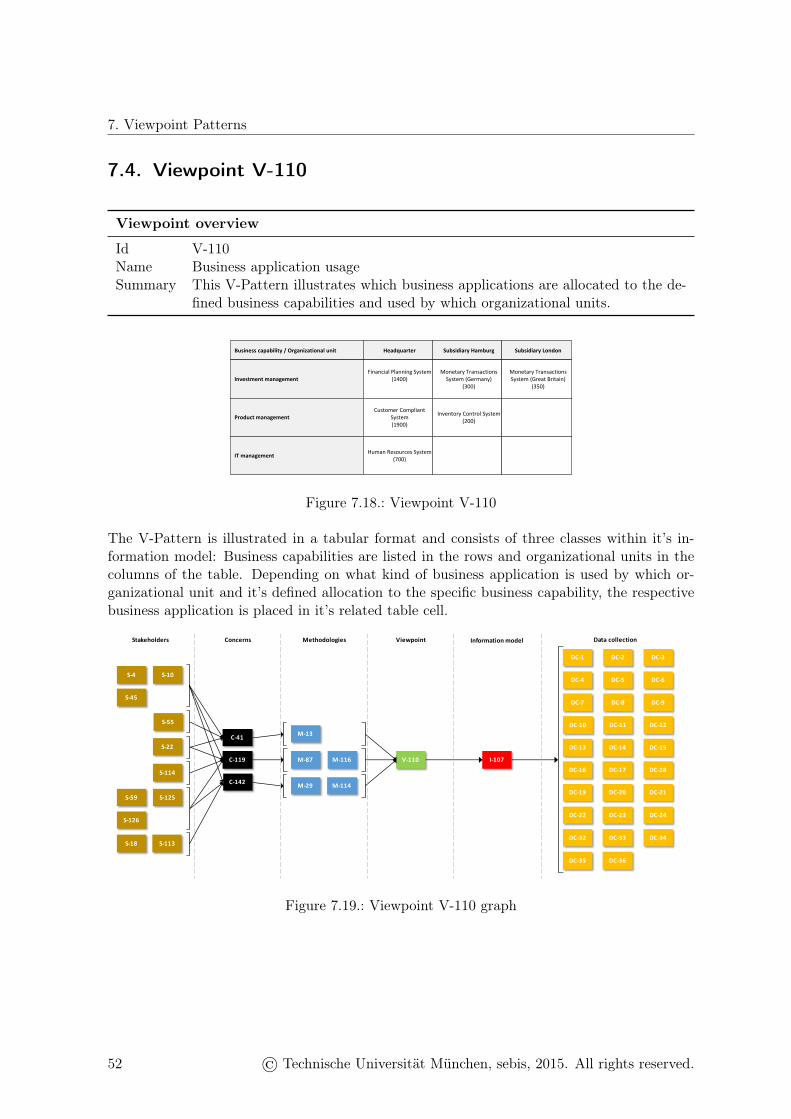
7. Viewpoint Patterns
7.4. Viewpoint V-110
Viewpoint overview
Id V-110Name Business application usageSummary This V-Pattern illustrates which business applications are allocated to the de-
fined business capabilities and used by which organizational units.
Business capability / Organizational unit Headquarter Subsidiary Hamburg Subsidiary London
Investment managementFinancial Planning System
(1400)Monetary Transactions
System (Germany)(300)
Monetary Transactions System (Great Britain)
(350)
Product managementCustomer Compliant
System (1900)
Inventory Control System (200)
IT management Human Resources System (700)
Figure 7.18.: Viewpoint V-110
The V-Pattern is illustrated in a tabular format and consists of three classes within it’s in-formation model: Business capabilities are listed in the rows and organizational units in thecolumns of the table. Depending on what kind of business application is used by which or-ganizational unit and it’s defined allocation to the specific business capability, the respectivebusiness application is placed in it’s related table cell.
V-110 I-107
C-41
C-119
C-142
M-13
M-87 M-116
M-29 M-114
S-10
S-22
S-4
S-45
S-55
S-114
S-113S-18
S-125S-59
S-126
Stakeholders MethodologiesConcerns Viewpoint Informationmodel Datacollection
DC-1 DC-2 DC-3
DC-4 DC-5 DC-6
DC-7 DC-8 DC-9
DC-10 DC-11 DC-12
DC-13 DC-14 DC-15
DC-16 DC-17 DC-18
DC-19 DC-20 DC-21
DC-22 DC-23 DC-24
DC-32 DC-33 DC-34
DC-35 DC-36
Figure 7.19.: Viewpoint V-110 graph
52 © Technische Universität München, sebis, 2015. All rights reserved.

7. Viewpoint Patterns
7.5. Viewpoint V-111
Viewpoint overview
Id V-111Name Business application status within a specific business capabilitySummary This viewpoint visualizes the technical or business related status of a business
application related to a specific Business Capability.
The base map of this pattern consists of two information model dimensions: The businesscapability are listed in the rows of the table. Business applications are listed in the columns.The third dimension illustrates a business related or technical related status of a businessapplication, but related to a specific business capability. Possible status are illustrated in thedifferent variations of this viewpoint.
Business capability / Business applicationBusiness
application 1
Business capability 1
Business capability 2
Business capability 3
Businessapplication 2
x
x
Businessapplication 3
x
Business capability 4
Business capability 5 x
Business capability 6 x
x
x
x
Businessapplication 4
x
x
x
x
Figure 7.20.: Viewpoint V-111
© Technische Universität München, sebis, 2015. All rights reserved. 53
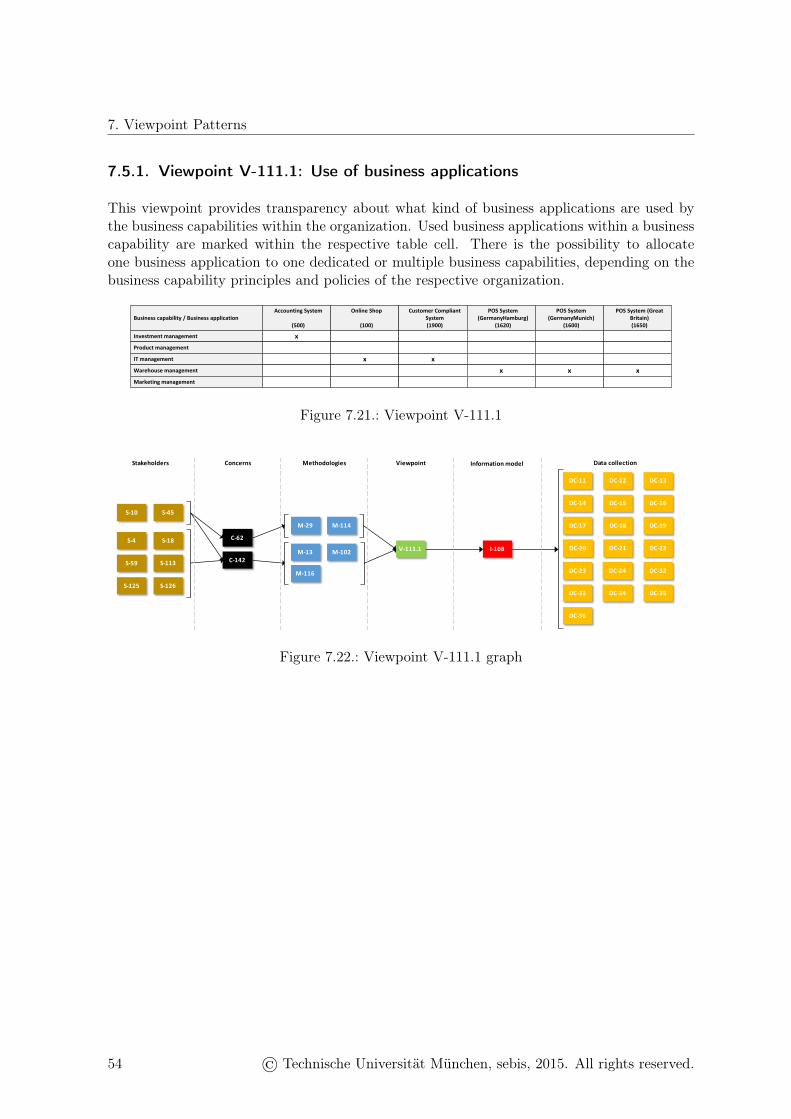
7. Viewpoint Patterns
7.5.1. Viewpoint V-111.1: Use of business applications
This viewpoint provides transparency about what kind of business applications are used bythe business capabilities within the organization. Used business applications within a businesscapability are marked within the respective table cell. There is the possibility to allocateone business application to one dedicated or multiple business capabilities, depending on thebusiness capability principles and policies of the respective organization.
Business capability / Business applicationAccounting System
(500)
Investment management xProduct management
IT management
Online Shop
(100)
x
Customer CompliantSystem(1900)
xWarehouse management
Marketing management
POS System (GermanyHamburg)
(1620)
POS System (GermanyMunich)
(1600)
POS System (Great Britain)(1650)
x x x
Figure 7.21.: Viewpoint V-111.1
V-111.1 I-108C-62
C-142
S-18
S-10 S-45
S-4
S-59 S-113
S-125
M-29 M-114
M-13 M-102
M-116
Stakeholders MethodologiesConcerns Viewpoint Informationmodel Datacollection
DC-22
DC-11 DC-12 DC-13
DC-14 DC-15 DC-16
DC-17 DC-18 DC-19
DC-20 DC-21
DC-35
DC-23 DC-24 DC-32
DC-33 DC-34
DC-36
S-126
Figure 7.22.: Viewpoint V-111.1 graph
54 © Technische Universität München, sebis, 2015. All rights reserved.
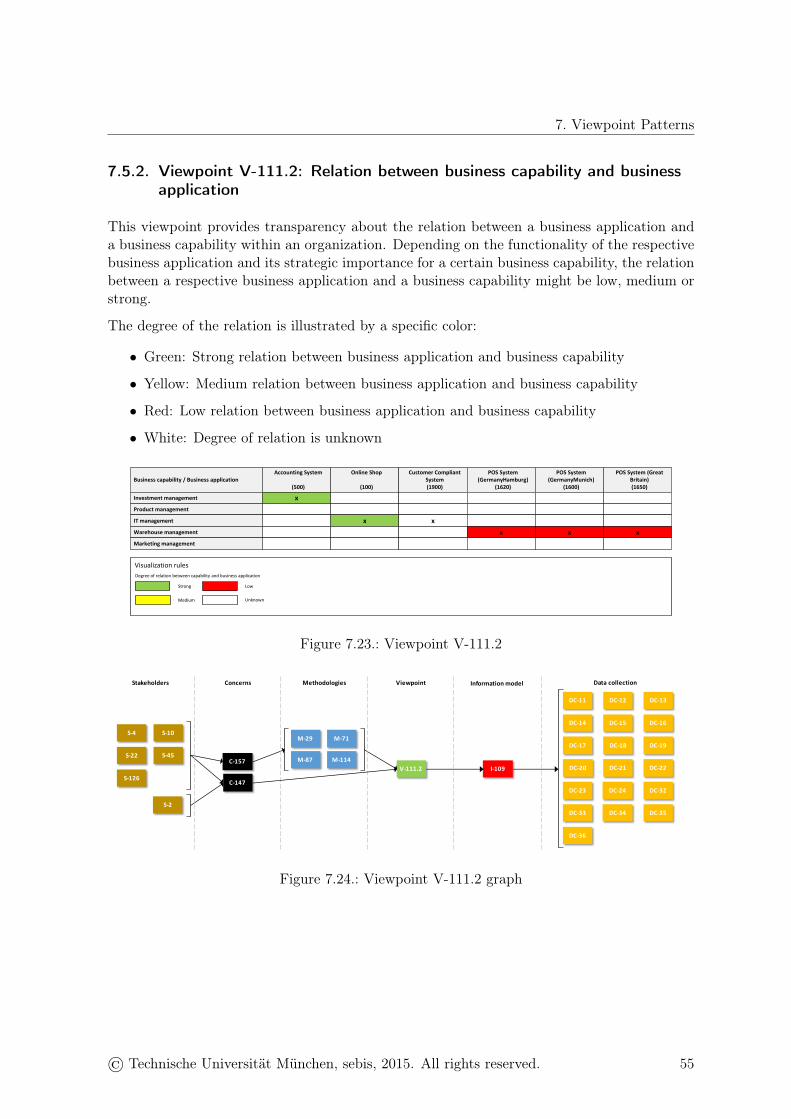
7. Viewpoint Patterns
7.5.2. Viewpoint V-111.2: Relation between business capability and businessapplication
This viewpoint provides transparency about the relation between a business application anda business capability within an organization. Depending on the functionality of the respectivebusiness application and its strategic importance for a certain business capability, the relationbetween a respective business application and a business capability might be low, medium orstrong.
The degree of the relation is illustrated by a specific color:
• Green: Strong relation between business application and business capability
• Yellow: Medium relation between business application and business capability
• Red: Low relation between business application and business capability
• White: Degree of relation is unknown
Business capability / Business applicationAccounting System
(500)
Investment management xProduct management
IT management
Online Shop
(100)
x
Customer CompliantSystem(1900)
xWarehouse management
Marketing management
POS System (GermanyHamburg)
(1620)
POS System (GermanyMunich)
(1600)
POS System (Great Britain)(1650)
x x x
Visualization rules
Degree of relation between capability and business application
Strong
Medium
Low
Unknown
Figure 7.23.: Viewpoint V-111.2
V-111.2 I-109C-157
C-147
S-10
S-2
S-4
S-22 S-45
S-126
M-29 M-71
M-87 M-114
Stakeholders MethodologiesConcerns Viewpoint Informationmodel Datacollection
DC-22
DC-11 DC-12 DC-13
DC-14 DC-15 DC-16
DC-17 DC-18 DC-19
DC-20 DC-21
DC-35
DC-23 DC-24 DC-32
DC-33 DC-34
DC-36
Figure 7.24.: Viewpoint V-111.2 graph
© Technische Universität München, sebis, 2015. All rights reserved. 55
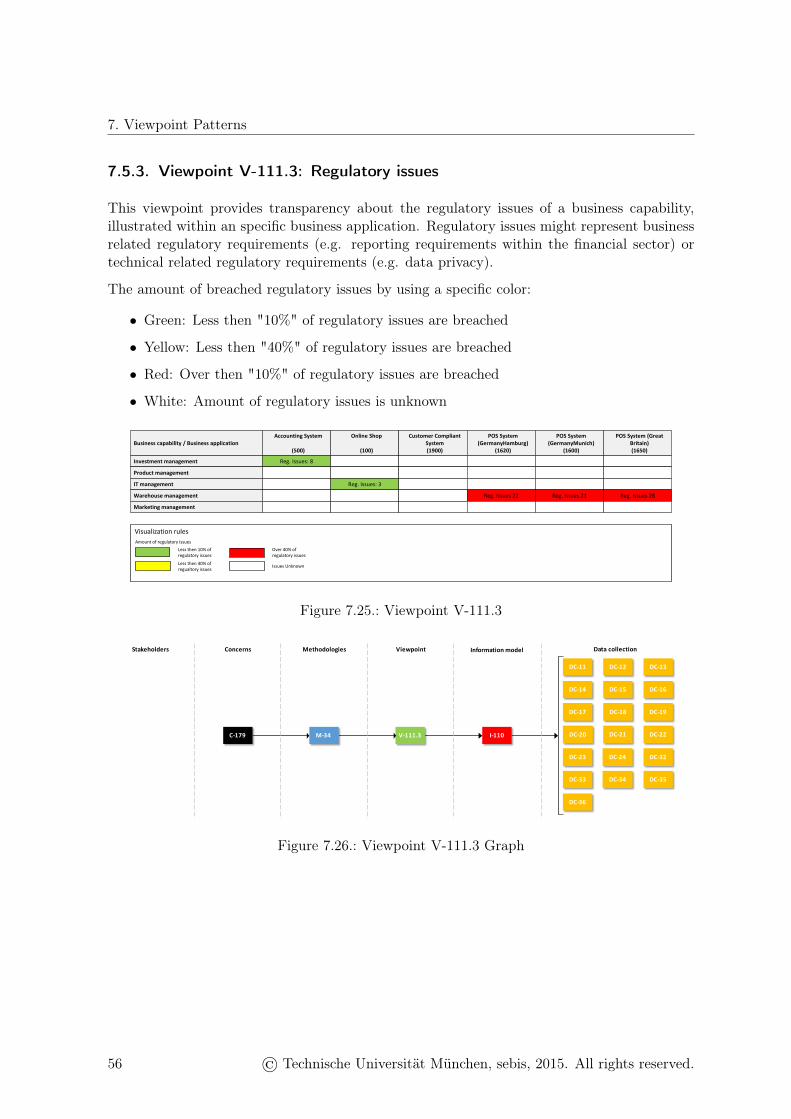
7. Viewpoint Patterns
7.5.3. Viewpoint V-111.3: Regulatory issues
This viewpoint provides transparency about the regulatory issues of a business capability,illustrated within an specific business application. Regulatory issues might represent businessrelated regulatory requirements (e.g. reporting requirements within the financial sector) ortechnical related regulatory requirements (e.g. data privacy).
The amount of breached regulatory issues by using a specific color:
• Green: Less then "10%" of regulatory issues are breached
• Yellow: Less then "40%" of regulatory issues are breached
• Red: Over then "10%" of regulatory issues are breached
• White: Amount of regulatory issues is unknown
Business capability / Business applicationAccounting System
(500)
Investment management Reg. Issues: 8
Product management
IT management
Online Shop
(100)
Reg. Issues: 3
Customer CompliantSystem(1900)
Warehouse management
Marketing management
POS System (GermanyHamburg)
(1620)
POS System (GermanyMunich)
(1600)
POS System (Great Britain)(1650)
Reg. Issues 22 Reg. Issues 21 Reg. Issues 28
Visualization rulesAmount of regulatory issues
Less then 10% ofregulatory issuesLess then 40% ofregualtory issues
Over 40% ofregulatory issues
Issues Unknown
Figure 7.25.: Viewpoint V-111.3
V-111.3 I-110C-179 M-34
Stakeholders MethodologiesConcerns Viewpoint Informationmodel Datacollection
DC-22
DC-11 DC-12 DC-13
DC-14 DC-15 DC-16
DC-17 DC-18 DC-19
DC-20 DC-21
DC-35
DC-23 DC-24 DC-32
DC-33 DC-34
DC-36
Figure 7.26.: Viewpoint V-111.3 Graph
56 © Technische Universität München, sebis, 2015. All rights reserved.
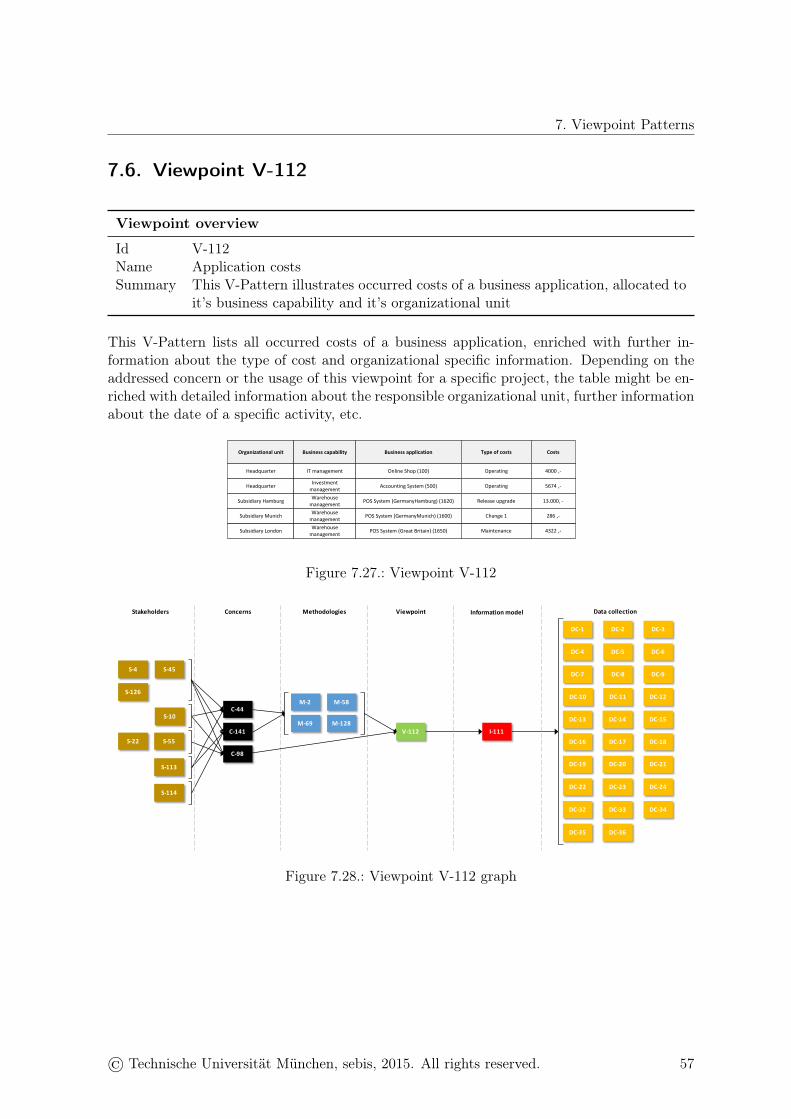
7. Viewpoint Patterns
7.6. Viewpoint V-112
Viewpoint overview
Id V-112Name Application costsSummary This V-Pattern illustrates occurred costs of a business application, allocated to
it’s business capability and it’s organizational unit
This V-Pattern lists all occurred costs of a business application, enriched with further in-formation about the type of cost and organizational specific information. Depending on theaddressed concern or the usage of this viewpoint for a specific project, the table might be en-riched with detailed information about the responsible organizational unit, further informationabout the date of a specific activity, etc.
Organizational unit
Headquarter
Headquarter
Subsidiary Hamburg
Subsidiary London
Business capability
IT management
Investment
management
Warehouse
management
Warehouse
management
Business application
Online Shop (100)
Accounting System (500)
POS System (GermanyHamburg) (1620)
POS System (Great Britain) (1650)
Type of costs
Operating
Operating
Release upgrade
Maintenance
Costs
4000 ,-
5674 ,-
13.000, -
4322 ,-
Subsidiary MunichWarehouse
managementPOS System (GermanyMunich) (1600) Change 1 286 ,-
Figure 7.27.: Viewpoint V-112
V-112 I-111
C-44
C-98
C-141
S-45
S-55
S-4
S-126
S-10
S-114
S-22
S-113
M-2 M-58
M-69 M-128
Stakeholders MethodologiesConcerns Viewpoint Informationmodel Datacollection
DC-1 DC-2 DC-3
DC-4 DC-5 DC-6
DC-7 DC-8 DC-9
DC-10 DC-11 DC-12
DC-13 DC-14 DC-15
DC-16 DC-17 DC-18
DC-19 DC-20 DC-21
DC-22 DC-23 DC-24
DC-32 DC-33 DC-34
DC-35 DC-36
Figure 7.28.: Viewpoint V-112 graph
© Technische Universität München, sebis, 2015. All rights reserved. 57
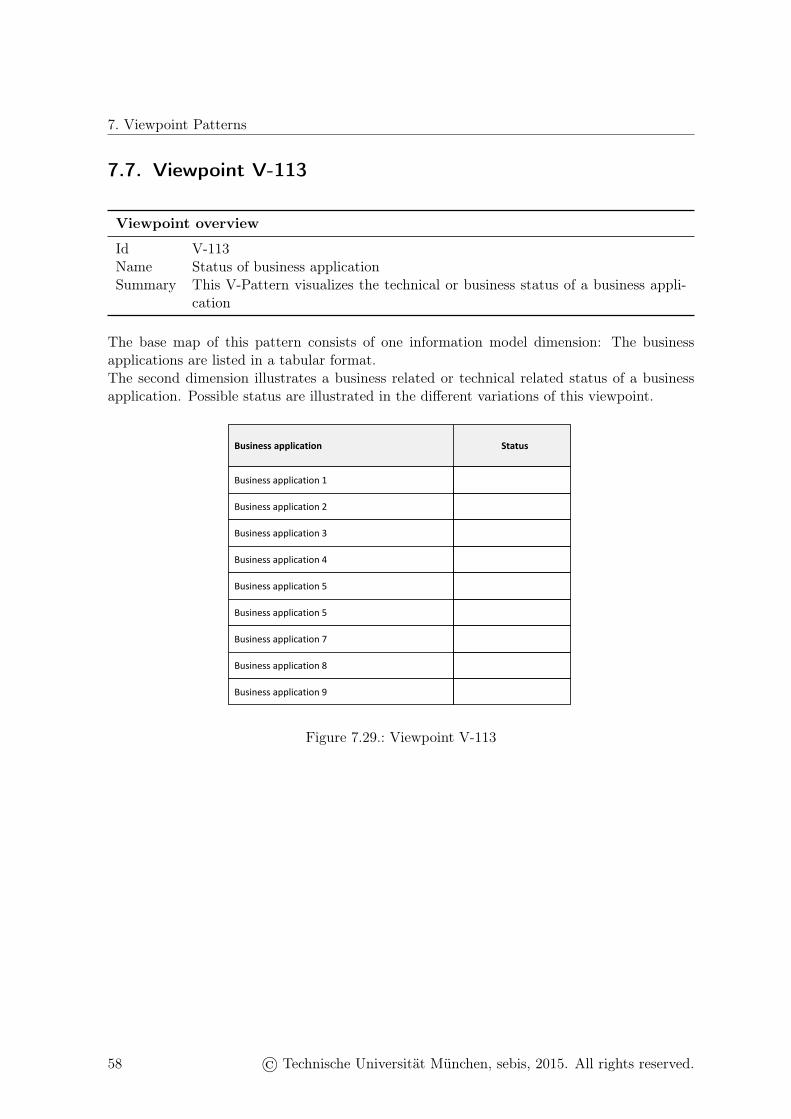
7. Viewpoint Patterns
7.7. Viewpoint V-113
Viewpoint overview
Id V-113Name Status of business applicationSummary This V-Pattern visualizes the technical or business status of a business appli-
cation
The base map of this pattern consists of one information model dimension: The businessapplications are listed in a tabular format.The second dimension illustrates a business related or technical related status of a businessapplication. Possible status are illustrated in the different variations of this viewpoint.
Business application Status
Business application 1
Business application 2
Business application 3
Business application 4
Business application 5
Business application 5
Business application 7
Business application 8
Business application 9
Figure 7.29.: Viewpoint V-113
58 © Technische Universität München, sebis, 2015. All rights reserved.
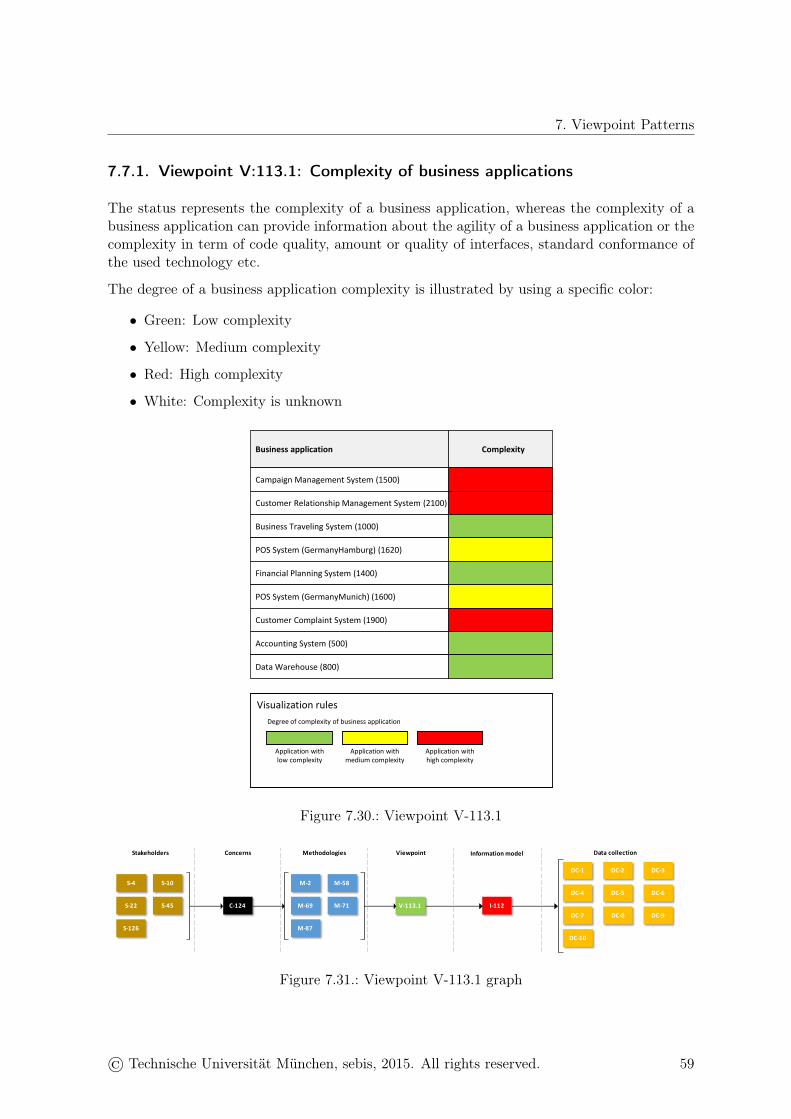
7. Viewpoint Patterns
7.7.1. Viewpoint V:113.1: Complexity of business applications
The status represents the complexity of a business application, whereas the complexity of abusiness application can provide information about the agility of a business application or thecomplexity in term of code quality, amount or quality of interfaces, standard conformance ofthe used technology etc.
The degree of a business application complexity is illustrated by using a specific color:
• Green: Low complexity
• Yellow: Medium complexity
• Red: High complexity
• White: Complexity is unknown
Business application Complexity
Campaign Management System (1500)
Customer Relationship Management System (2100)
Business Traveling System (1000)
POS System (GermanyHamburg) (1620)
Financial Planning System (1400)
POS System (GermanyMunich) (1600)
Customer Complaint System (1900)
Accounting System (500)
Data Warehouse (800)
Visualization rules
Application withhigh complexity
Application withmedium complexity
Application withlow complexity
Degree of complexity of business application
Figure 7.30.: Viewpoint V-113.1
V-113.1 I-112C-124S-45
S-4 S-10
S-22
S-126
M-2 M-58
M-69 M-71
M-87
Stakeholders MethodologiesConcerns Viewpoint Informationmodel Datacollection
DC-1 DC-2 DC-3
DC-4 DC-5 DC-6
DC-7 DC-8 DC-9
DC-10
Figure 7.31.: Viewpoint V-113.1 graph
© Technische Universität München, sebis, 2015. All rights reserved. 59
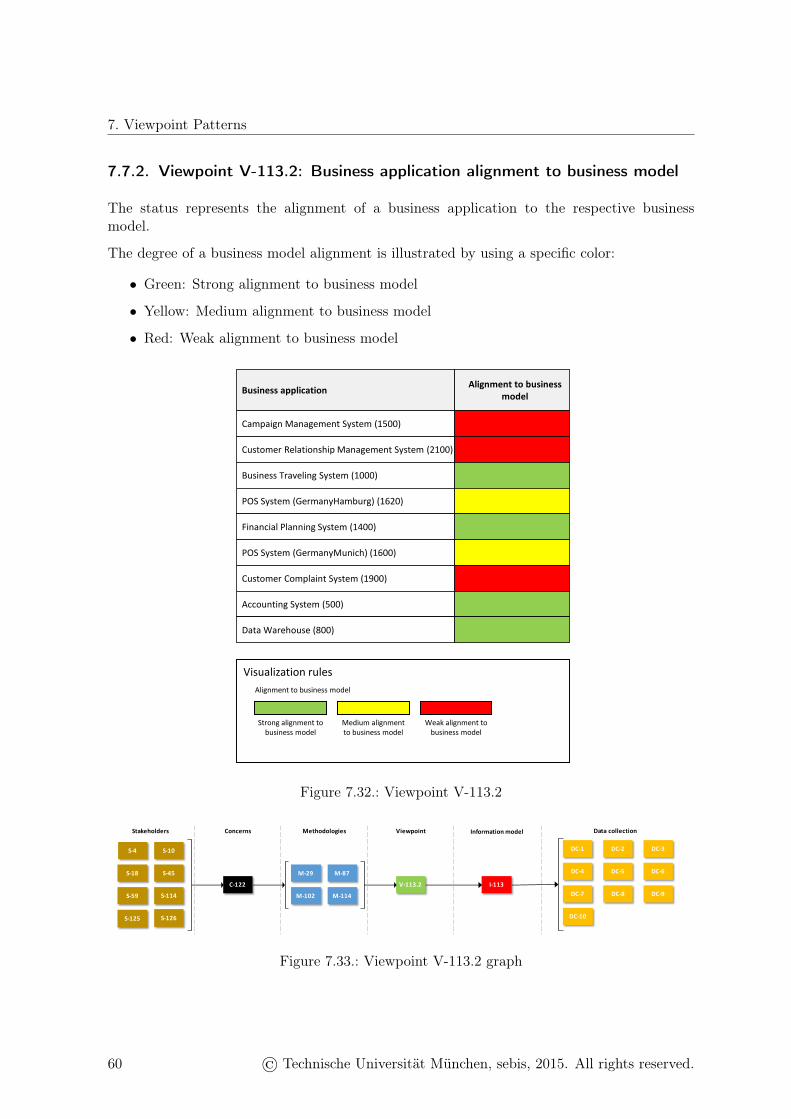
7. Viewpoint Patterns
7.7.2. Viewpoint V-113.2: Business application alignment to business model
The status represents the alignment of a business application to the respective businessmodel.
The degree of a business model alignment is illustrated by using a specific color:
• Green: Strong alignment to business model
• Yellow: Medium alignment to business model
• Red: Weak alignment to business model
Business applicationAlignment to business
model
Campaign Management System (1500)
Customer Relationship Management System (2100)
Business Traveling System (1000)
POS System (GermanyHamburg) (1620)
Financial Planning System (1400)
POS System (GermanyMunich) (1600)
Customer Complaint System (1900)
Accounting System (500)
Data Warehouse (800)
Visualization rules
Weak alignment tobusiness model
Medium alignmentto business model
Strong alignment tobusiness model
Alignment to business model
Figure 7.32.: Viewpoint V-113.2
V-113.2 I-113C-122
M-29 M-87
M-102 M-114
S-45
S-4 S-10
S-18
S-59 S-114
S-125 S-126
Stakeholders MethodologiesConcerns Viewpoint Informationmodel Datacollection
DC-1 DC-2 DC-3
DC-4 DC-5 DC-6
DC-7 DC-8 DC-9
DC-10
Figure 7.33.: Viewpoint V-113.2 graph
60 © Technische Universität München, sebis, 2015. All rights reserved.
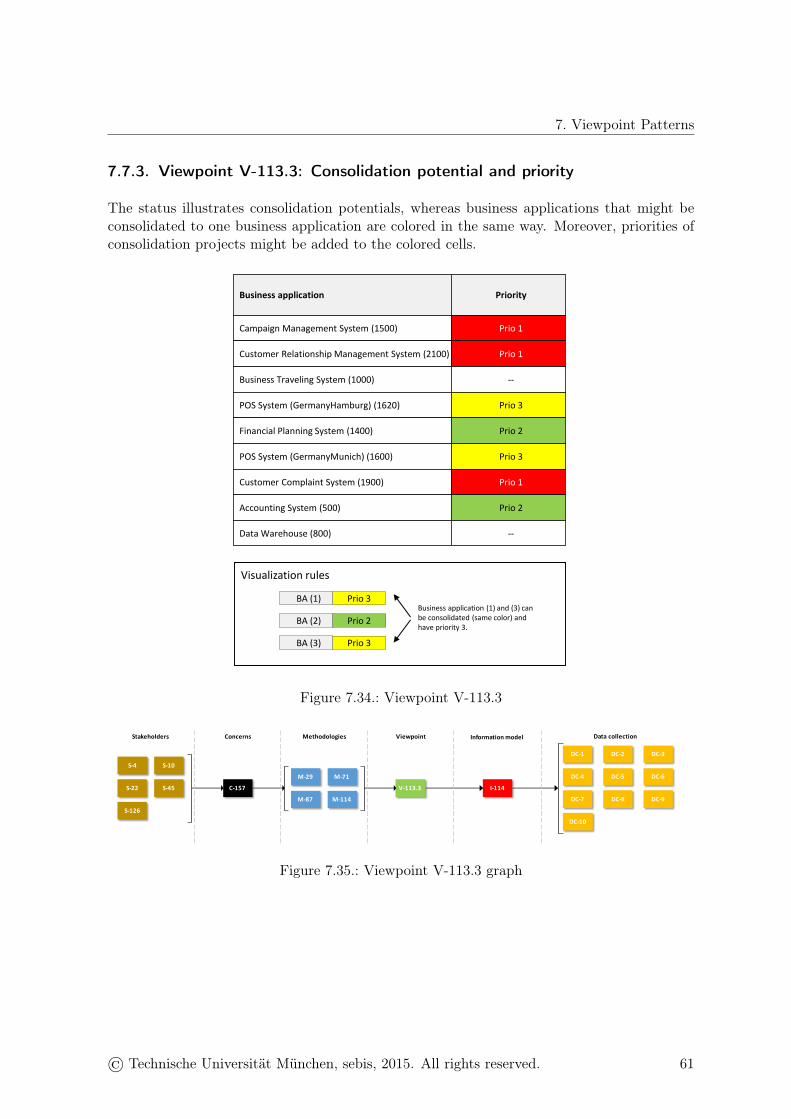
7. Viewpoint Patterns
7.7.3. Viewpoint V-113.3: Consolidation potential and priority
The status illustrates consolidation potentials, whereas business applications that might beconsolidated to one business application are colored in the same way. Moreover, priorities ofconsolidation projects might be added to the colored cells.
Business application Priority
Campaign Management System (1500) Prio 1
Customer Relationship Management System (2100) Prio 1
Business Traveling System (1000) --
POS System (GermanyHamburg) (1620) Prio 3
Financial Planning System (1400) Prio 2
POS System (GermanyMunich) (1600) Prio 3
Customer Complaint System (1900) Prio 1
Accounting System (500) Prio 2
Data Warehouse (800) --
Visualization rules
Business application (1) and (3) canbe consolidated (same color) andhave priority 3.
Prio 3
Prio 2
BA (1)
BA (2)
Prio 3BA (3)
Figure 7.34.: Viewpoint V-113.3
V-113.3 I-114C-157
M-29 M-71
M-87 M-114
S-45
S-4 S-10
S-22
S-126
Stakeholders MethodologiesConcerns Viewpoint Informationmodel Datacollection
DC-1 DC-2 DC-3
DC-4 DC-5 DC-6
DC-7 DC-8 DC-9
DC-10
Figure 7.35.: Viewpoint V-113.3 graph
© Technische Universität München, sebis, 2015. All rights reserved. 61
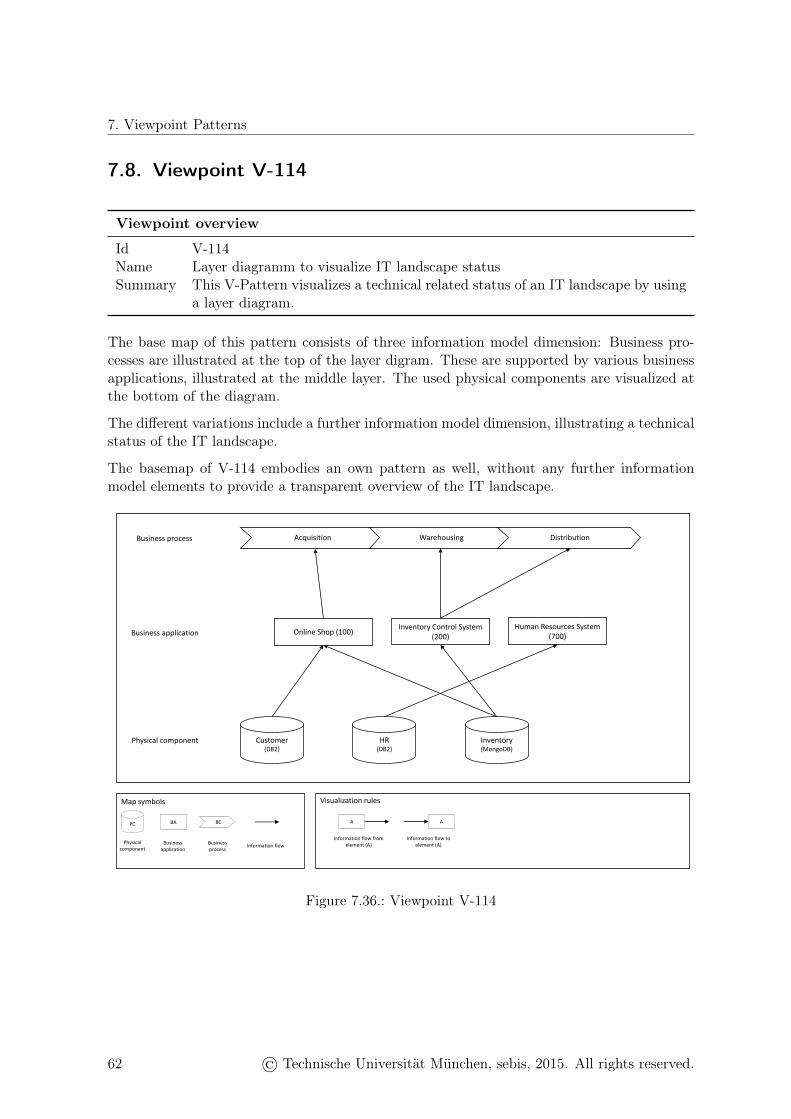
7. Viewpoint Patterns
7.8. Viewpoint V-114
Viewpoint overview
Id V-114Name Layer diagramm to visualize IT landscape statusSummary This V-Pattern visualizes a technical related status of an IT landscape by using
a layer diagram.
The base map of this pattern consists of three information model dimension: Business pro-cesses are illustrated at the top of the layer digram. These are supported by various businessapplications, illustrated at the middle layer. The used physical components are visualized atthe bottom of the diagram.
The different variations include a further information model dimension, illustrating a technicalstatus of the IT landscape.
The basemap of V-114 embodies an own pattern as well, without any further informationmodel elements to provide a transparent overview of the IT landscape.
Customer(DB2)
HR(DB2)
Inventory(MongoDB)
Inventory Control System (200)
Human Resources System (700)Online Shop (100)
Acquisition Warehousing Distribution
Physical component
Business application
Business process
Map symbols Visualization rules
Information flow
A A
Information flow fromelement (A)
Information flow toelement (A)
PC
Physicalcomponent
BA
Business application
Business process
BC
Figure 7.36.: Viewpoint V-114
62 © Technische Universität München, sebis, 2015. All rights reserved.
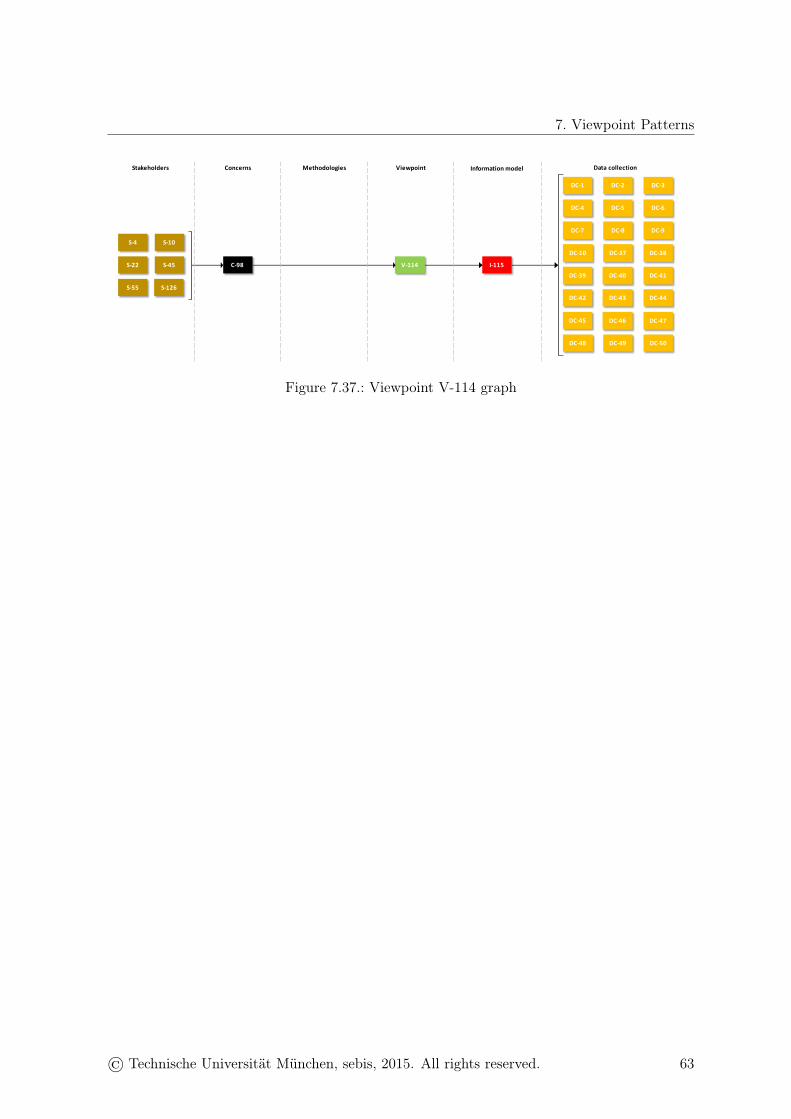
7. Viewpoint Patterns
V-114 I-115C-98
Stakeholders MethodologiesConcerns Viewpoint Informationmodel Datacollection
DC-38
DC-1 DC-2 DC-3
DC-4 DC-5 DC-6
DC-7 DC-8 DC-9
DC-10 DC-37
DC-44
DC-39 DC-40 DC-41
DC-42 DC-43
DC-45
DC-50DC-48 DC-49
DC-47DC-46
S-45
S-4 S-10
S-22
S-55 S-126
Figure 7.37.: Viewpoint V-114 graph
© Technische Universität München, sebis, 2015. All rights reserved. 63
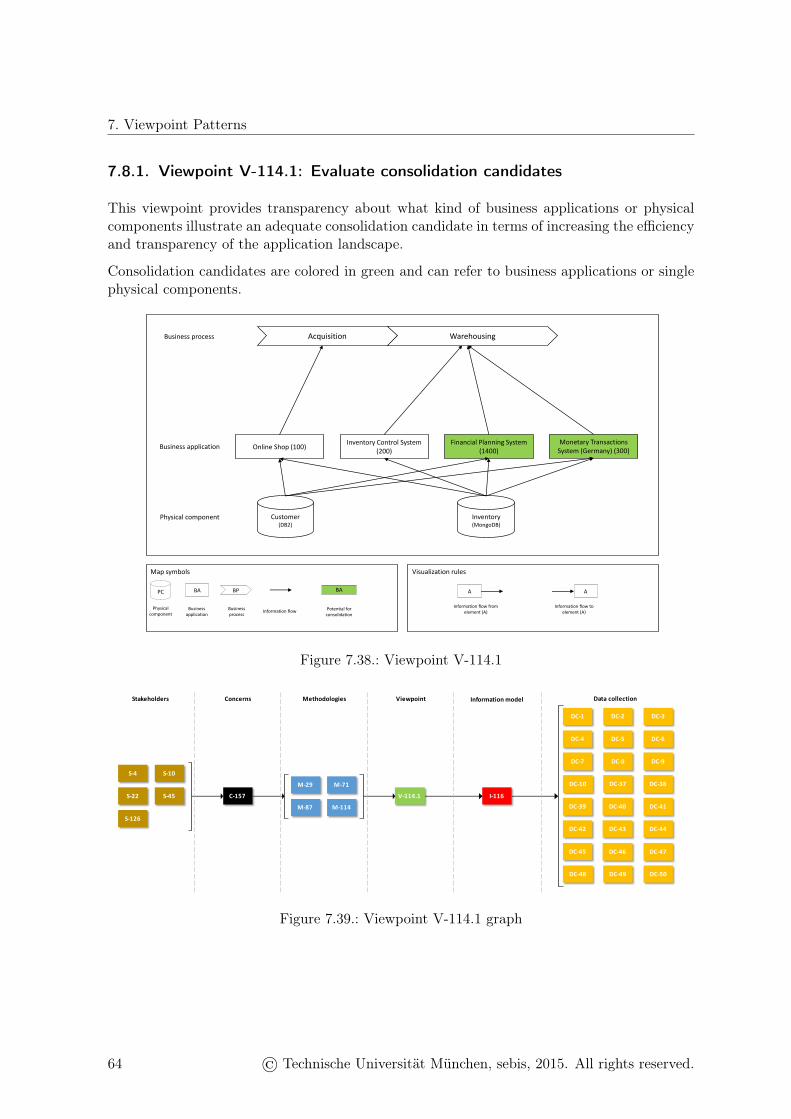
7. Viewpoint Patterns
7.8.1. Viewpoint V-114.1: Evaluate consolidation candidates
This viewpoint provides transparency about what kind of business applications or physicalcomponents illustrate an adequate consolidation candidate in terms of increasing the efficiencyand transparency of the application landscape.
Consolidation candidates are colored in green and can refer to business applications or singlephysical components.
Customer(DB2)
Inventory(MongoDB)
Inventory Control System (200)Online Shop (100)
Physical component
Business application
Business process
Map symbols Visualization rules
A A
Information flow fromelement (A)
Information flow toelement (A)Information flow
PC
Physicalcomponent
BA
Business application
Business process
BP
Monetary Transactions System (Germany) (300)
Financial Planning System (1400)
BA
Potential for consolidation
Acquisition Warehousing
Figure 7.38.: Viewpoint V-114.1
V-114.1 I-116C-157
M-29 M-71
M-87 M-114
S-45
S-4 S-10
S-22
S-126
Stakeholders MethodologiesConcerns Viewpoint Informationmodel Datacollection
DC-38
DC-1 DC-2 DC-3
DC-4 DC-5 DC-6
DC-7 DC-8 DC-9
DC-10 DC-37
DC-44
DC-39 DC-40 DC-41
DC-42 DC-43
DC-45
DC-50DC-48 DC-49
DC-47DC-46
Figure 7.39.: Viewpoint V-114.1 graph
64 © Technische Universität München, sebis, 2015. All rights reserved.
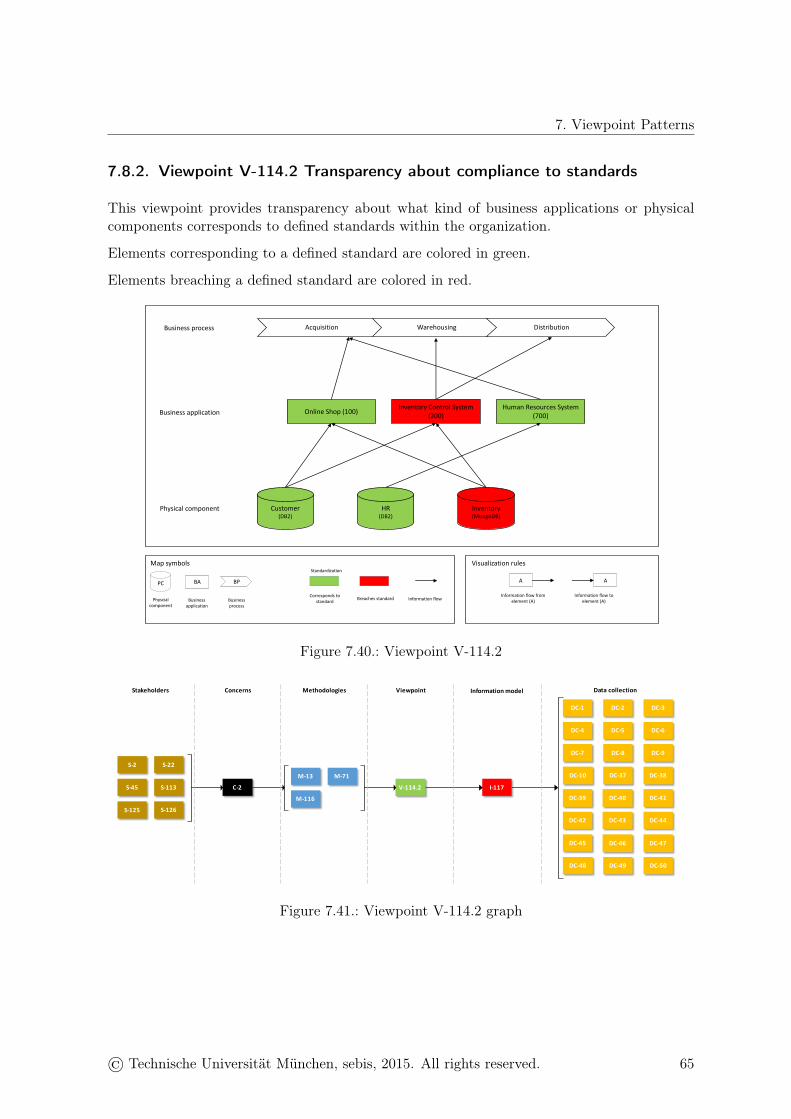
7. Viewpoint Patterns
7.8.2. Viewpoint V-114.2 Transparency about compliance to standards
This viewpoint provides transparency about what kind of business applications or physicalcomponents corresponds to defined standards within the organization.
Elements corresponding to a defined standard are colored in green.
Elements breaching a defined standard are colored in red.
Customer(DB2)
HR(DB2)
Inventory(MongoDB)
Inventory Control System (200)Online Shop (100)
Acquisition Warehousing Distribution
Physical component
Business application
Business process
Map symbols Visualization rules
Corresponds tostandard Breaches standard Information flow
A A
Information flow fromelement (A)
Information flow toelement (A)
Human Resources System (700)
PC
Physcialcomponent
BA
Business application
Business process
BP
Standardization
Figure 7.40.: Viewpoint V-114.2
V-114.2 I-117C-2
M-13 M-71
M-116
S-113
S-2 S-22
S-45
S-125 S-126
Stakeholders MethodologiesConcerns Viewpoint Informationmodel Datacollection
DC-38
DC-1 DC-2 DC-3
DC-4 DC-5 DC-6
DC-7 DC-8 DC-9
DC-10 DC-37
DC-44
DC-39 DC-40 DC-41
DC-42 DC-43
DC-45
DC-50DC-48 DC-49
DC-47DC-46
Figure 7.41.: Viewpoint V-114.2 graph
© Technische Universität München, sebis, 2015. All rights reserved. 65

7. Viewpoint Patterns
7.9. Viewpoint V-115
Viewpoint overview
Id V-115Name Number of interfaces per business applicationSummary Identifies the most interrelated business applications.
This measure (𝑁𝐼) indicates the number of incoming (𝐼𝑎) and outgoing (𝑂𝑎) interfaces or in-formation flows of a certain business application (𝑎) to other business applications. Thereby,the structural complexity of a single business application is assessed by considering its inter-dependency. A higher value is associated with a higher application complexity.
Calculation: Sum of numbers of information flows that are either incoming to or outgoingfrom the respective business application.
Mathematical representation: 𝑁𝐼𝑎 := |𝐼𝑎|+ |𝑂𝑎|
V-115 I-63M-69
S-45
S-4 S-10
S-25
Stakeholders MethodologiesConcerns Viewpoint Information model Data collection
DC-1 DC-2 DC-3
DC-4 DC-5 DC-6
DC-7 DC-8 DC-9
DC-10 DC-25 DC-26
C-120 C-124
C-141
DC-27 DC-28 DC-29
DC-30 DC-74 DC-75
DC-76 DC-77
Figure 7.42.: Viewpoint V-115 graph
66 © Technische Universität München, sebis, 2015. All rights reserved.
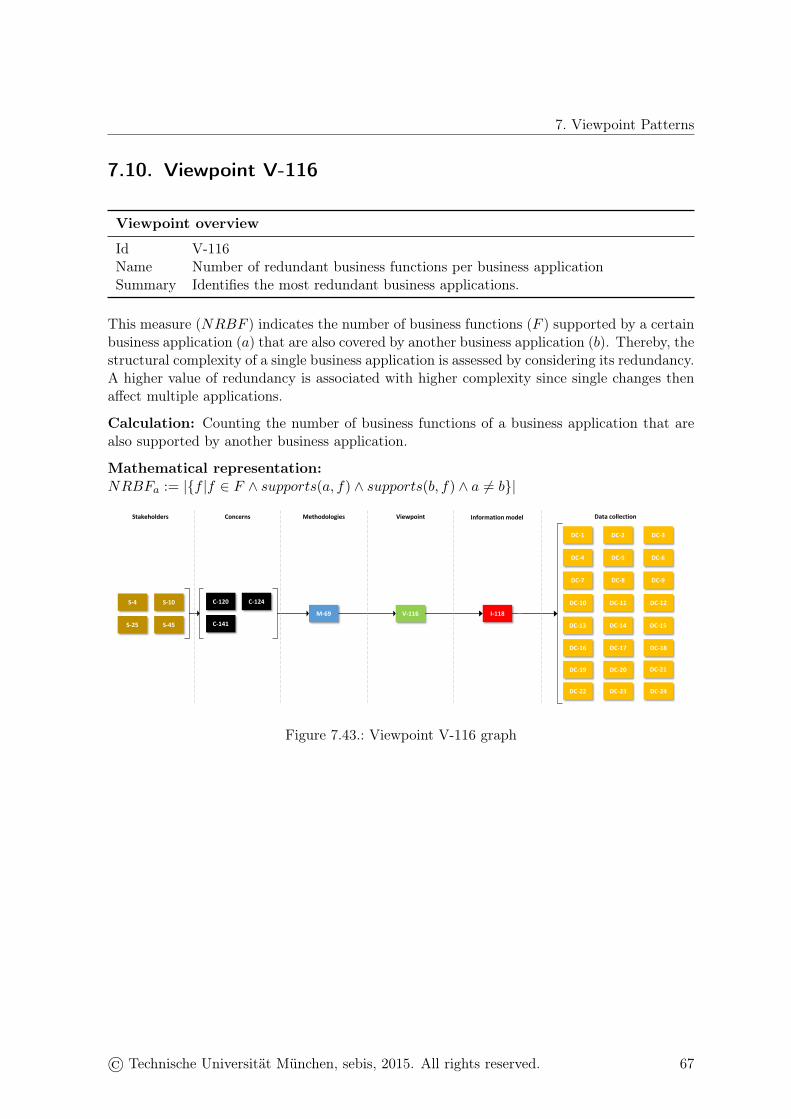
7. Viewpoint Patterns
7.10. Viewpoint V-116
Viewpoint overview
Id V-116Name Number of redundant business functions per business applicationSummary Identifies the most redundant business applications.
This measure (𝑁𝑅𝐵𝐹 ) indicates the number of business functions (𝐹 ) supported by a certainbusiness application (𝑎) that are also covered by another business application (𝑏). Thereby, thestructural complexity of a single business application is assessed by considering its redundancy.A higher value of redundancy is associated with higher complexity since single changes thenaffect multiple applications.
Calculation: Counting the number of business functions of a business application that arealso supported by another business application.
Mathematical representation:𝑁𝑅𝐵𝐹𝑎 := |{𝑓 |𝑓 ∈ 𝐹 ∧ 𝑠𝑢𝑝𝑝𝑜𝑟𝑡𝑠(𝑎, 𝑓) ∧ 𝑠𝑢𝑝𝑝𝑜𝑟𝑡𝑠(𝑏, 𝑓) ∧ 𝑎 ̸= 𝑏}|
V-116 I-118M-69
S-45
S-4 S-10
S-25
Stakeholders MethodologiesConcerns Viewpoint Information model Data collection
DC-1 DC-2 DC-3
DC-4 DC-5 DC-6
DC-7 DC-8 DC-9
DC-10 DC-11 DC-12C-120 C-124
C-141 DC-13 DC-14 DC-15
DC-16 DC-17 DC-18
DC-19 DC-20
DC-22 DC-23 DC-24
DC-21
Figure 7.43.: Viewpoint V-116 graph
© Technische Universität München, sebis, 2015. All rights reserved. 67

7. Viewpoint Patterns
7.11. Viewpoint V-117
Viewpoint overview
Id V-117Name Number of business applications used within a functional domainSummary Calculates the extent of IT support per domain.
This measure (𝑁𝐵𝐴) indicates the number of business applications (𝐴) used within a specificfunctional domain (𝑑). Thereby, the structural complexity of a functional domain or businesscapability is assessed by considering its extent. A higher number is associated with a higherapplication landscape or domain complexity.
Calculation: Sum of business applications used within a functional domain of a company.
Mathematical representation: 𝑁𝐵𝐴𝑑 := |{𝑎|𝑎 ∈ 𝐴 ∧ 𝑢𝑠𝑒𝑑(𝑎, 𝑑)}|
V-117 I-119M-69
S-45
S-4 S-10
S-25
Stakeholders MethodologiesConcerns Viewpoint Information model Data collection
DC-1 DC-2 DC-3
DC-4 DC-5 DC-6
DC-7 DC-8 DC-9
DC-10
C-120 C-124
C-141
Figure 7.44.: Viewpoint V-117 graph
68 © Technische Universität München, sebis, 2015. All rights reserved.
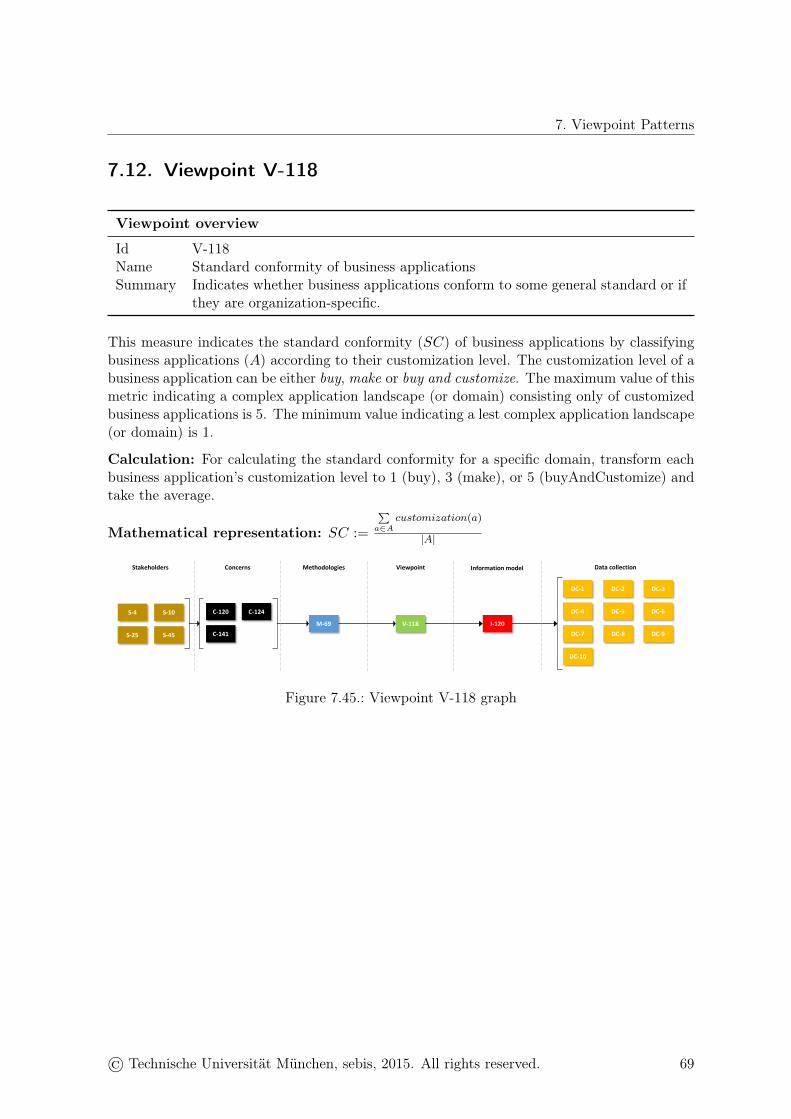
7. Viewpoint Patterns
7.12. Viewpoint V-118
Viewpoint overview
Id V-118Name Standard conformity of business applicationsSummary Indicates whether business applications conform to some general standard or if
they are organization-specific.
This measure indicates the standard conformity (𝑆𝐶) of business applications by classifyingbusiness applications (𝐴) according to their customization level. The customization level of abusiness application can be either buy, make or buy and customize. The maximum value of thismetric indicating a complex application landscape (or domain) consisting only of customizedbusiness applications is 5. The minimum value indicating a lest complex application landscape(or domain) is 1.
Calculation: For calculating the standard conformity for a specific domain, transform eachbusiness application’s customization level to 1 (buy), 3 (make), or 5 (buyAndCustomize) andtake the average.
Mathematical representation: 𝑆𝐶 :=
∑︀𝑎∈𝐴
𝑐𝑢𝑠𝑡𝑜𝑚𝑖𝑧𝑎𝑡𝑖𝑜𝑛(𝑎)
|𝐴|
V-118 I-120M-69
S-45
S-4 S-10
S-25
Stakeholders MethodologiesConcerns Viewpoint Information model Data collection
DC-1 DC-2 DC-3
DC-4 DC-5 DC-6
DC-7 DC-8 DC-9
DC-10
C-120 C-124
C-141
Figure 7.45.: Viewpoint V-118 graph
© Technische Universität München, sebis, 2015. All rights reserved. 69
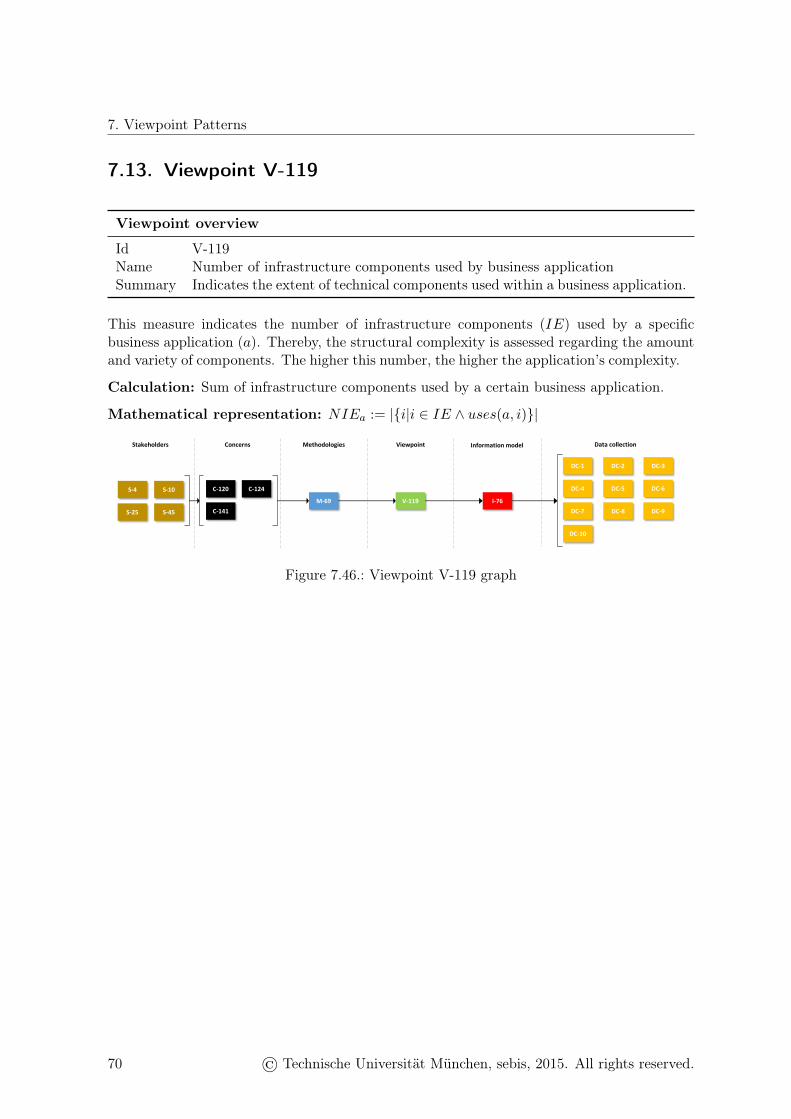
7. Viewpoint Patterns
7.13. Viewpoint V-119
Viewpoint overview
Id V-119Name Number of infrastructure components used by business applicationSummary Indicates the extent of technical components used within a business application.
This measure indicates the number of infrastructure components (𝐼𝐸) used by a specificbusiness application (𝑎). Thereby, the structural complexity is assessed regarding the amountand variety of components. The higher this number, the higher the application’s complexity.
Calculation: Sum of infrastructure components used by a certain business application.
Mathematical representation: 𝑁𝐼𝐸𝑎 := |{𝑖|𝑖 ∈ 𝐼𝐸 ∧ 𝑢𝑠𝑒𝑠(𝑎, 𝑖)}|
V-119 I-76M-69
S-45
S-4 S-10
S-25
Stakeholders MethodologiesConcerns Viewpoint Information model Data collection
DC-1 DC-2 DC-3
DC-4 DC-5 DC-6
DC-7 DC-8 DC-9
DC-10
C-120 C-124
C-141
Figure 7.46.: Viewpoint V-119 graph
70 © Technische Universität München, sebis, 2015. All rights reserved.

7. Viewpoint Patterns
7.14. Viewpoint V-120
This measure indicates the amount of functionality (𝐹𝑆) provided by a certain business ap-plication (𝑎). The higher this amount, the higher the application’s complexity.
Viewpoint overview
Id V-120Name Functional scope of a business applicationSummary Measures the extent of support a business application offers.
Calculation: The functional scope can be assessed either by summing up the function pointsof a business application or by counting business functions (𝐹 ) supported by a certain businessapplication.
Mathematical representation:𝐹𝑆1𝑎 := 𝑓𝑢𝑛𝑐𝑡𝑖𝑜𝑛𝑃𝑜𝑖𝑛𝑡𝑠(𝑎)𝐹𝑆2𝑎 := |{𝑓 |𝑓 ∈ 𝐹 ∧ 𝑠𝑢𝑝𝑝𝑜𝑟𝑡𝑠(𝑎, 𝑓)}|
V-120 I-118M-69S-45
S-4 S-10
S-25
Stakeholders MethodologiesConcerns Viewpoint Informationmodel Datacollection
C-120 C-124
C-141I-121
DC-1 DC-2 DC-3
DC-4 DC-5 DC-6
DC-7 DC-8 DC-9
DC-10 DC-11 DC-12
DC-13 DC-14 DC-15
DC-16 DC-17 DC-18
DC-19 DC-20
DC-22 DC-23 DC-24
DC-21
Figure 7.47.: Viewpoint V-120 graph
© Technische Universität München, sebis, 2015. All rights reserved. 71

72
CHAPTER 8
Information Model Patterns
Contents8.1. Information model I-99 . . . . . . . . . . . . . . . . . . . . . . . . . 748.2. Information model I-100 . . . . . . . . . . . . . . . . . . . . . . . . 758.3. Information model I-101 . . . . . . . . . . . . . . . . . . . . . . . . 768.4. Information model I-102 . . . . . . . . . . . . . . . . . . . . . . . . 778.5. Information model I-103 . . . . . . . . . . . . . . . . . . . . . . . . 788.6. Information model I-104 . . . . . . . . . . . . . . . . . . . . . . . . 798.7. Information model I-105 . . . . . . . . . . . . . . . . . . . . . . . . 808.8. Information model I-106 . . . . . . . . . . . . . . . . . . . . . . . . 818.9. Information model I-107 . . . . . . . . . . . . . . . . . . . . . . . . 828.10. Information model I-108 . . . . . . . . . . . . . . . . . . . . . . . . 848.11. Information model I-109 . . . . . . . . . . . . . . . . . . . . . . . . 858.12. Information model I-110 . . . . . . . . . . . . . . . . . . . . . . . . 868.13. Information model I-111 . . . . . . . . . . . . . . . . . . . . . . . . 878.14. Information model I-112 . . . . . . . . . . . . . . . . . . . . . . . . 888.15. Information model I-113 . . . . . . . . . . . . . . . . . . . . . . . . 898.16. Information model I-114 . . . . . . . . . . . . . . . . . . . . . . . . 908.17. Information model I-115 . . . . . . . . . . . . . . . . . . . . . . . . 918.18. Information model I-116 . . . . . . . . . . . . . . . . . . . . . . . . 928.19. Information model I-117 . . . . . . . . . . . . . . . . . . . . . . . . 938.20. Information model I-118 . . . . . . . . . . . . . . . . . . . . . . . . 948.21. Information model I-119 . . . . . . . . . . . . . . . . . . . . . . . . 958.22. Information model I-120 . . . . . . . . . . . . . . . . . . . . . . . . 968.23. Information model I-121 . . . . . . . . . . . . . . . . . . . . . . . . 97
© Technische Universität München, sebis, 2015. All rights reserved. 73
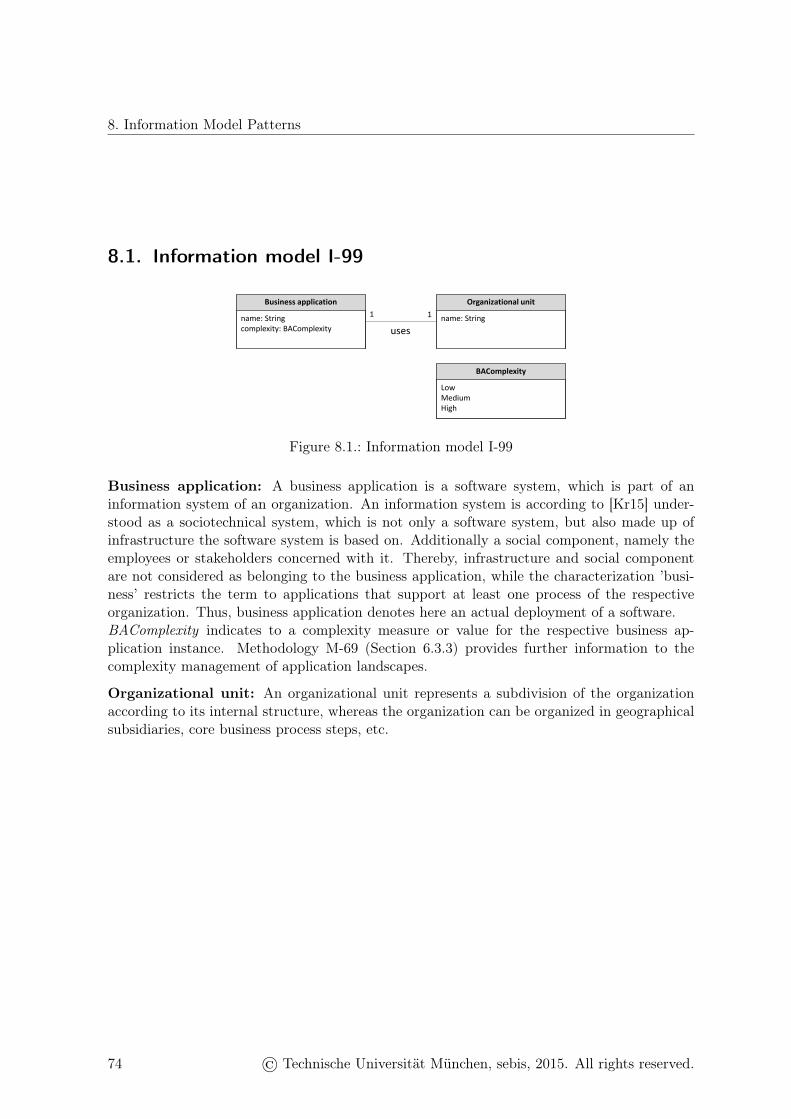
8. Information Model Patterns
8.1. Information model I-99
Business application Organizational unit1 1name: String
complexity: BAComplexityname: String
uses
BAComplexity
LowMediumHigh
Figure 8.1.: Information model I-99
Business application: A business application is a software system, which is part of aninformation system of an organization. An information system is according to [Kr15] under-stood as a sociotechnical system, which is not only a software system, but also made up ofinfrastructure the software system is based on. Additionally a social component, namely theemployees or stakeholders concerned with it. Thereby, infrastructure and social componentare not considered as belonging to the business application, while the characterization ’busi-ness’ restricts the term to applications that support at least one process of the respectiveorganization. Thus, business application denotes here an actual deployment of a software.BAComplexity indicates to a complexity measure or value for the respective business ap-plication instance. Methodology M-69 (Section 6.3.3) provides further information to thecomplexity management of application landscapes.
Organizational unit: An organizational unit represents a subdivision of the organizationaccording to its internal structure, whereas the organization can be organized in geographicalsubsidiaries, core business process steps, etc.
74 © Technische Universität München, sebis, 2015. All rights reserved.

8. Information Model Patterns
8.2. Information model I-100
Business application Organizational unit* 1..*name: String
staus: Architectural fitname: String
uses
Architectural fit
WeakMediumStrong
Figure 8.2.: Information model I-100
Business application: A business application is a software system, which is part of aninformation system of an organization. An information system is according to [Kr15] under-stood as a sociotechnical system, which is not only a software system, but also made up ofinfrastructure the software system is based on. Additionally a social component, namely theemployees or stakeholders concerned with it. Thereby, infrastructure and social componentare not considered as belonging to the business application, while the characterization ’busi-ness’ restricts the term to applications that support at least one process of the respectiveorganization. Thus, business application denotes here an actual deployment of a software.The status attribute provides further information, whether the business application alignswith the architectural blueprint of the organization.
Organizational Unit: An organizational unit represents a subdivision of the organizationaccording to its internal structure, whereas the organization can be organized in geographicalsubsidiaries, core business process steps, etc.
© Technische Universität München, sebis, 2015. All rights reserved. 75
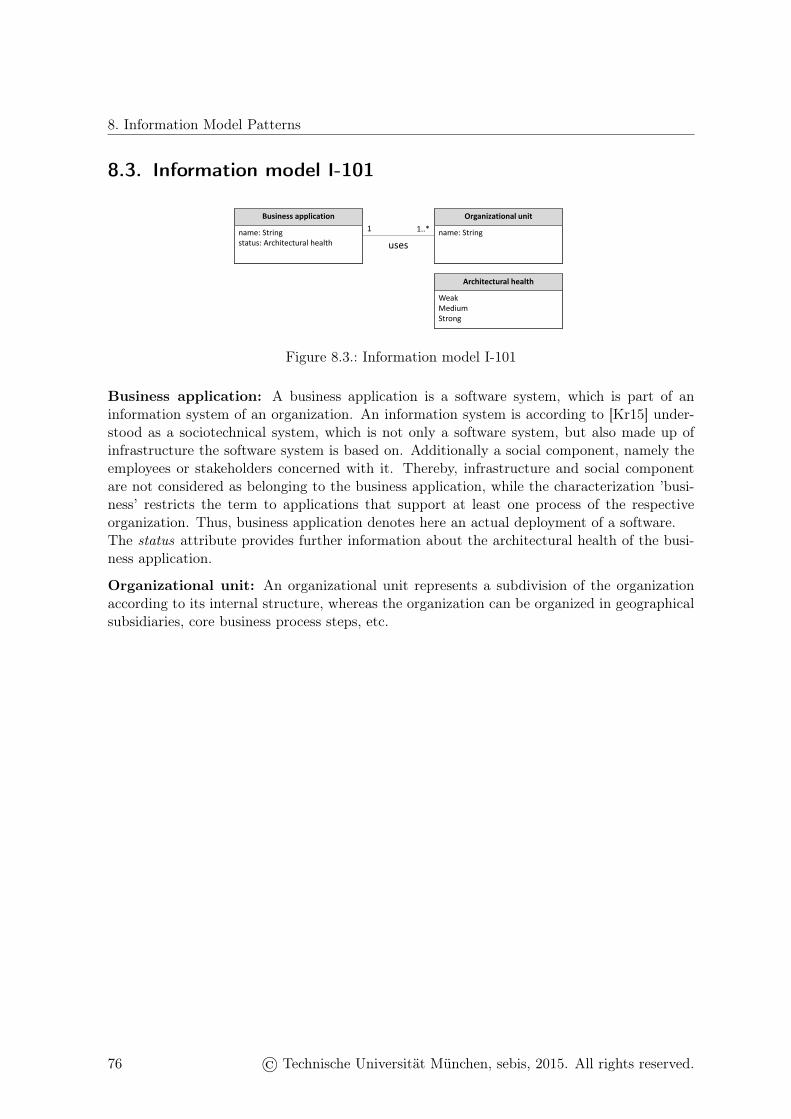
8. Information Model Patterns
8.3. Information model I-101
Business application Organizational unit1 1..*name: String
status: Architectural health name: String
uses
Architectural health
WeakMediumStrong
Figure 8.3.: Information model I-101
Business application: A business application is a software system, which is part of aninformation system of an organization. An information system is according to [Kr15] under-stood as a sociotechnical system, which is not only a software system, but also made up ofinfrastructure the software system is based on. Additionally a social component, namely theemployees or stakeholders concerned with it. Thereby, infrastructure and social componentare not considered as belonging to the business application, while the characterization ’busi-ness’ restricts the term to applications that support at least one process of the respectiveorganization. Thus, business application denotes here an actual deployment of a software.The status attribute provides further information about the architectural health of the busi-ness application.
Organizational unit: An organizational unit represents a subdivision of the organizationaccording to its internal structure, whereas the organization can be organized in geographicalsubsidiaries, core business process steps, etc.
76 © Technische Universität München, sebis, 2015. All rights reserved.
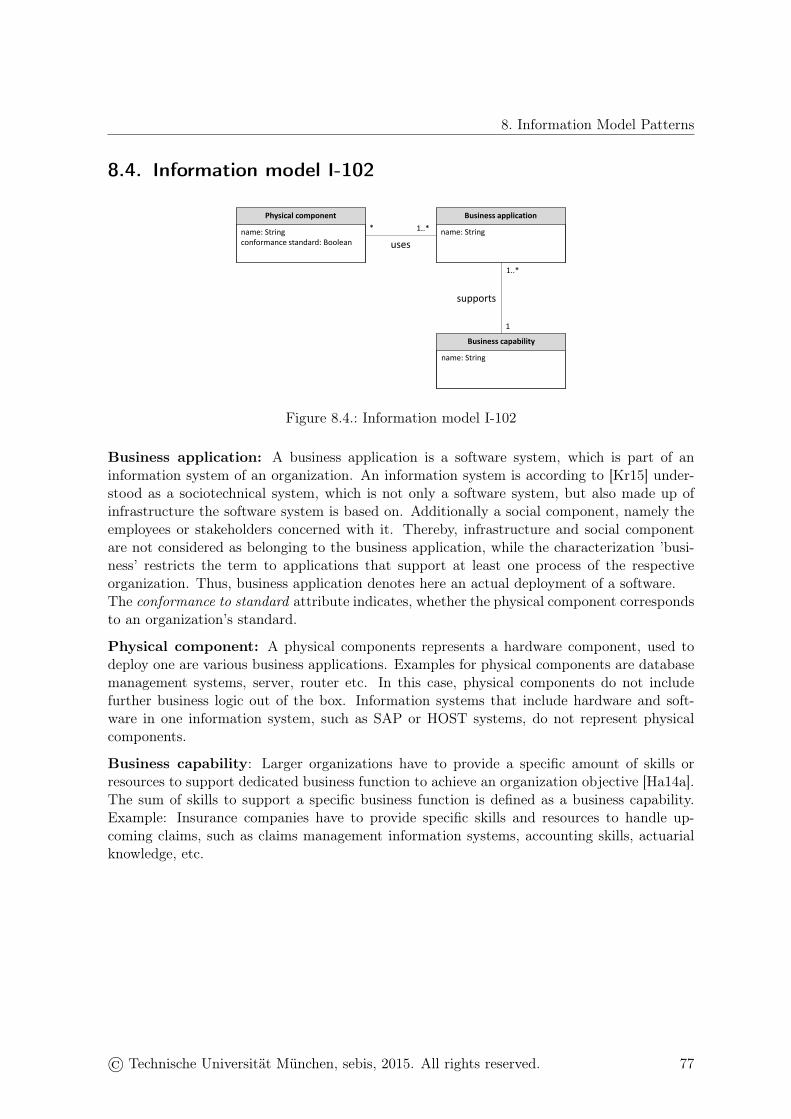
8. Information Model Patterns
8.4. Information model I-102
Physical component Business application
* 1..*name: Stringconformance standard: Boolean
name: String
Business capability
1
name: String
1..*
uses
supports
Figure 8.4.: Information model I-102
Business application: A business application is a software system, which is part of aninformation system of an organization. An information system is according to [Kr15] under-stood as a sociotechnical system, which is not only a software system, but also made up ofinfrastructure the software system is based on. Additionally a social component, namely theemployees or stakeholders concerned with it. Thereby, infrastructure and social componentare not considered as belonging to the business application, while the characterization ’busi-ness’ restricts the term to applications that support at least one process of the respectiveorganization. Thus, business application denotes here an actual deployment of a software.The conformance to standard attribute indicates, whether the physical component correspondsto an organization’s standard.
Physical component: A physical components represents a hardware component, used todeploy one are various business applications. Examples for physical components are databasemanagement systems, server, router etc. In this case, physical components do not includefurther business logic out of the box. Information systems that include hardware and soft-ware in one information system, such as SAP or HOST systems, do not represent physicalcomponents.
Business capability: Larger organizations have to provide a specific amount of skills orresources to support dedicated business function to achieve an organization objective [Ha14a].The sum of skills to support a specific business function is defined as a business capability.Example: Insurance companies have to provide specific skills and resources to handle up-coming claims, such as claims management information systems, accounting skills, actuarialknowledge, etc.
© Technische Universität München, sebis, 2015. All rights reserved. 77
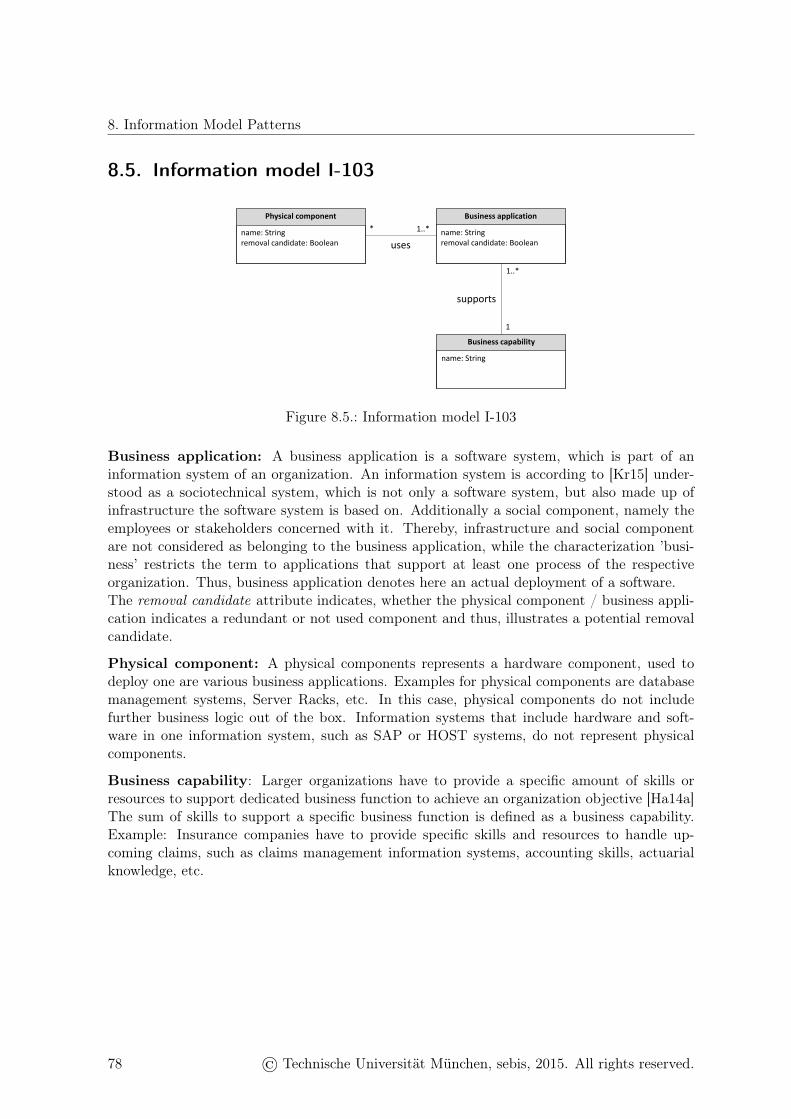
8. Information Model Patterns
8.5. Information model I-103
Physical component Business application
* 1..*name: Stringremoval candidate: Boolean
name: Stringremoval candidate: Boolean
Business capability
1
name: String
1..*
uses
supports
Figure 8.5.: Information model I-103
Business application: A business application is a software system, which is part of aninformation system of an organization. An information system is according to [Kr15] under-stood as a sociotechnical system, which is not only a software system, but also made up ofinfrastructure the software system is based on. Additionally a social component, namely theemployees or stakeholders concerned with it. Thereby, infrastructure and social componentare not considered as belonging to the business application, while the characterization ’busi-ness’ restricts the term to applications that support at least one process of the respectiveorganization. Thus, business application denotes here an actual deployment of a software.The removal candidate attribute indicates, whether the physical component / business appli-cation indicates a redundant or not used component and thus, illustrates a potential removalcandidate.
Physical component: A physical components represents a hardware component, used todeploy one are various business applications. Examples for physical components are databasemanagement systems, Server Racks, etc. In this case, physical components do not includefurther business logic out of the box. Information systems that include hardware and soft-ware in one information system, such as SAP or HOST systems, do not represent physicalcomponents.
Business capability: Larger organizations have to provide a specific amount of skills orresources to support dedicated business function to achieve an organization objective [Ha14a]The sum of skills to support a specific business function is defined as a business capability.Example: Insurance companies have to provide specific skills and resources to handle up-coming claims, such as claims management information systems, accounting skills, actuarialknowledge, etc.
78 © Technische Universität München, sebis, 2015. All rights reserved.

8. Information Model Patterns
8.6. Information model I-104
Physical component Business application
* 1..*name: Stringconsolidation candidate: Boolean
name: Stringconsolidation candidate: Boolean
Business capability
1
name: String
1..*
uses
supports
Figure 8.6.: Information model I-104
Business application: A business application is a software system, which is part of aninformation system of an organization. An information system is according to [Kr15] under-stood as a sociotechnical system, which is not only a software system, but also made up ofinfrastructure the software system is based on. Additionally a social component, namely theemployees or stakeholders concerned with it. Thereby, infrastructure and social componentare not considered as belonging to the business application, while the characterization ’busi-ness’ restricts the term to applications that support at least one process of the respectiveorganization. Thus, business application denotes here an actual deployment of a software.The consolidation candidate attribute indicates, whether the physical component / businessapplication can be consolidated with a further business application / physical component.
Physical component: A physical components represents a hardware component, used todeploy one are various business applications. Examples for physical components are databasemanagement systems, Server Racks, etc. In this case, physical components do not includefurther business logic out of the box. Information systems that include hardware and soft-ware in one information system, such as SAP or HOST systems, do not represent physicalcomponents.
Business capability: Larger organizations have to provide a specific amount of skills orresources to support dedicated business function to achieve an organization objective [Ha14a]The sum of skills to support a specific business function is defined as a business capability.Example: Insurance companies have to provide specific skills and resources to handle up-coming claims, such as claims management information systems, accounting skills, actuarialknowledge, etc.
© Technische Universität München, sebis, 2015. All rights reserved. 79

8. Information Model Patterns
8.7. Information model I-105
Physical component Business application
* 1..*name: String name: String
Business capability
1
name: String
1..*
uses
supports
Figure 8.7.: Information model I-105
Business application: A business application is a software system, which is part of aninformation system of an organization. An information system is according to [Kr15] under-stood as a sociotechnical system, which is not only a software system, but also made up ofinfrastructure the software system is based on. Additionally a social component, namely theemployees or stakeholders concerned with it. Thereby, infrastructure and social componentare not considered as belonging to the business application, while the characterization ’busi-ness’ restricts the term to applications that support at least one process of the respectiveorganization. Thus, business application denotes here an actual deployment of a software.
Physical component: A physical components represents a hardware component, used todeploy one are various business applications. Examples for physical components are databasemanagement systems, Server Racks, etc. In this case, physical components do not includefurther business logic out of the box. Information systems that include hardware and soft-ware in one information system, such as SAP or HOST systems, do not represent physicalcomponents.
Business capability: Larger organizations have to provide a specific amount of skills orresources to support dedicated business function to achieve an organization objective [Ha14a]The sum of skills to support a specific business function is defined as a business capability.Example: Insurance companies have to provide specific skills and resources to handle up-coming claims, such as claims management information systems, accounting skills, actuarialknowledge, etc.
80 © Technische Universität München, sebis, 2015. All rights reserved.
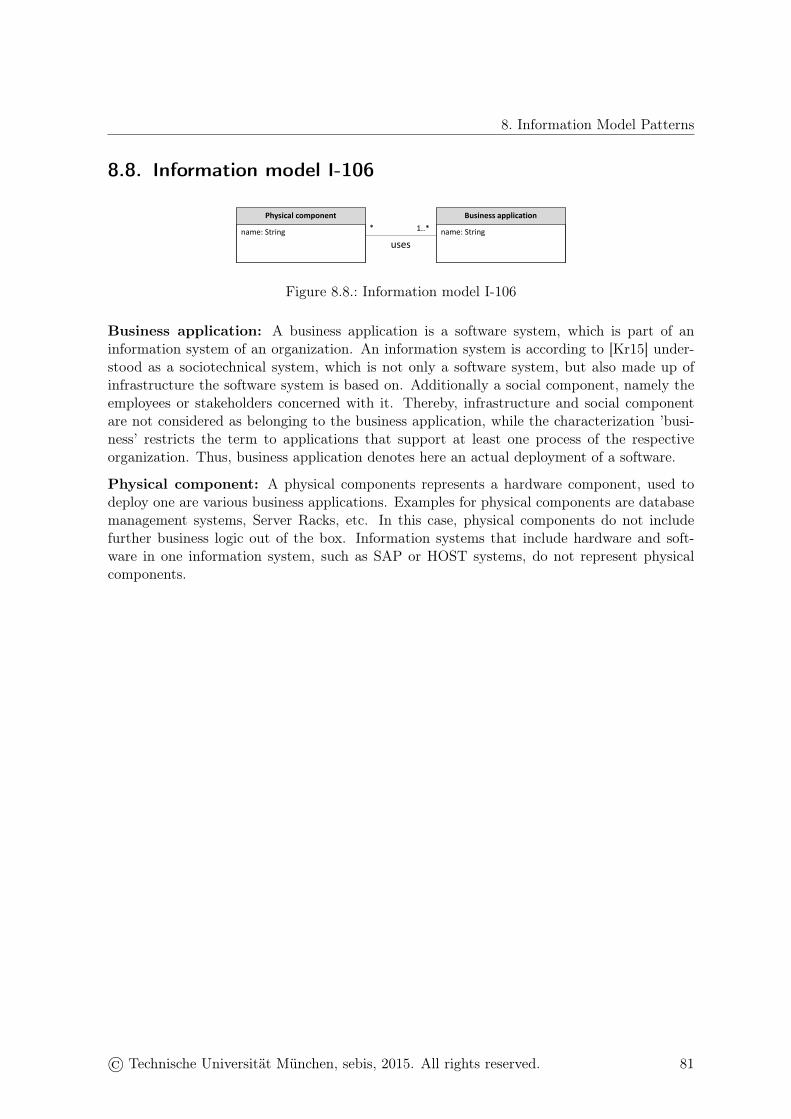
8. Information Model Patterns
8.8. Information model I-106
Physical component Business application
* 1..*name: String name: Stringuses
Figure 8.8.: Information model I-106
Business application: A business application is a software system, which is part of aninformation system of an organization. An information system is according to [Kr15] under-stood as a sociotechnical system, which is not only a software system, but also made up ofinfrastructure the software system is based on. Additionally a social component, namely theemployees or stakeholders concerned with it. Thereby, infrastructure and social componentare not considered as belonging to the business application, while the characterization ’busi-ness’ restricts the term to applications that support at least one process of the respectiveorganization. Thus, business application denotes here an actual deployment of a software.
Physical component: A physical components represents a hardware component, used todeploy one are various business applications. Examples for physical components are databasemanagement systems, Server Racks, etc. In this case, physical components do not includefurther business logic out of the box. Information systems that include hardware and soft-ware in one information system, such as SAP or HOST systems, do not represent physicalcomponents.
© Technische Universität München, sebis, 2015. All rights reserved. 81

8. Information Model Patterns
8.9. Information model I-107
Organizational unit1name:String
Businessapplication
name:String
Businesscapability* name:String*
Support relationship
name:String
*
1
1
supports
uses supported by
Figure 8.9.: Information model I-107
Business application: A business application is a software system, which is part of aninformation system of an organization. An information system is according to [Kr15] under-stood as a sociotechnical system, which is not only a software system, but also made up ofinfrastructure the software system is based on. Additionally a social component, namely theemployees or stakeholders concerned with it. Thereby, infrastructure and social componentare not considered as belonging to the business application, while the characterization ’busi-ness’ restricts the term to applications that support at least one process of the respectiveorganization. Thus, business application denotes here an actual deployment of a software.A business application can be used in by various organizational units and support differentbusiness capabilities. Thus, the information model of I-107 illustrates the business applicationas an association class.
Organizational unit: An organizational unit represents a subdivision of the organizationaccording to its internal structure, whereas the organization can be organized in geographicalsubsidiaries, core business process steps, etc.
Business capability: Larger organizations have to provide a specific amount of skills orresources to support dedicated business function to achieve an organization objective [Ha14a]The sum of skills to support a specific business function is defined as a business capability.
82 © Technische Universität München, sebis, 2015. All rights reserved.

8. Information Model Patterns
Example: Insurance companies have to provide specific skills and resources to handle up-coming claims, such as claims management information systems, accounting skills, actuarialknowledge, etc.
Support relationship: Represents the support of a business application in a business capa-bility at a specific organizational unit. Basically, it constitutes, together with its three associ-ations, a ternary relationship between business application, organizational unit, and businesscapability. This is necessary in order to be able to tell exactly which business capability issupported by which business application for which organizational unit.
© Technische Universität München, sebis, 2015. All rights reserved. 83
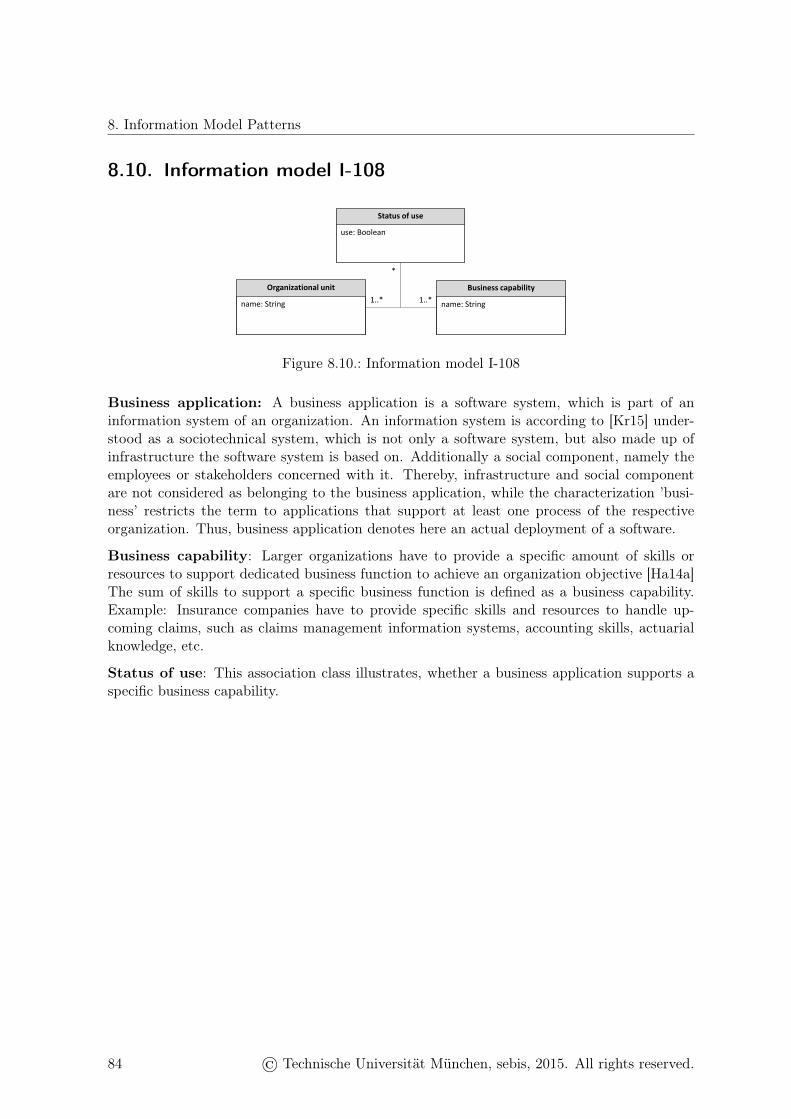
8. Information Model Patterns
8.10. Information model I-108
Organizational unit1..*name: String
Status of use
use: Boolean
Business capability1..*
name: String
*
Figure 8.10.: Information model I-108
Business application: A business application is a software system, which is part of aninformation system of an organization. An information system is according to [Kr15] under-stood as a sociotechnical system, which is not only a software system, but also made up ofinfrastructure the software system is based on. Additionally a social component, namely theemployees or stakeholders concerned with it. Thereby, infrastructure and social componentare not considered as belonging to the business application, while the characterization ’busi-ness’ restricts the term to applications that support at least one process of the respectiveorganization. Thus, business application denotes here an actual deployment of a software.
Business capability: Larger organizations have to provide a specific amount of skills orresources to support dedicated business function to achieve an organization objective [Ha14a]The sum of skills to support a specific business function is defined as a business capability.Example: Insurance companies have to provide specific skills and resources to handle up-coming claims, such as claims management information systems, accounting skills, actuarialknowledge, etc.
Status of use: This association class illustrates, whether a business application supports aspecific business capability.
84 © Technische Universität München, sebis, 2015. All rights reserved.
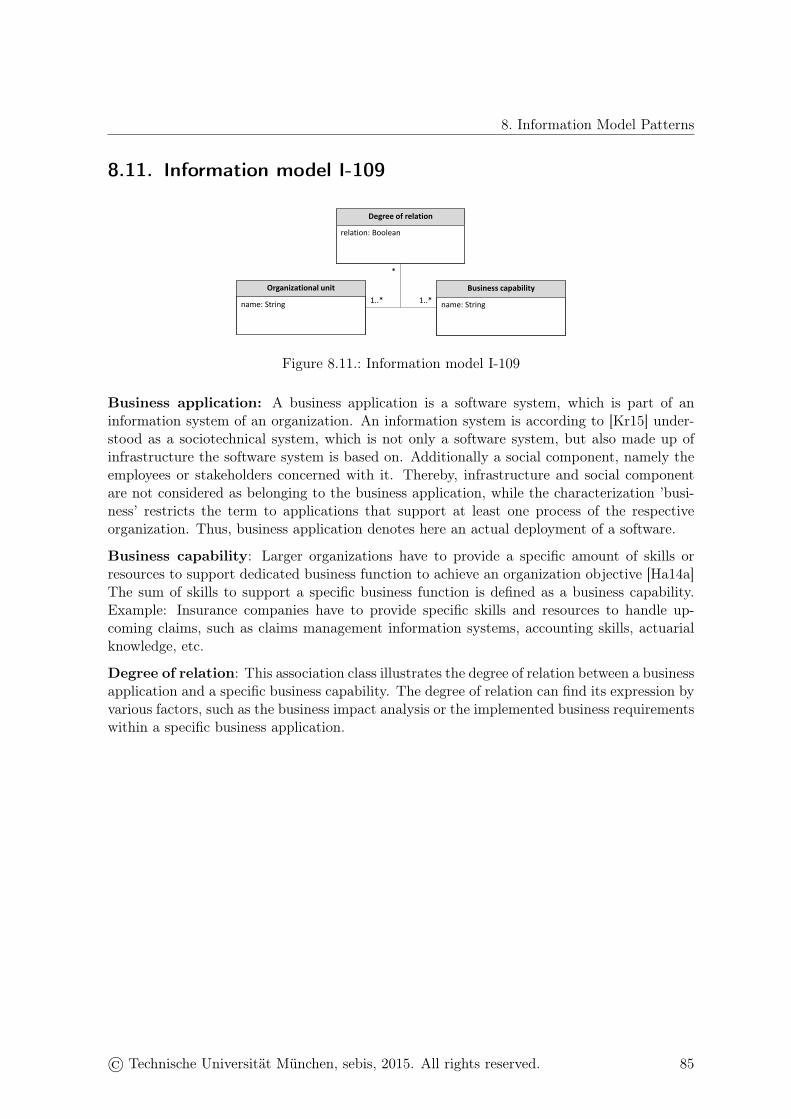
8. Information Model Patterns
8.11. Information model I-109
Organizational unit1..*name: String
Degree of relation
relation: Boolean
Business capability1..*
name: String
*
Figure 8.11.: Information model I-109
Business application: A business application is a software system, which is part of aninformation system of an organization. An information system is according to [Kr15] under-stood as a sociotechnical system, which is not only a software system, but also made up ofinfrastructure the software system is based on. Additionally a social component, namely theemployees or stakeholders concerned with it. Thereby, infrastructure and social componentare not considered as belonging to the business application, while the characterization ’busi-ness’ restricts the term to applications that support at least one process of the respectiveorganization. Thus, business application denotes here an actual deployment of a software.
Business capability: Larger organizations have to provide a specific amount of skills orresources to support dedicated business function to achieve an organization objective [Ha14a]The sum of skills to support a specific business function is defined as a business capability.Example: Insurance companies have to provide specific skills and resources to handle up-coming claims, such as claims management information systems, accounting skills, actuarialknowledge, etc.
Degree of relation: This association class illustrates the degree of relation between a businessapplication and a specific business capability. The degree of relation can find its expression byvarious factors, such as the business impact analysis or the implemented business requirementswithin a specific business application.
© Technische Universität München, sebis, 2015. All rights reserved. 85

8. Information Model Patterns
8.12. Information model I-110
Organizational unit1..*name: String
Regulatory issues
amountIssues: Integer
Business capability1..*
name: String
*
Figure 8.12.: Information model I-110
Business application: A business application is a software system, which is part of aninformation system of an organization. An information system is according to [Kr15] under-stood as a sociotechnical system, which is not only a software system, but also made up ofinfrastructure the software system is based on. Additionally a social component, namely theemployees or stakeholders concerned with it. Thereby, infrastructure and social componentare not considered as belonging to the business application, while the characterization ’busi-ness’ restricts the term to applications that support at least one process of the respectiveorganization. Thus, business application denotes here an actual deployment of a software.
Business capability: Larger organizations have to provide a specific amount of skills orresources to support dedicated business function to achieve an organization objective [Ha14a]The sum of skills to support a specific business function is defined as a business capability.Example: Insurance companies have to provide specific skills and resources to handle up-coming claims, such as claims management information systems, accounting skills, actuarialknowledge, etc.
Regulatory issues: This association class illustrates the amount of regulatory issues of abusiness application within a specific business capability.
86 © Technische Universität München, sebis, 2015. All rights reserved.

8. Information Model Patterns
8.13. Information model I-111
Costs
cost:Double*causes
Organizational unit1name:String
Businessapplication
name:String
Businesscapability* name:String*
Support relationship
name:String
*
1
1
supports
uses supported by
1
Figure 8.13.: Information model I-111
Business application: A business application is a software system, which is part of aninformation system of an organization. An information system is according to [Kr15] under-stood as a sociotechnical system, which is not only a software system, but also made up ofinfrastructure the software system is based on. Additionally a social component, namely theemployees or stakeholders concerned with it. Thereby, infrastructure and social componentare not considered as belonging to the business application, while the characterization ’busi-ness’ restricts the term to applications that support at least one process of the respectiveorganization. Thus, business application denotes here an actual deployment of a software.
Organizational unit: An organizational unit represents a subdivision of the organizationaccording to its internal structure, whereas the organization can be organized in geographicalsubsidiaries, core business process steps, etc.
Business capability: Larger organizations have to provide a specific amount of skills orresources to support dedicated business function to achieve an organization objective [Ha14a]The sum of skills to support a specific business function is defined as a business capability.Example: Insurance companies have to provide specific skills and resources to handle up-coming claims, such as claims management information systems, accounting skills, actuarialknowledge, etc.
Costs: A business application causes various costs, such as operating, maintenance, changemanagement or problem ticket solving costs. Every cost is modeled in one instance of a costclass.
Support relationship: Represents the support of a business application in a business capa-bility at a specific organizational unit. Basically, it constitutes, together with its three associ-ations, a ternary relationship between business application, organizational unit, and businesscapability. This is necessary in order to be able to tell exactly which business capability issupported by which business application for which organizational unit.
© Technische Universität München, sebis, 2015. All rights reserved. 87
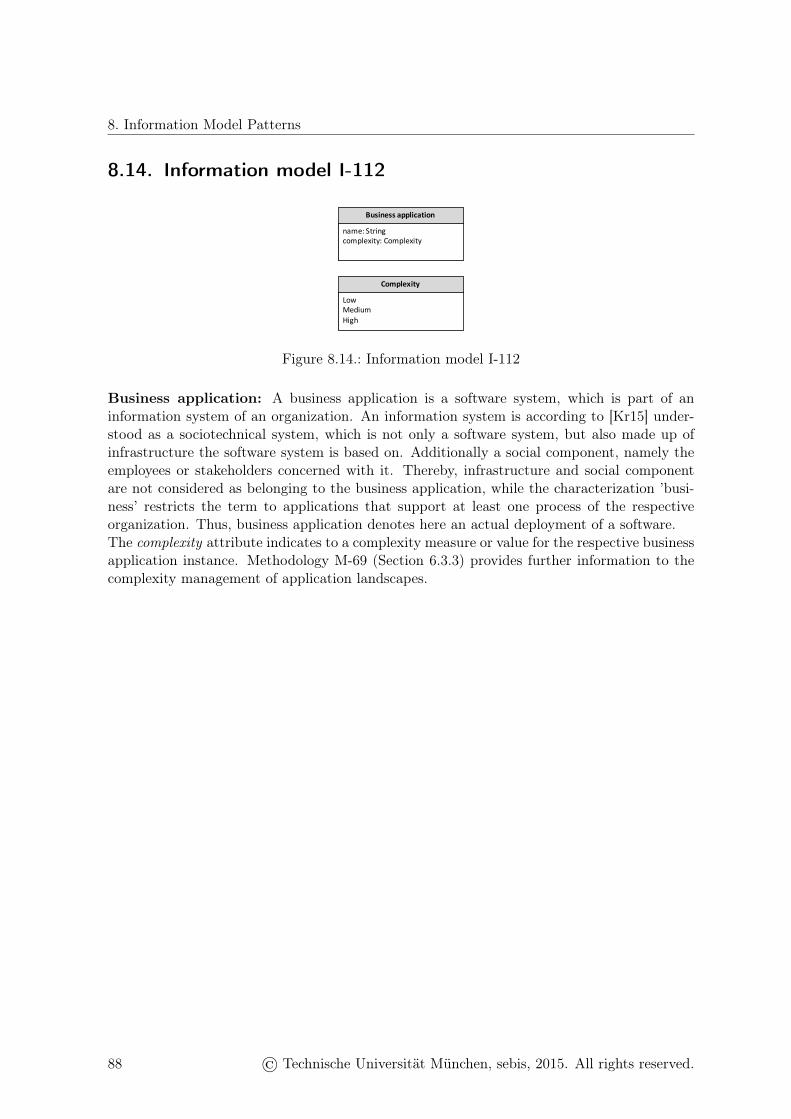
8. Information Model Patterns
8.14. Information model I-112
Businessapplication
name:Stringcomplexity:Complexity
Complexity
LowMediumHigh
Figure 8.14.: Information model I-112
Business application: A business application is a software system, which is part of aninformation system of an organization. An information system is according to [Kr15] under-stood as a sociotechnical system, which is not only a software system, but also made up ofinfrastructure the software system is based on. Additionally a social component, namely theemployees or stakeholders concerned with it. Thereby, infrastructure and social componentare not considered as belonging to the business application, while the characterization ’busi-ness’ restricts the term to applications that support at least one process of the respectiveorganization. Thus, business application denotes here an actual deployment of a software.The complexity attribute indicates to a complexity measure or value for the respective businessapplication instance. Methodology M-69 (Section 6.3.3) provides further information to thecomplexity management of application landscapes.
88 © Technische Universität München, sebis, 2015. All rights reserved.
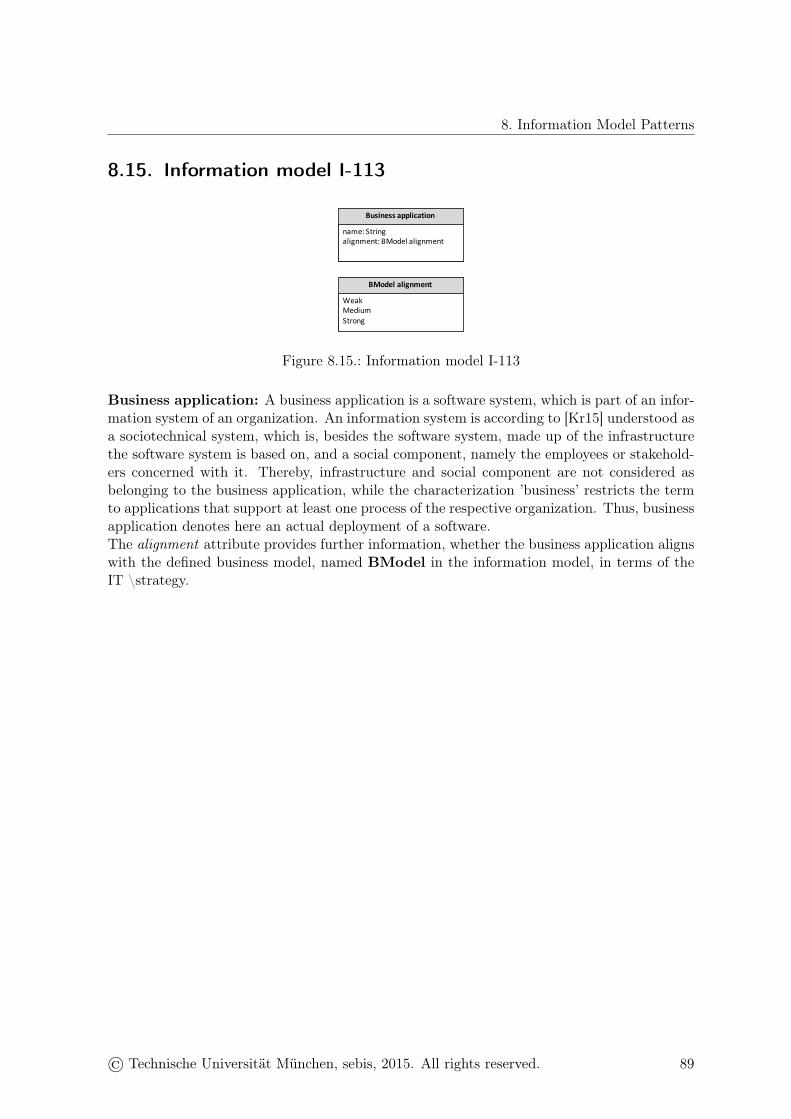
8. Information Model Patterns
8.15. Information model I-113
Businessapplication
name:Stringalignment:BModel alignment
BModelalignment
WeakMediumStrong
Figure 8.15.: Information model I-113
Business application: A business application is a software system, which is part of an infor-mation system of an organization. An information system is according to [Kr15] understood asa sociotechnical system, which is, besides the software system, made up of the infrastructurethe software system is based on, and a social component, namely the employees or stakehold-ers concerned with it. Thereby, infrastructure and social component are not considered asbelonging to the business application, while the characterization ’business’ restricts the termto applications that support at least one process of the respective organization. Thus, businessapplication denotes here an actual deployment of a software.The alignment attribute provides further information, whether the business application alignswith the defined business model, named BModel in the information model, in terms of theIT \strategy.
© Technische Universität München, sebis, 2015. All rights reserved. 89

8. Information Model Patterns
8.16. Information model I-114
Businessapplication
name:StringconsolidationCandidate:BooleanconsolidationPriority:Integer
Figure 8.16.: Information model I-114
Business application: A business application is a software system, which is part of aninformation system of an organization. An information system is according to [Kr15] under-stood as a sociotechnical system, which is not only a software system, but also made up ofinfrastructure the software system is based on. Additionally a social component, namely theemployees or stakeholders concerned with it. Thereby, infrastructure and social componentare not considered as belonging to the business application, while the characterization ’busi-ness’ restricts the term to applications that support at least one process of the respectiveorganization. Thus, business application denotes here an actual deployment of a software.The consolidationCandidate attribute indicates, whether the business application can be con-solidated with a further business application.The ConsolidationPriority attribute refers to the priority of the plannend consolidation activ-ities for the specific business application.
90 © Technische Universität München, sebis, 2015. All rights reserved.
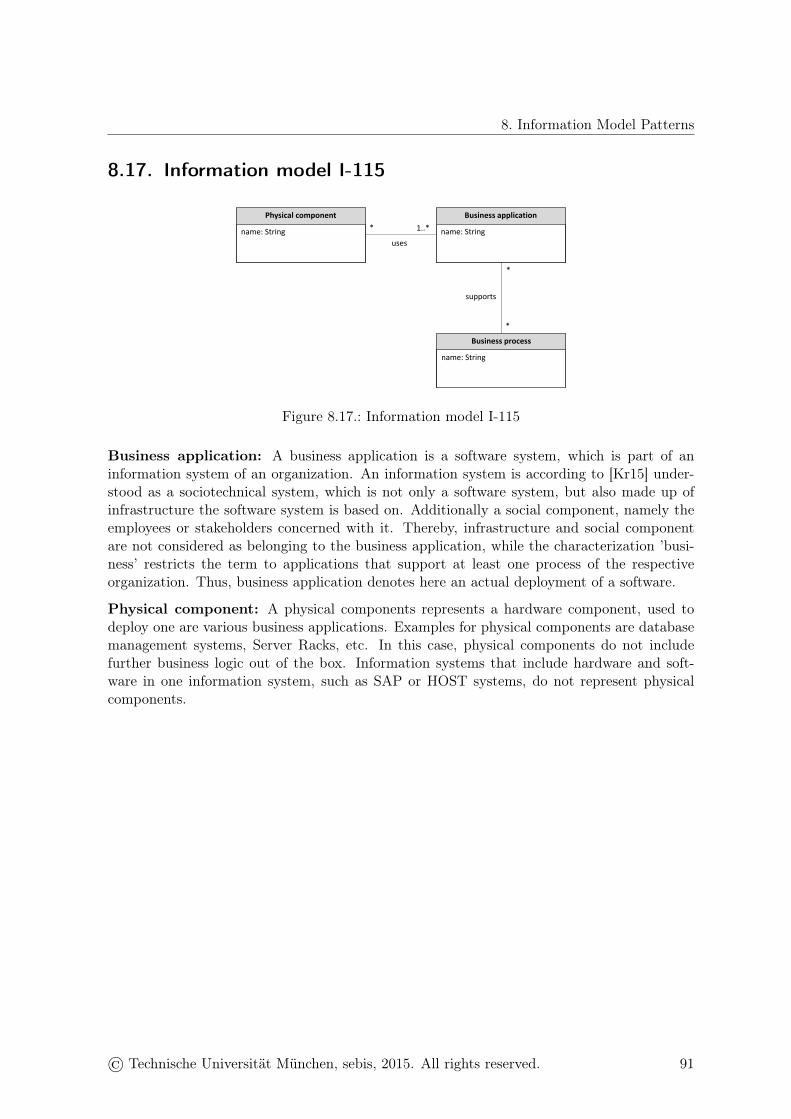
8. Information Model Patterns
8.17. Information model I-115
Physical component Business application
* 1..*name: String name: String
Business process
*
name: String
*
uses
supports
Figure 8.17.: Information model I-115
Business application: A business application is a software system, which is part of aninformation system of an organization. An information system is according to [Kr15] under-stood as a sociotechnical system, which is not only a software system, but also made up ofinfrastructure the software system is based on. Additionally a social component, namely theemployees or stakeholders concerned with it. Thereby, infrastructure and social componentare not considered as belonging to the business application, while the characterization ’busi-ness’ restricts the term to applications that support at least one process of the respectiveorganization. Thus, business application denotes here an actual deployment of a software.
Physical component: A physical components represents a hardware component, used todeploy one are various business applications. Examples for physical components are databasemanagement systems, Server Racks, etc. In this case, physical components do not includefurther business logic out of the box. Information systems that include hardware and soft-ware in one information system, such as SAP or HOST systems, do not represent physicalcomponents.
© Technische Universität München, sebis, 2015. All rights reserved. 91

8. Information Model Patterns
8.18. Information model I-116
Physical component Business application
* 1..*name: Stringconsolidation candidate: Boolean
name: Stringconsolidation candidate: Boolean
Business process
*
name: String
*
uses
supports
Figure 8.18.: Information model I-116
Business application: A business application is a software system, which is part of aninformation system of an organization. An information system is according to [Kr15] under-stood as a sociotechnical system, which is not only a software system, but also made up ofinfrastructure the software system is based on. Additionally a social component, namely theemployees or stakeholders concerned with it. Thereby, infrastructure and social componentare not considered as belonging to the business application, while the characterization ’busi-ness’ restricts the term to applications that support at least one process of the respectiveorganization. Thus, business application denotes here an actual deployment of a software.The consolidation candidate attribute indicates, whether the business application instancemight be consolidates with one ore various business application.
Physical component: A physical components represents a hardware component, used todeploy one are various business applications. Examples for physical components are databasemanagement systems, Server Racks, etc. In this case, physical components do not includefurther business logic out of the box. Information systems that include hardware and soft-ware in one information system, such as SAP or HOST systems, do not represent physicalcomponents.
Business process: According to [Kr15] , defined as a sequence of logical individual functionswith connections between them. [DFH03] states in- and output factors and a defined processobjective as important characteristics of a business process. The business process should notbe identified with single process steps or individual functions, but with high-level processes ata level similar to the one used in value chains.
92 © Technische Universität München, sebis, 2015. All rights reserved.

8. Information Model Patterns
8.19. Information model I-117
Physical component Business application
* 1..*name: Stringcorrespond to standard: Boolean
name: Stringcorrespond to standard: Boolean
Business process
*
name: String
*
uses
supports
Figure 8.19.: Information model I-117
Business application: A business application is a software system, which is part of aninformation system of an organization. An information system is according to [Kr15] under-stood as a sociotechnical system, which is not only a software system, but also made up ofinfrastructure the software system is based on. Additionally a social component, namely theemployees or stakeholders concerned with it. Thereby, infrastructure and social componentare not considered as belonging to the business application, while the characterization ’busi-ness’ restricts the term to applications that support at least one process of the respectiveorganization. Thus, business application denotes here an actual deployment of a software.
The correspond to standard attribute provide further information, whether the business ap-plication in terms of used technology, programming language, or implemented solution corre-sponds to the defined IT standard of the organization.
Physical component: A physical components represents a hardware component, used todeploy one are various business applications. Examples for physical components are databasemanagement systems, Server Racks, etc. In this case, physical components do not includefurther business logic out of the box. Information systems that include hardware and soft-ware in one information system, such as SAP or HOST systems, do not represent physicalcomponents.
Business process: According to [Kr15], business processes are defined as a sequence oflogical individual functions with connections between them. [DFH03] states in- and outputfactors and a defined process objective as important characteristics of a business process. Thebusiness process should not be identified with single process steps or individual functions, butwith high-level processes at a level similar to the one used in value chains.
© Technische Universität München, sebis, 2015. All rights reserved. 93

8. Information Model Patterns
8.20. Information model I-118
Business Application
name: String
Business capability
* name: String* supports
Figure 8.20.: Information model I-118
Business application: A business application is a software system, which is part of aninformation system of an organization. An information system is according to [Kr15] under-stood as a sociotechnical system, which is not only a software system, but also made up ofinfrastructure the software system is based on. Additionally a social component, namely theemployees or stakeholders concerned with it. Thereby, infrastructure and social componentare not considered as belonging to the business application, while the characterization ’busi-ness’ restricts the term to applications that support at least one process of the respectiveorganization. Thus, business application denotes here an actual deployment of a software.
Business capability: Larger organizations have to provide a specific amount of skills orresources to support dedicated business function to achieve an organization objective [Ha14a]The sum of skills to support a specific business function is defined as a business capability.Example: Insurance companies have to provide specific skills and resources to handle up-coming claims, such as claims management information systems, accounting skills, actuarialknowledge, etc.
94 © Technische Universität München, sebis, 2015. All rights reserved.
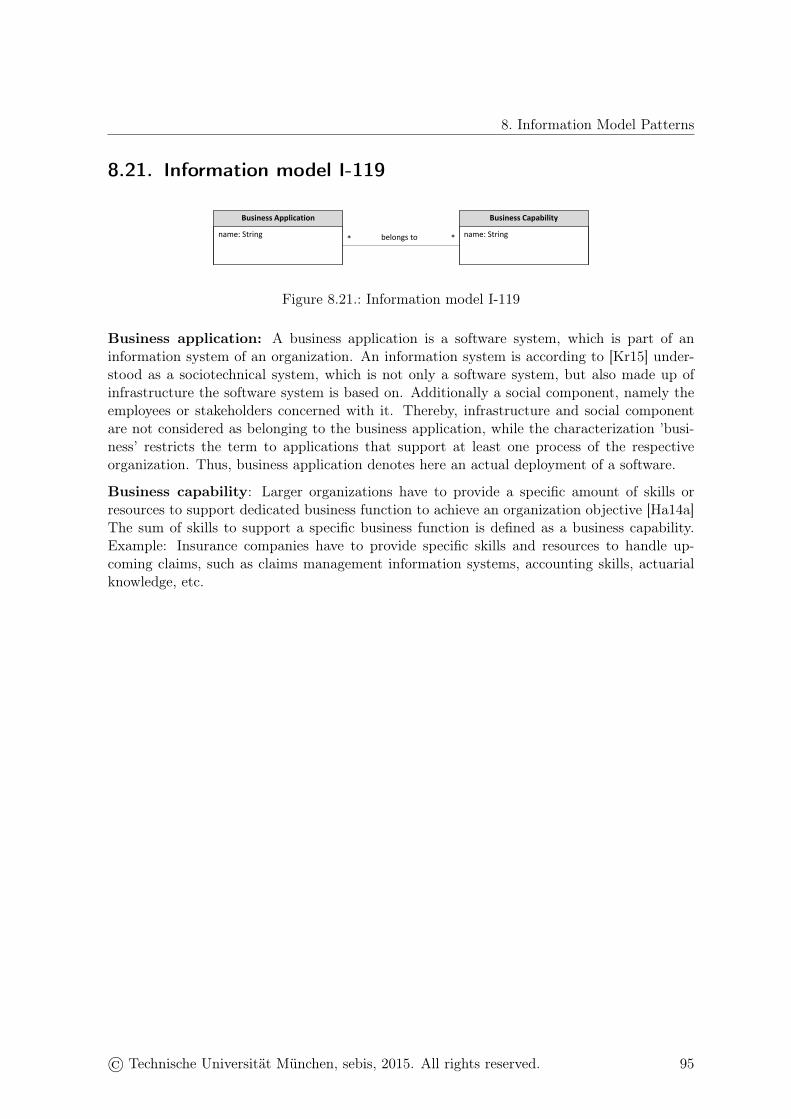
8. Information Model Patterns
8.21. Information model I-119
Business Application
name: String
Business Capability
* name: String* belongs to
Figure 8.21.: Information model I-119
Business application: A business application is a software system, which is part of aninformation system of an organization. An information system is according to [Kr15] under-stood as a sociotechnical system, which is not only a software system, but also made up ofinfrastructure the software system is based on. Additionally a social component, namely theemployees or stakeholders concerned with it. Thereby, infrastructure and social componentare not considered as belonging to the business application, while the characterization ’busi-ness’ restricts the term to applications that support at least one process of the respectiveorganization. Thus, business application denotes here an actual deployment of a software.
Business capability: Larger organizations have to provide a specific amount of skills orresources to support dedicated business function to achieve an organization objective [Ha14a]The sum of skills to support a specific business function is defined as a business capability.Example: Insurance companies have to provide specific skills and resources to handle up-coming claims, such as claims management information systems, accounting skills, actuarialknowledge, etc.
© Technische Universität München, sebis, 2015. All rights reserved. 95
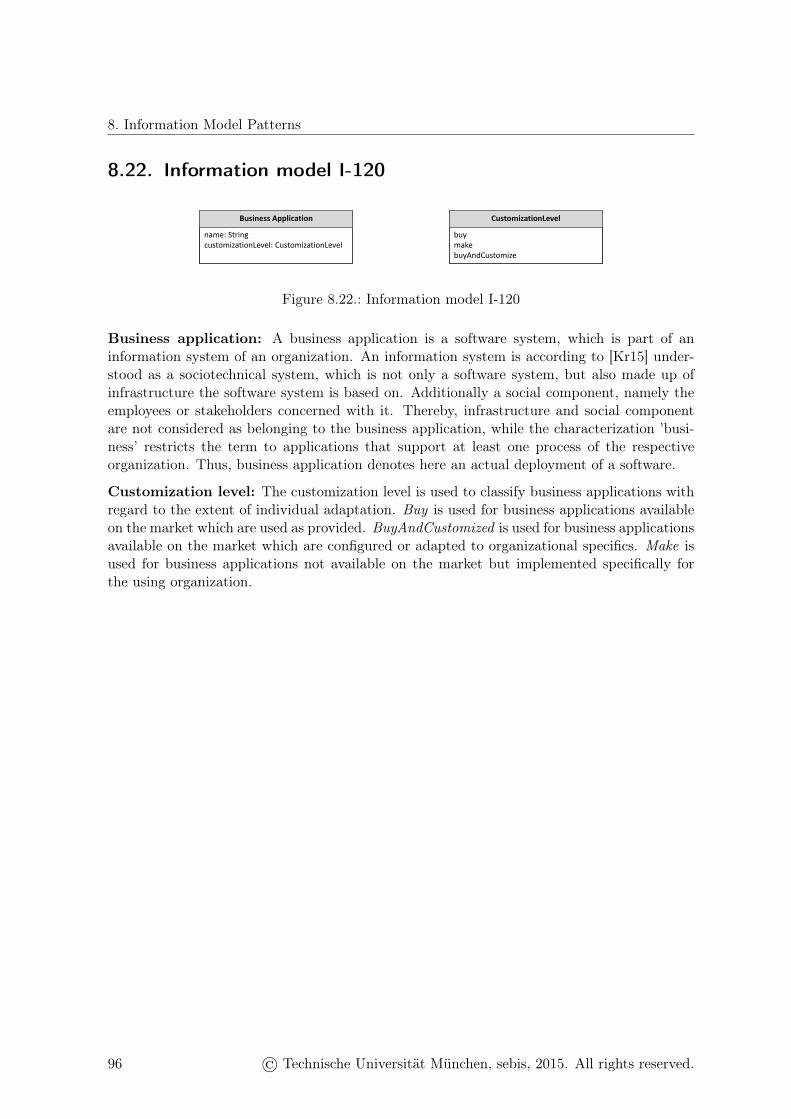
8. Information Model Patterns
8.22. Information model I-120
Business Application
name: StringcustomizationLevel: CustomizationLevel
CustomizationLevel
buymakebuyAndCustomize
Figure 8.22.: Information model I-120
Business application: A business application is a software system, which is part of aninformation system of an organization. An information system is according to [Kr15] under-stood as a sociotechnical system, which is not only a software system, but also made up ofinfrastructure the software system is based on. Additionally a social component, namely theemployees or stakeholders concerned with it. Thereby, infrastructure and social componentare not considered as belonging to the business application, while the characterization ’busi-ness’ restricts the term to applications that support at least one process of the respectiveorganization. Thus, business application denotes here an actual deployment of a software.
Customization level: The customization level is used to classify business applications withregard to the extent of individual adaptation. Buy is used for business applications availableon the market which are used as provided. BuyAndCustomized is used for business applicationsavailable on the market which are configured or adapted to organizational specifics. Make isused for business applications not available on the market but implemented specifically forthe using organization.
96 © Technische Universität München, sebis, 2015. All rights reserved.
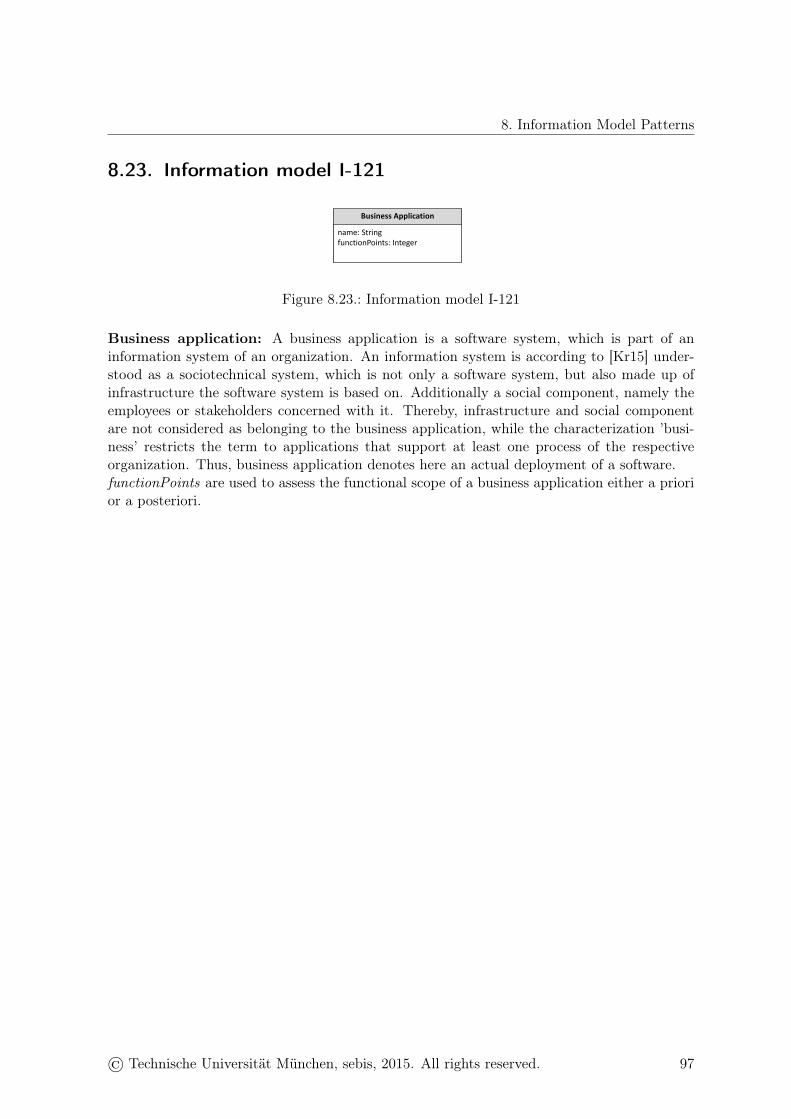
8. Information Model Patterns
8.23. Information model I-121
Business Application
name: StringfunctionPoints: Integer
Figure 8.23.: Information model I-121
Business application: A business application is a software system, which is part of aninformation system of an organization. An information system is according to [Kr15] under-stood as a sociotechnical system, which is not only a software system, but also made up ofinfrastructure the software system is based on. Additionally a social component, namely theemployees or stakeholders concerned with it. Thereby, infrastructure and social componentare not considered as belonging to the business application, while the characterization ’busi-ness’ restricts the term to applications that support at least one process of the respectiveorganization. Thus, business application denotes here an actual deployment of a software.functionPoints are used to assess the functional scope of a business application either a priorior a posteriori.
© Technische Universität München, sebis, 2015. All rights reserved. 97

98
CHAPTER 9
Data Collection Patterns
Contents9.1. Overview of data collection patterns . . . . . . . . . . . . . . . . . 1009.2. Interpretation of results . . . . . . . . . . . . . . . . . . . . . . . . 101
In this section, we provide an overview of the identified data collection (DC) patterns.
We asked the participants of the online survey, to list all classes that are maintained withintheir respective EAM model. Moreover, we asked the participants to provide further informa-tion about the listed EAM classes, such as responsibility, number of instances, data source etc.This information provided us the possibility to identify DC patterns for single EAM classes.Overall, we identified 90 DC patterns for 19 different EAM classes. A detailed list of the DCpatterns for each class is documented in A.5.
A DC pattern is valid for one concrete EAM class and provides information about the followingdimensions:
• Responsibility: Who is responsible regarding the maintenance of the EAM class?
• Data source: From what type of data source the information can be extracted?
• Data format: What type of data format is used to document the respective information?
• Refresh frequency: In which intervals the information will be refreshed?
In Section 9.1 we provide an overview of the identified DC patterns, sorted by the respectiveEAM classes. Section 9.2 includes a more detailed view on the DC patterns, separated by thecharacteristics of the single DC pattern attributes.
© Technische Universität München, sebis, 2015. All rights reserved. 99
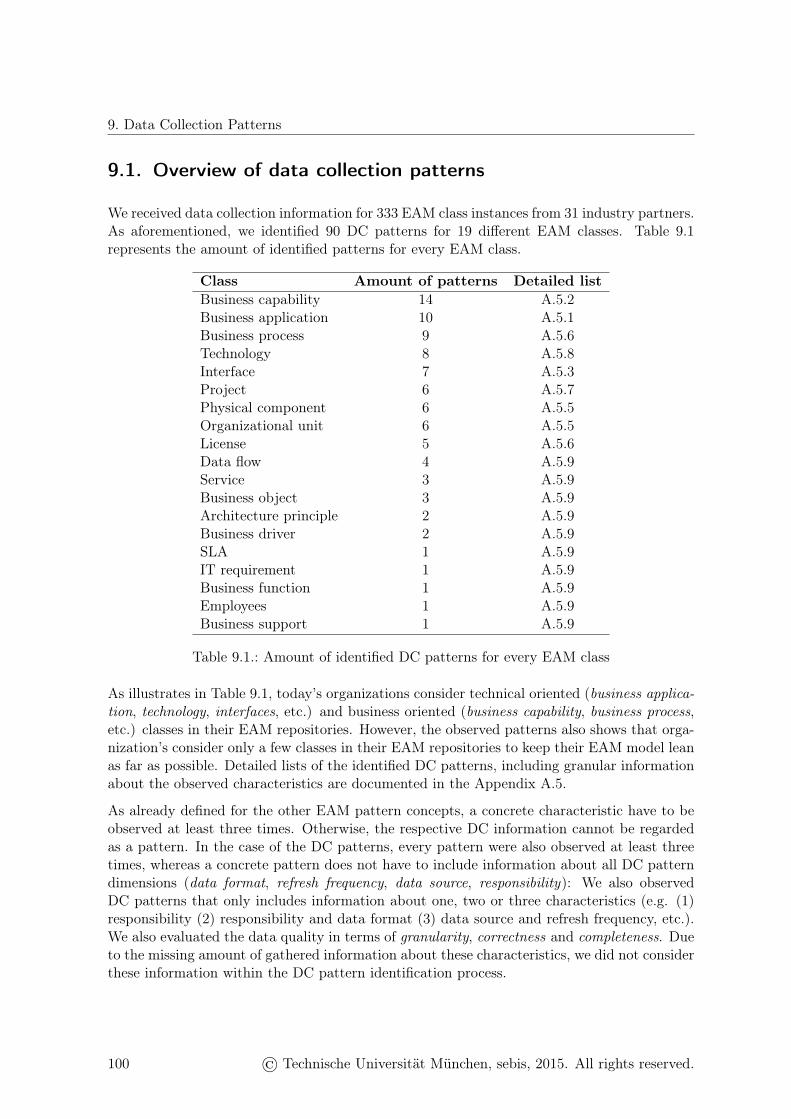
9. Data Collection Patterns
9.1. Overview of data collection patterns
We received data collection information for 333 EAM class instances from 31 industry partners.As aforementioned, we identified 90 DC patterns for 19 different EAM classes. Table 9.1represents the amount of identified patterns for every EAM class.
Class Amount of patterns Detailed listBusiness capability 14 A.5.2Business application 10 A.5.1Business process 9 A.5.6Technology 8 A.5.8Interface 7 A.5.3Project 6 A.5.7Physical component 6 A.5.5Organizational unit 6 A.5.5License 5 A.5.6Data flow 4 A.5.9Service 3 A.5.9Business object 3 A.5.9Architecture principle 2 A.5.9Business driver 2 A.5.9SLA 1 A.5.9IT requirement 1 A.5.9Business function 1 A.5.9Employees 1 A.5.9Business support 1 A.5.9
Table 9.1.: Amount of identified DC patterns for every EAM class
As illustrates in Table 9.1, today’s organizations consider technical oriented (business applica-tion, technology, interfaces, etc.) and business oriented (business capability, business process,etc.) classes in their EAM repositories. However, the observed patterns also shows that orga-nization’s consider only a few classes in their EAM repositories to keep their EAM model leanas far as possible. Detailed lists of the identified DC patterns, including granular informationabout the observed characteristics are documented in the Appendix A.5.
As already defined for the other EAM pattern concepts, a concrete characteristic have to beobserved at least three times. Otherwise, the respective DC information cannot be regardedas a pattern. In the case of the DC patterns, every pattern were also observed at least threetimes, whereas a concrete pattern does not have to include information about all DC patterndimensions (data format, refresh frequency, data source, responsibility): We also observedDC patterns that only includes information about one, two or three characteristics (e.g. (1)responsibility (2) responsibility and data format (3) data source and refresh frequency, etc.).We also evaluated the data quality in terms of granularity, correctness and completeness. Dueto the missing amount of gathered information about these characteristics, we did not considerthese information within the DC pattern identification process.
100 © Technische Universität München, sebis, 2015. All rights reserved.

9. Data Collection Patterns
9.2. Interpretation of results
The participants had the opportunity to provide information for predefined EAM classeswithin the online survey or to define further EAM classes that were not listed in Excel sheet.Moreover, the participants were asked to provide concrete information regarding the dataformat, refresh frequency, data source and the responsible person of the selected EAM class.In this case, we also provide predefined alternatives, gathered from the preliminary study andpast research projects. Figure 9.1 illustrate the distribution of the stated characteristics forevery DC pattern dimension.
2
10
1 1 1 12
5
1
3 34
56
16
1 1
34
6
8
23
0
5
10
15
20
25
Rela
tiona
l DB
CSV
(Exc
el)
EAM
repo
sitor
y
Activ
e Di
rect
ory
Vario
us st
akeh
olde
rs
PPM
MS
Offi
ce, V
isio
CMDB
Proj
ect m
anag
er IT
Busin
ess a
naly
st
Appl
icatio
n ow
ner
Busin
ess /
Prc
oces
s arc
hite
ct
Tech
nica
l arc
hite
ct*
Dom
ain
/ Sol
utio
n ar
chite
ct
Ente
rpris
e ar
chite
ct
Mon
thly
One
-Tim
e De
finiti
on
Qua
rter
ly
Daily
Year
ly
Even
t-driv
en
On
dem
and
Data format Data source Maintained by Refresh frequency
Figure 9.1.: Distribution of stated characteristics of the observed DC patterns for each DCpattern dimension
The results of the DC pattern evaluation show the same findings, already represented by[Ro13]: EAM information are mostly documented on demand and in Excel format. The en-terprise architect is the role mentioned most often as being in charge for maintenance activitiesand documenting EAM information originating from the CMDB. It turned out that the properdocumentation of the EAM still lacks a well defined and established process within today’sorganizations. However, 22 out of 36 observed DC pattern responsibilities define a deviantmaintenance responsibility than the enterprise architect. This leads to the conclusion thatEAM maintenance activities are getting distributed to respective data owners, such as thedomain / solution, technical and business / process architects.
© Technische Universität München, sebis, 2015. All rights reserved. 101

102

CHAPTER 10
Summary
© Technische Universität München, sebis, 2015. All rights reserved. 103
10. Summary
The EAMPC V2 aims to unveil best practices and patterns in the EAM domain. As anextension of the EAMPC 2008 [Bu08], the V2 release of the catalog seeks to identify newEAM best practices and patterns that have emerged after seven years. We adopted thedefined concepts of the 2008 (concerns, methodologies, information models viewpoints) butalso extended the scope of the evaluation with data collections, stakeholders, architectureprinciples, and influence factors. We identified the EAM patterns by conducting an onlinesurvey with 31 industry experts. The participants are illustrated in Appendix A.1. Moreover,we interviewed selected EA experts for additional EAM method input. The listed bullets givean overview of our key findings for each pattern concept:
• Stakeholders (12 identified patterns)
– Technical- and business related stakeholder involved in EAM activities– Upper management increasing their interest on EAM– Architectural roles still in lead
• Concerns (15 identified patterns)
– Concerns of EAMPC 2008 still relevant today– New significant concerns came up over the last seven years– IT landscape transparency related concerns have significant attention
• Methodologies (13 identified patterns)
– EAM focuses on a few dedicated methodologies– Development of KPIs to measure complexity of IT landscape illustrates a relevant
issue– Definition of business capability maps need further attraction
• Viewpoints / information models (25 identified patterns)
– Business and IT complexity related viewpoints attract increased attention– Various viewpoints rest upon few base maps– Visualization of business capabilities illustrates a new V-pattern with increased
attention
• Data collections (87 identified patterns; 43 considered for information model)
– Manual documentation activities are still common in today’s organizations– Observations show that a clear defined EAM documentation process is still missing
in today’s organizations– Patterns include mostly definitions for dedicated responsibilities
• Architecture principles (Trends illustrated in Section 6)
– Architecture principles illustrate a well defined concept in today’s organizations– Focus on organizational and less on technical related principles– Regulatory issues have an increased role in the definition of architecture principles
• Influence factors (Trends illustrated in Section 3)
– External influence factors have a stronger impact than internal factors– Regulatory issues have a major impact on the strategy definition of today’s orga-
104 © Technische Universität München, sebis, 2015. All rights reserved.
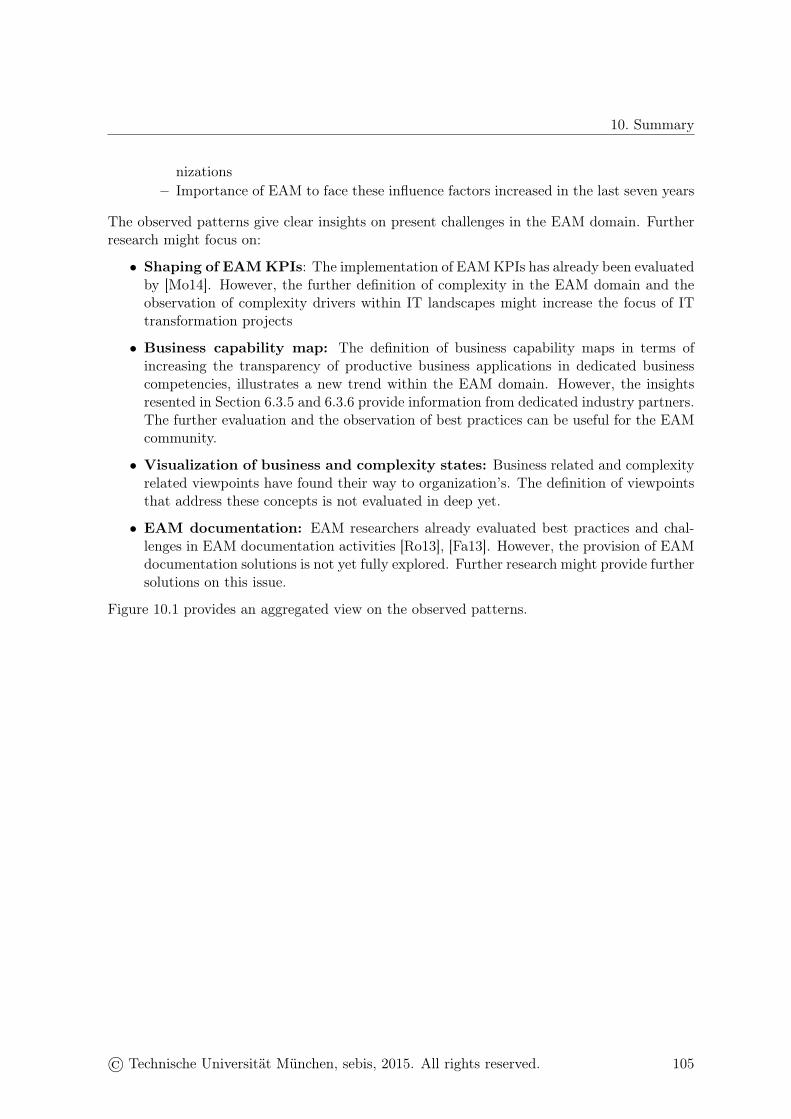
10. Summary
nizations– Importance of EAM to face these influence factors increased in the last seven years
The observed patterns give clear insights on present challenges in the EAM domain. Furtherresearch might focus on:
• Shaping of EAM KPIs: The implementation of EAM KPIs has already been evaluatedby [Mo14]. However, the further definition of complexity in the EAM domain and theobservation of complexity drivers within IT landscapes might increase the focus of ITtransformation projects
• Business capability map: The definition of business capability maps in terms ofincreasing the transparency of productive business applications in dedicated businesscompetencies, illustrates a new trend within the EAM domain. However, the insightsresented in Section 6.3.5 and 6.3.6 provide information from dedicated industry partners.The further evaluation and the observation of best practices can be useful for the EAMcommunity.
• Visualization of business and complexity states: Business related and complexityrelated viewpoints have found their way to organization’s. The definition of viewpointsthat address these concepts is not evaluated in deep yet.
• EAM documentation: EAM researchers already evaluated best practices and chal-lenges in EAM documentation activities [Ro13], [Fa13]. However, the provision of EAMdocumentation solutions is not yet fully explored. Further research might provide furthersolutions on this issue.
Figure 10.1 provides an aggregated view on the observed patterns.
© Technische Universität München, sebis, 2015. All rights reserved. 105
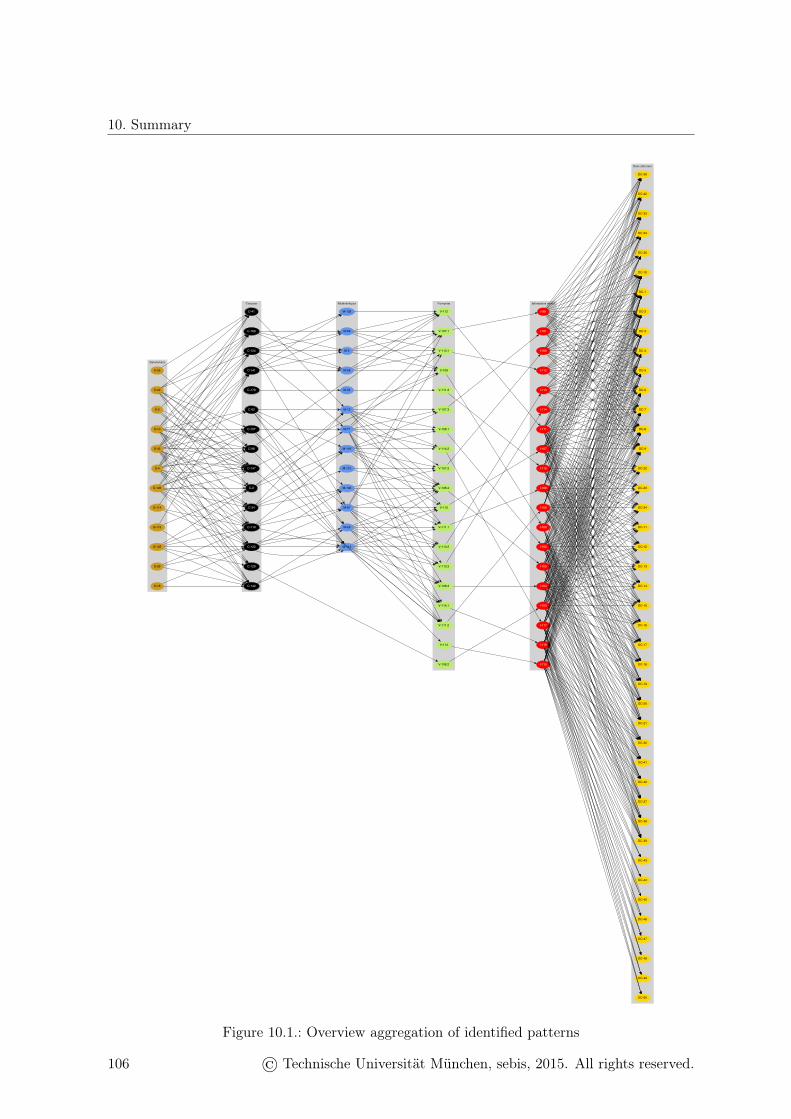
10. Summary
������������
�������� ������������� ��������� �����������������
���������������
����
�����
�����
�����
����
����
��������
�����
����
���
�����
�����
�����
�����
����
�����
���
����
���
����
�����
�����
�����
�����
���� ����
���
����
����
����
�����
����
�����
�����
�����
�������
����
�����
�����
�������
����� ����
�����
�����
�������
�������
�������
�������
�����
�������
�������
�������
�������
�������
�������
�������
�������
�������
����
�����
�����
�����
�����
�����
�����
�����
�����
�����
�����
�����
�����
�����
�����
�����
�����
�����
�����
����
����
����
����
����
����
����
����
����
�����
�����
�����
�����
�����
�����
�����
�����
�����
�����
�����
�����
�����
�����
�����
�����
�����
�����
�����
�����
�����
�����
�����
�����
�����
�����
�����
�����
�����
�����
�����
�����
�����
�����
Figure 10.1.: Overview aggregation of identified patterns
106 © Technische Universität München, sebis, 2015. All rights reserved.
Bibliography
[AGW11] Aier, S.; Gleichauf, B.; Winter, R.:. Understanding Enterprise Architecture Man-agement Design - An Empirical Analysis. In Wirtschaftsinformatik. 2011.
[BMS10] Buckl, S.; Matthes, F.; Schweda, C. M.:. Utilizing Patterns in Developing DesignTheories. In International Conference on Information Systems. 2010.
[Bu08] Buckl, S.; Ernst, A. M.; Lankes, J.; Matthes, F.:. Enterprise Architecture Man-agement Pattern Catalog 2008. Technical report. Chair for Informatics 19 (sebis),Technische Universtität München. Munich, Germany. 2008.
[Bu10] Buckl, S.; Matthes, F.; Schulz, C.; Schweda, C. M.:. Exemplifying a framework forinterrelating enterprise architecture concerns. 2010.
[Bu11] Buckl, S. M.:. Developing organization-specific enterprise architecture managementfunctions using a method base. PhD thesis. Chair for Informatics 19 (sebis), Tech-nische Universität München. Munich, Germany. 2011.
[Bu13] Buckl, S.; Matthes, F.; Schneider, A. W.; Schweda, C. M.:. Pattern-based DesignResearch–An Iterative Research Method Balancing Rigor and Relevance. In (vomBrocke, J.; Hekkala, R.; Ram, S.; Rossi, M., Ed.): Design Science at the Intersectionof Physical and Virtual Design. pages 73–87. Springer. Berlin, Heidelberg. 2013.
[DFH03] Disterer, G.; Fels, F.; Hausotter, A.:. Taschenbuch der Wirtschaftsinformatik. CarlHanser Verlag. 2003.
[Er10] Ernst, A.:. A Pattern-based Approach to Enterprise Architecture Management. PhDthesis. Technische Universität München. Munich, Germany. 2010.
[Fa13] Farwick, M.; Breu, R.; Hauder, M.; Roth, S.; Matthes, F.:. Enterprise architec-ture documentation: Empirical analysis of information sources for automation. InHawaii International Conference on System Sciences. pages 3868–3877. Hawaii,USA. 2013.
[GP11] Greefhorst, D.; Proper, E.:. Architecture Principles: The Cornerstones of Enter-
© Technische Universität München, sebis, 2015. All rights reserved. 107

Bibliography
prise Architecture. Springer. Berlin, Heidelberg, Germany. 2011.
[Ha13a] Hanschke, I.:. Enterprise Architecture Management - einfach und effektiv: Einpraktischer Leitfaden für die Einführung von EAM. Carl Hanser Verlag. 2013.
[Ha13b] Hanschke, I.:. Strategisches Management der IT-Landschaft: ein praktischer Leit-faden für das Enterprise-architecture-Management. Carl Hanser Verlag. 2013.
[Ha13c] Hauder, M.; Roth, S.; Schulz, C.; Matthes, F.:. An Examination Of OrganizationalFactors Influencing Enterprise Architecture Management Challenges. In EuropeanConference on Information Systems. Utrecht, Netherland. 2013.
[Ha14a] Hanschke, I.:. Lean IT-Management – einfach und effektiv: Der Erfolgsfaktor fürein wirksames IT-Management. Carl Hanser Verlag. 2014.
[Ha14b] Hanschke, I.:. Lean IT-Management – einfach und effektiv: Der Erfolgsfaktor fürein wirksames IT-Management. Carl Hanser Verlag. 2014.
[Ha16] Hauder, M.:. Empowering End-Users to Collaboratively Structure Knowledge-Intensive Processes. PhD thesis. Chair for Informatics 19 (sebis), Technical Uni-versity Munich. Munich, Germany 2016.
[He04] Hevner, A. R.; March, S. T.; Park, J.; Ram, S.:. Design science in informationsystems research. MIS Quarterly. 28(1):75–105. 2004.
[Int07] International Organization for Standardization. ISO/IEC 42010:2007 systemsand software engineering – recommended practice for architectural description ofsoftware-intensive systems. 2007.
[Kr15] Krcmar, H.:. Informationsmanagement. Springer. 2015.
[LKL10] Lucke, C.; Krell, S.; Lechner, U.:. Critical Issues in Enterprise Architecting - ALiterature Review. In American Conference on Information Systems. Lima, Peru.2010.
[LPJ09] Lankhorst, M. M.; Proper, H. A.; Jonkers, H.:. The architecture of the archimatelanguage. In Enterprise, Business-Process and Information Systems Modeling. pages367–380. Springer. 2009.
[LW04] Langenberg, K.; Wegmann, A.:. Enterprise Architecture: What Aspects is CurrentResearch Targeting? Technical report. EPFL Switzerland. 2004.
[Ma] Matthes, F.:. ht tp s: // ww wm at th es .i n. tu m. de /p ag es /6b ml 8r lx hx 4k /SyC aS to re . Chair for Informatics 19 (sebis), Technische Universität München.
[Mo09] Mocker, M.:. What is Complex about 273 Applications? Untangling ApplicationArchitecture Complexity in a case of European Investment Banking. In HawaiiInternational Conference on System Sciences. Hawaii, USA. 2009.
[Mo14] Monahov, I.; Schneider, A. W.; Schulz, C.; Schätzlein, M.:. EAM KPI Kata-log. Technical report. Chair for Informatics 19 (sebis), Technische UniverstitätMünchen. Munich, Germany. 2014.
[Ni09] Nightingale, D.:. Principles of enterprise systems. In International Symposium onEngineering Systems. Massachusetts, USA. 2009.
108 © Technische Universität München, sebis, 2015. All rights reserved.
Bibliography
[Re11] Reinhard, B.:. Business Capability Management - Gezielte Ausrichtung der Arte-fakte einer Unternehmensarchitektur. www.generate-value.de. 2011.
[Ro03] Ross, J. W.:. Creating a strategic IT Architecture Compentency: Learning in Stages.MIS Quarterly Executive. 2(1). 2003.
[Ro13] Roth, S.; Hauder, M.; Farwick, M.; Breu, R.; Matthes, F.:. Enterprise ArchitectureDocumentation: Current Practices and Future Directions. In Wirtschaftsinformatik.page 58. 2013.
[RZM14] Roth, S.; Zec, M.; Matthes, F.:. Enterprise Architecture Visualization Tool Survey2014. Technical report. Chair for Informatics 19 (sebis), Technische UniverstitätMünchen. Munich, Germany. 2014.
[Sc15] Schneider, A. W.; Reschenhofer, T.; Schuetz, A.; Matthes, F.:. Empirical Results forApplication Landscape Complexity. In Hawaii International Conference on SystemSciences. Hawaii, USA. 2015.
[SM14] Schneider, A. W.; Matthes, F.:. Unternehmensarchitekturgestütztes Controllingzur Beherrschung der IT-Komplexität. Zeitschrift für Controlling. 26(12):694–699.2014.
[SM15] Schneider, A. W.; Matthes, F.:. Evolving the EAM Pattern Language. In EuropeanConference on Pattern Languages of Programs. Irsee, Germany. 2015.
[SWK13] Schuetz, A.; Widjaja, T.; Kaiser, J.:. Complexity in Enterprise Architectures - Con-ceptualization and Introduction of a Measure from a System Theoretic Perspective.In European Conference on Information Systems. Utrecht, Netherland. 2013.
© Technische Universität München, sebis, 2015. All rights reserved. 109

110
List of Figures
1.1. Overview on EA frameworks and the earlier version of the EAMPC based on[Er10] . . . . . . . . . . . . . . . . . . . . . . . . . . . . . . . . . . . . . . . . . 2
1.2. Fundamental concepts that are common for all EA management processes . . . 31.3. Applied research design for the development of the EAMPC V2 . . . . . . . . . 41.4. Extended language of the EAMPC with several examples . . . . . . . . . . . . 51.5. Conceptual diagram describing the extended language of the second version . . 6
2.1. Implementation of an organization-specific EA management with patterns . . . 102.2. Viewpoint V-113.3 graph . . . . . . . . . . . . . . . . . . . . . . . . . . . . . . . 12
3.1. Statistic of mentioned influence factors sorted by relevance . . . . . . . . . . . . 14
4.1. Mentioned stakeholders for concerns sorted by incidences . . . . . . . . . . . . . 184.2. Amount of mentioned concerns for every stakeholder . . . . . . . . . . . . . . . 19
5.1. Amount of mentioned concerns by industry partners sorted by relevance . . . . 225.2. Amount of allocated stakeholders by industry partners to every concern . . . . 23
6.1. Statistics of mentioned architecture principles, sorted by relevance . . . . . . . 266.2. Definition of a business capability map . . . . . . . . . . . . . . . . . . . . . . . 346.3. Gap analysis procedure of as-is EA model regarding the target EA model . . . 376.4. Enterprise strategic analysis for transformation [Ni09] . . . . . . . . . . . . . . 39
7.1. Viewpoint V-107 . . . . . . . . . . . . . . . . . . . . . . . . . . . . . . . . . . . 427.2. Viewpoint V-107.1 . . . . . . . . . . . . . . . . . . . . . . . . . . . . . . . . . . 437.3. Viewpoint V-107.1 graph . . . . . . . . . . . . . . . . . . . . . . . . . . . . . . . 437.4. Viewpoint V-107.2 . . . . . . . . . . . . . . . . . . . . . . . . . . . . . . . . . . 447.5. Viewpoint V-107.2 graph . . . . . . . . . . . . . . . . . . . . . . . . . . . . . . . 447.6. Viewpoint V-107.3 . . . . . . . . . . . . . . . . . . . . . . . . . . . . . . . . . . 457.7. Viewpoint V-107.3 graph . . . . . . . . . . . . . . . . . . . . . . . . . . . . . . . 457.8. Viewpoint V-108 . . . . . . . . . . . . . . . . . . . . . . . . . . . . . . . . . . . 46
© Technische Universität München, sebis, 2015. All rights reserved. 111
List of Figures
7.9. Viewpoint V-108.1 . . . . . . . . . . . . . . . . . . . . . . . . . . . . . . . . . . 477.10. Viewpoint V-108.1 graph . . . . . . . . . . . . . . . . . . . . . . . . . . . . . . . 477.11. Viewpoint V-108.2 . . . . . . . . . . . . . . . . . . . . . . . . . . . . . . . . . . 487.12. Viewpoint V-108.2 graph . . . . . . . . . . . . . . . . . . . . . . . . . . . . . . . 487.13. Viewpoint V-108.3 . . . . . . . . . . . . . . . . . . . . . . . . . . . . . . . . . . 497.14. Viewpoint V-108.3 Graph . . . . . . . . . . . . . . . . . . . . . . . . . . . . . . 497.15. Viewpoint V-108.4 graph . . . . . . . . . . . . . . . . . . . . . . . . . . . . . . . 507.16. Viewpoint V-109 . . . . . . . . . . . . . . . . . . . . . . . . . . . . . . . . . . . 517.17. Viewpoint V-109 graph . . . . . . . . . . . . . . . . . . . . . . . . . . . . . . . . 517.18. Viewpoint V-110 . . . . . . . . . . . . . . . . . . . . . . . . . . . . . . . . . . . 527.19. Viewpoint V-110 graph . . . . . . . . . . . . . . . . . . . . . . . . . . . . . . . . 527.20. Viewpoint V-111 . . . . . . . . . . . . . . . . . . . . . . . . . . . . . . . . . . . 537.21. Viewpoint V-111.1 . . . . . . . . . . . . . . . . . . . . . . . . . . . . . . . . . . 547.22. Viewpoint V-111.1 graph . . . . . . . . . . . . . . . . . . . . . . . . . . . . . . . 547.23. Viewpoint V-111.2 . . . . . . . . . . . . . . . . . . . . . . . . . . . . . . . . . . 557.24. Viewpoint V-111.2 graph . . . . . . . . . . . . . . . . . . . . . . . . . . . . . . . 557.25. Viewpoint V-111.3 . . . . . . . . . . . . . . . . . . . . . . . . . . . . . . . . . . 567.26. Viewpoint V-111.3 Graph . . . . . . . . . . . . . . . . . . . . . . . . . . . . . . 567.27. Viewpoint V-112 . . . . . . . . . . . . . . . . . . . . . . . . . . . . . . . . . . . 577.28. Viewpoint V-112 graph . . . . . . . . . . . . . . . . . . . . . . . . . . . . . . . . 577.29. Viewpoint V-113 . . . . . . . . . . . . . . . . . . . . . . . . . . . . . . . . . . . 587.30. Viewpoint V-113.1 . . . . . . . . . . . . . . . . . . . . . . . . . . . . . . . . . . 597.31. Viewpoint V-113.1 graph . . . . . . . . . . . . . . . . . . . . . . . . . . . . . . . 597.32. Viewpoint V-113.2 . . . . . . . . . . . . . . . . . . . . . . . . . . . . . . . . . . 607.33. Viewpoint V-113.2 graph . . . . . . . . . . . . . . . . . . . . . . . . . . . . . . . 607.34. Viewpoint V-113.3 . . . . . . . . . . . . . . . . . . . . . . . . . . . . . . . . . . 617.35. Viewpoint V-113.3 graph . . . . . . . . . . . . . . . . . . . . . . . . . . . . . . . 617.36. Viewpoint V-114 . . . . . . . . . . . . . . . . . . . . . . . . . . . . . . . . . . . 627.37. Viewpoint V-114 graph . . . . . . . . . . . . . . . . . . . . . . . . . . . . . . . . 637.38. Viewpoint V-114.1 . . . . . . . . . . . . . . . . . . . . . . . . . . . . . . . . . . 647.39. Viewpoint V-114.1 graph . . . . . . . . . . . . . . . . . . . . . . . . . . . . . . . 647.40. Viewpoint V-114.2 . . . . . . . . . . . . . . . . . . . . . . . . . . . . . . . . . . 657.41. Viewpoint V-114.2 graph . . . . . . . . . . . . . . . . . . . . . . . . . . . . . . . 657.42. Viewpoint V-115 graph . . . . . . . . . . . . . . . . . . . . . . . . . . . . . . . . 667.43. Viewpoint V-116 graph . . . . . . . . . . . . . . . . . . . . . . . . . . . . . . . . 677.44. Viewpoint V-117 graph . . . . . . . . . . . . . . . . . . . . . . . . . . . . . . . . 687.45. Viewpoint V-118 graph . . . . . . . . . . . . . . . . . . . . . . . . . . . . . . . . 697.46. Viewpoint V-119 graph . . . . . . . . . . . . . . . . . . . . . . . . . . . . . . . . 707.47. Viewpoint V-120 graph . . . . . . . . . . . . . . . . . . . . . . . . . . . . . . . . 71
8.1. Information model I-99 . . . . . . . . . . . . . . . . . . . . . . . . . . . . . . . . 748.2. Information model I-100 . . . . . . . . . . . . . . . . . . . . . . . . . . . . . . . 758.3. Information model I-101 . . . . . . . . . . . . . . . . . . . . . . . . . . . . . . . 768.4. Information model I-102 . . . . . . . . . . . . . . . . . . . . . . . . . . . . . . . 778.5. Information model I-103 . . . . . . . . . . . . . . . . . . . . . . . . . . . . . . . 788.6. Information model I-104 . . . . . . . . . . . . . . . . . . . . . . . . . . . . . . . 798.7. Information model I-105 . . . . . . . . . . . . . . . . . . . . . . . . . . . . . . . 80
112 © Technische Universität München, sebis, 2015. All rights reserved.

List of Figures
8.8. Information model I-106 . . . . . . . . . . . . . . . . . . . . . . . . . . . . . . . 818.9. Information model I-107 . . . . . . . . . . . . . . . . . . . . . . . . . . . . . . . 828.10. Information model I-108 . . . . . . . . . . . . . . . . . . . . . . . . . . . . . . . 848.11. Information model I-109 . . . . . . . . . . . . . . . . . . . . . . . . . . . . . . . 858.12. Information model I-110 . . . . . . . . . . . . . . . . . . . . . . . . . . . . . . . 868.13. Information model I-111 . . . . . . . . . . . . . . . . . . . . . . . . . . . . . . . 878.14. Information model I-112 . . . . . . . . . . . . . . . . . . . . . . . . . . . . . . . 888.15. Information model I-113 . . . . . . . . . . . . . . . . . . . . . . . . . . . . . . . 898.16. Information model I-114 . . . . . . . . . . . . . . . . . . . . . . . . . . . . . . . 908.17. Information model I-115 . . . . . . . . . . . . . . . . . . . . . . . . . . . . . . . 918.18. Information model I-116 . . . . . . . . . . . . . . . . . . . . . . . . . . . . . . . 928.19. Information model I-117 . . . . . . . . . . . . . . . . . . . . . . . . . . . . . . . 938.20. Information model I-118 . . . . . . . . . . . . . . . . . . . . . . . . . . . . . . . 948.21. Information model I-119 . . . . . . . . . . . . . . . . . . . . . . . . . . . . . . . 958.22. Information model I-120 . . . . . . . . . . . . . . . . . . . . . . . . . . . . . . . 968.23. Information model I-121 . . . . . . . . . . . . . . . . . . . . . . . . . . . . . . . 97
9.1. Distribution of stated characteristics of the observed DC patterns for each DCpattern dimension . . . . . . . . . . . . . . . . . . . . . . . . . . . . . . . . . . 101
10.1. Overview aggregation of identified patterns . . . . . . . . . . . . . . . . . . . . 106
© Technische Universität München, sebis, 2015. All rights reserved. 113

114

APPENDIX A
Appendix
© Technische Universität München, sebis, 2015. All rights reserved. 115
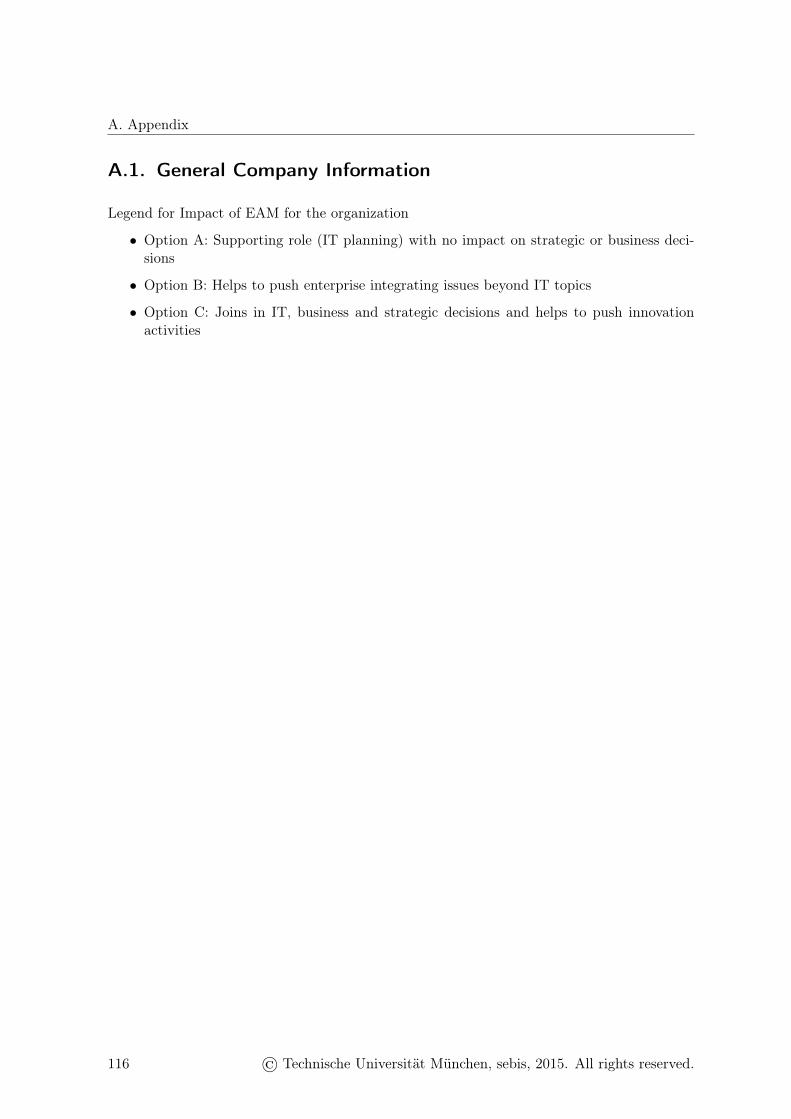
A. Appendix
A.1. General Company Information
Legend for Impact of EAM for the organization
• Option A: Supporting role (IT planning) with no impact on strategic or business deci-sions
• Option B: Helps to push enterprise integrating issues beyond IT topics
• Option C: Joins in IT, business and strategic decisions and helps to push innovationactivities
116 © Technische Universität München, sebis, 2015. All rights reserved.

A. Appendix
Org
aniz
atio
nB
ranch
Rev
enue
Em
plo
yee
Nat
ional
/In
tern
atio
nal
IT Dis
trib
uti
onR
ole
EA
MIm
pac
tEA
M
Unt
-1M
anuf
actu
ring
>5
Bil.
>10
0.00
0In
tern
atio
nal
Cen
tral
ized
Maj
orB
usin
ess
Asp
ects
Opt
ion
C
Unt
-2Fin
ance
,In
sura
nce,
Rea
lEst
ate
1B
il.-
5B
il.50
01-
10.0
00N
atio
nal
Cen
tral
ized
Mos
tof
Bus
i-ne
ssA
spec
tsO
ptio
nC
Unt
-3Fin
ance
,In
sura
nce,
Rea
lEst
ate
>5
Bil.
50.0
01-
100.
000
Inte
rnat
iona
lFe
dera
ted
Mos
tof
Bus
i-ne
ssA
spec
tsO
ptio
nC
Unt
-4IT
,Tec
hnol
ogy,
Inte
rnet
5M
il.-50
Mil.
50.0
01-
100.
000
Inte
rnat
iona
lD
ecen
tral
ized
Maj
orB
usin
ess
Asp
ects
not
spec
ified
Unt
-5C
omm
unic
atio
n,U
tilit
ies
>5
Bil.
2001
-50
00N
atio
nal
Fede
rate
dM
inor
Bus
ines
sA
spec
tsO
ptio
nA
Unt
-7IT
,Tec
hnol
ogy,
Inte
rnet
500
Mil.
-1B
il.11
-50
Inte
rnat
iona
lC
entr
aliz
edM
ajor
Bus
ines
sA
spec
tsO
ptio
nC
Unt
-8C
hem
ical
not
spec
ified
>10
0.00
0In
tern
atio
nal
Cen
tral
ized
Min
orB
usin
ess
Asp
ects
Opt
ion
A
Unt
-9Fin
ance
,In
sura
nce,
Rea
lEst
ate
5M
il.-50
Mil.
2001
-50
00In
tern
atio
nal
Fede
rate
dM
ajor
Bus
ines
sA
spec
tsO
ptio
nA
Unt
-10
Serv
ices
5M
il.-50
Mil.
>10
0.00
0In
tern
atio
nal
Cen
tral
ized
Min
orB
usin
ess
Asp
ects
Opt
ion
A
Unt
-11
IT,T
echn
olog
y,In
tern
et5
Mil.
-50
Mil.
2001
-50
00N
atio
nal
Cen
tral
ized
Maj
orB
usin
ess
Asp
ects
Opt
ion
B
Unt
-12
Man
ufac
turi
ng5
Mil.
-50
Mil.
1-10
Nat
iona
lD
ecen
tral
ized
Maj
orB
usin
ess
Asp
ects
Opt
ion
A
Unt
-13
Hea
lth
Car
eN
onpr
ofit
1001
-20
00N
atio
nal
Cen
tral
ized
Min
orB
usin
ess
Asp
ects
Opt
ion
A
Unt
-14
IT,T
echn
olog
y,In
tern
et>
5B
il.>
100.
000
Inte
rnat
iona
lFe
dera
ted
Mos
tof
Bus
i-ne
ssA
spec
tsO
ptio
nB
Unt
-15
Tra
nspo
rtat
ion
1B
il.-
5B
il.50
01-
10.0
00N
atio
nal
Cen
tral
ized
Min
orB
usin
ess
Asp
ects
Opt
ion
A
Unt
-16
Man
ufac
turi
ng1
Bil.
-5
Bil.
10.0
01-
50.0
00In
tern
atio
nal
Cen
tral
ized
Min
orB
usin
ess
Asp
ects
Opt
ion
C
Unt
-17
Tra
nspo
rtat
ion
1M
il.-
5M
il.20
01-
5000
Inte
rnat
iona
lC
entr
aliz
edM
inor
Bus
ines
sA
spec
tsO
ptio
nC
© Technische Universität München, sebis, 2015. All rights reserved. 117
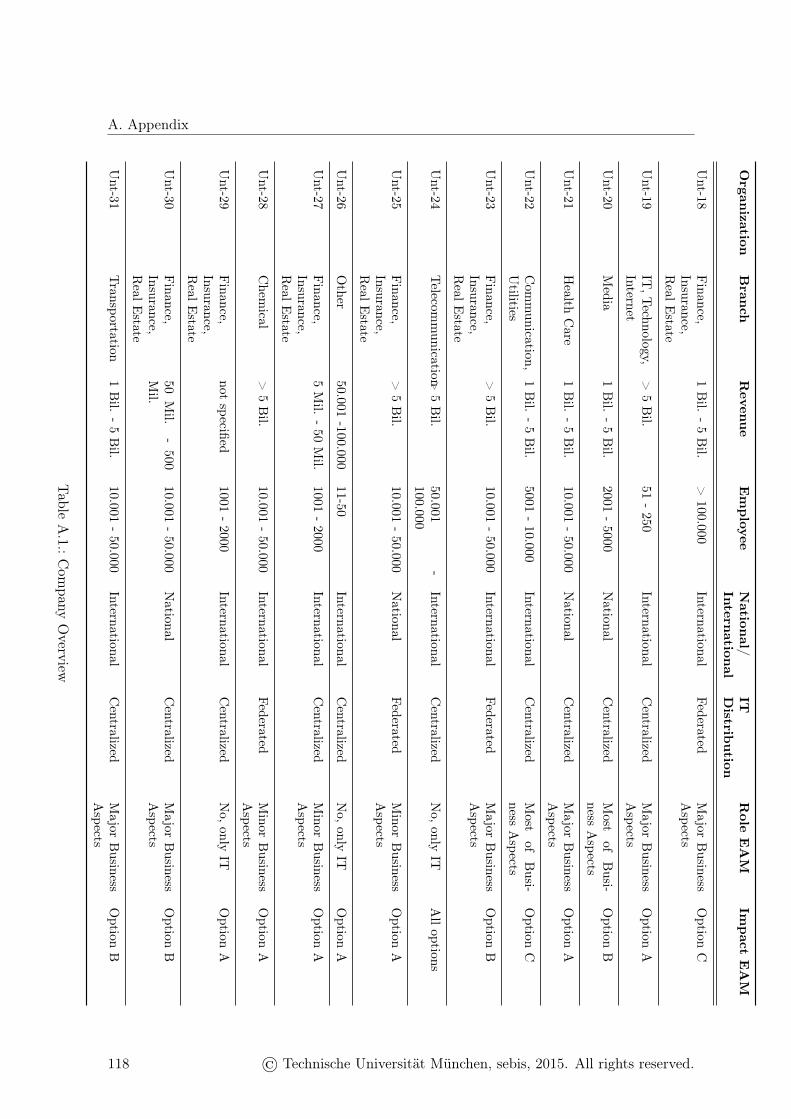
A. Appendix
Organ
izationB
ranch
Revenu
eEm
ployee
Nation
al/Intern
ational
ITDistrib
ution
Role
EA
MIm
pact
EA
M
Unt-18
Finance,
Insurance,R
ealEstate
1B
il.-
5B
il.>
100.000International
FederatedM
ajorB
usinessA
spectsO
ptionC
Unt-19
IT,T
echnology,Internet
>5
Bil.
51-
250International
Centralized
Major
Business
Aspects
Option
A
Unt-20
Media
1B
il.-
5B
il.2001
-5000
National
Centralized
Most
ofB
usi-ness
Aspects
Option
B
Unt-21
Health
Care
1B
il.-
5B
il.10.001
-50.000
National
Centralized
Major
Business
Aspects
Option
A
Unt-22
Com
munication,
Utilities
1B
il.-
5B
il.5001
-10.000
InternationalC
entralizedM
ostof
Busi-
nessA
spectsO
ptionC
Unt-23
Finance,
Insurance,R
ealEstate
>5
Bil.
10.001-
50.000International
FederatedM
ajorB
usinessA
spectsO
ptionB
Unt-24
Telecom
munication>
5B
il.50.001
-100.000
InternationalC
entralizedN
o,onlyIT
Alloptions
Unt-25
Finance,
Insurance,R
ealEstate
>5
Bil.
10.001-
50.000N
ationalFederated
Minor
Business
Aspects
Option
A
Unt-26
Other
50.001-100.000
11-50International
Centralized
No,only
ITO
ptionA
Unt-27
Finance,
Insurance,R
ealEstate
5M
il.-50
Mil.
1001-
2000International
Centralized
Minor
Business
Aspects
Option
A
Unt-28
Chem
ical>
5B
il.10.001
-50.000
InternationalFederated
Minor
Business
Aspects
Option
A
Unt-29
Finance,
Insurance,R
ealEstate
notspecified
1001-
2000International
Centralized
No,only
ITO
ptionA
Unt-30
Finance,
Insurance,R
ealEstate
50M
il.-
500M
il.10.001
-50.000
National
Centralized
Major
Business
Aspects
Option
B
Unt-31
Transportation
1B
il.-
5B
il.10.001
-50.000
InternationalC
entralizedM
ajorB
usinessA
spectsO
ptionB
Table
A.1.:C
ompany
Overview
118 © Technische Universität München, sebis, 2015. All rights reserved.
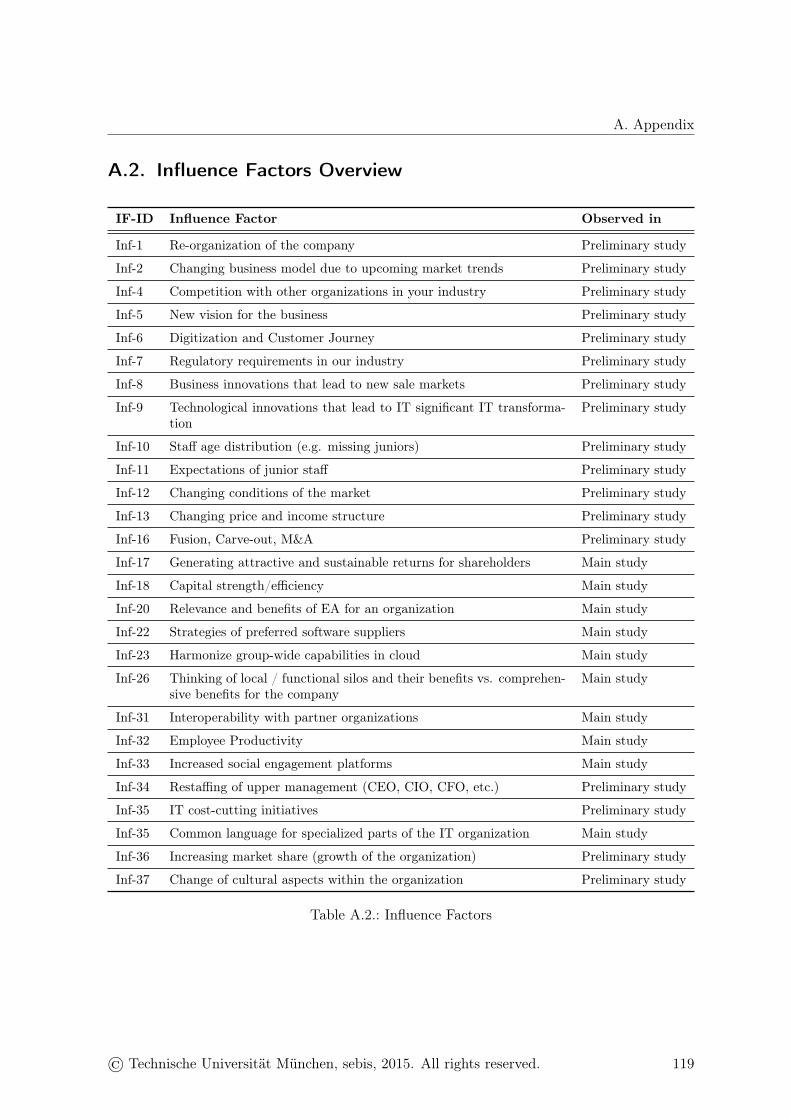
A. Appendix
A.2. Influence Factors Overview
IF-ID Influence Factor Observed in
Inf-1 Re-organization of the company Preliminary study
Inf-2 Changing business model due to upcoming market trends Preliminary study
Inf-4 Competition with other organizations in your industry Preliminary study
Inf-5 New vision for the business Preliminary study
Inf-6 Digitization and Customer Journey Preliminary study
Inf-7 Regulatory requirements in our industry Preliminary study
Inf-8 Business innovations that lead to new sale markets Preliminary study
Inf-9 Technological innovations that lead to IT significant IT transforma-tion
Preliminary study
Inf-10 Staff age distribution (e.g. missing juniors) Preliminary study
Inf-11 Expectations of junior staff Preliminary study
Inf-12 Changing conditions of the market Preliminary study
Inf-13 Changing price and income structure Preliminary study
Inf-16 Fusion, Carve-out, M&A Preliminary study
Inf-17 Generating attractive and sustainable returns for shareholders Main study
Inf-18 Capital strength/efficiency Main study
Inf-20 Relevance and benefits of EA for an organization Main study
Inf-22 Strategies of preferred software suppliers Main study
Inf-23 Harmonize group-wide capabilities in cloud Main study
Inf-26 Thinking of local / functional silos and their benefits vs. comprehen-sive benefits for the company
Main study
Inf-31 Interoperability with partner organizations Main study
Inf-32 Employee Productivity Main study
Inf-33 Increased social engagement platforms Main study
Inf-34 Restaffing of upper management (CEO, CIO, CFO, etc.) Preliminary study
Inf-35 IT cost-cutting initiatives Preliminary study
Inf-35 Common language for specialized parts of the IT organization Main study
Inf-36 Increasing market share (growth of the organization) Preliminary study
Inf-37 Change of cultural aspects within the organization Preliminary study
Table A.2.: Influence Factors
© Technische Universität München, sebis, 2015. All rights reserved. 119

A. Appendix
A.3. Stakeholders Overview
S-ID Stakeholder Observed in
S-2 Project manager IT Preliminary study
S-4 CIO Preliminary study
S-6 Process owner Preliminary study
S-10 Domain architect / Solution architect Preliminary study
S-18 Business architect / Process architect Preliminary study
S-20 Software developer Preliminary study
S-22 Technical architect (Security architect, Software architect, Infrastruc-ture architect)
Preliminary study
S-25 Portfolio manager (business or IT) Preliminary study
S-34 Internal audit / External audit / Revision Preliminary study
S-45 Enterprise architect Preliminary study
S-55 Application owner Preliminary study
S-59 Business owner Preliminary study
S-73 Business analyst Preliminary study
S-91 Controller (business or IT) Preliminary study
S-113 CFO Preliminary study
S-114 COO Preliminary study
S-116 Corporate development / Corporate governance Preliminary study
S-121 Head office Main study
S-122 IT security and compliance Main study
S-123 IT incident manager / IT service desk Main study
S-124 Head of information and integration architecture Main study
S-125 Head of department business Preliminary study
S-126 Head of department IT Preliminary study
S-127 External partner / Consultants Preliminary study
S-128 Requirements engineer Preliminary study
S-129 Project manager business Preliminary study
S-130 Data owner Preliminary study
Table A.3.: Stakeholders
120 © Technische Universität München, sebis, 2015. All rights reserved.
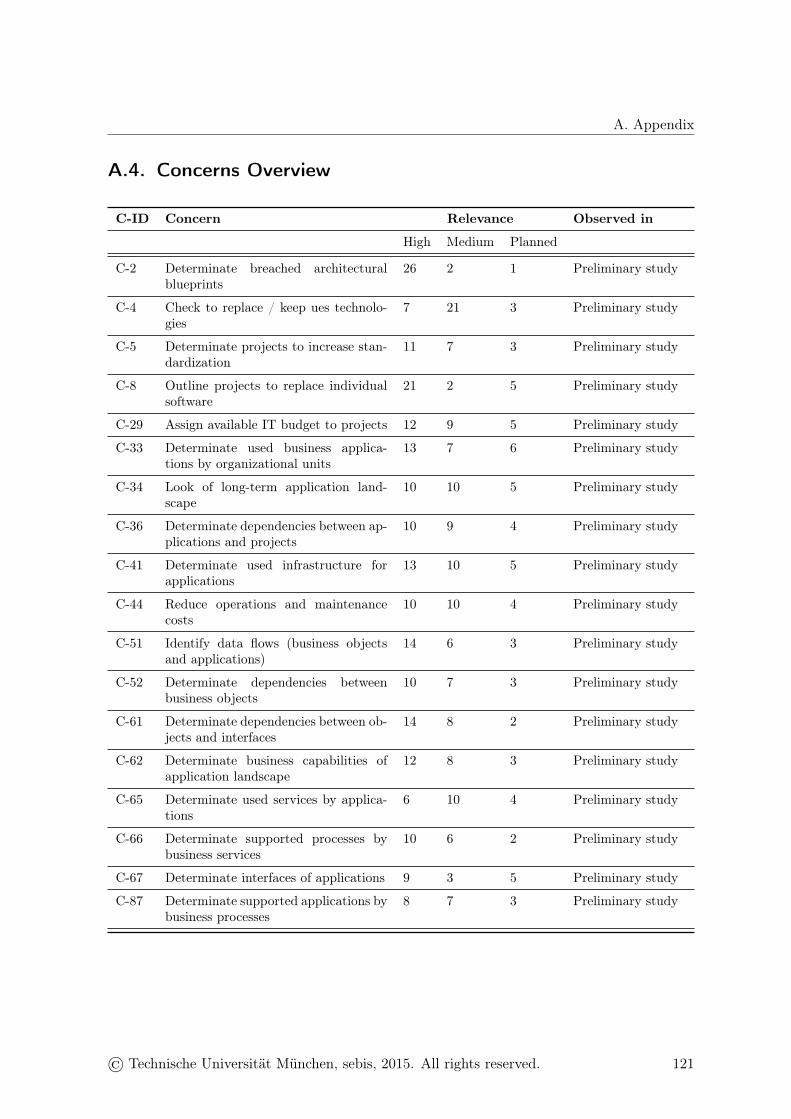
A. Appendix
A.4. Concerns Overview
C-ID Concern Relevance Observed in
High Medium Planned
C-2 Determinate breached architecturalblueprints
26 2 1 Preliminary study
C-4 Check to replace / keep ues technolo-gies
7 21 3 Preliminary study
C-5 Determinate projects to increase stan-dardization
11 7 3 Preliminary study
C-8 Outline projects to replace individualsoftware
21 2 5 Preliminary study
C-29 Assign available IT budget to projects 12 9 5 Preliminary study
C-33 Determinate used business applica-tions by organizational units
13 7 6 Preliminary study
C-34 Look of long-term application land-scape
10 10 5 Preliminary study
C-36 Determinate dependencies between ap-plications and projects
10 9 4 Preliminary study
C-41 Determinate used infrastructure forapplications
13 10 5 Preliminary study
C-44 Reduce operations and maintenancecosts
10 10 4 Preliminary study
C-51 Identify data flows (business objectsand applications)
14 6 3 Preliminary study
C-52 Determinate dependencies betweenbusiness objects
10 7 3 Preliminary study
C-61 Determinate dependencies between ob-jects and interfaces
14 8 2 Preliminary study
C-62 Determinate business capabilities ofapplication landscape
12 8 3 Preliminary study
C-65 Determinate used services by applica-tions
6 10 4 Preliminary study
C-66 Determinate supported processes bybusiness services
10 6 2 Preliminary study
C-67 Determinate interfaces of applications 9 3 5 Preliminary study
C-87 Determinate supported applications bybusiness processes
8 7 3 Preliminary study
© Technische Universität München, sebis, 2015. All rights reserved. 121
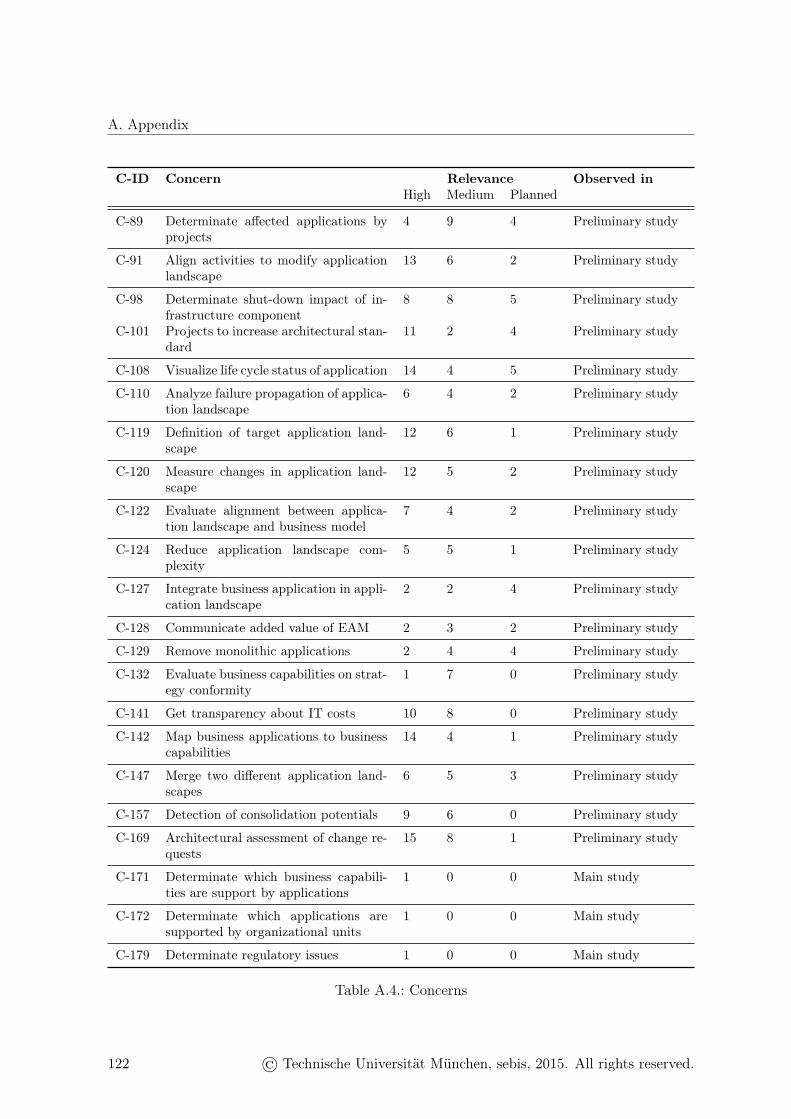
A. Appendix
C-ID Concern Relevance Observed inHigh Medium Planned
C-89 Determinate affected applications byprojects
4 9 4 Preliminary study
C-91 Align activities to modify applicationlandscape
13 6 2 Preliminary study
C-98 Determinate shut-down impact of in-frastructure component
8 8 5 Preliminary study
C-101 Projects to increase architectural stan-dard
11 2 4 Preliminary study
C-108 Visualize life cycle status of application 14 4 5 Preliminary study
C-110 Analyze failure propagation of applica-tion landscape
6 4 2 Preliminary study
C-119 Definition of target application land-scape
12 6 1 Preliminary study
C-120 Measure changes in application land-scape
12 5 2 Preliminary study
C-122 Evaluate alignment between applica-tion landscape and business model
7 4 2 Preliminary study
C-124 Reduce application landscape com-plexity
5 5 1 Preliminary study
C-127 Integrate business application in appli-cation landscape
2 2 4 Preliminary study
C-128 Communicate added value of EAM 2 3 2 Preliminary study
C-129 Remove monolithic applications 2 4 4 Preliminary study
C-132 Evaluate business capabilities on strat-egy conformity
1 7 0 Preliminary study
C-141 Get transparency about IT costs 10 8 0 Preliminary study
C-142 Map business applications to businesscapabilities
14 4 1 Preliminary study
C-147 Merge two different application land-scapes
6 5 3 Preliminary study
C-157 Detection of consolidation potentials 9 6 0 Preliminary study
C-169 Architectural assessment of change re-quests
15 8 1 Preliminary study
C-171 Determinate which business capabili-ties are support by applications
1 0 0 Main study
C-172 Determinate which applications aresupported by organizational units
1 0 0 Main study
C-179 Determinate regulatory issues 1 0 0 Main study
Table A.4.: Concerns
122 © Technische Universität München, sebis, 2015. All rights reserved.

A. Appendix
A.5. Data Collection Patterns
A.5.1. Business application patterns
DC-ID Maintained by Refreshfrequency
Datasource
Data format Observations
1 Application owner - - - 7
2 - On demand - - 7
3 Domain/Solution architect
- - - 6
4 - Event-driven - - 6
5 Enterprise architect - - - 5
6 - - - Relational DB 4
7 Enterprise architect On demand - - 3
8 - Daily - - 3
9 - Yearly - - 3
10 - - CMDB - 3
Table A.5.: Data collection patterns for business applications
© Technische Universität München, sebis, 2015. All rights reserved. 123

A. Appendix
A.5.2. Business capability patterns
DC-ID Maintained by Refreshfrequency
Datasource
Data format Observations
11 Business analyst On demand - - 23
12 - On demand - - 15
13 Enterprise architect - - - 14
14 Business/Process architect
- - - 7
15 - - - CSV (Excel) 6
16 Domain/Solution architect
- - - 5
17 - Yearly - - 5
18 - Quarterly - - 4
19 - - MS Office,MS Visio
- 4
20 Enterprise architect On demand MS Office,MS Visio
- 3
21 - Yearly - CSV (Excel) 3
22 Domain/Solution architect
On demand - - 3
23 Business/Process architect
Yearly - - 3
24 - - EAM reposi-tory
- 3
Table A.6.: Data collection patterns for business capabilities
124 © Technische Universität München, sebis, 2015. All rights reserved.

A. Appendix
A.5.3. Interface patterns
DC-ID Maintained by Refreshfrequency
Datasource
Data format Observations
25 - On demand - - 7
26 Domain/Solution architect
- - - 4
27 Application owner - - - 4
28 - Event-driven - - 4
29 Application owner On demand - - 3
30 Enterprise architect - - - 3
31 - - - Relational DB 3
Table A.7.: Data collection patterns for interfaces
© Technische Universität München, sebis, 2015. All rights reserved. 125
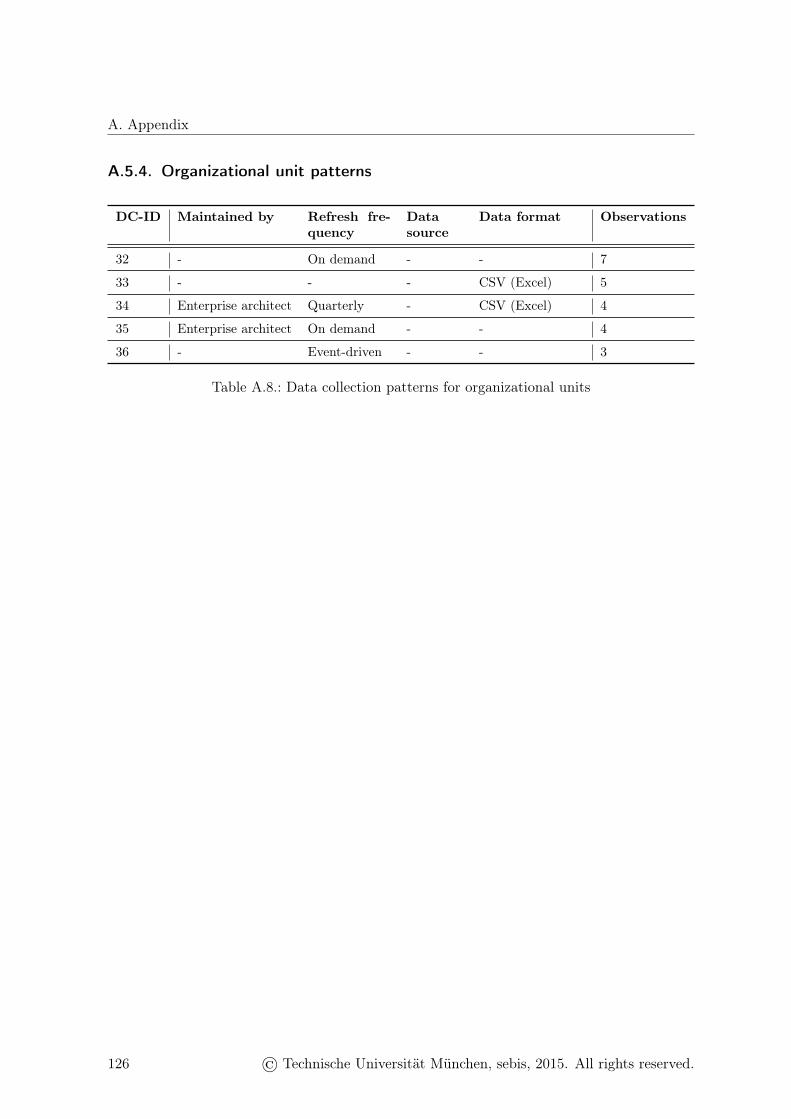
A. Appendix
A.5.4. Organizational unit patterns
DC-ID Maintained by Refresh fre-quency
Datasource
Data format Observations
32 - On demand - - 7
33 - - - CSV (Excel) 5
34 Enterprise architect Quarterly - CSV (Excel) 4
35 Enterprise architect On demand - - 4
36 - Event-driven - - 3
Table A.8.: Data collection patterns for organizational units
126 © Technische Universität München, sebis, 2015. All rights reserved.
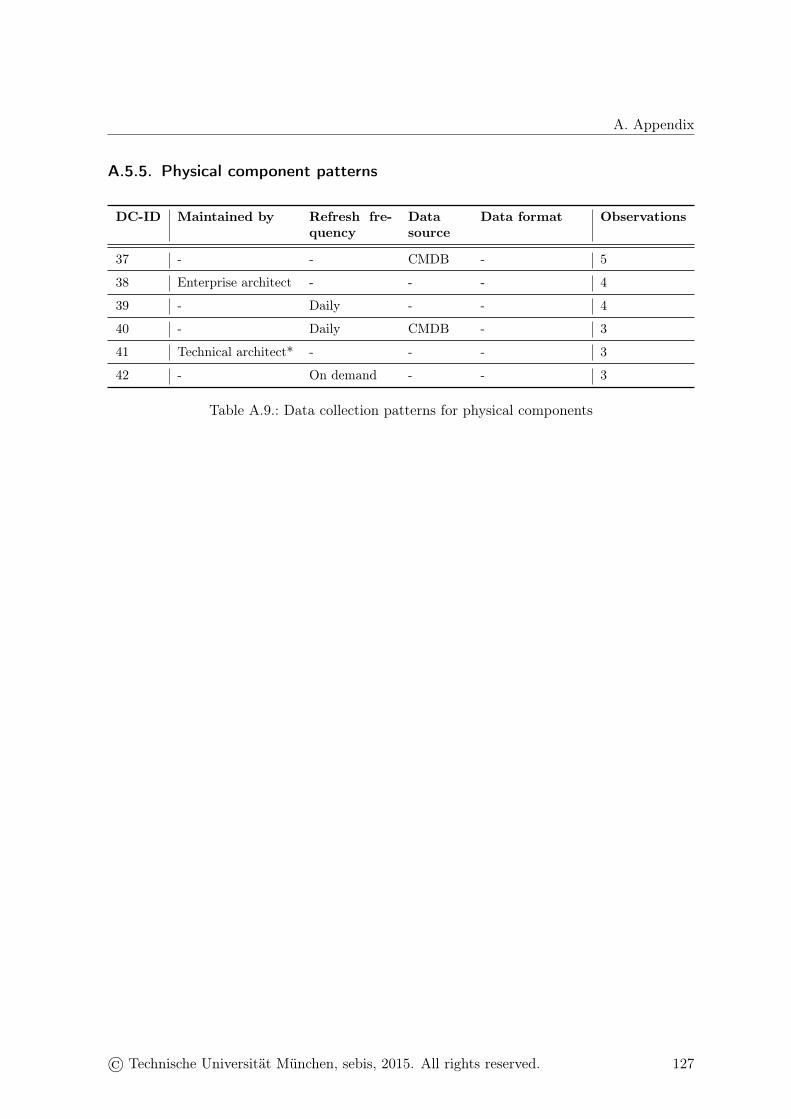
A. Appendix
A.5.5. Physical component patterns
DC-ID Maintained by Refresh fre-quency
Datasource
Data format Observations
37 - - CMDB - 5
38 Enterprise architect - - - 4
39 - Daily - - 4
40 - Daily CMDB - 3
41 Technical architect* - - - 3
42 - On demand - - 3
Table A.9.: Data collection patterns for physical components
© Technische Universität München, sebis, 2015. All rights reserved. 127

A. Appendix
A.5.6. Process patterns
DC-ID Maintained by Refresh fre-quency
Datasource
Data for-mat
Observations
43 - On demand - - 27
44 Business analyst - - - 24
45 Business analyst On demand Variousstake-holders
- 20
46 Business/Process architect - - - 7
47 Enterprise architect - - - 4
48 - - - CSV (Ex-cel)
4
49 Business Process On demand - - 3
50 - Event-driven - 3
Table A.10.: Data collection patterns for processes
A.5.7. Project patterns
DC-ID Maintained by Refresh fre-quency
Datasource
Data format Observations
51 Enterprise architect - - - 4
52 Project manager IT - - - 4
53 - On demand - - 4
54 - Monthly - - 3
55 - - PPM - 3
56 - - - CSV (Excel) 3
Table A.11.: Data collection patterns for projects
128 © Technische Universität München, sebis, 2015. All rights reserved.
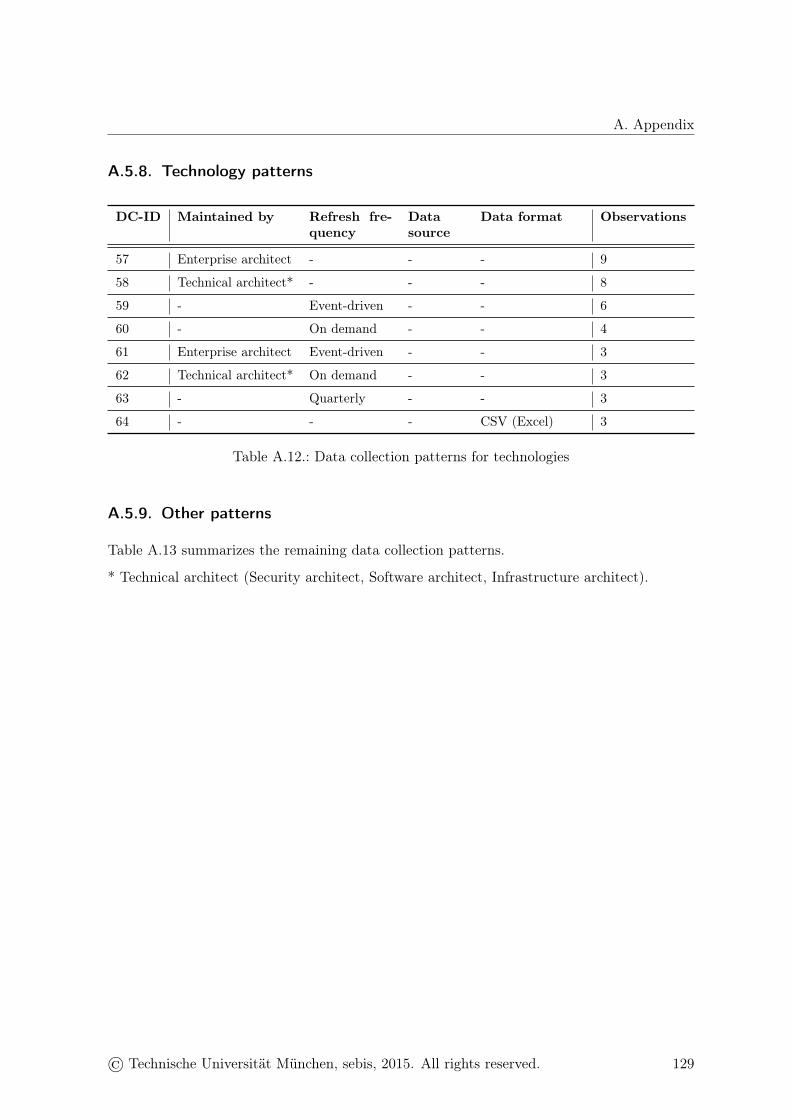
A. Appendix
A.5.8. Technology patterns
DC-ID Maintained by Refresh fre-quency
Datasource
Data format Observations
57 Enterprise architect - - - 9
58 Technical architect* - - - 8
59 - Event-driven - - 6
60 - On demand - - 4
61 Enterprise architect Event-driven - - 3
62 Technical architect* On demand - - 3
63 - Quarterly - - 3
64 - - - CSV (Excel) 3
Table A.12.: Data collection patterns for technologies
A.5.9. Other patterns
Table A.13 summarizes the remaining data collection patterns.
* Technical architect (Security architect, Software architect, Infrastructure architect).
© Technische Universität München, sebis, 2015. All rights reserved. 129
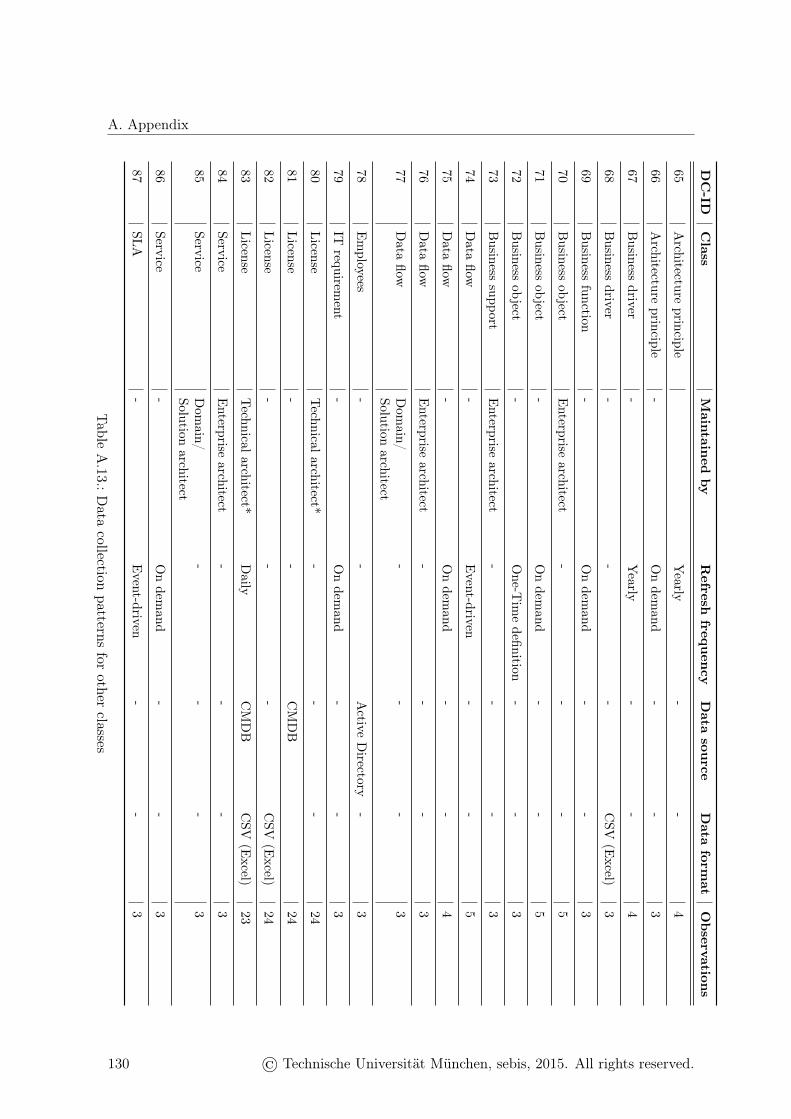
A. Appendix
DC
-IDC
lassM
aintained
byR
efreshfrequ
ency
Data
source
Data
format
Observation
s
65A
rchitectureprinciple
Yearly
--
4
66A
rchitectureprinciple
-O
ndem
and-
-3
67B
usinessdriver
-Y
early-
-4
68B
usinessdriver
--
-C
SV(E
xcel)3
69B
usinessfunction
-O
ndem
and-
-3
70B
usinessobject
Enterprise
architect-
--
5
71B
usinessobject
-O
ndem
and-
-5
72B
usinessobject
-O
ne-Tim
edefinition
--
3
73B
usinesssupport
Enterprise
architect-
--
3
74D
ataflow
-E
vent-driven-
-5
75D
ataflow
-O
ndem
and-
-4
76D
ataflow
Enterprise
architect-
--
3
77D
ataflow
Dom
ain/Solution
architect-
--
3
78E
mployees
--
Active
Directory
-3
79IT
requirement
-O
ndem
and-
-3
80License
Technicalarchitect*
--
-24
81License
--
CM
DB
24
82License
--
-C
SV(E
xcel)24
83License
Technicalarchitect*
Daily
CM
DB
CSV
(Excel)
23
84Service
Enterprise
architect-
--
3
85Service
Dom
ain/Solution
architect-
--
3
86Service
-O
ndem
and-
-3
87SLA
-E
vent-driven-
-3
Table
A.13.:D
atacollection
patternsfor
otherclasses
130 © Technische Universität München, sebis, 2015. All rights reserved.