enso prediction and policy making the world a better place with science
TRANSCRIPT

ENSO Prediction and Policy
Making the world a better place with science

Normal Conditions in the tropical Pacific

El Niño Conditions
- WEAK East-west SST- WEAK upwelling- SHALLOW Thermocline slope- LEVEL Sea surface height- NEGATIVE SOI- WEAK trade winds- WEAK Walker circ- LESS rainfall SE Asia

La Niña Conditions
Patterns:
- STRONG East-west SST- STRONG upwelling- STEEP Thermocline slope- STEEP Sea surface slope- POSITIVE SOI- STRONG trade winds- STRONG Walker circ- MORE rainfall SE Asia

How to predict?
Forecasts courtesy of IRI (Lamont-Doherty)

Global ENSO Impacts

Global SST anomalies
http://iridl.ldeo.columbia.edu
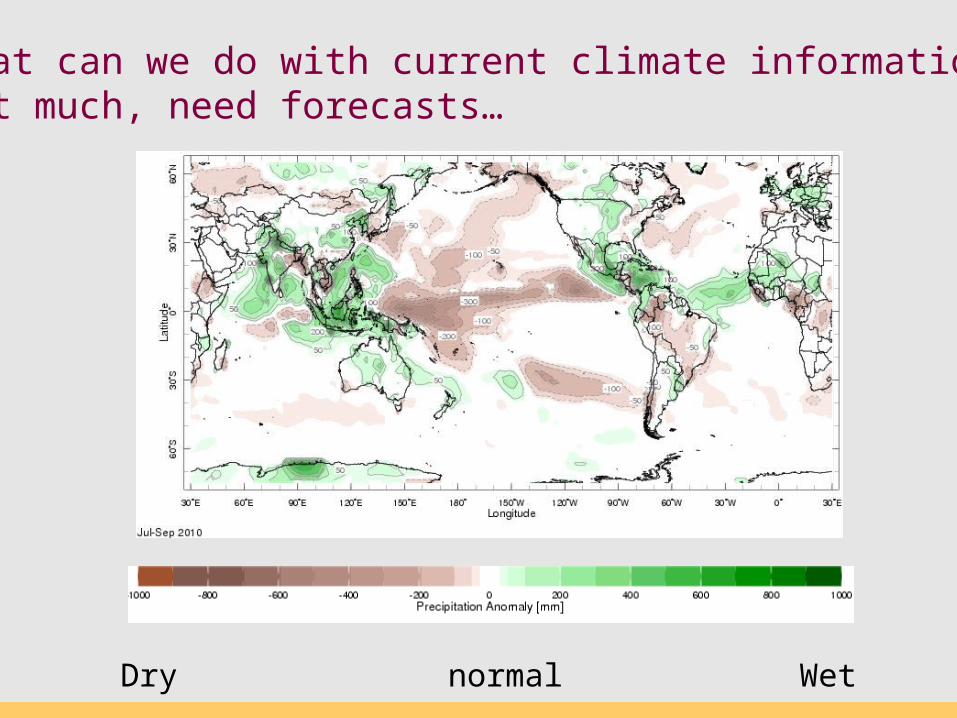
What can we do with current climate information? Not much, need forecasts…
Dry Wetnormal

Hawaii DroughtIndonesia Flooding
Societal impact of ENSO in the news
2010 news…

How ENSO impacts people
Effective management of climate related risks (opportunities) for improved:
• Agricultural production– Stocking, cropping calendar, crop selection, irrigation, insurance,
livestock/trade
• Water resource management– Dynamic reservoir operation, power generation, pricing/insurance
• Food security– Local, provincial, regional scales
• Public health– Warning, vaccine supply/distribution, surveillance measures,…
• Natural resource management– Forests/fire, fisheries, water/air quality
• Infrastructure development

Month
JULMAYMARJANNOVSEP
200
100
0
Rainfall (mm)
Malaria incidence
The disease is highly seasonal and follows the rainy season with a lag of about 2 months
Malaria and Rainfall

ENSO and Zimbabwe corn yield
+
-
ENSO

Predictions and PolicySnapshots of current conditions
are not very useful.
People need advance warning, and for their region.
Today:
1) how predictions are made
2) what we can do with them

ENSO Prediction Methods
• Skillful 6-9 months into the future• This ability has saved many millions of lives• Two methods: Dynamical vs. Statistical

How to predict?
Forecasts courtesy of IRI (Lamont-Doherty)

Time Scales of Variability

If you had NO other information you could still predict ENSO State …
Because of “persistence”
Adding in “physics” give you many additional months of prediction skill
Cor
rela
tion

Dynamical Climate Modeling
Physically-based models, grid-calculations based on conservation of mass, energy, momentum

Surface layer
Deep ocean; u=v=w=0
Active layer
50 m
150 m
Simplified Ocean and Atmosphere Models
Simplified form of equations for conservation of mass, momentum, energy
SSTA
Tropopause

Important: real time ocean observations
TOGA-TAO Buoys Buoys measure winds, SST, SLP…
Physical equations are initialized with real observations

LOTS of ocean observations!ARGO floats
XBT (eXpandable BathiThermograph)
Moorings
Satellite
SST
Sea Level
M.A. Balmaseda ( ECMWF)

What sort of computing power do you need ?
130 TeraFLOPS
IBM Roadrunner still 8x faster
Earth Simulator
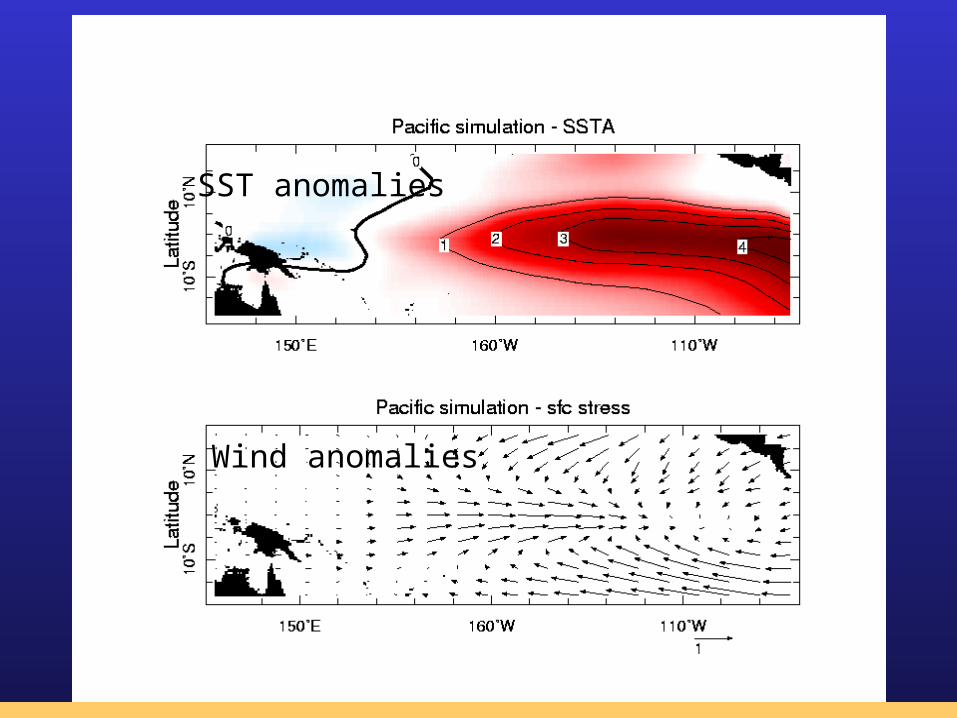
What a Model El Niño event looks like
SST anomalies
Wind anomalies

Here is a 3-D animation the tropical Pacific as it cycles through an El Niño then La Niña event. The surface shown is sea-level (in cm) and the surface is colored according to the SST anomalies associated with each event.

Multi-Model forecasts
Lots of models!Each projects 5 months ahead, each monthResult is a “plume” of predictions
NINO3 SST Anomaly
Columbia

Simple “persistence”: 3-4 months forecast
Physical Prediction: up to 9 months into future

ENSO forecasts initialized each month

Other “models” can be built using a probabalistic approach: “Statistical”
Dynamical Statistical

The Current Forecast
“Neutral” for another 6 months at least

What do we do with this information?
The same models that predict ENSO state can be used to predict climate changes, globally.
Some regions warm/cold, some wet/dry.
Critical is being able to say how “unusual” climate will be.

Precipitation forecasts in 2010-11(“La Nina” was forecast)
http://iri.columbia.edu/climate/forecast/net_asmt/2010/sep2010/OND10_Asi_pcp.html
Oct-Dec, 2010

How to use / disseminate these results
• Communicate broadly, for free• Train how to use the predictions• Each country has unique “problems”, ENSO
vulnerabilities.• Key is to understand:
a) identifying their culture/problem
b) your ability to provide actionable information
c) how to implement change.
Index Insurance for Drought in Africa
Science in service of humanity
Dan Osgoode & Eric Holthaus
International Research Institute for Climate and Society

ENSO Impact regions

Outline
• Problem: ENSO impacts rainfall and agriculture - Food Security
• Solution: Farmer Index insurance to buffer impacts
• Results from Ethiopia Millennium Villages Project (MVP)
• 13 other MVPs with very different problems and solutions
Rain gauge

Case Study: Ethiopia
• 85% of population practices subsistence rainfed agriculture
• History of drought leading to civil unrest (1984)
• Famine response usually slow
• Risk management strategies have slow uptake due to poverty traps
Ethiopia statistics: Population = 80M2X size of TexasDiverse topography and climate~160 rain gauges w/ 30 years historyGDP per capita: $700/yr

Drought and Development: The Problem
• Climate shocks increase vulnerability (in already vulnerable places)– Survey: 10 of 12 list drought as #1
livelihood risk (source: MVP)
• Climate Risk Management = Risk Reduction (terracing,
rainwater harvesting, improved seeds and fertilizer)+ Risk Transfer (division of labor, insurance, other financial mechanism)+ Risk Taking (prudent loans to increase productivity in good years)
IRI: Helping developing countries to manage climate risk.

Science Strategy: Index development
• Goal: identify a shared climate risk and insure the community as a whole.
• Define shared risk (drought vs flood, etc)• Quantify risk (through historical weather
information - weather modelling)• Create index (match climate and climate
outcomes - agricultural modelling)• Create insurance product (frequency of
payouts, magnitude of payouts, premium price)
• Target insurance product (keep stakeholders in mind - happens throughout the entire process!)

Science Strategy: Index development
• Index focuses on late season rainfall, when crop harvest is most vulnerable

Ground-based:Local Rainfall
Climate data is hard to get for rural populationsClimate data is hard to get for rural populations
Rainfall
Satellite:Regional NDVI

Index insurance data
• Rainfall data is short, with gaps
• Limited spatial coverage
• How far is too far from station?
• Common to many applications– Need technique for new stations
– Most places do not have long met station history
– Must address for scale-up

Science Strategy: Remote Sensing
• Goal: examine potential to scale up availability of climate/environmental data in data poor regions.
• Satellite rainfall estimates give complete spatial coverage - but short histories and competing methods
• Satellite vegetation can give direct measure of crop health - but also includes surrounding native veg. (also short history)
• Working with NMA(Ethiopia) & Reading U. to develop 30-year satellite rainfall climatology for Ethiopia.
• Working with NASA to “upscale” higher resolution Quickbird and Landsat to MODIS

Water requirement varies through crop growth cycle
Seasonal rainfall total is not the best indicator for crop yieldSeasonal rainfall total is not the best indicator for crop yield
Alternative is to use a simple crop model, e.g.: Alternative is to use a simple crop model, e.g.: Water Requirement Satisfaction Index (WRSI)Water Requirement Satisfaction Index (WRSI)
Eg for 180-day maize (as used for Sauri)

Index InsuranceProblems with traditional insurance have kept it from
being available to most of the world
• Traditional Crop insurance – Almost always subsidized (SUBSIDIES CAN CAUSE
PROBLEMS)
• Recent index innovation– Insure weather index (eg seasonal rainfall), not crop– Only partial protection (basis risk), should not oversell– Cheap, easy to implement, good incentives– Exploding popularity--dangerous if misused– Structure to target each particular goal
• Design complex – Only a naive partner would reveal all their cards– All partners must play active role in a cooperative design– Client must know what is not covered– How do we build a tool to address climate risk in
development?– How do we best use climate information?
• Probabilities of climate events key – Money in = average(Money out) + cost of holding risk
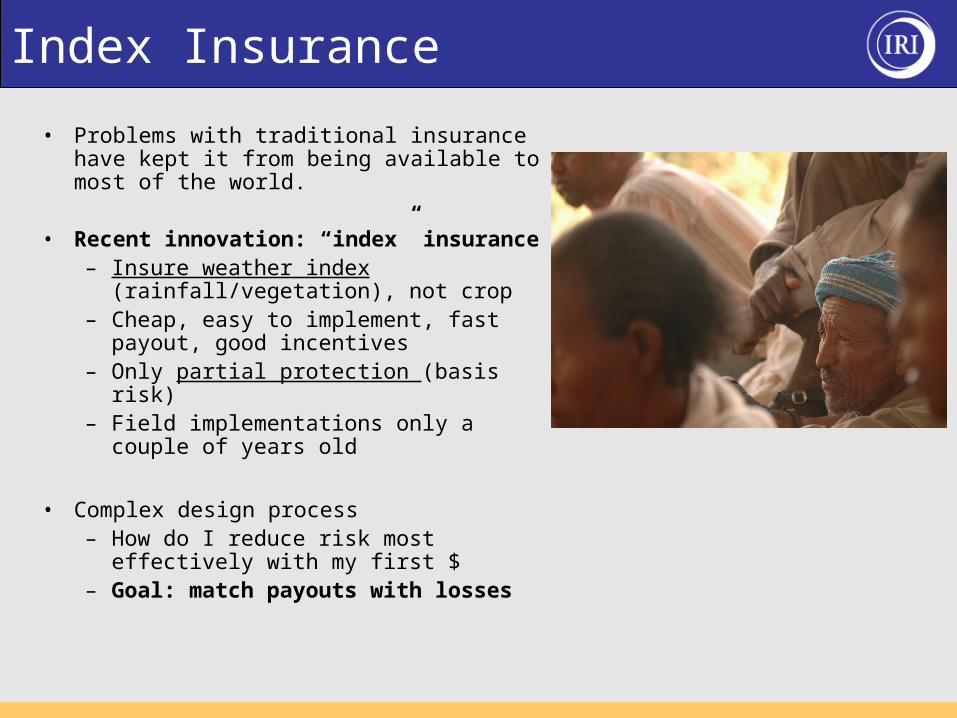
Index Insurance
• Problems with traditional insurance have kept it from being available to most of the world.
• Recent innovation: “index” insurance– Insure weather index
(rainfall/vegetation), not crop– Cheap, easy to implement, fast payout,
good incentives– Only partial protection (basis risk)– Field implementations only a couple of
years old
• Complex design process– How do I reduce risk most effectively
with my first $– Goal: match payouts with losses

Micro ExampleMalawi Groundnut
• Farmer gets loan (~4500 Malawi Kwacha or ~$35)– Groundnut seed cost (~$25, ICRSAT bred, delivered by farm association)– Interest (~$7), Insurance premium (~$2), Tax (~$0.50)– Prices vary by site
• Farmer holds insurance contract, max pay is loansize– Insurance payouts on rainfall index formula– Joint liability to farm “Clubs” of ~10 farmers– Farmers in 20km radius around met station
• At end of season– Farmer provides yields to farm association– Proceeds (and insurance) pay off loan– Remainder retained by farmer
• Farmers pay full financial cost of program (with tax)– Only subsidy is data and contract design assistance
– Farmers told us: Insurance package is how they adapt to climate change

Index Insurance as mitigation tool
• Index insurance acts to buffer socioeconomic impact of ENSO climate variability.
• Insure the climate index not the crop.• Not a subsidy – fully paid product.• Works if most participate.• Reduces poverty traps – buffers variation.• Needs:
– Understand local climate – ENSO link
– Good climate observartions, agriculture model
– Clear understanding of the “rules” by clients