ensemble tests and sensitivity calculations
DESCRIPTION
Ensemble tests and sensitivity calculations. Kevin Kr öninger, MPI für Physik GERDA Collaboration Meeting, Tübingen, 11/09 – 11/11/2005. Overview. Monte Carlo simulation of int. background sources ( MaGe ). Creation of ensembles according to activities. Cut-based event selection. - PowerPoint PPT PresentationTRANSCRIPT
Ensemble tests and sensitivity calculations
Kevin Kröninger, MPI für Physik
GERDA Collaboration Meeting, Tübingen, 11/09 – 11/11/2005
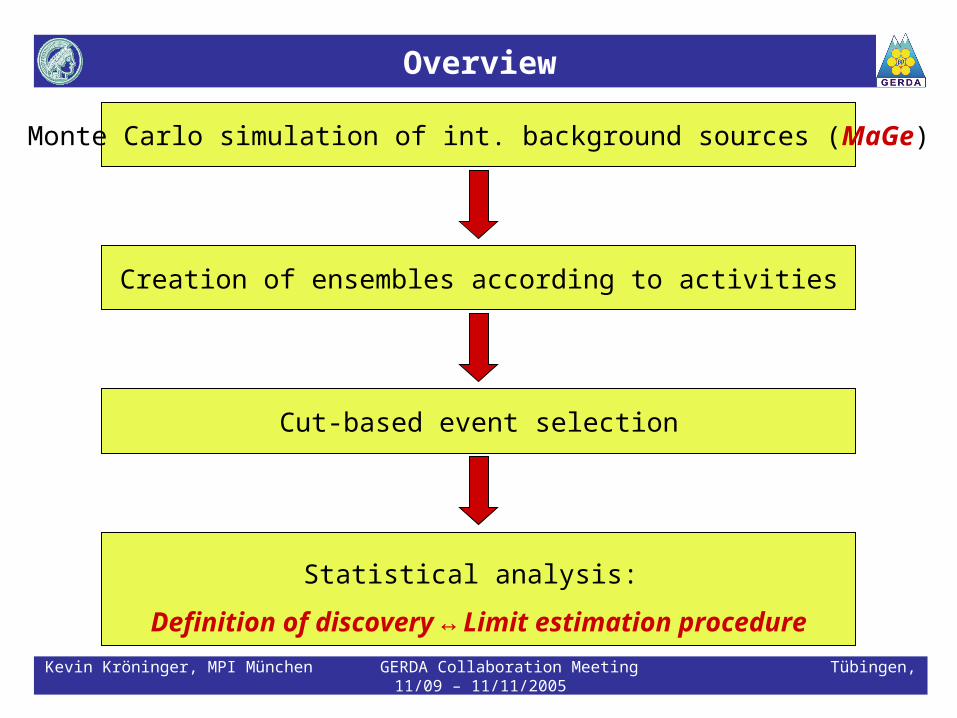
Overview
Kevin Kröninger, MPI München GERDA Collaboration Meeting Tübingen, 11/09 – 11/11/2005
Monte Carlo simulation of int. background sources (MaGe)
Creation of ensembles according to activities
Cut-based event selection
Statistical analysis:
Definition of discovery ↔ Limit estimation procedure
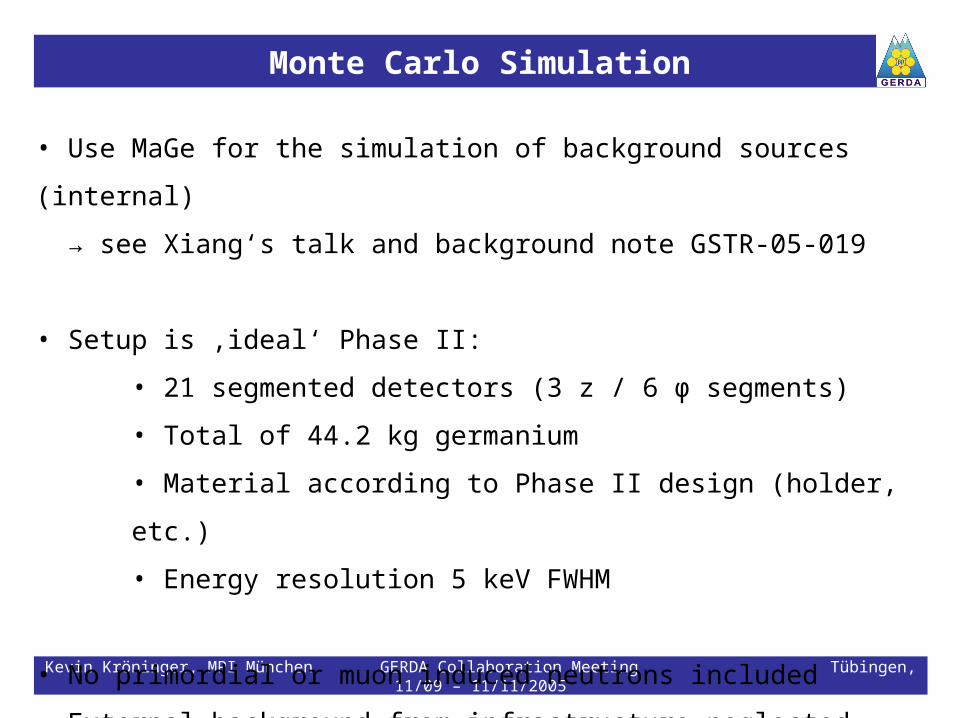
Monte Carlo Simulation
Kevin Kröninger, MPI München GERDA Collaboration Meeting Tübingen, 11/09 – 11/11/2005
• Use MaGe for the simulation of background sources (internal)
→ see Xiang‘s talk and background note GSTR-05-019
• Setup is ‚ideal‘ Phase II:
• 21 segmented detectors (3 z / 6 φ segments)
• Total of 44.2 kg germanium
• Material according to Phase II design (holder, etc.)
• Energy resolution 5 keV FWHM
• No primordial or muon induced neutrons included
• External background from infrastructure neglected
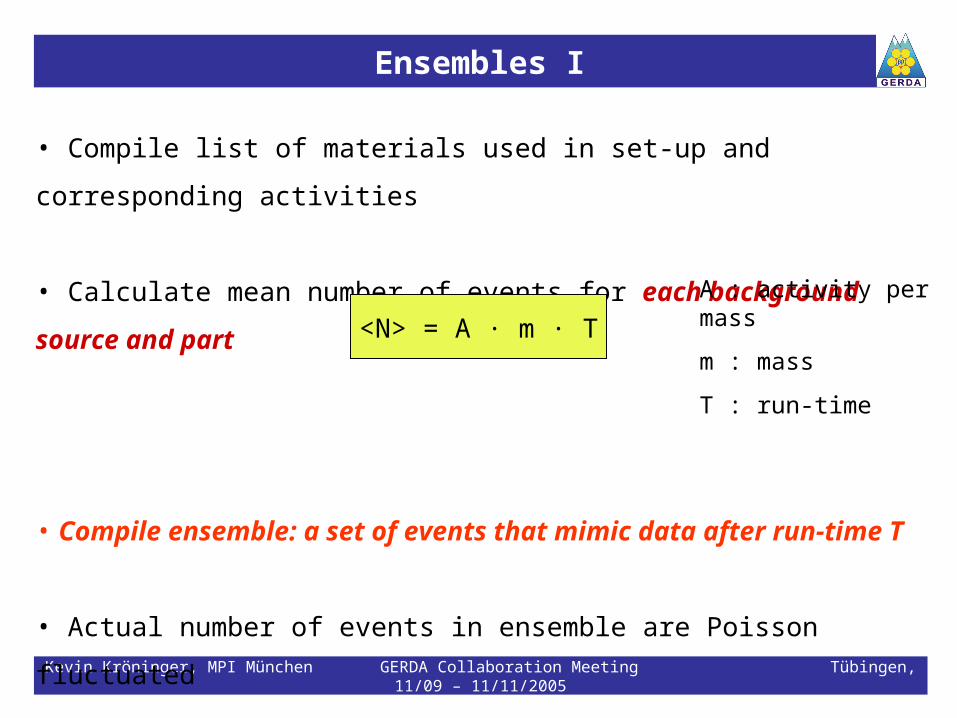
Ensembles I
Kevin Kröninger, MPI München GERDA Collaboration Meeting Tübingen, 11/09 – 11/11/2005
• Compile list of materials used in set-up and corresponding activities
• Calculate mean number of events for each background source and part
• Compile ensemble: a set of events that mimic data after run-time T
• Actual number of events in ensemble are Poisson fluctuated
• Store time, e.g. halflife of Ge-68 taken into account (exponential decay)
<N> = A · m · T
A : activity per mass
m : mass
T : run-time
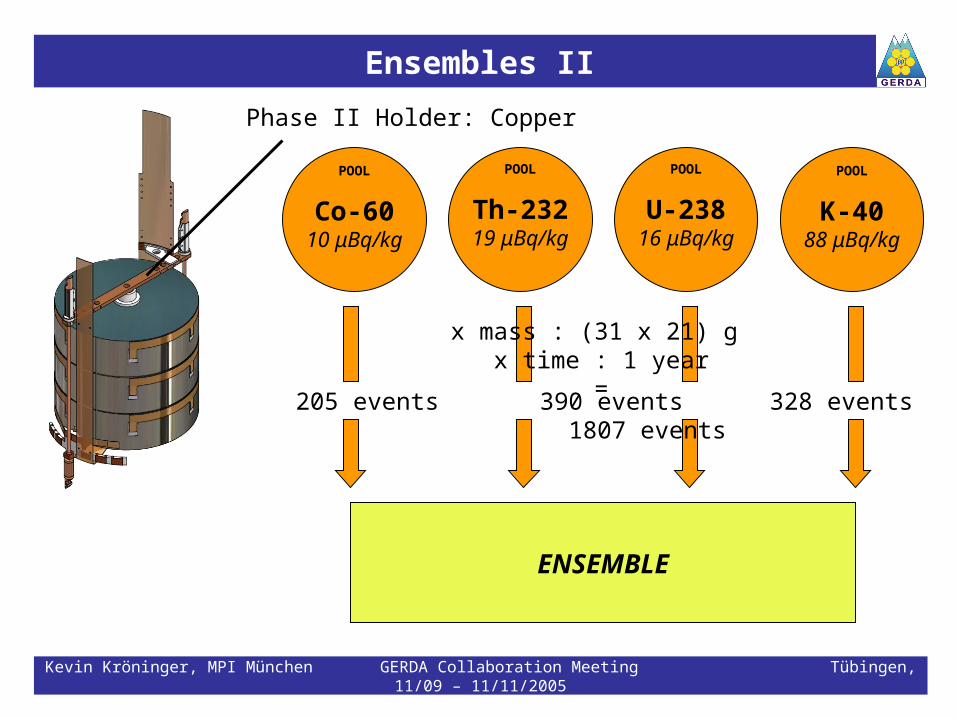
Ensembles II
Kevin Kröninger, MPI München GERDA Collaboration Meeting Tübingen, 11/09 – 11/11/2005
POOL
Co-6010 μBq/kg
POOL
U-23816 μBq/kg
POOL
K-4088 μBq/kg
Phase II Holder: Copper
POOL
Th-23219 μBq/kg
ENSEMBLE
205 events 390 events 328 events 1807 events
x mass : (31 x 21) g x time : 1 year
=
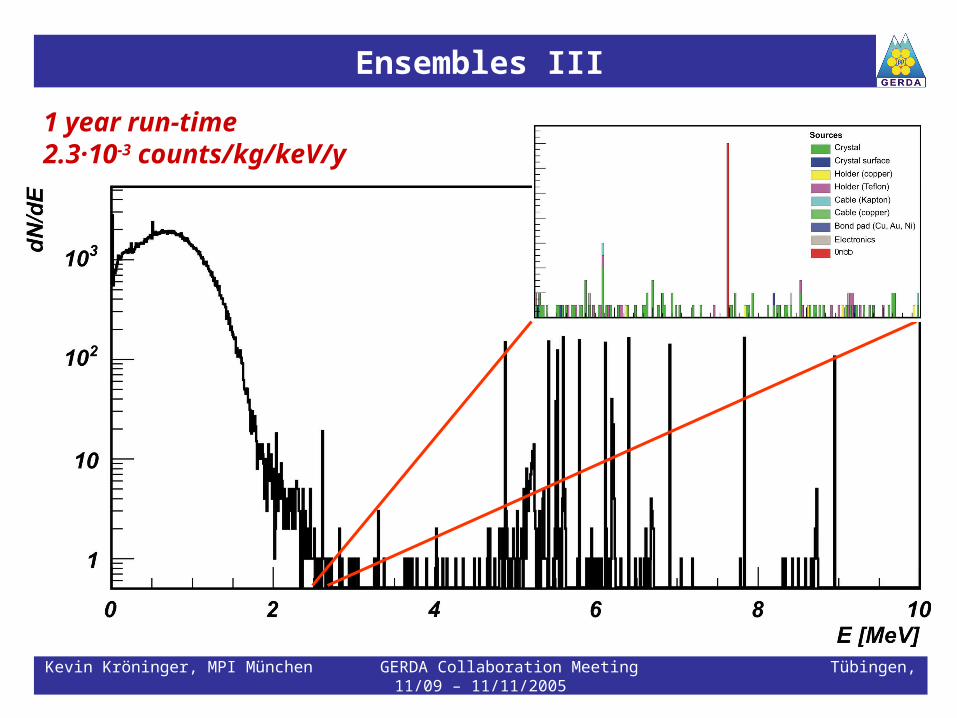
Ensembles III
Kevin Kröninger, MPI München GERDA Collaboration Meeting Tübingen, 11/09 – 11/11/2005
1 year run-time2.3·10-3 counts/kg/keV/y
Ensembles IV
Kevin Kröninger, MPI München GERDA Collaboration Meeting Tübingen, 11/09 – 11/11/2005
• Compiling ensembles is CPU time intensive
• Use toy ensembles:
• Spectra created with flat background + Gaussian peak signal
• Tested flat background hypothesis with 2500 kg·years
• Vary background and signal contribution
Event Selection I
Kevin Kröninger, MPI München GERDA Collaboration Meeting Tübingen, 11/09 – 11/11/2005
• Similiar to selection done for background estimate:
• Anti-coincidence between segments
• Energy window ±80 keV around Qββ
• X-ray veto against decay of Ge-68
• No pulse shape analysis used yet
• For details on the background contributions see Note GSTR-05-019
Statistical Analysis I
Kevin Kröninger, MPI München GERDA Collaboration Meeting Tübingen, 11/09 – 11/11/2005
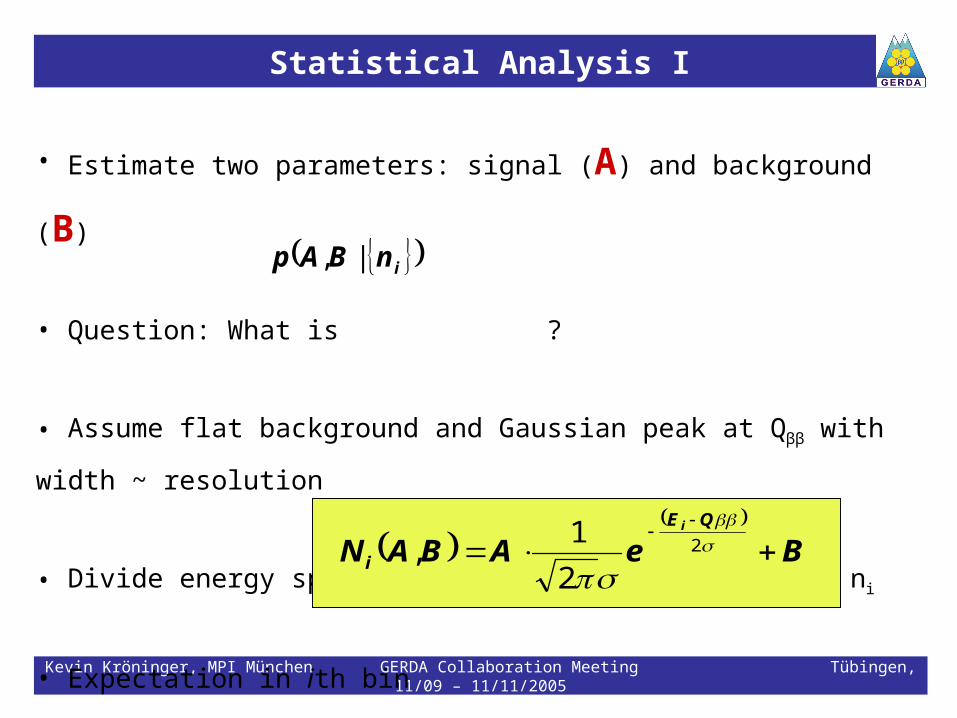
• Estimate two parameters: signal (A) and background (B)
• Question: What is ?
• Assume flat background and Gaussian peak at Qββ with width ~ resolution
• Divide energy spectrum in 1 keV bins with events ni
• Expectation in ith bin
inBAp |,
BeABANQE
i
i
2
2
1,
Statistical Analysis II
Kevin Kröninger, MPI München GERDA Collaboration Meeting Tübingen, 11/09 – 11/11/2005
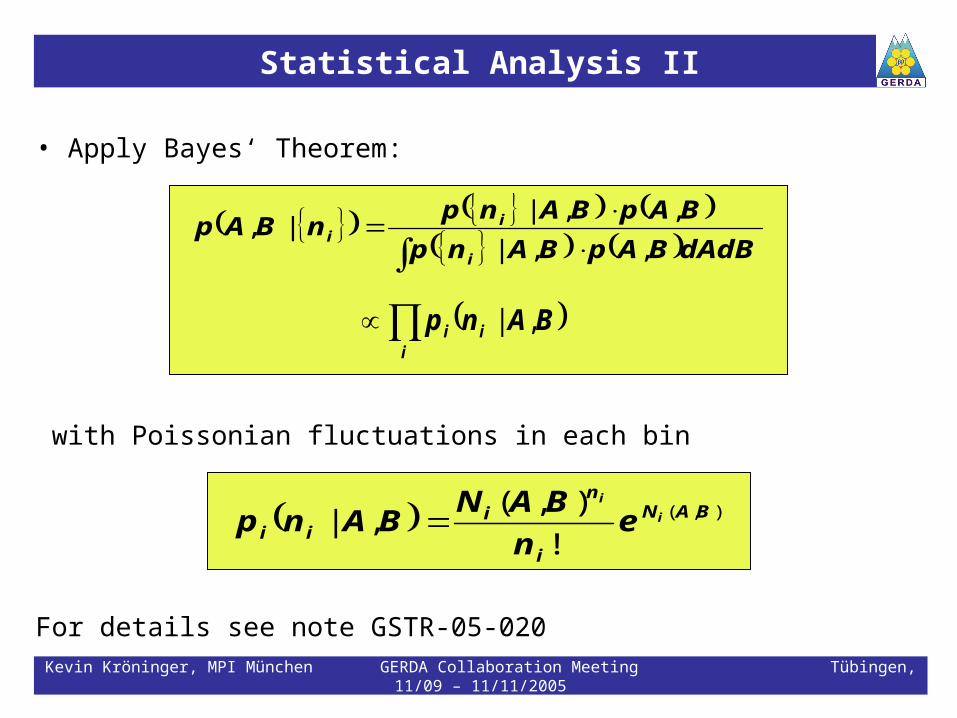
• Apply Bayes‘ Theorem:
with Poissonian fluctuations in each bin
For details see note GSTR-05-020
dAdBBApBAnp
BApBAnpnBAp
i
ii
,,|
,,||,
i
ii BAnp ,|
),(
!
),(,| BAN
i
ni
iii
i
en
BANBAnp

Statistical Analysis III
Kevin Kröninger, MPI München GERDA Collaboration Meeting Tübingen, 11/09 – 11/11/2005
Ba
ckg
rou
nd
B [
ke
V-1]
Signal A
p(A, B|{ni})
Statistical Analysis IV
Kevin Kröninger, MPI München GERDA Collaboration Meeting Tübingen, 11/09 – 11/11/2005
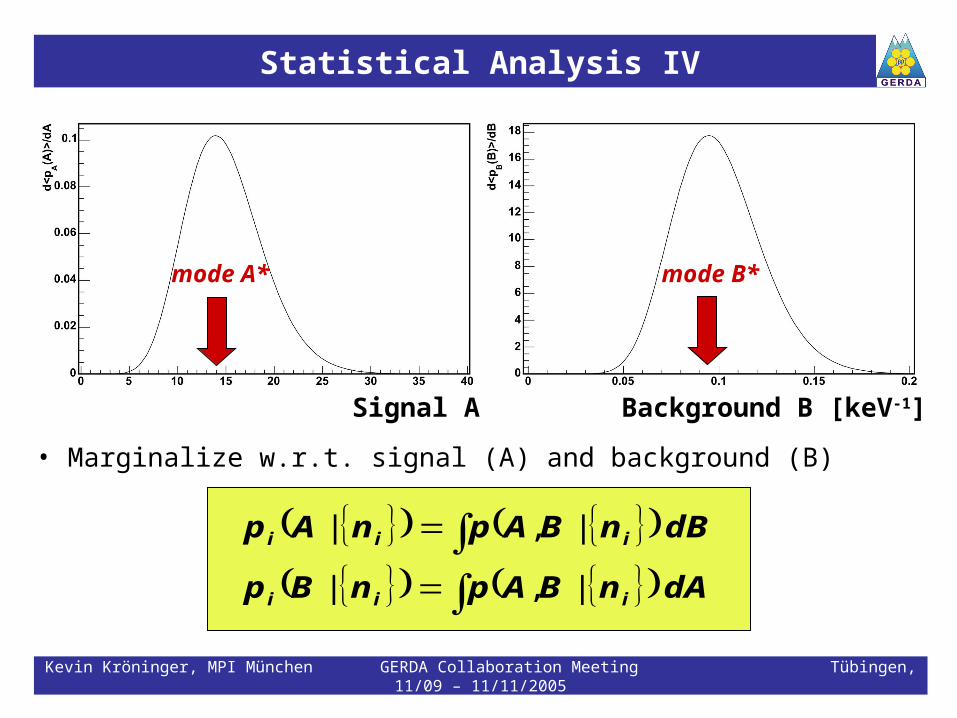
• Marginalize w.r.t. signal (A) and background (B)
dAnBApnBp
dBnBApnAp
iii
iii
|,|
|,|
mode A* mode B*
Signal A Background B [keV-1]
Statistical Analysis V
Kevin Kröninger, MPI München GERDA Collaboration Meeting Tübingen, 11/09 – 11/11/2005
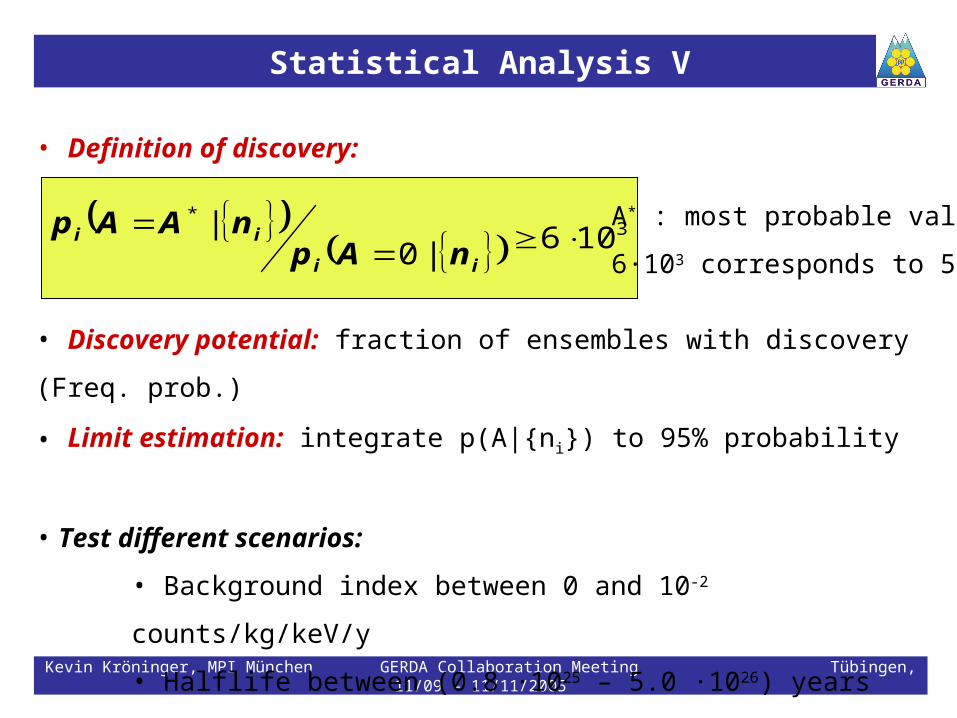
• Definition of discovery:
• Discovery potential: fraction of ensembles with discovery (Freq. prob.)
• Limit estimation: integrate p(A|{ni}) to 95% probability
• Test different scenarios:
• Background index between 0 and 10-2 counts/kg/keV/y
• Halflife between (0.8 ·1025 – 5.0 ·1026) years
• Run-time between 1 and 10 years
3*
106|0|
ii
iinAp
nAAp A* : most probable value
6·103 corresponds to 5 σ
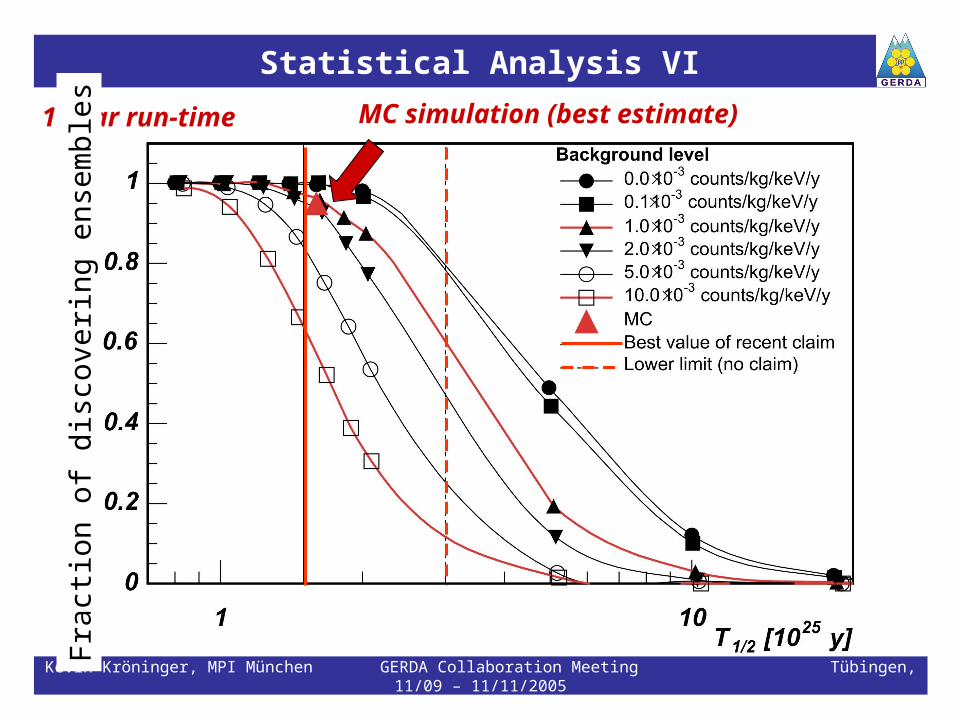
Statistical Analysis VI
Kevin Kröninger, MPI München GERDA Collaboration Meeting Tübingen, 11/09 – 11/11/2005
1 year run-timeF
ract
ion
of d
isco
verin
g en
sem
bles
MC simulation (best estimate)
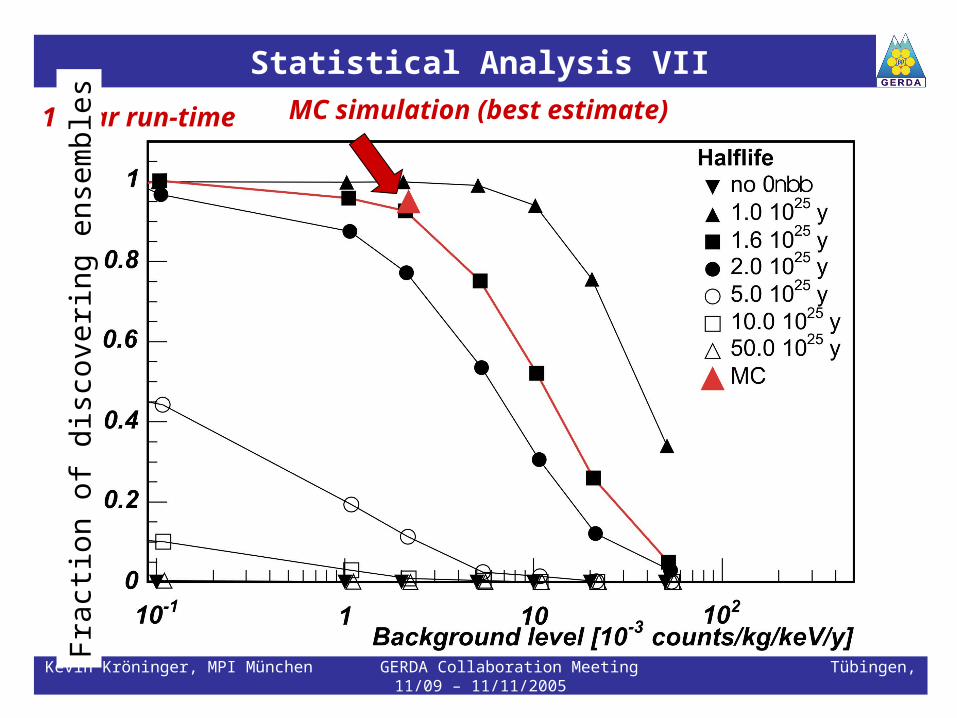
Statistical Analysis VII
Kevin Kröninger, MPI München GERDA Collaboration Meeting Tübingen, 11/09 – 11/11/2005
1 year run-timeF
ract
ion
of d
isco
verin
g en
sem
bles
MC simulation (best estimate)
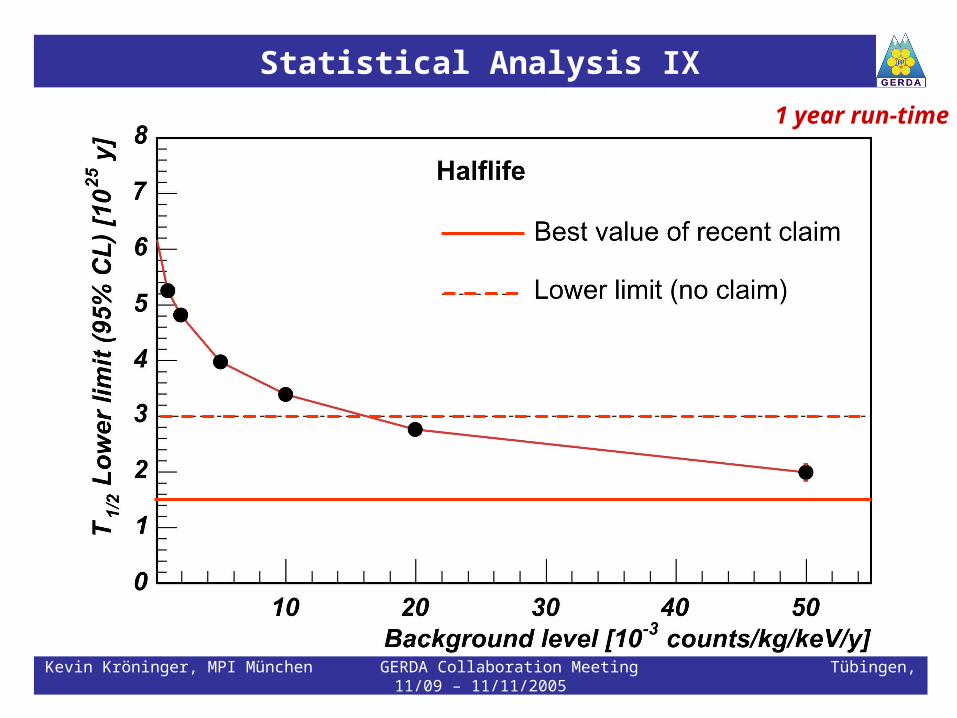
Statistical Analysis IX
Kevin Kröninger, MPI München GERDA Collaboration Meeting Tübingen, 11/09 – 11/11/2005
1 year run-time
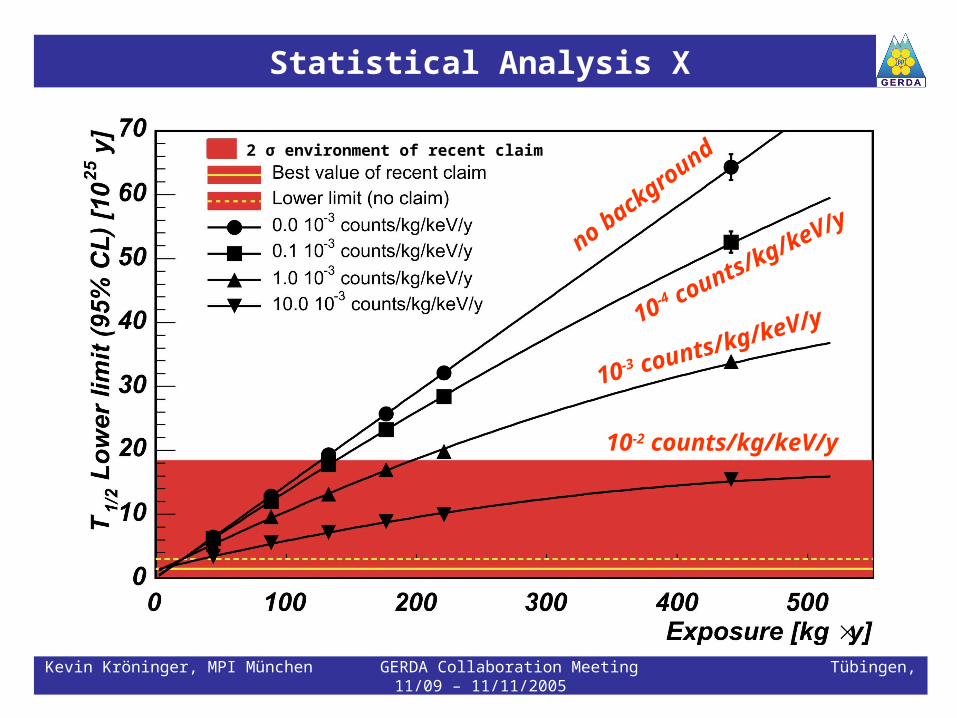
Statistical Analysis X
Kevin Kröninger, MPI München GERDA Collaboration Meeting Tübingen, 11/09 – 11/11/2005
10-4 counts/kg/keV/y
10-3 counts/kg/keV/y
10-2 counts/kg/keV/y
no background2 σ environment of recent claim
Conclusion
Kevin Kröninger, MPI München GERDA Collaboration Meeting Tübingen, 11/09 – 11/11/2005
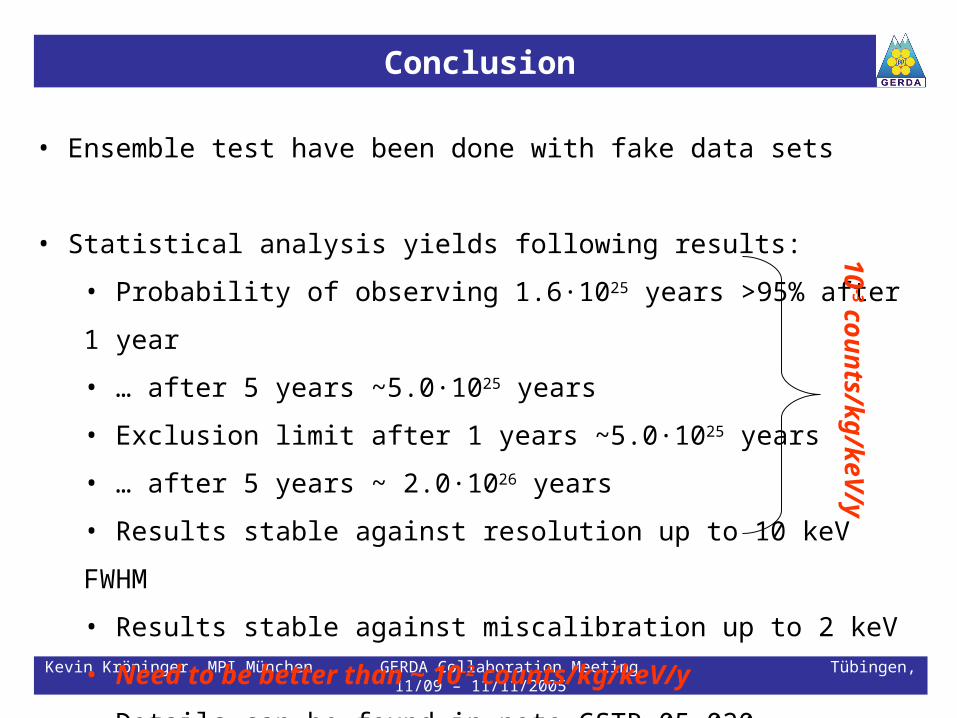
• Ensemble test have been done with fake data sets
• Statistical analysis yields following results:
• Probability of observing 1.6·1025 years >95% after 1 year
• … after 5 years ~5.0·1025 years
• Exclusion limit after 1 years ~5.0·1025 years
• … after 5 years ~ 2.0·1026 years
• Results stable against resolution up to 10 keV FWHM
• Results stable against miscalibration up to 2 keV
• Need to be better than ~ 10-2 counts/kg/keV/y
• Details can be found in note GSTR-05-020
10
-3 cou
nts
/kg
/keV
/y
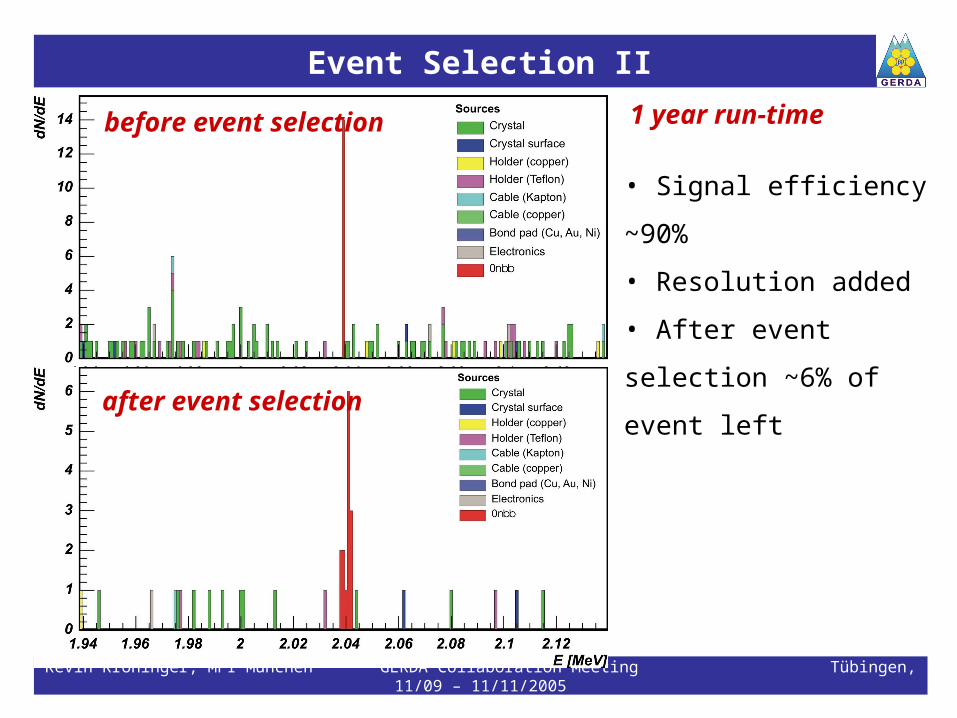
Event Selection II
Kevin Kröninger, MPI München GERDA Collaboration Meeting Tübingen, 11/09 – 11/11/2005
1 year run-timebefore event selection
after event selection
• Signal efficiency ~90%
• Resolution added
• After event selection ~6%
of event left
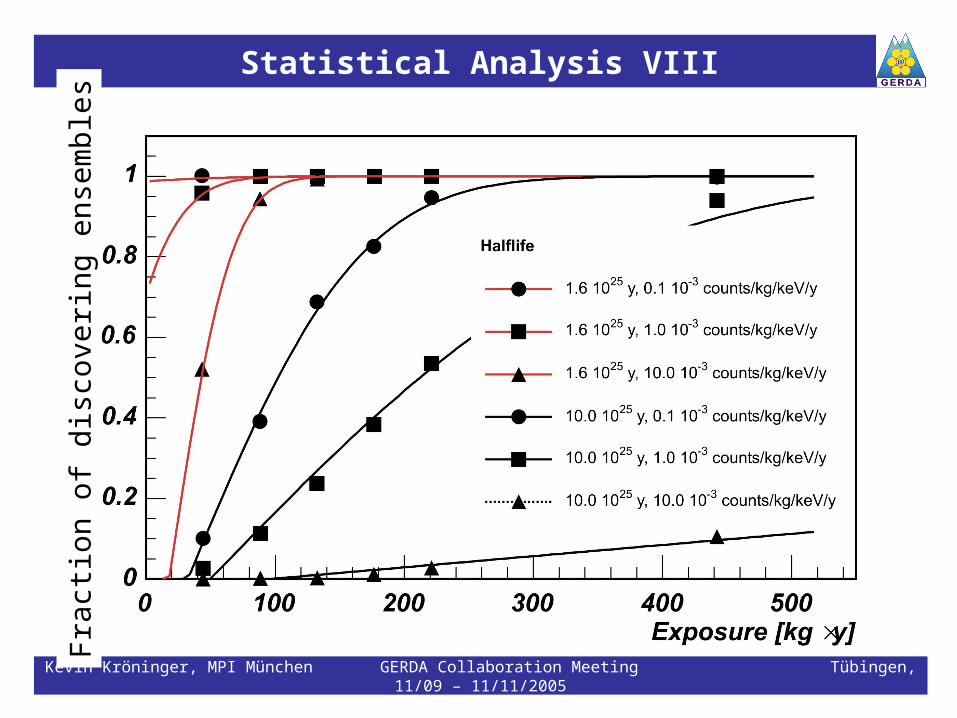
Statistical Analysis VIII
Kevin Kröninger, MPI München GERDA Collaboration Meeting Tübingen, 11/09 – 11/11/2005
Fra
ctio
n of
dis
cove
ring
ense
mbl
es
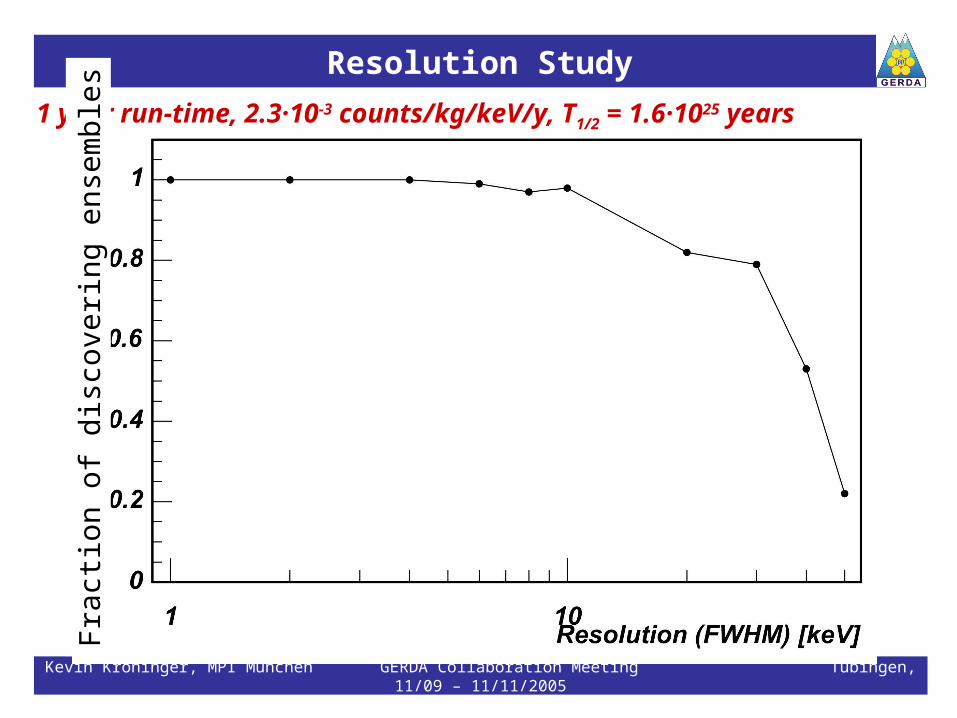
Resolution Study
Kevin Kröninger, MPI München GERDA Collaboration Meeting Tübingen, 11/09 – 11/11/2005
1 year run-time, 2.3·10-3 counts/kg/keV/y, T1/2 = 1.6·1025 yearsF
ract
ion
of d
isco
verin
g en
sem
bles
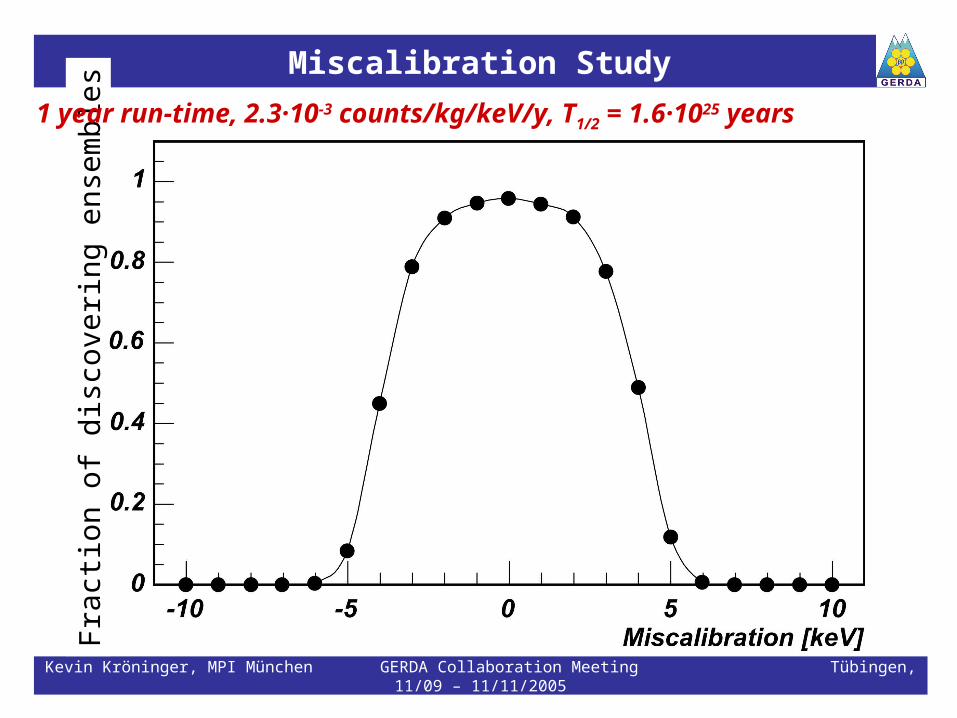
Miscalibration Study
Kevin Kröninger, MPI München GERDA Collaboration Meeting Tübingen, 11/09 – 11/11/2005
Fra
ctio
n of
dis
cove
ring
ense
mbl
es1 year run-time, 2.3·10-3 counts/kg/keV/y, T1/2 = 1.6·1025 years