enhancing research and education connectivity in africa the findings of the african tertiary...
TRANSCRIPT
Enhancing Research and Education Connectivity in Africa
The findings of the African Tertiary Institution Connectivity Study (ATICS) and information
on the African Virtual University
Robert Hawkins – World Bank
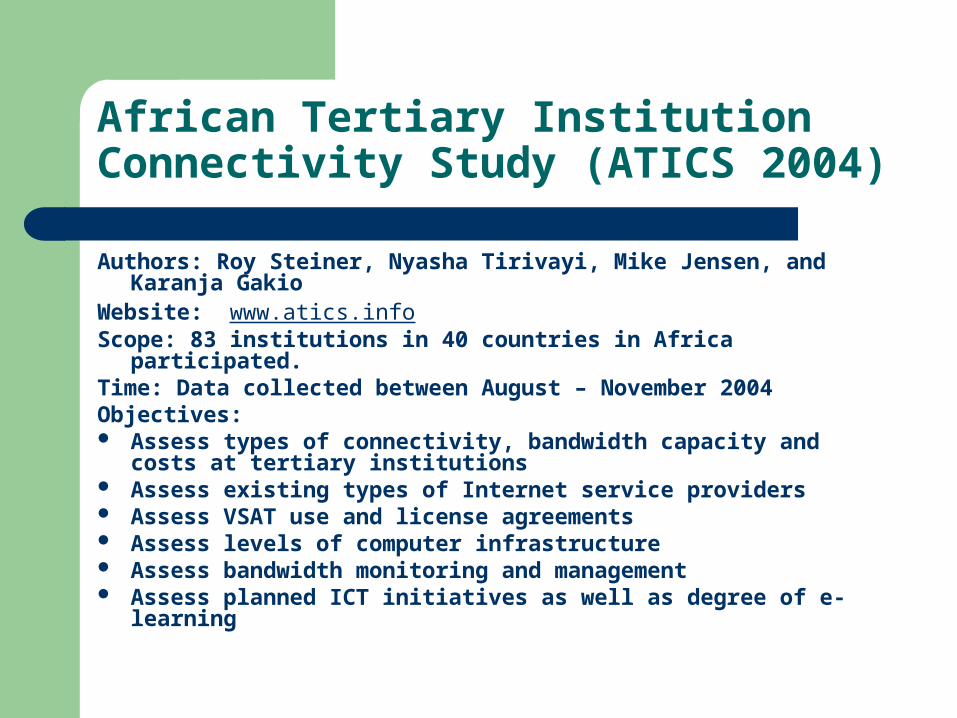
African Tertiary Institution Connectivity Study (ATICS 2004)
Authors: Roy Steiner, Nyasha Tirivayi, Mike Jensen, and Karanja Gakio
Website: www.atics.infoScope: 83 institutions in 40 countries in Africa participated.Time: Data collected between August – November 2004Objectives: Assess types of connectivity, bandwidth capacity and costs at
tertiary institutions Assess existing types of Internet service providers Assess VSAT use and license agreements Assess levels of computer infrastructure Assess bandwidth monitoring and management Assess planned ICT initiatives as well as degree of e-learning

Bandwidth Availability
Average university has no more bandwidth than the quantity of a residential connection in US or Europe. The average bandwidth reported for the sample is 537/769 Kbps.
High Demand for bandwidth amongst most institutions -- the average percentage of time where links are at 100% capacity is over 60%. (Extremely high, given that this is measured over 24 hours a day every day of the month).
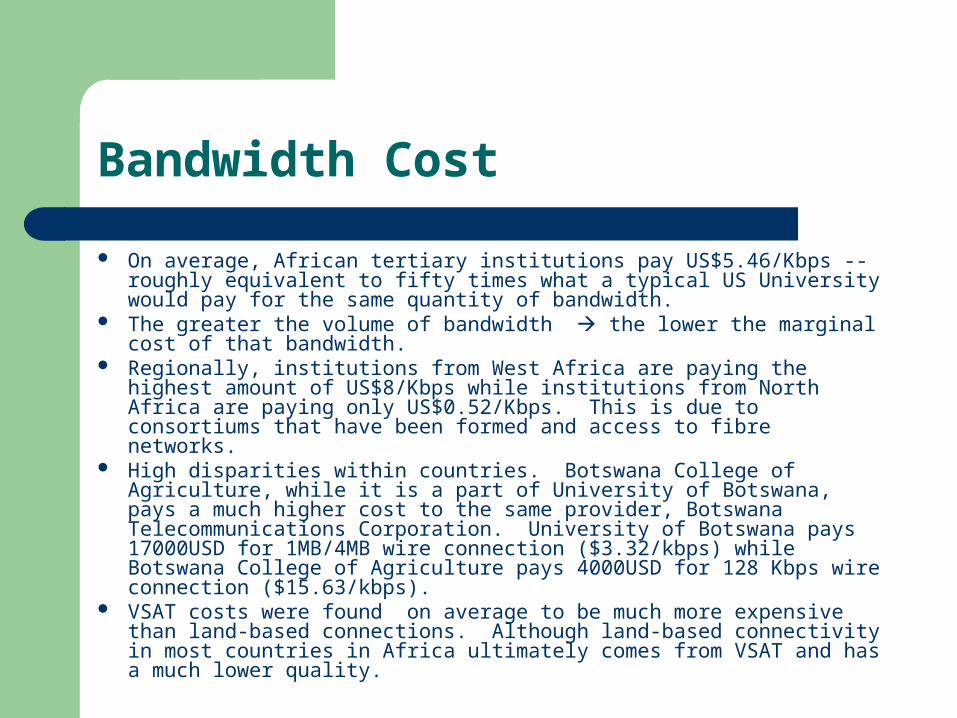
Bandwidth Cost
On average, African tertiary institutions pay US$5.46/Kbps -- roughly equivalent to fifty times what a typical US University would pay for the same quantity of bandwidth.
The greater the volume of bandwidth the lower the marginal cost of that bandwidth.
Regionally, institutions from West Africa are paying the highest amount of US$8/Kbps while institutions from North Africa are paying only US$0.52/Kbps. This is due to consortiums that have been formed and access to fibre networks.
High disparities within countries. Botswana College of Agriculture, while it is a part of University of Botswana, pays a much higher cost to the same provider, Botswana Telecommunications Corporation. University of Botswana pays 17000USD for 1MB/4MB wire connection ($3.32/kbps) while Botswana College of Agriculture pays 4000USD for 128 Kbps wire connection ($15.63/kbps).
VSAT costs were found on average to be much more expensive than land-based connections. Although land-based connectivity in most countries in Africa ultimately comes from VSAT and has a much lower quality.
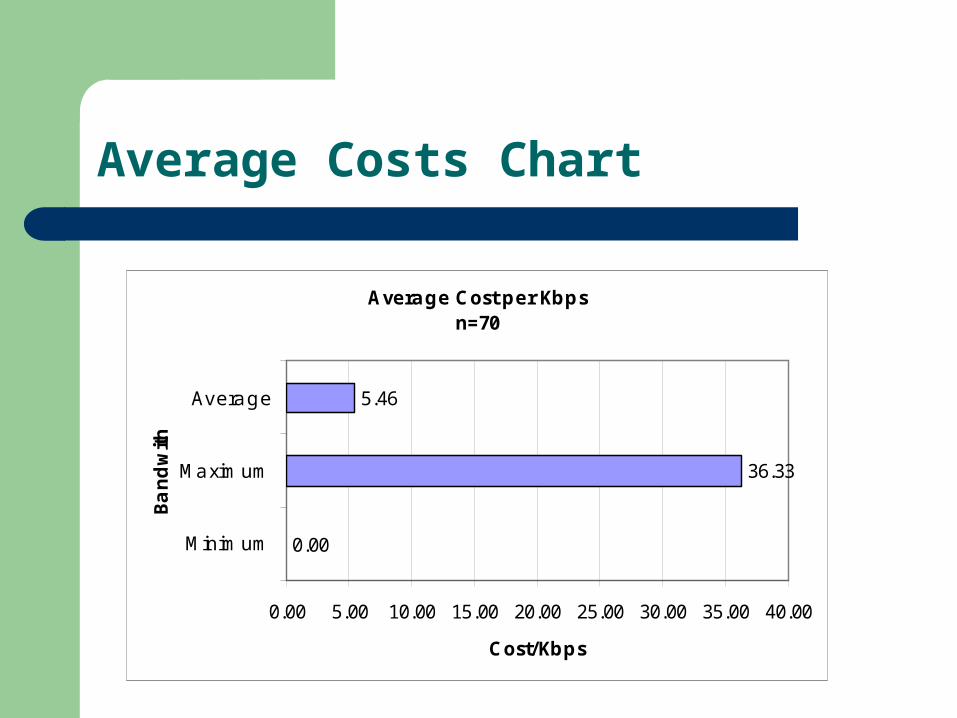
Average Costs Chart
Average Cost per Kbpsn=70
0.00
36.33
5.46
0.00 5.00 10.00 15.00 20.00 25.00 30.00 35.00 40.00
Minimum
Maximum
Average
Bandw
ith
Cost/Kbps
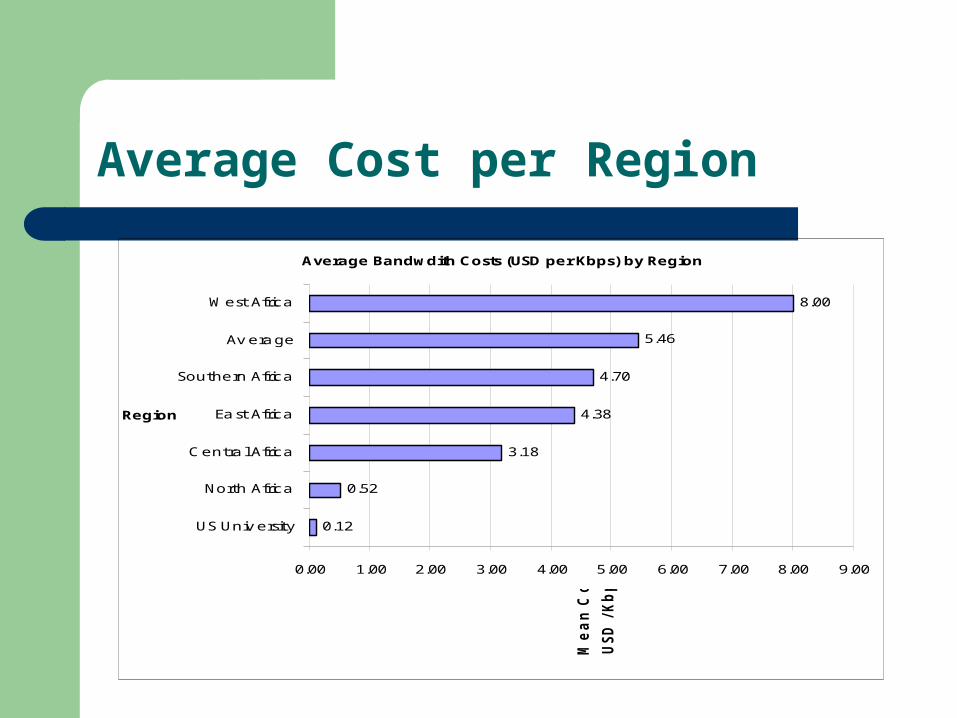
Average Cost per Region
Average Bandwdith Costs (USD per Kbps) by Region
0.12
0.52
3.18
4.38
4.70
5.46
8.00
0.00 1.00 2.00 3.00 4.00 5.00 6.00 7.00 8.00 9.00
US University
North Africa
Central Africa
East Africa
Southern Africa
Average
West Africa
Region
Mean C
ost
USD
/Kbps

Average Cost by Connectivity Type
Average Bandwidth Costs by Connectivity Typen=70
4.142.87
6.77 7.30
12.90
0.002.004.006.008.00
10.0012.0014.00
fibre wire radiolinkwireless
VSAT dialup
Type of Connectivity
Mean C
ost
/Kbps

Bandwidth Quality
Most of the institutions surveyed (66%) reported either that they did not have a Committed Information Rate for their connectivity or that they did not know what a Committed Information Rate was. In this regard, donor initiatives/academic networks were more likely to provide CIR than other Internet service providers.
Power of Knowledge: Institutions where the respondent claimed not to know if they had a CIR or not are, in fact, paying the most for their bandwidth, while those who are part of a consortium and have the highest quality of bandwidth get the lowest cost.

Knowledge is Power
Average Bandwidth Cost by CIR
n=70
0.00
2.00
4.00
6.00
8.00
10.00
Donor ISPswith CIR
Restof ISPsWith CIR
No CIR Do not know
CIR Status
Mea
n C
ost.K
bps
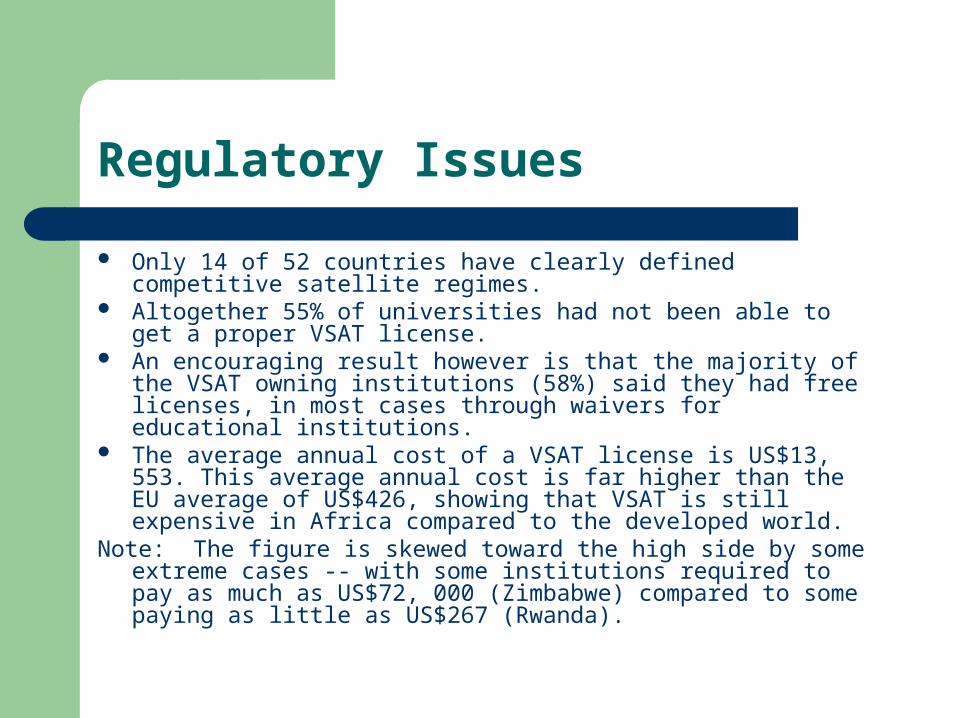
Regulatory Issues
Only 14 of 52 countries have clearly defined competitive satellite regimes.
Altogether 55% of universities had not been able to get a proper VSAT license.
An encouraging result however is that the majority of the VSAT owning institutions (58%) said they had free licenses, in most cases through waivers for educational institutions.
The average annual cost of a VSAT license is US$13, 553. This average annual cost is far higher than the EU average of US$426, showing that VSAT is still expensive in Africa compared to the developed world.
Note: The figure is skewed toward the high side by some extreme cases -- with some institutions required to pay as much as US$72, 000 (Zimbabwe) compared to some paying as little as US$267 (Rwanda).
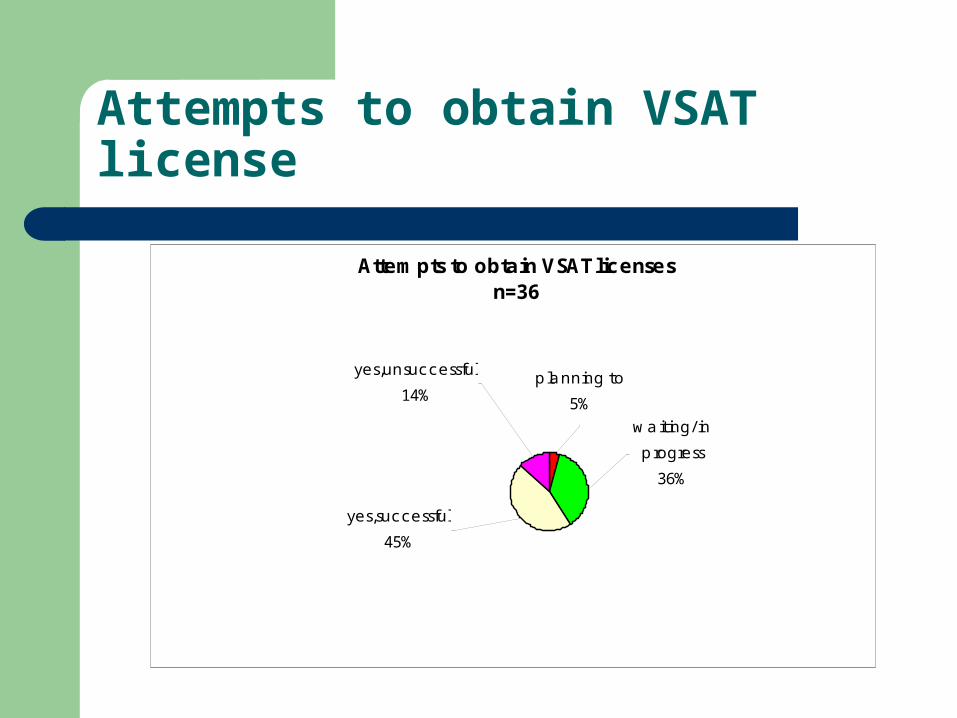
Attempts to obtain VSAT license
Attempts to obtain VSAT licensesn=36
planning to
5%waiting/ in
progress
36%
yes,successful
45%
yes,unsuccessful
14%
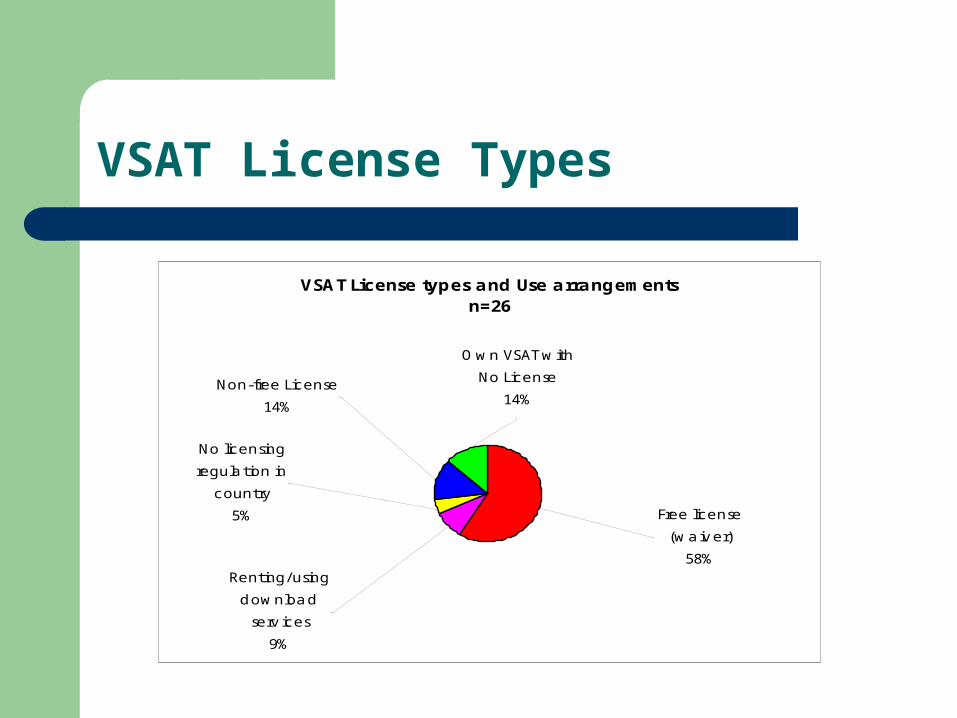
VSAT License Types
VSAT License types and Use arrangements n=26
Own VSAT with
No License
14%Non-free License
14%
No licensing
regulation in
country
5% Free license
(waiver)
58%Renting/using
download
serv ices
9%
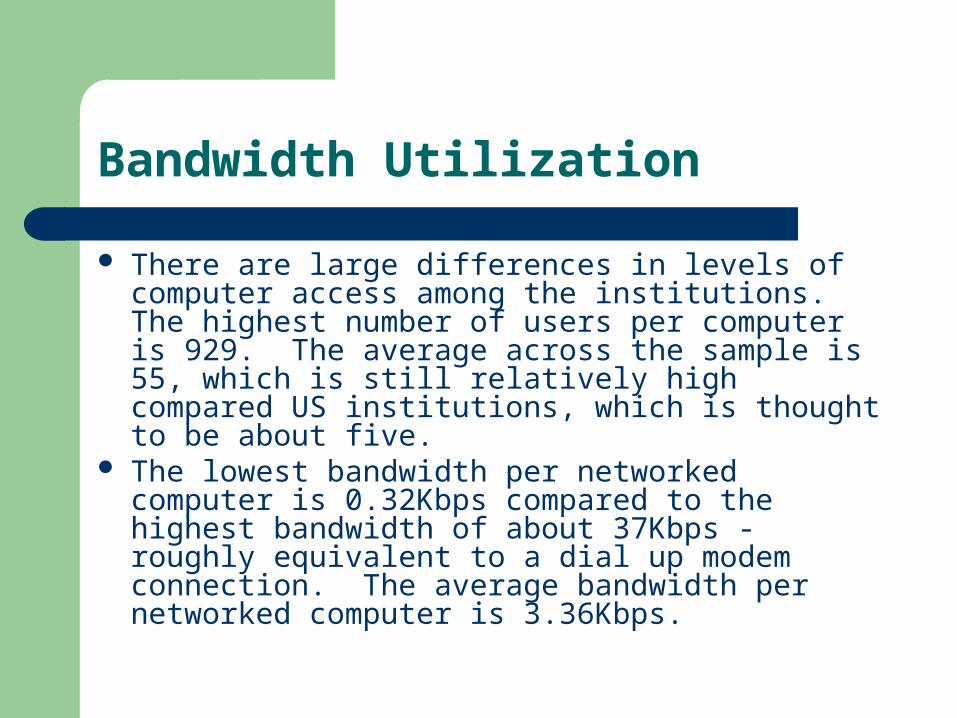
Bandwidth Utilization
There are large differences in levels of computer access among the institutions. The highest number of users per computer is 929. The average across the sample is 55, which is still relatively high compared US institutions, which is thought to be about five.
The lowest bandwidth per networked computer is 0.32Kbps compared to the highest bandwidth of about 37Kbps - roughly equivalent to a dial up modem connection. The average bandwidth per networked computer is 3.36Kbps.

Average users per networked computer by Region
Users per networked computers by regionsn=66
11
171
50
63
15
55
0 50 100 150 200
Southern Africa
Central Africa
East Africa
West Africa
North Africa
Average
Regions
Average number of users per networked computer
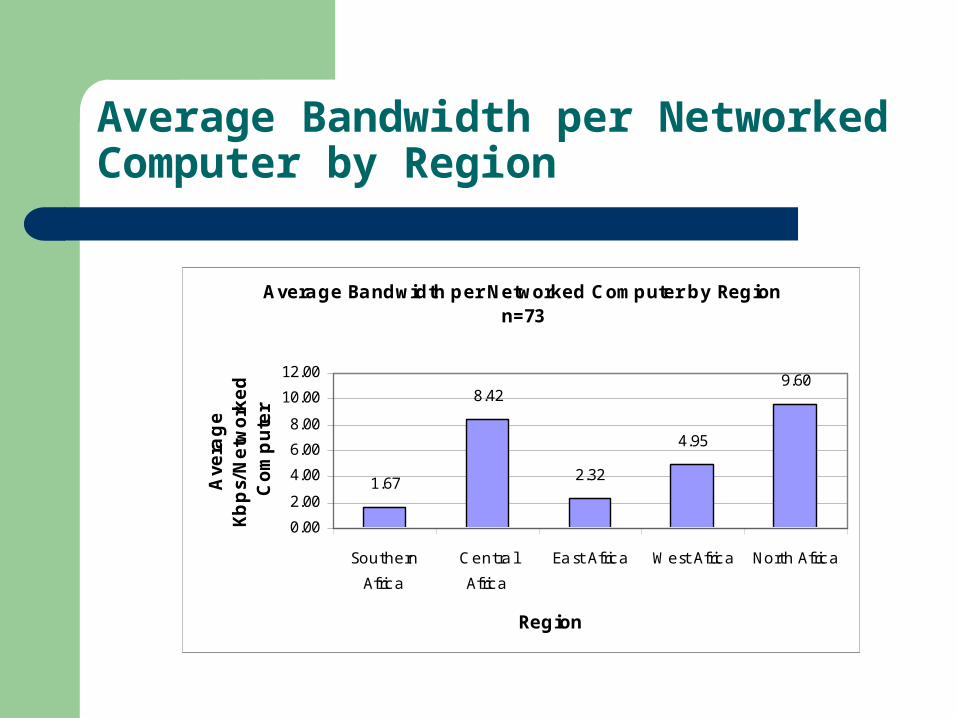
Average Bandwidth per Networked Computer by Region
Average Bandwidth per Networked Computer by Regionn=73
1.67
8.42
2.32
4.95
9.60
0.00
2.00
4.00
6.00
8.00
10.00
12.00
Southern
Africa
Central
Africa
East Africa West Africa North Africa
Region
Ave
rage
Kbps/
Netw
ork
ed
Com
pute
r
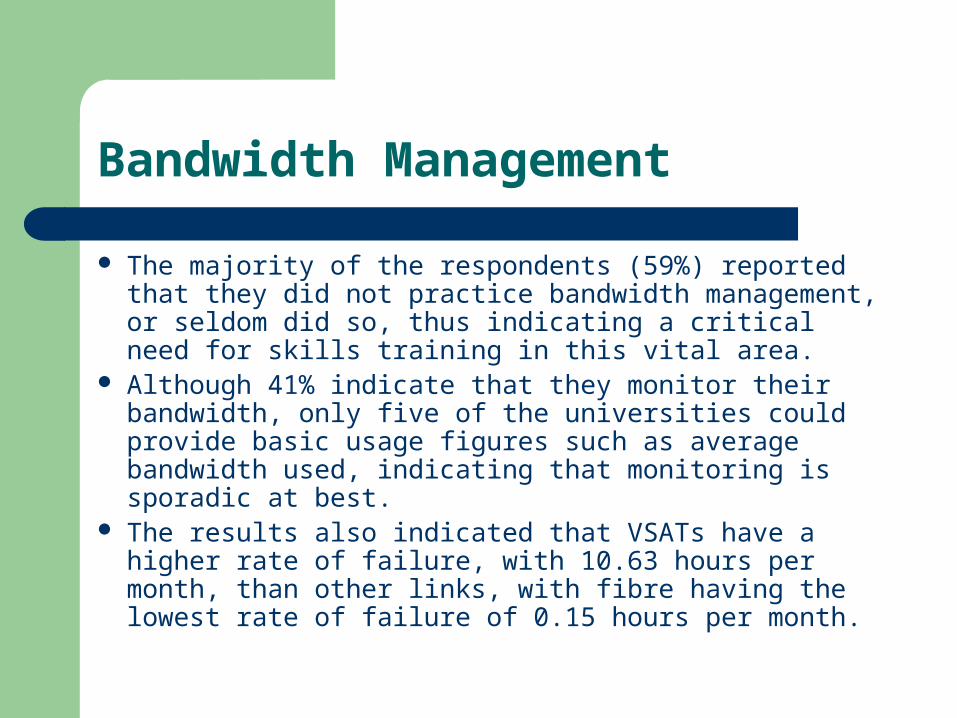
Bandwidth Management
The majority of the respondents (59%) reported that they did not practice bandwidth management, or seldom did so, thus indicating a critical need for skills training in this vital area.
Although 41% indicate that they monitor their bandwidth, only five of the universities could provide basic usage figures such as average bandwidth used, indicating that monitoring is sporadic at best.
The results also indicated that VSATs have a higher rate of failure, with 10.63 hours per month, than other links, with fibre having the lowest rate of failure of 0.15 hours per month.

Bandwidth and ICT initiatives
While 45% have a written e-learning/IT strategy an almost equal 42% do not.
Perhaps more significantly, only 8 countries in Africa currently have National Educational & Research Networks, and only 22% of the institutions surveyed are members of these networks.
Bandwidth Requirements
Universities need at least 10 times what they currently have.
In comparing current bandwidth with estimated requirements for 73 Sub Saharan universities, calculation shows that bandwidth requirements are at least 10 times the current usage.
This represents the capacity of 5 to 10 transponders if a VSAT solution was to be put in place.

Estimated Bandwidth Requirements
Estimated Total Bandwidth Requirements
n=73
59
816
0 100 200 300 400 500 600 700 800 900
Current
bandwidth
Bandwdith
required
Bandw
dith n
eeds
Mbps
Recommendations
1. Formation of Bandwidth Buying Consortium – could half the cost of bandwidth.
2. Improved Bandwidth Management.3. Centralized Network Management and
Technical Capacity.4. Improved Regulatory Policies
Regarding Educational Bandwidth.
African Virtual University
www.avu.org AVU intends to support existing institutions to
increase access to their demand driven programs through implementation of open, distance and e-learning technologies.
Objective is to create increased opportunities for access to higher education.
Initiated as a World Bank program and spun-out as an independent international organization in 2002.
Operating in 34 learning centers in 19 countries.

Challenges
Poor Internet connectivity to deliver programs. Limited access points to reach larger number of
students Low capacity for development and delivery of open,
distance and e-learning programs at partner universities.
No consensus on opensource tools for learning.

Opportunities
Consortia leader for bandwidth with Partnership for Higher Education.
Consortia leader for development of open, distance and e-learning content and courses.
Collaborative research, learning programs with Internet II community – delivery of courses of comparative advantage to the Internet II community universities.
Contribute to further collaboration on pulling together African universities to work together where economies of scale make sense.