engaging with infographics -...
TRANSCRIPT
ENGAGING
WITH
INFOGRAPHICS
By Susan Ecton with credit to Amy Loyall
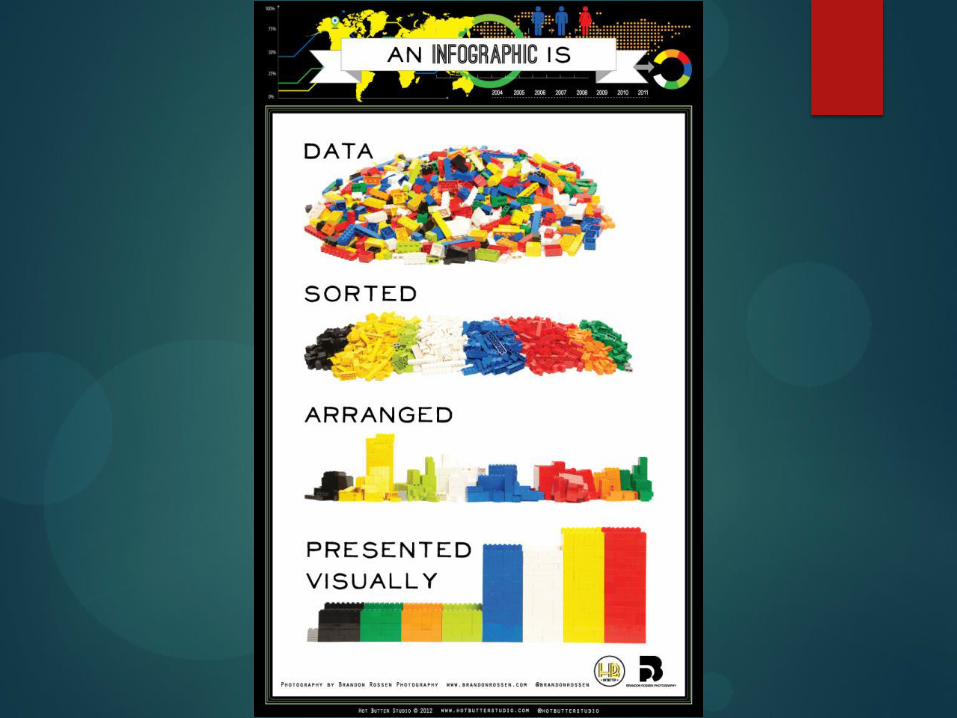
What is an
infographic?
Why infographics?
• The research & design necessary to construct
good infographics address many information
literacy standards.
• Our students are hit with information from all
directions. Infographics are a way to make
sense of this information.
• Infographics combine linguistic and non-
linguistic systems, using both words and visuals.
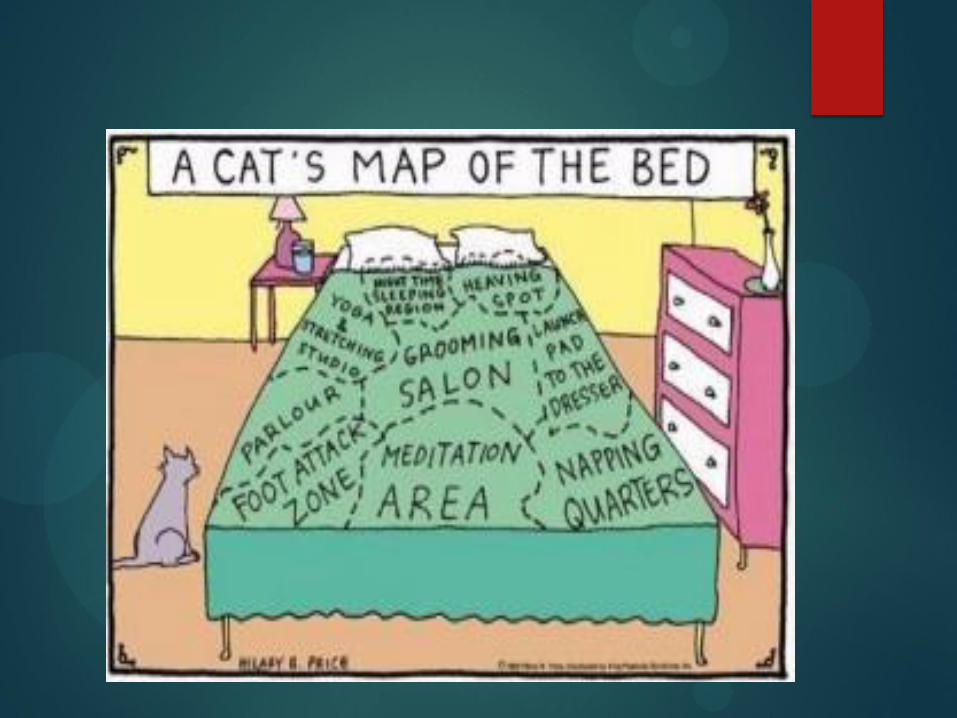
• They’re engaging!
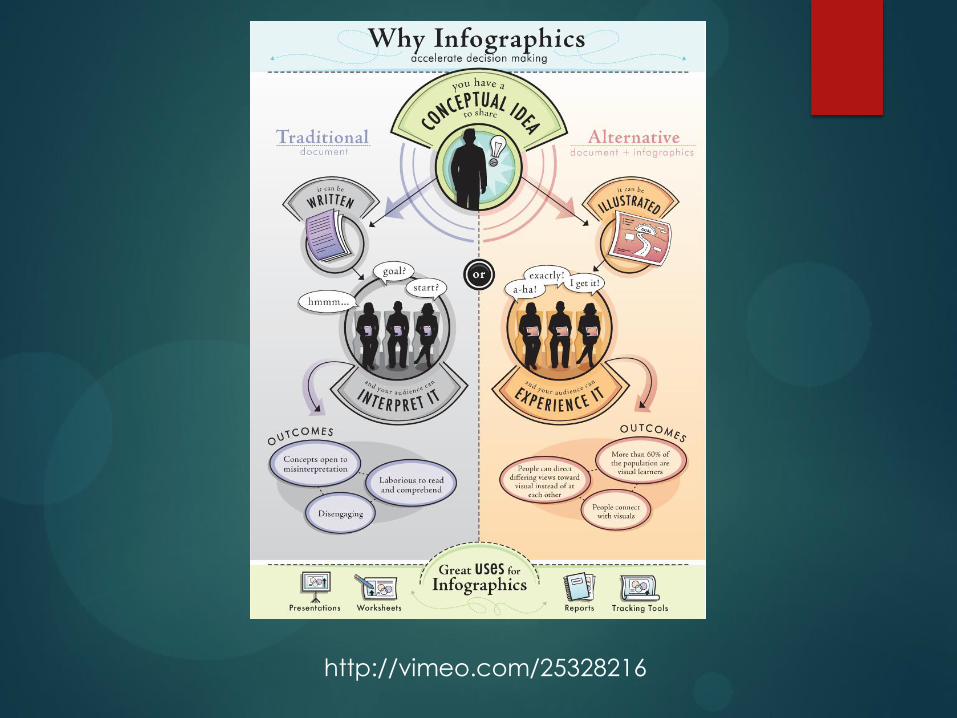
http://vimeo.com/25328216
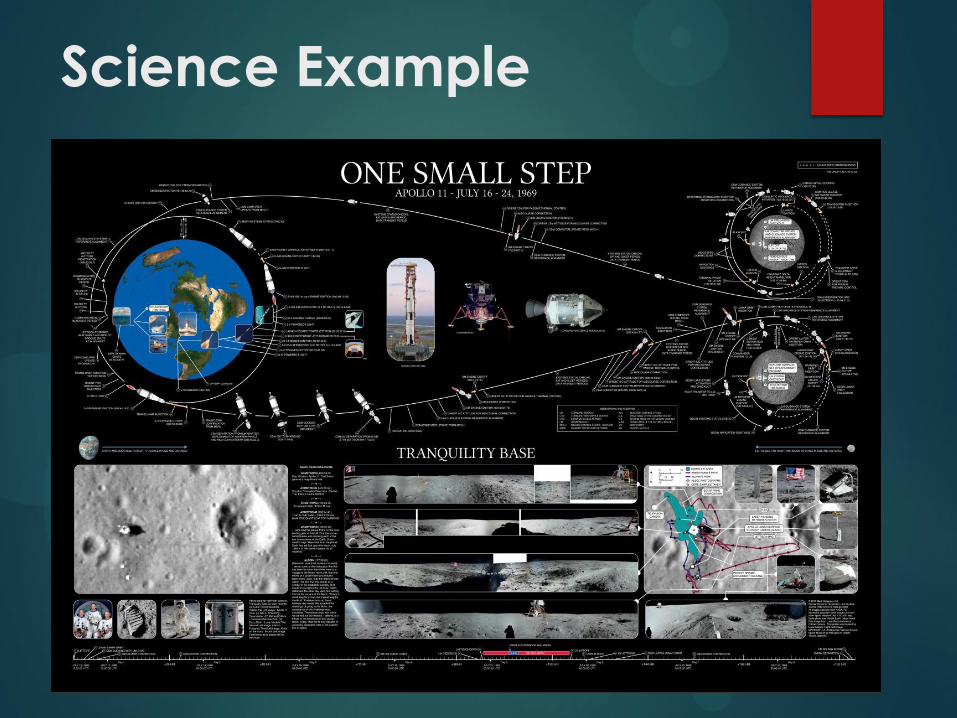
Science Example
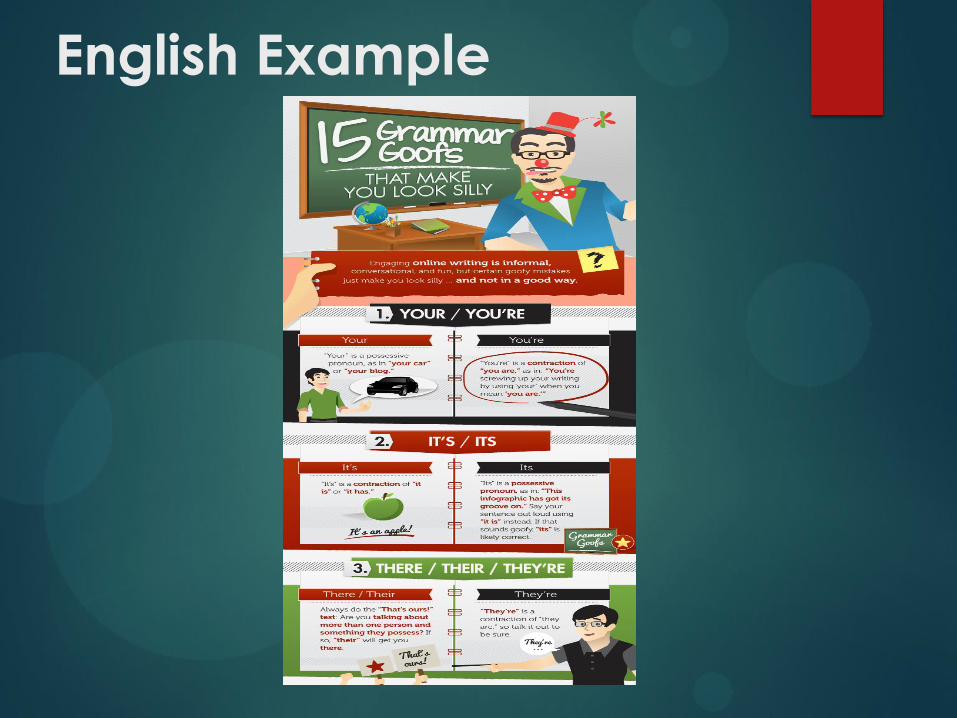
English Example
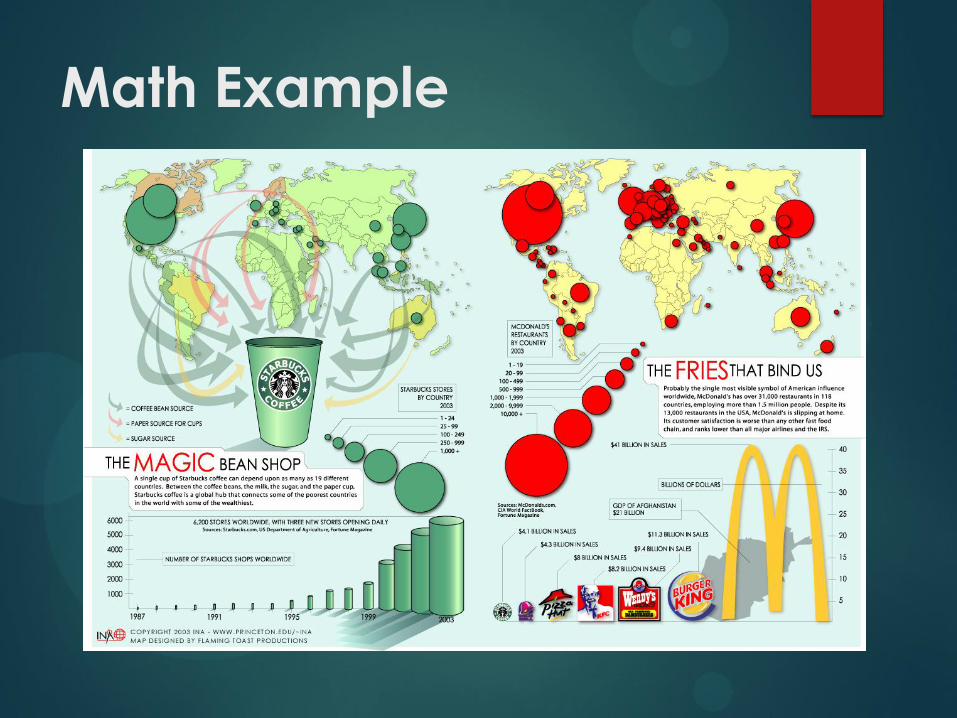
Math Example
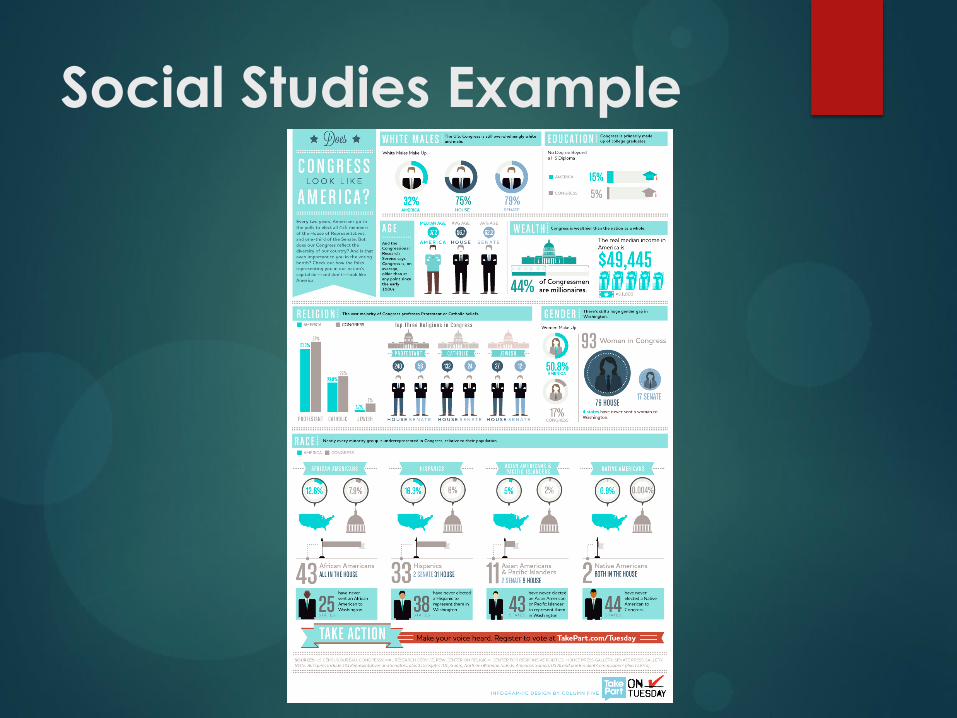
Social Studies Example
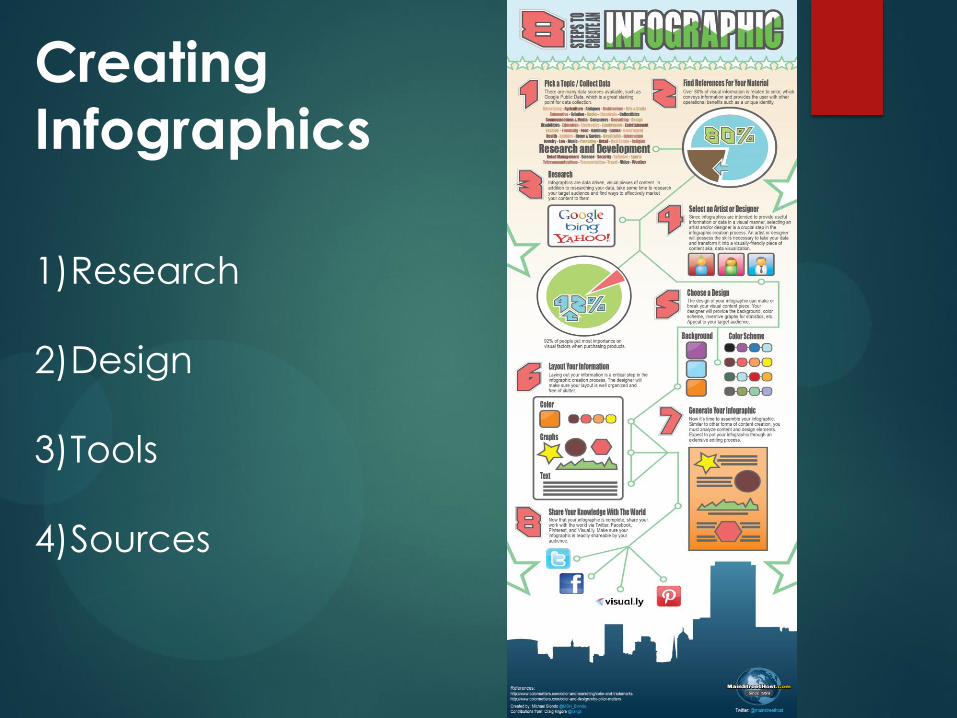
Creating
Infographics
1)Research
2)Design
3)Tools
4)Sources
Research
And research and research and research . . .
Good, quality infographics rely on accurate, current information (just like any paper or presentation would).
http://www.findthedata.org/ http://www.gapminder.org
Design
• Purpose & audience
• Flowcharts and/or
storyboards
• Colors & graphics
A Periodic Table of Data Visualizations http://www.visual-
literacy.org/periodic_table/periodic_table.html
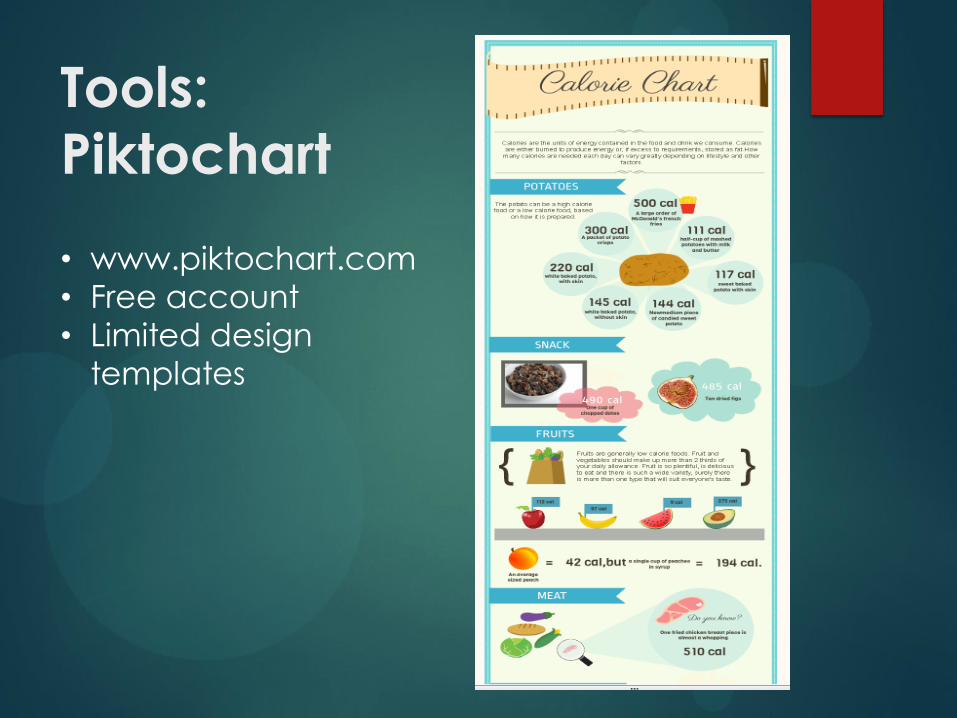
Tools: Piktochart
• www.piktochart.com
• Free account
• Limited design
templates
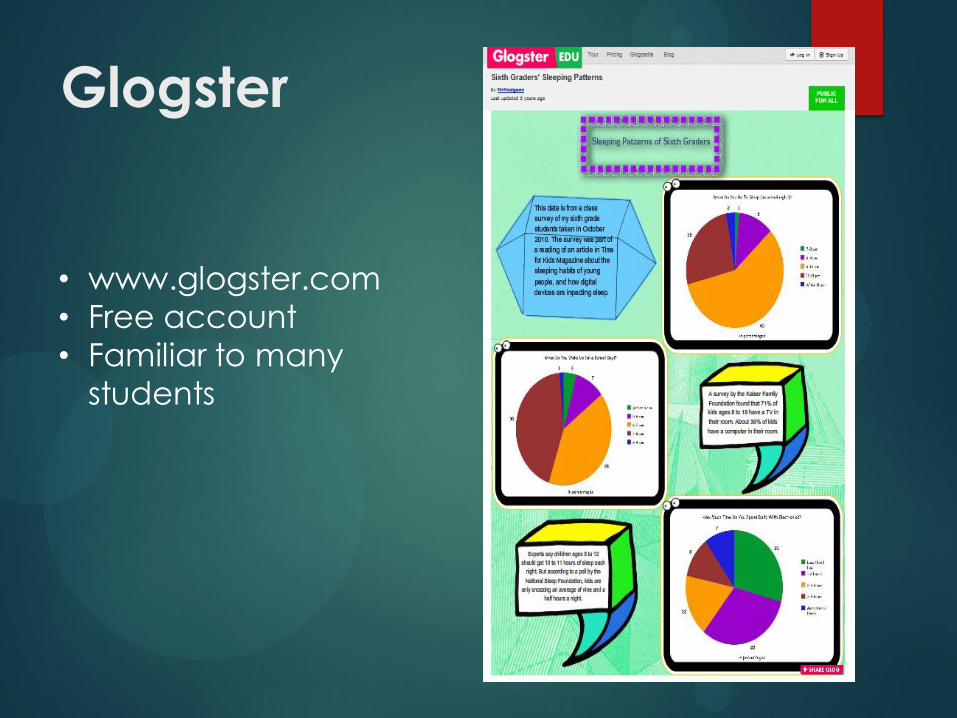
Glogster
• www.glogster.com
• Free account
• Familiar to many
students
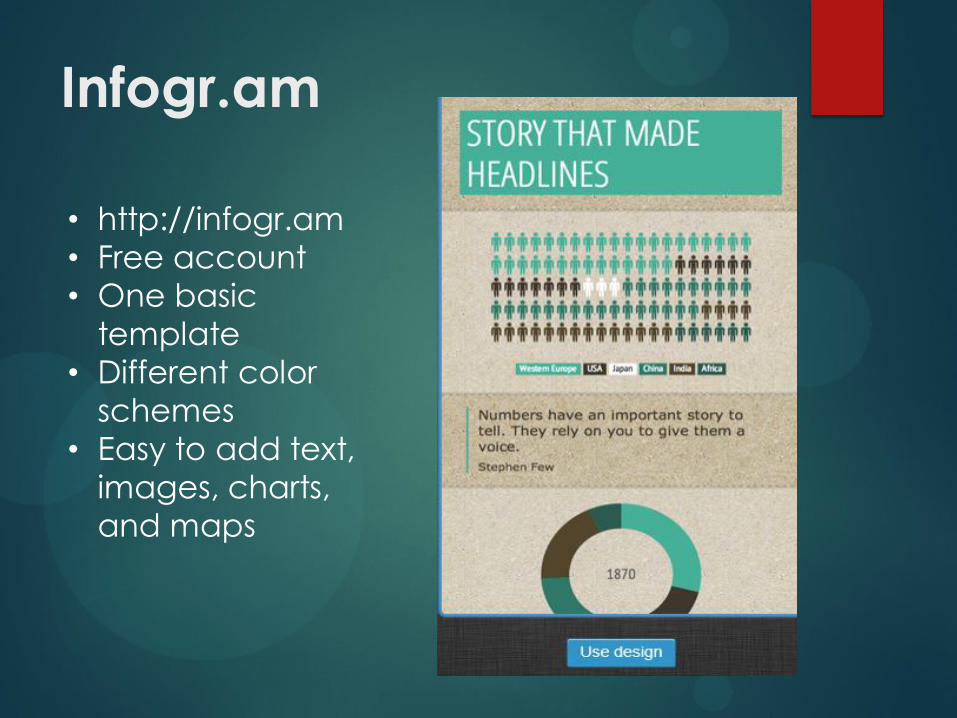
Infogr.am
• http://infogr.am
• Free account
• One basic
template
• Different color
schemes
• Easy to add text,
images, charts,
and maps
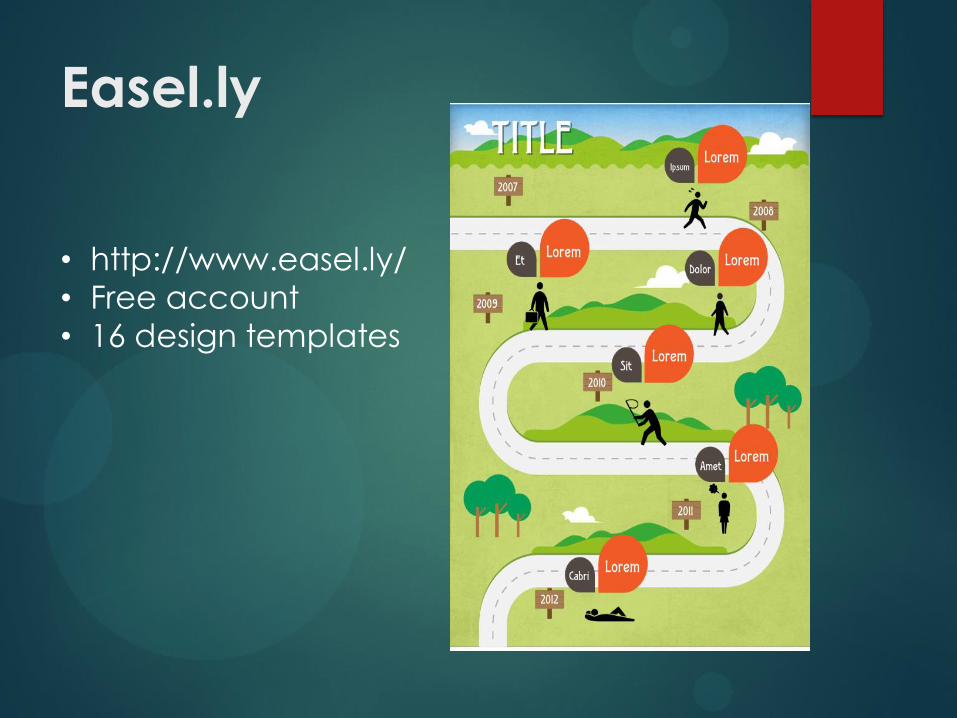
Easel.ly
• http://www.easel.ly/
• Free account
• 16 design templates
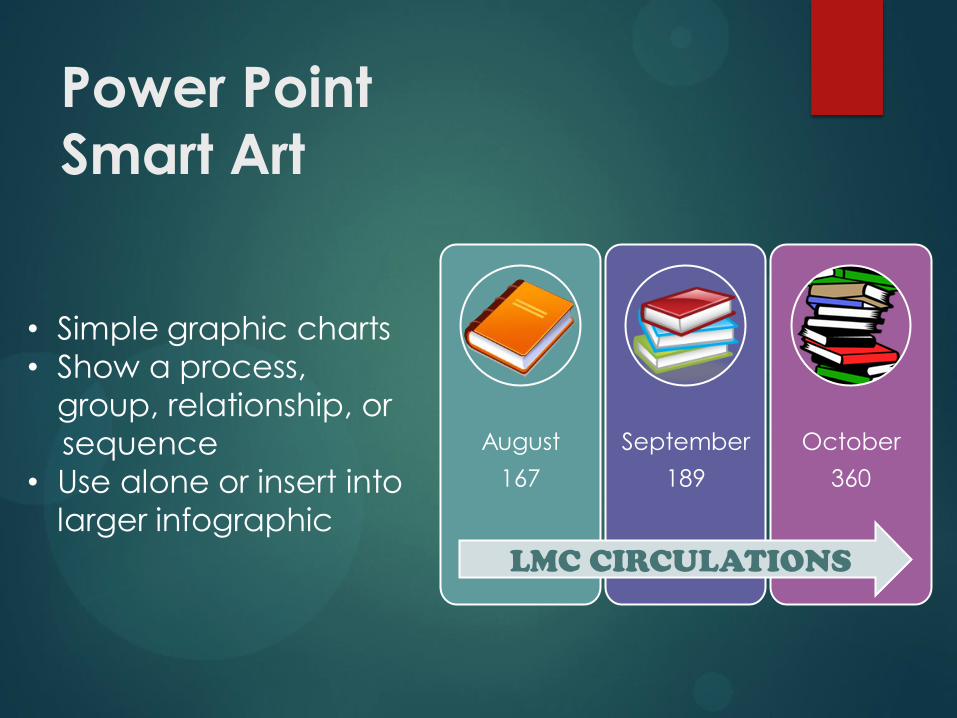
Power Point
Smart Art
August
167
September
189
October
360
LMC CIRCULATIONS
• Simple graphic charts
• Show a process,
group, relationship, or
sequence
• Use alone or insert into
larger infographic
Sources
As always, students should credit
sources. Sources could be listed at the bottom of the infographic or
turned in separately.
More than Words Can Say: Infographics http://www.eric.ed.gov/PDFS/EJ982831.pdf
Kathy Schrock’s Guide to Everything: Infographics http://www.schrockguide.net/infographics-as-an-assessment.html
Joyce Valenza Lib Guides: Infographics http://sdst.libguides.com/content.php?pid=192765&sid=1879620
Daily Infographic http://dailyinfographic.com/
Visual.ly http://visual.ly/
Live Binders http://www.livebinders.com/play/play?id=378690
Infographic Resources