enforcement and the stability and growth pact: how fiscal ...the stability and growth pact (sgp),...
TRANSCRIPT
WP/06/116
Enforcement and the Stability and Growth Pact: How Fiscal Policy Did and Did Not Change
Under Europe’s Fiscal Framework
Anthony Annett

© 2006 International Monetary Fund WP/06/116
IMF Working Paper
European Department
Enforcement and the Stability and Growth Pact: How Fiscal Policy Did and Did Not Change Under Europe’s Fiscal Framework
Prepared by Anthony Annett1
Authorized for distribution by Jörg Decressin
May 2006
Abstract
This Working Paper should not be reported as representing the views of the IMF. The views expressed in this Working Paper are those of the author(s) and do not necessarily represent those of the IMF or IMF policy. Working Papers describe research in progress by the author(s) and are published to elicit comments and to further debate.
The Stability and Growth Pact has been a success in numerous EU countries, especially in guiding them toward underlying fiscal balance ahead of population aging. These countries tend to be smaller, subject to greater macroeconomic volatility, and reliant on a form of fiscalgovernance that emphasizes targets and contracts. Most of the new members share these characteristics. For the countries less compatible with the Pact, domestic governance reforms that increase the reputational costs for noncompliance can be useful complements to the fiscal framework. JEL Classification Numbers: E61, H62 Keywords: Fiscal policy, enforcement, political economy Author(s) E-Mail Address: [email protected]
1 This paper was presented at a conference on “New Perspectives on Fiscal Sustainability,” held in Frankfurt, between October 13-14, 2005. I thank my discussant, Daniele Franco, the participants, as well as Fabrizio Balassone and Jörg Decressin for useful comments. An earlier version of this paper benefited from comments by Michael Deppler, Marcello Estevao, Hamid Faruqee, Mark Hallerberg, Albert Jaeger, Ludger Schuknecht, and Rolf Strauch.
- 2 -
Contents Page
I. Introduction ............................................................................................................................3
II. The Political Economy of Fiscal Frameworks ......................................................................4
III. Developments Under the Fiscal Framework........................................................................8
IV. Explaining Divergent Country Experiences: Empirical Results .......................................14
V. Conclusion ..........................................................................................................................26
References................................................................................................................................28
Tables
1. Fiscal Governance in the European Union, 1981–2004 ........................................................6 2. Fiscal Developments in the European Union, 1980–2004...................................................12 3. Fiscal Adjustment under the SGP........................................................................................13 4. Fiscal Policy Determination in the European Union, 1980–2004 .......................................18 5. Fiscal Policy Behavior in Europe Before and After Maastricht ..........................................20 6. Fiscal Policy Behavior in Europe Before and After SGP....................................................21 7. Forecast Errors Under Stability Programs, 1999–2004 .......................................................24 8. New and Acceding EU Members: Some Stylized Facts......................................................27
Figures
1. Overall and Structural Balance in the Euro Area, 2004.......................................................10 2. Structural Balance in Large versus Small Countries in the Euro Area, 1999–2004............11 3. Percentage of Positive Forecast Errors for Overall Balance, 1999–2004............................25
- 3 -
I. INTRODUCTION
The Stability and Growth Pact (SGP), Europe’s seven-year-old fiscal framework, fleshes out the policy provisions laid down by the Maastricht treaty. The treaty, adopted in 1992, provides for a two-pronged fiscal framework—a preventive arm focusing on multilateral surveillance and the avoidance of excessive deficits, and a dissuasive arm addressing gross policy mistakes. The SGP in a narrow sense, introduced in 1998 and revised in 2005, fleshed out these provisions. The preventive arm deals with maintaining a sound fiscal policy. The SGP complements the 3 percent of GDP deficit limit by requiring countries to strive for a medium-term objective (MTO). Originally, countries were urged to attain a common “close-to-balance or in surplus” position, interpreted as a deficit no larger than ½ percent of GDP over the cycle, the idea being to provide a sufficient cyclical safety margin to allow full operation of automatic stabilizers during downturns without breaching the 3 percent reference value. In the 2005 revision, however, countries could set their own MTOs based on sustainability factors, within certain limits (including a maximum 1 percent of GDP deficit). Countries that have not attained their MTOs should target adjustment of ½ percent of GDP a year, net of one-offs and other temporary measures, and should commit to more adjustment in good times. They are allowed a temporary deviation from their MTO (or the adjustment path) for undertaking structural reforms. Countries submit annual Stability Programs, and the ECOFIN Council (comprising national finance ministers) offers an opinion, and can issue an early warning if it believes the 3 percent limit could be violated. The dissuasive arm, or the Excessive Deficit Procedure (EDP), is charged with ensuring that countries respect the limits on deficits (3 percent of GDP) and debt (60 percent of GDP) laid down by the Maastricht Treaty. If an excessive deficit is deemed to exist, countries are obliged to undertake corrective policies within a defined time frame. Noncomplying countries are subject to increasingly stringent surveillance, which can culminate in the imposition of financial penalties. One of the aims of the original SGP was to speed up the process as the country moves through the various stages and allow sanctions to be imposed within 10 months. The reforms of 2005 increased the amount of flexibility embedded in the procedure in a number of different ways, including loosening the escape clauses at the outset, lengthening deadlines for taking action, and expanding the circumstances under which longer adjustment periods are permitted. The emphasis also shifted somewhat from outcomes to measures, as countries are now expected to undertake a benchmark minimum adjustment of ½ percent of GDP, net of one-offs and other temporary measures. The Pact has faced frequent criticism and suffered from significant enforcement problems. Many countries, including the largest members of EMU, did not follow the dictum that called for countries to strive for underlying fiscal balance over the cycle. Nor were they fully successful in keeping their deficits below the crucial 3 percent of GDP benchmark. Problems also abounded on the procedural side. Yet enforcement has always been the Achilles’ heel of the SGP. This observation is not new. Kopits and Symansky (1998) include enforceability in their core characteristics of a good fiscal rule—the others being well-defined, transparent,
- 4 -
simple, flexible, adequate relative to the final goal, consistent, and underpinned by structural reforms. Observers such as Buti, Eijffinger, and Franco (2003) assign the lowest marks to enforcement when gauging the SGP framework against these criteria. Inman (1996) argued that, to be effective, a deficit rule needed four key characteristics: it should rely on ex post, not ex ante accounting; it should be constitutionally grounded; there should be open enforcement by a politically independent agent able to impose significant penalties; and it should be difficult to amend. Against this template, the SGP fares reasonably well, except for enforcement. Against this backdrop, this paper asks how the SGP can be made more enforceable. The paper is structured as follows. Section II explores the rationale for a fiscal framework, in light of the risk of politically induced deficit biases. Following from this, Section III discusses the experience of countries living under the fiscal framework, especially after the SGP came into effect. Section IV is concerned with why some countries coped better with the SGP than others, and offers some empirical results to that effect. Section V concludes by asking how the SGP can be made more enforceable in light of the results.
II. THE POLITICAL ECONOMY OF FISCAL FRAMEWORKS
A starting point is to recognize that the political architecture can distort fiscal policy. Indeed, a principal argument for placing limits on the degree of fiscal policy discretion stems from the fact that democratically elected governments seem to have a built-in bias toward excessive deficits and debt. This bias can be traced to a number of different political economy sources. • First, by the logic of the standard common pool model, politicians who represent
different groups and vested interests have no incentive to constrain their spending demands given that the costs are shared by the population as a whole. Politicians can represent different geographical regions, as in the pork-barrel approach to spending frequently associated with the United States, or different social groups in society, more common in the European context. In a dynamic environment, this externality can explain not only excess spending, but also deficit biases and delayed stabilization (Velasco, 1999).
• Second, politicians may be more myopic than the general public, especially if they are concerned with securing re-election. Opportunistic politicians will focus on short-term electoral gain, discounting the longer-term effects of running up debt. In this vein, a deficit bias can emerge from the tendency to loosen fiscal policy prior to an election, and to engage in other short-term, time-inconsistent, policy actions. Voters may also fail to fully understand the intertemporal budget constraint, such as the full extent of the fiscal burden imposed by aging.
Deficit biases may be even greater in a monetary union. Adopting a common currency means that exchange rate risk and the associated interest rate risk premium is no longer operable,
- 5 -
lessening the disciplining effect of fiscal policy. In an area-wide capital market, the ability to pass on at least some of the costs of profligate fiscal policy to other members can exacerbate the deficit bias and lead to a common pool problem for the monetary union as a whole. This could raise area-wide interest rates and generate inflationary pressures, all of which would put pressure on the common monetary policy framework. Moreover, price stability could be jeopardized if the monetary policymaker faces pressure to lower interest rates and inflate away the debt. Also, a country running into fiscal difficulties could be bailed out by other countries or by the central bank purchasing its debt, especially if this path would stave off a banking system crisis. Among advanced economies, the literature shows that a plethora of interrelated factors—large and disparate coalitions, a high number of spending ministers, proportional electoral systems, electoral uncertainty, and short government duration—can all act to feed the deficit bias and generate suboptimal fiscal policy (Roubini and Sachs, 1989; Grilli, Masciandaro, and Tabellini, 1991; Alesina and Perotti, 1995; Kontopoulis and Perotti, 1999; Annett, 2002; de Haan, Sturm, and Beekhuis, 1999). In particular, the kind of fragmented governments associated with electoral systems characterized by proportional representation lend themselves to the common pool problem. These tendencies can be exacerbated by weak budgetary institutions (Von Hagen, 1992; Von Hagen and Harden, 1996). Moreover, electoral considerations affected fiscal policy outcomes across European democracies (Alesina, Roubini, and Cohen, 1999), and these seemed most pronounced in the EU (Tujula and Wolswijk, 2004). There are a number of ways to overcome the deficit bias. In the first instance, governments can adopt formal fiscal rules that constrain the discretion of policymakers. In Europe, the SGP is a prime example. Some have suggested complementing the SGP with such national rules as expenditure ceilings (Mills and Quinet, 2002), a system of rainy day funds (Buti, Eijffinger, and Franco, 2003), or internal stability pacts between central and local governments (European Commission, 2003). But two other ways to tackle politically induced distortions can complement fiscal rules: (i) institutional reforms, or (ii) the use of independent fiscal watchdogs to enhance accountability. Various institutional reforms can facilitate budgetary coordination and help overcome the deficit bias.2 First, the common pool problem can be overcome through the choice of an appropriate domestic agenda-setter. For example, the finance minister may be granted a leading role in the budget process (delegation). Budgetary coordination can also be achieved through commitment, whereby the different parties negotiate a “fiscal contract” involving strict budget targets, typically spending commitments. Commitment lends itself more to formal rules, while delegation is more comfortable with discretion. There is also a hybrid case, or a mixed system, whereby the ideal solution would look like a cross between the two
2 See von Hagen (1998); Hallerberg and von Hagen (1999); Hallerberg, Strauch and von Hagen (2001, 2004); von Hagen (2005).
- 6 -
polar cases of delegation and commitment—the finance minister is granted a strong role in setting the budget, and this is followed by a negotiated agreement with parliament (Hallerberg, 2004). Delegation may be more suited to single-party governments, or where there are few policy differences on the budget. Commitment is the more logical choice for diverse coalitions, where the threat of breaking up the government serves as the enforcement mechanism. Finally, the mixed system may work well with single-party minority governments, where the budget is set by one party and then negotiated with the opposition to secure passage through parliament. Countries have engaged in institutional reform using both delegation and commitment strategies. Based on detailed case studies, Hallerberg (2004) classifies the EU countries by forms of fiscal governance over the past two decades (Table 1). Historically, the norm has been fiefdom, where no attempt was made to internalize the common pool externality. Throughout the 1980s and early 1990s, however, more and more countries began to adopt reforms. In some cases, this preceded the Maastricht fiscal framework, but in other cases, the need to get the fiscal house in order to qualify for EMU may have been a motivating factor (Belgium, Italy, Greece). Even some of those countries with long-standing commitment technologies strengthened their institutions in the 1990s (Finland, Netherlands). Large countries like France, Germany, and the United Kingdom have maintained stable delegation technologies over the past few decades; they were joined by Italy (1996), Greece (1997), Austria (2000), and Spain (2001). Most of the other smaller countries adopted commitment.
Table 1. Fiscal Governance in the European Union, 1981–2004
Country Governance form
Austria Fiefdom until 1986; Commitment 1987-94; Fiefdom 1995;Commitment 1996-97; Fiefdom 1998-99; Delegation 2000-04.
Belgium Fiefdom until 1992; Commitment 1993-04.Denmark Fiefdom until 1981; Mixed 1981-2004.Finland Commitment, strengthened mid-1990s.France Delegation.Germany Delegation.Greece Fiefdom until 1996; Delegation 1997-2004.Ireland Fiefdom until 1987; Mixed 1988-91; Commitment 1992-2004.Italy Fiefdom until 1995; Delegation 1996-2004.Luxembourg Commitment.Netherlands Fiefdom until 1982; Commitment 1983-2004, strengthened 1994.Portugal Fiefdom.Spain Fiefdom until 1993; Mixed 1994-2000; Delegation 2001-04.Sweden Fiefdom until 1996; Mixed 1997-2004.United Kingdom Delegation.
Source: Hallerberg (2004).

- 7 -
As noted above, a further reform option would be to tie the policymaker’s hands by placing greater reliance on independent agencies. Pointing to the success of the committees guiding monetary policy in inflation-targeting central banks, Wyplosz (2005) recommends passing responsibility for setting annual budget balances to a council of independent experts with the aim of ensuring sustainability. But a major precondition for delegating a particular policy area to an independent body is that it not have a primarily distributive function or major distributive consequences (Alesina and Tabellini, 2003); clearly, fiscal policy does not qualify on these grounds. Indeed, this extreme form of fiscal agency would face daunting implementation hurdles given the implications for democratic accountability (IMF, 2005). While eschewing this extreme, there are a number of other possibilities for countries to consider: • First, they can charge independent agencies with producing macroeconomic and
fiscal projections. Some countries—including Austria, Belgium, and the Netherlands have indeed assigned the preparation of economic assumptions and projections to independent bodies.3 There is evidence within the EU that independent forecasts can eliminate systematic forecast biases that could otherwise feed through to deficit biases (Jonung and Larch, 2004).4
• Second, independent bodies could proffer normative assessments of fiscal policies, thus marking up reputational costs, while at the same time possessing no formal fiscal policy powers. In Belgium, the High Council of Finance recommends fiscal targets and provides normative policy assessments (Hallerberg 2004; IMF, 2005). Likewise, Denmark’s Economic Council—representing trade unionists, employers, the central bank, the government, and academics—evaluates both fiscal and structural policies, making recommendations where needed (IMF, 2005). Institutional arrangements in these countries helped contribute to a turnaround in fiscal policy (Hallerberg, 2004; IMF, 2005).
Some of the most successful countries tended to adopt multiple strategies. The Netherlands adopted a medium-term expenditure framework in 1994, a measure that also strengthened its underlying commitment technology. At the same time, it relied on the Central Planning Bureau to provide independent forecasts. Belgium adopted budgetary reforms in the early 1990s, by adopting the commitment form of governance and strengthening the role of the High Council of Finance. It also made use of independent forecasts. Complementarities
3 This varies from an informal agreement in Austria to a formal requirement in Belgium. In Belgium, the Federal Planning Bureau provides forecasts. In the Netherlands, the Central Planning Bureau is charged with producing independent economic forecasts and monitoring the state of public finances.
4 Outside Europe, Mühleisen and others (2005) show that Canada—which uses macroeconomic projections from a range of private sector and academic forecasters—tended to have cautious projections, leading to larger-than-expected fiscal surpluses.
- 8 -
abound, as fiscal agencies support the role of pre-existing institutions, including fiscal rules, by providing a clear benchmark against which policy can be assessed (IMF, 2005).
III. DEVELOPMENTS UNDER THE FISCAL FRAMEWORK
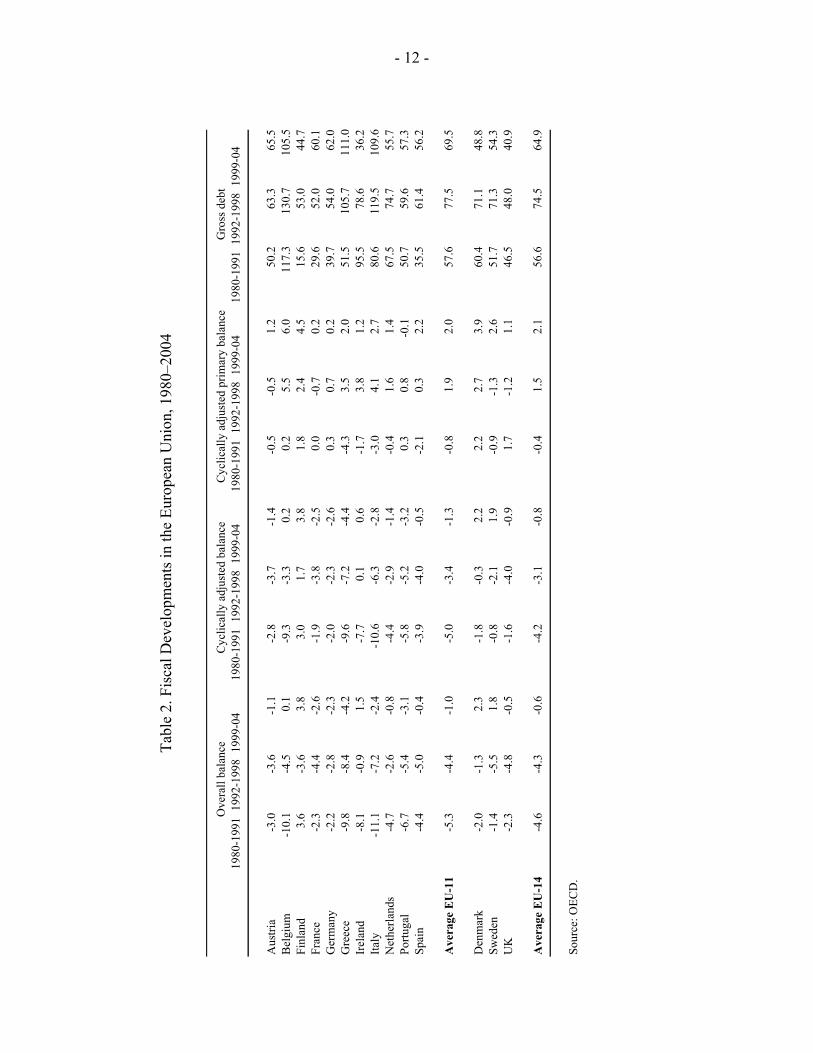
EU countries’ fiscal records were widely divergent prior to the signing of the Maastricht treaty. Many countries ran persistent and unsustainable deficits that fed through to rapid public debt accumulation—countries like Belgium, Greece, Ireland, and Italy saw their debt spiraling above 100 percent of GDP during the 1980s and early 1990s with deficits hovering around 10 percent of GDP. At the same time, however, deficits in core countries like France and Germany had traditionally been kept in check, and public debt accumulation remained moderate. Fiscal policy in EU countries tended to be highly procyclical, muffling in part or in full the operation of automatic fiscal stabilizers (European Commission, 2001). Procyclicality tended to be especially pronounced during good times (Jaeger, 2001; Debrun and Faruqee, 2004), and was seen as a leading cause of debt accumulation. The ratification of the Maastricht treaty spurred countries into action as they scrambled to meet the deficit criterion. Most countries underwent substantial fiscal adjustment in the 1990s (see IMF, 2001; von Hagen, Hughes Hallett, and Strauch, 2000; OECD, 2005). Comparing the Maastricht era (1992-98) with the period 1980-91 shows an average improvement in the cyclically adjusted primary balance—the measure of discretionary fiscal policy that will be used throughout this paper— of almost 3 percent of GDP among the euro-area countries (excluding Luxembourg), and 2 percent of GDP if the three EU15 members that have not adopted the euro are included (see Table 2). This includes some substantial adjustment in countries with profligate fiscal policy during the 1980s, including Belgium, Ireland, Greece, and Italy. As a result, by the onset of EMU in 1999, almost all of the present euro area membership had succeeded in the bringing their deficits below 3 percent of GDP. Experience under the SGP was more mixed, as the positive effect of Maastricht appeared to evaporate after the onset of EMU. On the one hand, the average overall balance among euro area countries improved greatly during the SGP period (1999-04), allowing the area as a whole to chalk up a better fiscal performance during these years than in other major currency areas. But this masked a distinct lack of underlying adjustment, given that the average cyclically-adjusted primary balance among euro area countries did not budge between the earlier (Maastricht) and later (SGP) periods (it deteriorated in half of the countries). In only three countries did the adjustment in the SGP period supersede that undertaken under Maastricht.5 Many have concluded that the standstill under the SGP reflected adjustment fatigue, especially after countries had qualified for EMU and the imminent threat of exclusion had passed (Hughes-Hallet, Lewis, and von Hagen, 2004; von Hagen, 2005). But
5 Interestingly, the three non-euro-area countries are also in this camp, perhaps because adjustment during the Maastricht era was less urgent for them.
- 9 -
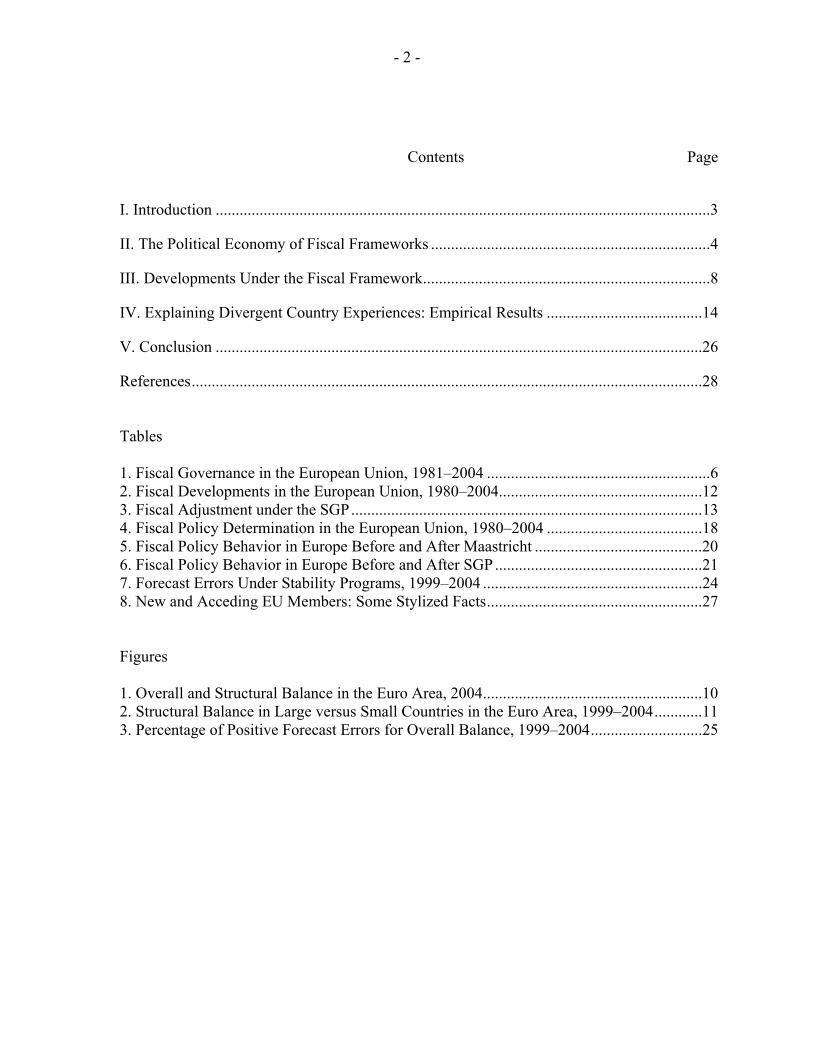
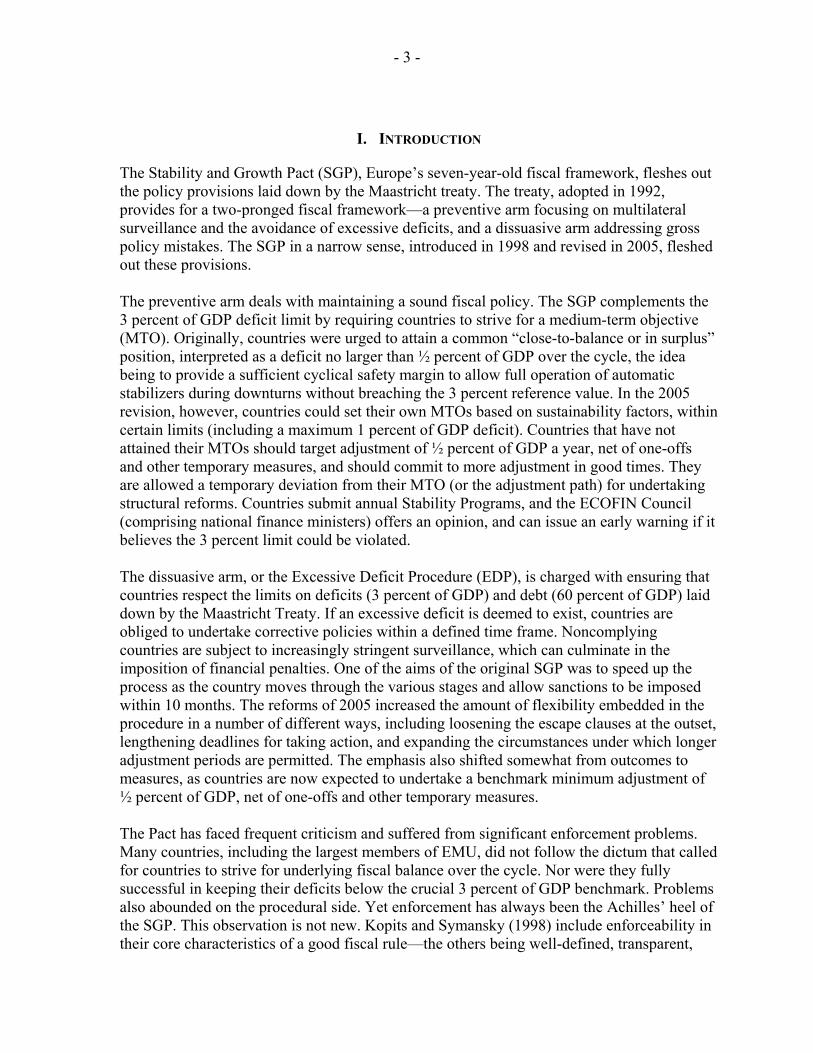
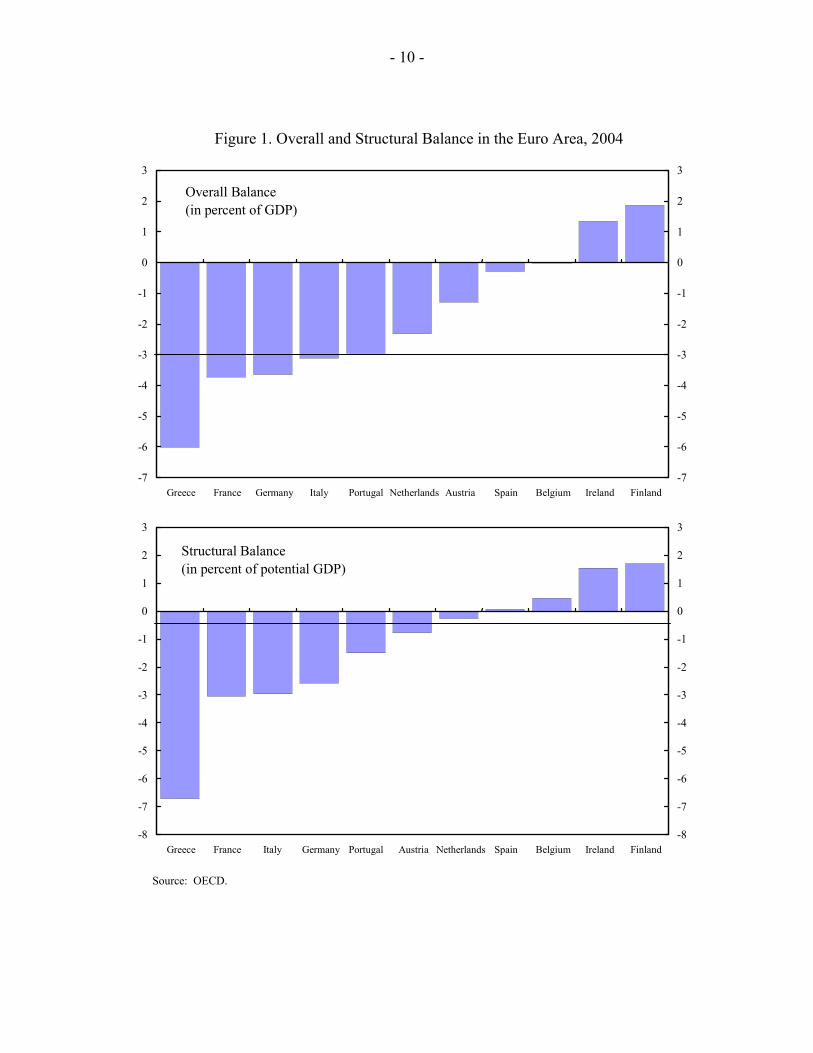
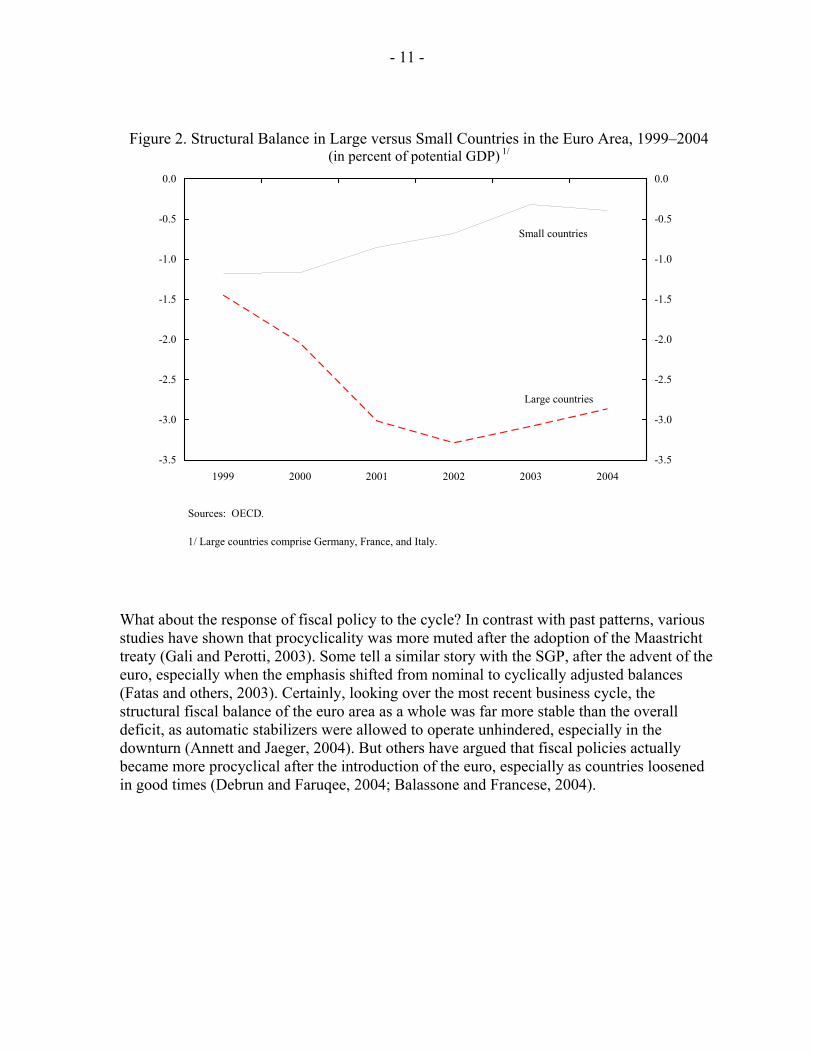
this is only part of the story, given the wide variations in starting positions. By the end of 2004, only half of the euro area countries had fiscal positions that could be deemed as “close-to-balance or in surplus,” defined as a minimum ½ percent cyclically adjusted deficit—Belgium, Finland, Ireland, Netherlands, and Spain (see Figure 1).6 Some of these countries could therefore afford to loosen, or to undertake minimal adjustment, and still comfortably meet the close-to-balance criterion. Others, however, remained far off, including France, Germany, Greece, Italy, and Portugal. As a result, these five countries ended up posting deficits in excess of 3 percent, pushing them into the EDP (Figure 1).7 One clear pattern, noted by many, is that a gulf opened up under the SGP between large and small countries (Annett and Jaeger, 2004; Buti and Pench, 2004; OECD, 2005; von Hagen, 2005). With the three largest countries seemingly unwilling to push for underlying balance, the Pact seems to have worked well for a core group of smaller countries, as well as Spain. Figure 2 shows the divergent trends between a weighted average of Germany, France, and Italy on the one hand, and a weighted average of the other euro-area countries on the other. Ironically, the traditional bastions of fiscal stability in Europe—France and Germany—were shunted to the bottom of the pack.
6 Denmark and Sweden were also in this boat.
7 From outside the euro area, the UK also posted a deficit in excess of 3 percent in 2004.
- 10 -
Figure 1. Overall and Structural Balance in the Euro Area, 2004
Source: OECD.
Overall Balance (in percent of GDP)
-7
-6
-5
-4
-3
-2
-1
0
1
2
3
Greece France Germany Italy Portugal Netherlands Austria Spain Belgium Ireland Finland-7
-6
-5
-4
-3
-2
-1
0
1
2
3
Structural Balance(in percent of potential GDP)
-8
-7
-6
-5
-4
-3
-2
-1
0
1
2
3
Greece France Italy Germany Portugal Austria Netherlands Spain Belgium Ireland Finland-8
-7
-6
-5
-4
-3
-2
-1
0
1
2
3
- 11 -
Figure 2. Structural Balance in Large versus Small Countries in the Euro Area, 1999–2004 (in percent of potential GDP) 1/
Sources: OECD.
1/ Large countries comprise Germany, France, and Italy.
-3.5
-3.0
-2.5
-2.0
-1.5
-1.0
-0.5
0.0
1999 2000 2001 2002 2003 2004-3.5
-3.0
-2.5
-2.0
-1.5
-1.0
-0.5
0.0
Small countries
Large countries
What about the response of fiscal policy to the cycle? In contrast with past patterns, various studies have shown that procyclicality was more muted after the adoption of the Maastricht treaty (Gali and Perotti, 2003). Some tell a similar story with the SGP, after the advent of the euro, especially when the emphasis shifted from nominal to cyclically adjusted balances (Fatas and others, 2003). Certainly, looking over the most recent business cycle, the structural fiscal balance of the euro area as a whole was far more stable than the overall deficit, as automatic stabilizers were allowed to operate unhindered, especially in the downturn (Annett and Jaeger, 2004). But others have argued that fiscal policies actually became more procyclical after the introduction of the euro, especially as countries loosened in good times (Debrun and Faruqee, 2004; Balassone and Francese, 2004).
- 12 -
Ta
ble
2. F
isca
l Dev
elop
men
ts in
the
Euro
pean
Uni
on, 1
980–
2004
Tabl
e 2.
Fis
cal D
evel
opm
ents
in th
e Eu
rope
an U
nion
, 198
0-20
04
Ove
rall
bala
nce
Cyc
lical
ly a
djus
ted
bala
nce
Cyc
lical
ly a
djus
ted
prim
ary
bala
nce
Gro
ss d
ebt
1980
-199
1 19
92-1
998
1999
-04
1980
-199
119
92-1
998
1999
-04
1980
-199
1 19
92-1
998
1999
-04
1980
-199
119
92-1
998
1999
-04
Aus
tria
-3.0
-3.6
-1
.1-2
.8-3
.7-1
.4-0
.5
-0.5
1.2
50.2
63.3
65.5
Bel
gium
-1
0.1
-4.5
0.
1-9
.3-3
.30.
20.
2 5.
56.
011
7.3
130.
710
5.5
Finl
and
3.6
-3.6
3.
83.
01.
73.
81.
8 2.
44.
515
.653
.044
.7Fr
ance
-2.3
-4.4
-2
.6-1
.9-3
.8-2
.50.
0 -0
.70.
229
.652
.060
.1G
erm
any
-2.2
-2.8
-2
.3-2
.0-2
.3-2
.60.
3 0.
70.
239
.754
.062
.0G
reec
e-9
.8-8
.4
-4.2
-9.6
-7.2
-4.4
-4.3
3.
52.
051
.510
5.7
111.
0Ir
elan
d-8
.1-0
.9
1.5
-7.7
0.1
0.6
-1.7
3.
81.
295
.578
.636
.2Ita
ly
-11.
1 -7
.2
-2.4
-10.
6-6
.3-2
.8-3
.0
4.1
2.7
80.6
119.
510
9.6
Net
herla
nds
-4.7
-2.6
-0
.8-4
.4-2
.9-1
.4-0
.4
1.6
1.4
67.5
74.7
55.7
Portu
gal
-6.7
-5.4
-3
.1-5
.8-5
.2-3
.20.
3 0.
8-0
.150
.759
.657
.3Sp
ain
-4.4
-5.0
-0
.4-3
.9-4
.0-0
.5-2
.1
0.3
2.2
35.5
61.4
56.2
Ave
rage
EU
-11
-5.3
-4.4
-1
.0-5
.0-3
.4-1
.3-0
.8
1.9
2.0
57.6
77.5
69.5
Den
mar
k -2
.0-1
.3
2.3
-1.8
-0.3
2.2
2.2
2.7
3.9
60.4
71.1
48.8
Swed
en
-1.4
-5.5
1.
8-0
.8-2
.11.
9-0
.9
-1.3
2.6
51.7
71.3
54.3
UK
-2
.3-4
.8
-0.5
-1.6
-4.0
-0.9
1.7
-1.2
1.1
46.5
48.0
40.9
Ave
rage
EU
-14
-4.6
-4.3
-0
.6-4
.2-3
.1-0
.8-0
.4
1.5
2.1
56.6
74.5
64.9
Sour
ce: O
ECD
.
- 13 -
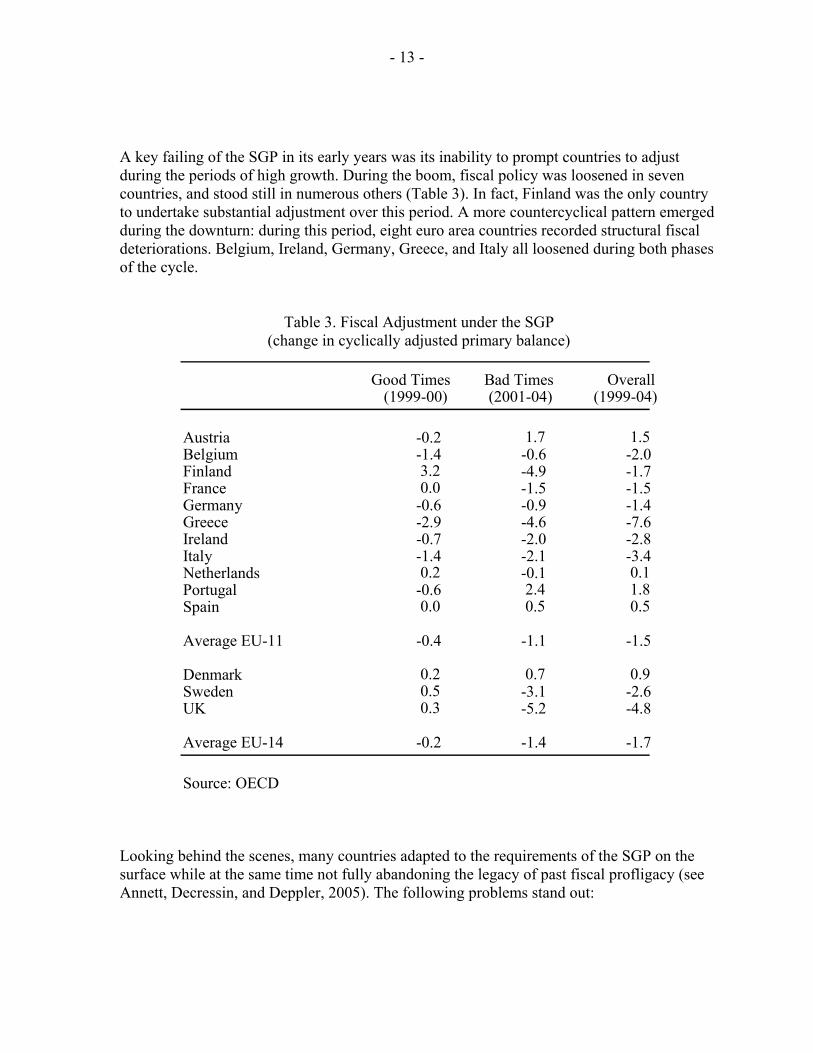
A key failing of the SGP in its early years was its inability to prompt countries to adjust during the periods of high growth. During the boom, fiscal policy was loosened in seven countries, and stood still in numerous others (Table 3). In fact, Finland was the only country to undertake substantial adjustment over this period. A more countercyclical pattern emerged during the downturn: during this period, eight euro area countries recorded structural fiscal deteriorations. Belgium, Ireland, Germany, Greece, and Italy all loosened during both phases of the cycle.
Table 3. Fiscal Adjustment under the SGP (change in cyclically adjusted primary balance)
Good Times Bad Times Overall(1999-00) (2001-04) (1999-04)
Austria -0.2 1.7 1.5 Belgium -1.4 -0.6 -2.0 Finland 3.2 -4.9 -1.7 France 0.0 -1.5 -1.5 Germany -0.6 -0.9 -1.4 Greece -2.9 -4.6 -7.6 Ireland -0.7 -2.0 -2.8 Italy -1.4 -2.1 -3.4 Netherlands 0.2 -0.1 0.1 Portugal -0.6 2.4 1.8 Spain 0.0 0.5 0.5
Average EU-11 -0.4 -1.1 -1.5
Denmark 0.2 0.7 0.9 Sweden 0.5 -3.1 -2.6 UK 0.3 -5.2 -4.8
Average EU-14 -0.2 -1.4 -1.7
Source: OECD
Looking behind the scenes, many countries adapted to the requirements of the SGP on the surface while at the same time not fully abandoning the legacy of past fiscal profligacy (see Annett, Decressin, and Deppler, 2005). The following problems stand out:
- 14 -
• Overly optimistic assumptions: Numerous countries relied on overly-optimistic growth assumptions, reducing the pressure to plan substantial medium-term adjustment (Jonung and Larch, 2004; Strauch, Hallerberg, and von Hagen, 2004). This strategy allowed governments to show favorable ex ante outcomes, while allowing them to blame poor ex post outcomes on the economy. Also, persistently over optimistic estimates of potential growth made underlying balances look healthier than they were at the time, again leading to looser ex post fiscal policy evaluations.
• One-offs, creative accounting, and misreporting: The emphasis on numerical values, particularly the enshrined 3 percent deficit limit, created incentives to circumvent the rule without actually undertaking the requisite adjustment.8 Some countries made substantial recourse to one-offs, creative accounting, and fiscal gimmicks over the life of both the Maastricht treaty and the SGP (Koen and van den Noord, 2005; von Hagen and Wolff, 2004). In the most obvious examples of this tendency, misreporting of data in Greece and Portugal led to huge ex post adjustments of fiscal data.
• Elections: Electorally motivated fiscal policy under EMU may have contributed to an expansionary bias in numerous countries. Governments tended to cut taxes and increase spending as elections approach, and this effect was more pronounced in upswings (Buti and van den Noord, 2004). The electoral calendar happened to be quite full immediately after the expansion in the early years of EMU.
IV. EXPLAINING DIVERGENT COUNTRY EXPERIENCES: EMPIRICAL RESULTS
Why did the SGP work better for some countries than others? It prompted numerous countries to attain underlying balance positions or better. But it also failed to spur a number of other countries to undertake the needed adjustment. A number of possible explanations have been raised to explain the emerging division between euro-area (and EU) countries when it comes to domestic enforcement of the SGP. First, some have argued that the SGP is inherently more suited to small countries. Adherents of this position see it as no coincidence that the largest three members have been the ones facing the greatest difficulty with the SGP. This argument comes in various hues: • Political: Small countries are simply more accustomed to external influences over
policy (Von Hagen, 1998; Von Hagen, Hughes Hallett, and Strauch, 2000). Also, as they tend to have less bargaining power, the loss of reputation from violating the fiscal rule is greater (De Haan, Berger, and Jansen, 2003). Small countries could also
8 Myopic governments discount the future heavily, meaning that they are more inclined to run down public assets (including the present value of future tax payments). Examples include privatization, cuts in public investment; cuts in operations and maintenance spending; shifting expenditure and revenue over time; and eating into the net present value of contributions and benefits of an entitlement program (OECD, 2005).
- 15 -
fear tangible pecuniary losses such as reductions in structural funds. Large countries may view the cost of profligate fiscal policy to be low, given that they suffer little diminution in reputation. Others note that while the Maastricht criteria were fully supported by the large countries, the political ownership of the fiscal rules subsequently shifted to the smaller countries which valued sound fiscal positions but had little influence with their peers (OECD, 2005).
• Economic: The costs of fiscal consolidation tend to be higher in large countries (Buti and Pench, 2004). According to this Keynesian argument, fiscal multipliers are greater in large countries, which makes consolidation significantly costlier.
This argument is appealing in the sense that it can account for the divergence in fiscal policy between the large and small countries under the SGP (Figure 2), but it cannot explain the sizable fiscal lapses of two small countries, Greece and Portugal, or the favorable performance of one large country, Spain. Second, the SGP could act as an external anchor for countries prone to macroeconomic volatility. Such countries many be more accepting of a rules-based framework. Especially in the context of EMU, such a fiscal framework can prove especially valuable to anchor policies and garner credibility. In this sense, the SGP can be seen to take over the role once played by exchange-rate coordination mechanisms such as the Bretton Woods system. Moreover, there is a noted tendency for countries facing greater external risk to compensate in the form of a larger government (Rodrik, 1998), which in turn can have a stabilizing effect on output (Fatas and Mihov, 2001). Absent a disciplining device on the fiscal balance, however, the provision of social insurance could bolster the tendencies toward time-inconsistent fiscal policies and lead to a deficit bias. In this context, the goal of underlying balance, allowing free play to automatic stabilizers, is especially appealing. Third, the SGP could be more suited to countries that adopt the commitment rather than the delegation form of fiscal governance (Hallerberg, 2004). With its emphasis on multi-annual targets and a regular review procedure, the SGP fits snugly with the numerical contracts approach associated with commitment states, but not so well with countries relying on domestic governance institutions. The main difference is that the mechanisms of the SGP rely on an external agent to enforce the fiscal contracts (von Hagen, Hughes Hallett, and Strauch, 2000). In delegation countries, fiscal policy will be based on domestic considerations and constraints, with fewer incentives to abide by SGP rules. In commitment states, on the other hand, the SGP reinforces domestic fiscal rules, and can provide an added impetus for all sides to live up to their side of the bargain. It can strengthen the commitment technology when external enforcement is superior to the domestic variety. The advantage of the fiscal governance hypothesis is that it can explain the behavior of all of the relatively weak performers under the SGP. France, Germany, Italy, and Greece are all delegation countries while Hallerberg (2004) singled out Portugal as the one country that did not reform its budgetary institutions in either a commitment or a delegation direction.
- 16 -
Certainly, fiscal policy behavior in the two long-standing delegation countries (France and Germany) has not changed much under the fiscal framework, suggesting that it has not made much on an impact on the prevailing form of fiscal governance. For Italy and Greece, the adoption of delegation during the Maastricht era coincided with dramatic deficit reduction, but adjustment tapered off under the SGP. These explanations are by no means mutually exclusive. Small countries tend to be more open, and more prone to external shocks (Alesina and Wacziarg, 1998). There is also a noted tendency for small, open economies to adopt proportional political systems, which in turn makes commitment more suitable (Rogowski, 1987). Moreover, it was the mainly the small countries that reformed their budgetary institutions, typically in the 1990s, to aid in achieving fiscal discipline. Indeed, some have argued that the large country–small country dichotomy that emerged was due to the fact that the large countries did little to improve their budgetary institutions (von Hagen, 2005). So the SGP could be suited to a subgroup of countries that (i) are small and more likely to accept an external constraint; (ii) have the potential for macroeconomic volatility and so appreciate an external anchor; and (iii) rely on the commitment form of fiscal governance. As a first step in trying to identify the various forces that shaped fiscal policymaking before and after the fiscal framework, a fiscal reaction function is estimated. The dependent variable in this analysis is the cyclically-adjusted primary balance, which reflects discretionary fiscal policy. Many empirical studies have estimated similar fiscal policy reaction functions but this paper follows in the footsteps of those—such as Gali and Perotti (2003), Balassone and Franco (2004), and Debrun and Faruqee (2004)—that sought to determine whether fiscal policymaking had changed following the advent of the fiscal framework. In particular, the baseline model will follow that of these works, focusing on a number of key economic influences on discretionary fiscal policy—including the economic cycle, lagged debt, and a persistence factor—supplemented by the relevant political factors. The following equation is fitted to the data:
tititi
titititititiiti
VOLSIZEDELCOMELECGAPDEBTBALBAL
,,8,7
,6,5,4,31,21,1,
εββ
ββββββα
+++
++++++= −−
where i denotes a country, t is a time subscript, and BAL denotes the cyclically-adjusted primary balance. The iα component denotes a country fixed effect. The regressors include a lagged dependent variable, the gross public debt ratio (DEBT); the output gap (GAP); a dummy for an election year (ELEC); a dummy for commitment or mixed forms of fiscal governance (COM)9; a dummy for delegation (DEL); relative economic size defined as the
9 For the purposes of the analysis in this section, “mixed” systems are placed under the commitment banner, given that these states also employ fiscal contracts and numerical targets, and should be compatible with the
(continued…)
- 17 -
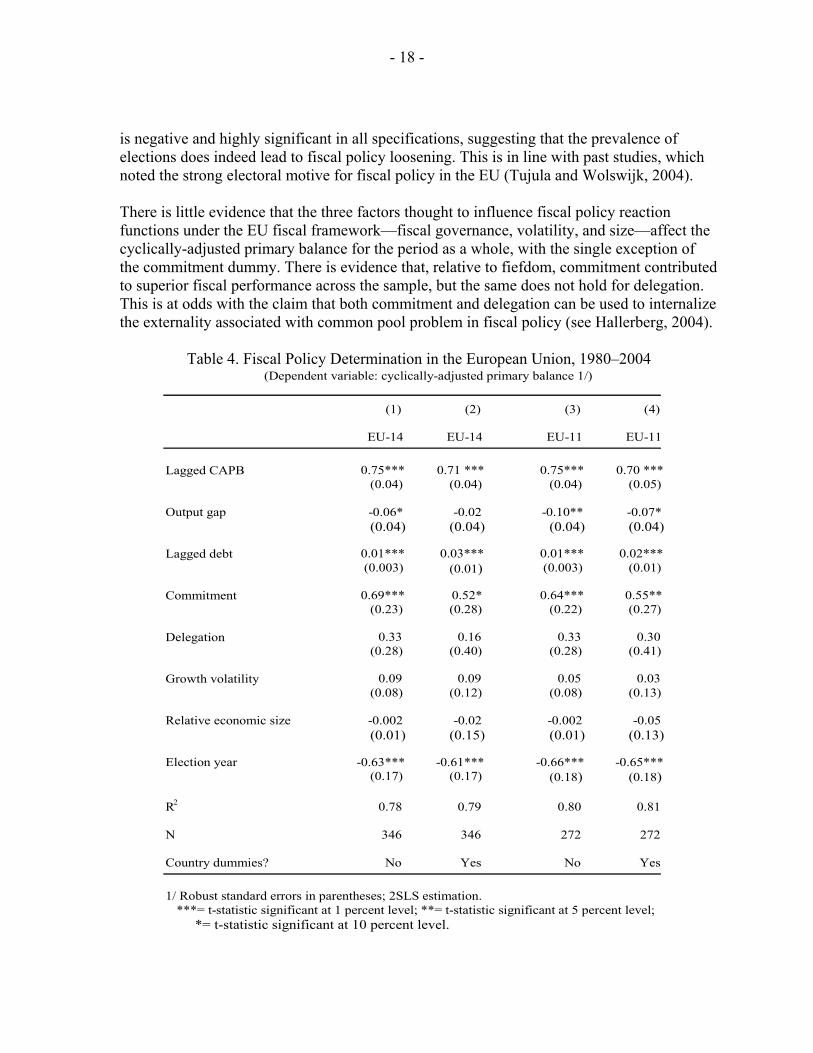
ratio of real GDP to the real GDP of the EU15 or to the real GDP of the EU12, depending on the sample (SIZE); and economic volatility defined as the standard deviation of real economic growth spanning the previous 10 years (VOL). As the fiefdom variable is left out, commitment and delegation are measured against it. The baseline economic determinants of fiscal policy are common to the literature and are expected to be important over the whole time period. Likewise, many have pointed to the importance of elections in influencing fiscal policy. But some of the other variables—including the fiscal governance dummies, relative economic size, and economic volatility—may be more relevant after the introduction of the fiscal framework, especially the SGP. A panel model is estimated using both fixed effects and pooled OLS. The sample consists of annual data from 1980-2004, for all EU members except Luxembourg. Separate panel regressions are estimated for the EU11. To be consistent with other studies in the area (especially Debrun and Faruqee, 2004), the data are all derived from the OECD. To account for the possible endogeneity between fiscal policy and the output gap, all equations are estimated with two-stage least squares, using lagged output gaps as instruments. The use of fixed effects in a dynamic panel equation can be criticized, given the noted bias. But Judson and Owen (1999) argue that when the time series is long enough relative to the cross-section dimension, the bias inherent in dynamic panel estimation is not large enough to make alternative estimators more desirable. Indeed, they find that the LSDV estimator performs better than alternatives with 30 or more years of data. Others have argued that when the time span covered by the data is reasonably large (around 22 years), then the application of IV-type estimators to a first-differenced version of the dynamic panel model does not seem necessary, and can even lead to a large loss of efficiency (see Haque, Pesaran, and Sharma, 1999). Gali and Perotti (2003) justify the inclusion of the lagged dependent variable by arguing that their main interest is not in the coefficient itself, but how it changes between two periods. Others, however, favor pooled OLS on the grounds that many variables in this kind of analysis exhibit more between- than within-country variation; institutional variables in particular tend not to vary much over time (Hallerberg, Strauch, and von Hagen, 2004). The baseline results are similar to those of previous studies. Table 4 provides detailed equations for the period as a whole (1980-2004), both for the EU14 and EU11, with and without country dummies. The persistence parameter is highly significant, with a magnitude similar to that of Debrun and Faruqee (2004). Especially for the euro area, the coefficient on the output gap is negative and significant, suggesting a pattern of procyclicality across countries. Again, this is consistent with past evidence. Lagged debt is also an important determinant of the fiscal position, as policymakers react to high public debt stocks by running a tighter policy, in line with longer-term sustainability requirements. Again, the magnitude of this coefficient, which differs little across the various specifications, is similar to that estimated by Debrun and Faruqee (2004). The coefficient on the election year dummy
kinds of fiscal rules under Maastricht and the SGP. For the remainder of this paper, the term “commitment” also encompasses “mixed” systems.
- 18 -
is negative and highly significant in all specifications, suggesting that the prevalence of elections does indeed lead to fiscal policy loosening. This is in line with past studies, which noted the strong electoral motive for fiscal policy in the EU (Tujula and Wolswijk, 2004). There is little evidence that the three factors thought to influence fiscal policy reaction functions under the EU fiscal framework—fiscal governance, volatility, and size—affect the cyclically-adjusted primary balance for the period as a whole, with the single exception of the commitment dummy. There is evidence that, relative to fiefdom, commitment contributed to superior fiscal performance across the sample, but the same does not hold for delegation. This is at odds with the claim that both commitment and delegation can be used to internalize the externality associated with common pool problem in fiscal policy (see Hallerberg, 2004).
Table 4. Fiscal Policy Determination in the European Union, 1980–2004 (Dependent variable: cyclically-adjusted primary balance 1/)
(1) (2) (3) (4)
EU-14 EU-14 EU-11 EU-11
Lagged CAPB 0.75*** 0.71 *** 0.75*** 0.70 ***(0.04) (0.04) (0.04) (0.05)
Output gap -0.06* -0.02 -0.10** -0.07*(0.04) (0.04) (0.04) (0.04)
Lagged debt 0.01*** 0.03*** 0.01*** 0.02***(0.003) (0.01) (0.003) (0.01)
Commitment 0.69*** 0.52* 0.64*** 0.55**(0.23) (0.28) (0.22) (0.27)
Delegation 0.33 0.16 0.33 0.30(0.28) (0.40) (0.28) (0.41)
Growth volatility 0.09 0.09 0.05 0.03(0.08) (0.12) (0.08) (0.13)
Relative economic size -0.002 -0.02 -0.002 -0.05(0.01) (0.15) (0.01) (0.13)
Election year -0.63*** -0.61*** -0.66*** -0.65***(0.17) (0.17) (0.18) (0.18)
R 2 0.78 0.79 0.80 0.81
N 346 346 272 272
Country dummies? No Yes No Yes
1/ Robust standard errors in parentheses; 2SLS estimation. ***= t-statistic significant at 1 percent level; **= t-statistic significant at 5 percent level; *= t-statistic significant at 10 percent level.
- 19 -
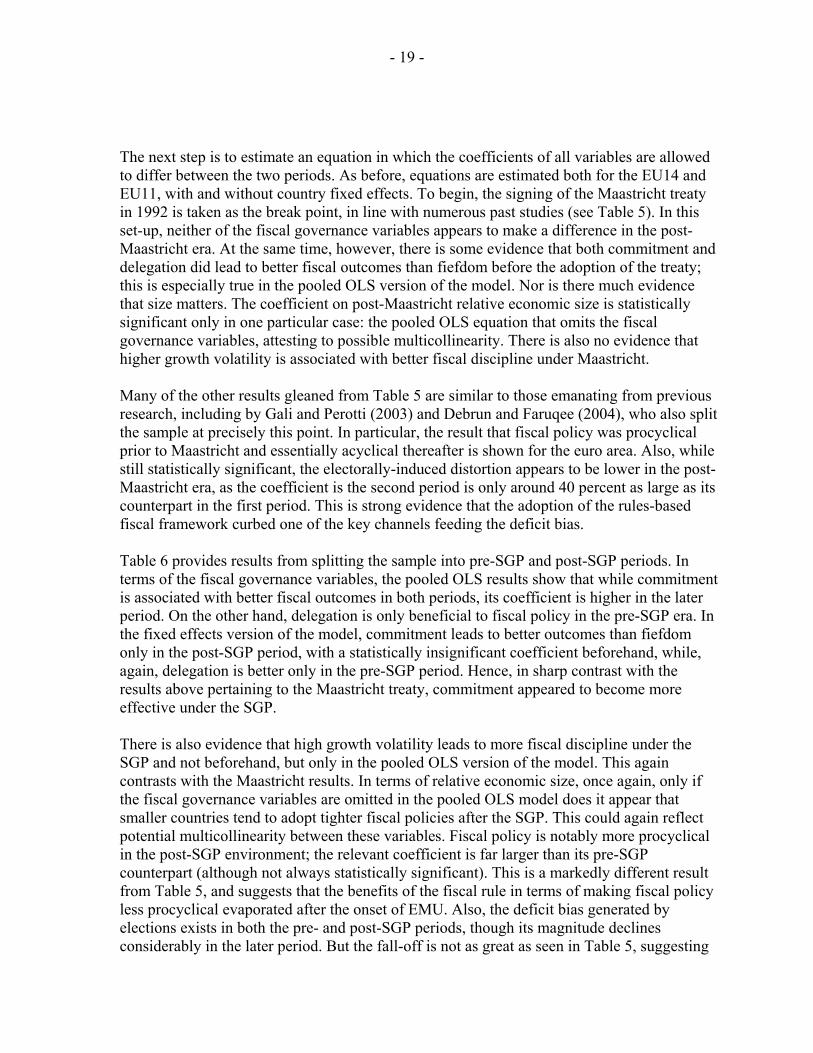
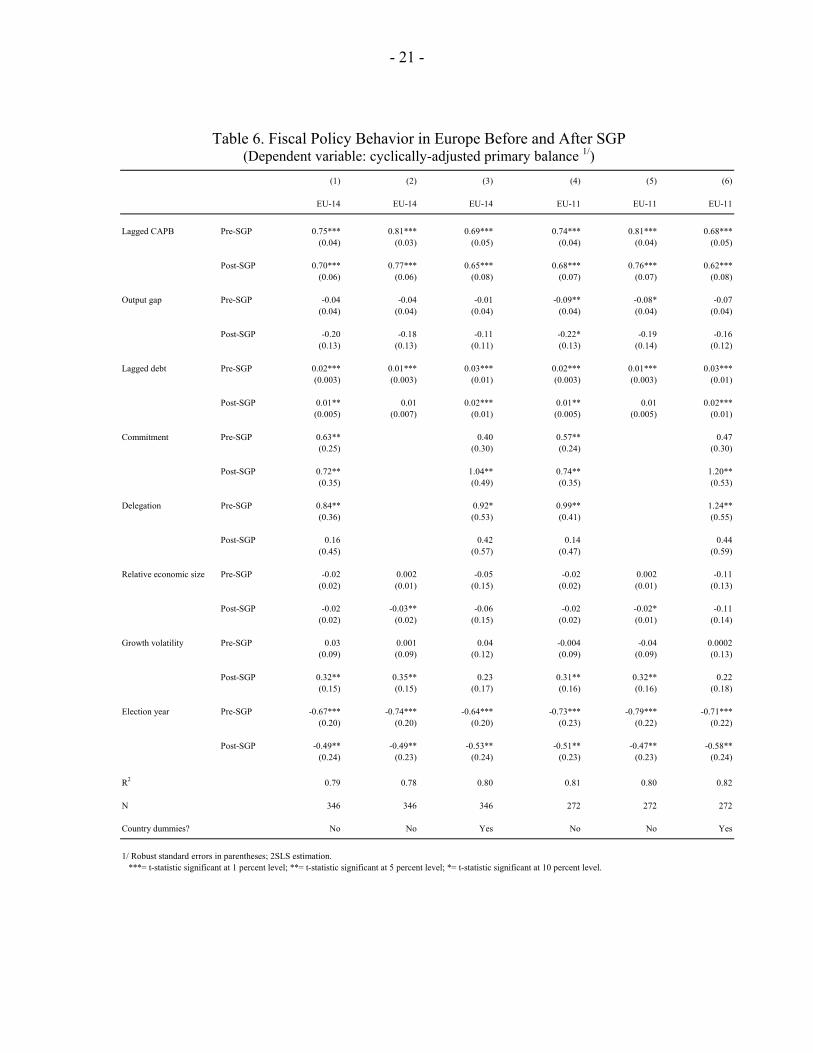
The next step is to estimate an equation in which the coefficients of all variables are allowed to differ between the two periods. As before, equations are estimated both for the EU14 and EU11, with and without country fixed effects. To begin, the signing of the Maastricht treaty in 1992 is taken as the break point, in line with numerous past studies (see Table 5). In this set-up, neither of the fiscal governance variables appears to make a difference in the post-Maastricht era. At the same time, however, there is some evidence that both commitment and delegation did lead to better fiscal outcomes than fiefdom before the adoption of the treaty; this is especially true in the pooled OLS version of the model. Nor is there much evidence that size matters. The coefficient on post-Maastricht relative economic size is statistically significant only in one particular case: the pooled OLS equation that omits the fiscal governance variables, attesting to possible multicollinearity. There is also no evidence that higher growth volatility is associated with better fiscal discipline under Maastricht. Many of the other results gleaned from Table 5 are similar to those emanating from previous research, including by Gali and Perotti (2003) and Debrun and Faruqee (2004), who also split the sample at precisely this point. In particular, the result that fiscal policy was procyclical prior to Maastricht and essentially acyclical thereafter is shown for the euro area. Also, while still statistically significant, the electorally-induced distortion appears to be lower in the post-Maastricht era, as the coefficient is the second period is only around 40 percent as large as its counterpart in the first period. This is strong evidence that the adoption of the rules-based fiscal framework curbed one of the key channels feeding the deficit bias. Table 6 provides results from splitting the sample into pre-SGP and post-SGP periods. In terms of the fiscal governance variables, the pooled OLS results show that while commitment is associated with better fiscal outcomes in both periods, its coefficient is higher in the later period. On the other hand, delegation is only beneficial to fiscal policy in the pre-SGP era. In the fixed effects version of the model, commitment leads to better outcomes than fiefdom only in the post-SGP period, with a statistically insignificant coefficient beforehand, while, again, delegation is better only in the pre-SGP period. Hence, in sharp contrast with the results above pertaining to the Maastricht treaty, commitment appeared to become more effective under the SGP. There is also evidence that high growth volatility leads to more fiscal discipline under the SGP and not beforehand, but only in the pooled OLS version of the model. This again contrasts with the Maastricht results. In terms of relative economic size, once again, only if the fiscal governance variables are omitted in the pooled OLS model does it appear that smaller countries tend to adopt tighter fiscal policies after the SGP. This could again reflect potential multicollinearity between these variables. Fiscal policy is notably more procyclical in the post-SGP environment; the relevant coefficient is far larger than its pre-SGP counterpart (although not always statistically significant). This is a markedly different result from Table 5, and suggests that the benefits of the fiscal rule in terms of making fiscal policy less procyclical evaporated after the onset of EMU. Also, the deficit bias generated by elections exists in both the pre- and post-SGP periods, though its magnitude declines considerably in the later period. But the fall-off is not as great as seen in Table 5, suggesting
- 20 -
that Maastricht was a better disciplining device in terms of the electoral distortion than the SGP. Still, all aspects of the rules-based framework are superior to what came before.
Table 5. Fiscal Policy Behavior in Europe Before and After Maastricht (Dependent variable: cyclically-adjusted primary balance 1/)
(1) (2) (3) (4) (5) (6)
EU-14 EU-14 EU-14 EU-11 EU-11 EU-11
Lagged CAPB Pre- Maastricht 0.74*** 0.82*** 0.68*** 0.72*** 0.79*** 0.66***(0.05) (0.04) (0.05) (0.05) (0.05) (0.06)
Post- Maastricht 0.71*** 0.75*** 0.66*** 0.68*** 0.70*** 0.61***(0.05) (0.05) (0.06) (0.06) (0.06) (0.07)
Output gap Pre- Maastricht -0.07 -0.04 -0.07 -0.12** -0.08 -0.13***(0.05) (0.05) (0.05) (0.05) (0.05) (0.05)
Post- Maastricht -0.03 -0.05 0.07 -0.09 -0.11* -0.02(0.06) (0.06) (0.06) (0.05) (0.05) (0.07)
Lagged debt Pre- Maastricht 0.02*** 0.01*** 0.03*** 0.01*** 0.01*** 0.02***(0.004) (0.004) (0.01) (0.004) (0.004) (0.01)
Post- Maastricht 0.02*** 0.02*** 0.04*** 0.02*** 0.01*** 0.03***(0.004) (0.004) (0.01) (0.005) (0.005) (0.01)
Commitment Pre- Maastricht 0.73** 0.40 0.75** 0.50(0.35) (0.38) (0.33) (0.38)
Post- Maastricht 0.46 0.38 0.28 0.14(0.35) (0.44) (0.30) (0.41)
Delegation Pre- Maastricht 1.25** 0.94 1.62** 1.87**(0.50) (0.76) (0.66) (0.85)
Post- Maastricht -0.16 -0.13 -0.25 -0.12(0.39) (0.47) (0.36) (0.44)
Relative economic size Pre- Maastricht -0.03 0.005 0.04 -0.04 0.01 -0.04(0.03) (0.01) (0.17) (0.03) (0.01) (0.14)
Post- Maastricht -0.001 -0.02** 0.05 -0.004 -0.02** -0.02(0.02) (0.01) (0.16) (0.01) (0.01) (0.14)
Growth volatility Pre- Maastricht 0.05 0.05 0.18 0.01 -0.02 0.13(0.14) (0.13) (0.15) (0.13) (0.13) (0.16)
Post- Maastricht 0.14 0.15 0.11 0.15 0.13 0.15(0.10) (0.10) (0.14) (0.11) (0.11) (0.16)
Election year Pre- Maastricht -0.89*** -0.95*** -0.88*** -0.98*** -0.97*** -0.99**(0.26) (0.26) (0.25) (0.30) (0.30) (0.29)
Post- Maastricht -0.38** -0.38** -0.35* -0.40** -0.41** -0.37*(0.19) (0.19) (0.20) (0.18) (0.18) (0.19)
R2 0.79 0.78 0.80 0.82 0.81 0.83
N 346 346 346 272 272 272
Country dummies? No No Yes No No Yes
1/ Robust standard errors in parentheses; 2SLS estimation. ***= t-statistic significant at 1 percent level; **= t-statistic significant at 5 percent level; *= t-statistic significant at 10 percent level.
- 21 -
Table 6. Fiscal Policy Behavior in Europe Before and After SGP (Dependent variable: cyclically-adjusted primary balance 1/)
(1) (2) (3) (4) (5) (6)
EU-14 EU-14 EU-14 EU-11 EU-11 EU-11
Lagged CAPB Pre-SGP 0.75*** 0.81*** 0.69*** 0.74*** 0.81*** 0.68***(0.04) (0.03) (0.05) (0.04) (0.04) (0.05)
Post-SGP 0.70*** 0.77*** 0.65*** 0.68*** 0.76*** 0.62***(0.06) (0.06) (0.08) (0.07) (0.07) (0.08)
Output gap Pre-SGP -0.04 -0.04 -0.01 -0.09** -0.08* -0.07(0.04) (0.04) (0.04) (0.04) (0.04) (0.04)
Post-SGP -0.20 -0.18 -0.11 -0.22* -0.19 -0.16(0.13) (0.13) (0.11) (0.13) (0.14) (0.12)
Lagged debt Pre-SGP 0.02*** 0.01*** 0.03*** 0.02*** 0.01*** 0.03***(0.003) (0.003) (0.01) (0.003) (0.003) (0.01)
Post-SGP 0.01** 0.01 0.02*** 0.01** 0.01 0.02***(0.005) (0.007) (0.01) (0.005) (0.005) (0.01)
Commitment Pre-SGP 0.63** 0.40 0.57** 0.47(0.25) (0.30) (0.24) (0.30)
Post-SGP 0.72** 1.04** 0.74** 1.20**(0.35) (0.49) (0.35) (0.53)
Delegation Pre-SGP 0.84** 0.92* 0.99** 1.24**(0.36) (0.53) (0.41) (0.55)
Post-SGP 0.16 0.42 0.14 0.44(0.45) (0.57) (0.47) (0.59)
Relative economic size Pre-SGP -0.02 0.002 -0.05 -0.02 0.002 -0.11(0.02) (0.01) (0.15) (0.02) (0.01) (0.13)
Post-SGP -0.02 -0.03** -0.06 -0.02 -0.02* -0.11(0.02) (0.02) (0.15) (0.02) (0.01) (0.14)
Growth volatility Pre-SGP 0.03 0.001 0.04 -0.004 -0.04 0.0002(0.09) (0.09) (0.12) (0.09) (0.09) (0.13)
Post-SGP 0.32** 0.35** 0.23 0.31** 0.32** 0.22(0.15) (0.15) (0.17) (0.16) (0.16) (0.18)
Election year Pre-SGP -0.67*** -0.74*** -0.64*** -0.73*** -0.79*** -0.71***(0.20) (0.20) (0.20) (0.23) (0.22) (0.22)
Post-SGP -0.49** -0.49** -0.53** -0.51** -0.47** -0.58**(0.24) (0.23) (0.24) (0.23) (0.23) (0.24)
R2 0.79 0.78 0.80 0.81 0.80 0.82
N 346 346 346 272 272 272
Country dummies? No No Yes No No Yes
1/ Robust standard errors in parentheses; 2SLS estimation. ***= t-statistic significant at 1 percent level; **= t-statistic significant at 5 percent level; *= t-statistic significant at 10 percent level.
- 22 -
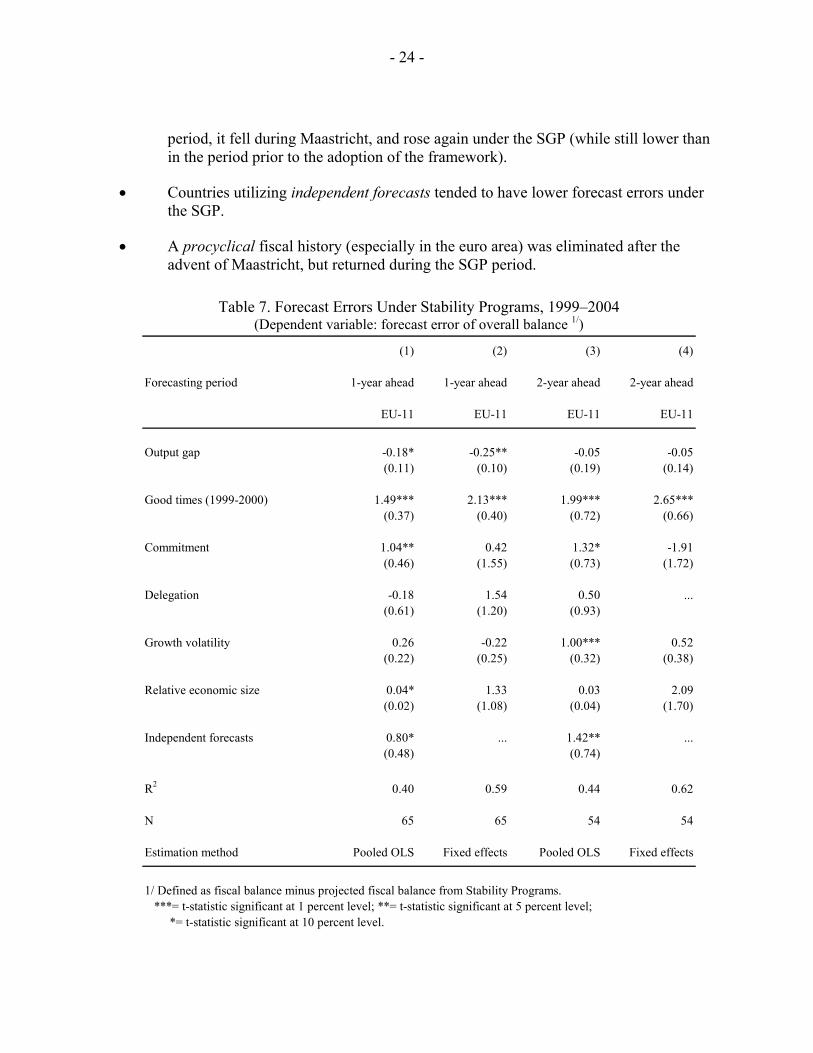
Further empirical evidence can be derived from the forecasts contained in successive Stability Programs. As noted earlier, many countries relied on overly-optimistic assumptions to postpone adjustment under the SGP. Previous studies have addressed the role of fiscal governance in this context. Hallerberg, Strauch, and von Hagen (2001), for example, note that Stability Programs are more integrated into the national budget processes in commitment countries. One possible reason is that commitment states are more inclined to opt for more conservative forecasts, as parties build in significant safety margins to reduce the likelihood of renegotiation (Strauch, Hallerberg, and von Hagen, 2004). These authors also highlight an empirical relationship between commitment (and mixed) states and cautious forecasts, controlling for economic factors. Rather than focusing on budgetary institutions, Jonung and Larch (2004) stress the role of independent forecasting agencies in overcoming the forecast bias. Was the tendency toward cautious forecasting related more broadly to the factors that make the SGP more suitable to some countries than others? Table 7 reports the results of a regression where the dependent variable is the one- and two-year forecast errors of the overall fiscal balance for the EU12 under the SGP (1999-04).10 The following equation is fitted to the data for the forecast error (FE):
titititititititiiti IFAVOLSIZEDELCOMGOODTIMESGAPFE ,,7,6,5,4,3,2,1, εα +∂+∂+∂+∂+∂+∂+∂+=
The output gap captures the economic background during budgetary planning. This variable is supplemented with a dummy for the specific “good times” during 1999-00, a unique period when the scale of the IT-related boom was far beyond the expectations of most forecasters. Regressors also include the factors deemed to influence fiscal policy in the post-EMU period—fiscal governance, relative economic size, and volatility. Also, a dummy is included to capture countries that rely on independent forecasts (IFA)—Austria, Belgium, and the Netherlands (Jonung and Larch, 2004). As before, both pooled OLS and fixed effects versions of the model are estimated. The coefficient on the output gap is negative and significant, at least for one-year-ahead forecasts. This is consistent with previous research (Strauch, Hallerberg, and Von Hagen, 2004) and can be interpreted as a tendency towards optimistic forecasting in good times and more cautious forecasting during bad times.11 The coefficient on the good times dummy is positive and significant, as expected. In terms of fiscal governance, commitment countries have a tendency toward more positive, or less negative, forecast errors, which supports the argument that these countries are less prone to overly optimistic assumptions under the
10 The forecast error is defined simply as the fiscal balance minus the projected fiscal balance, deriving from the annual Stability Programs.
11 This result holds when the lag of the output gap is used.
- 23 -
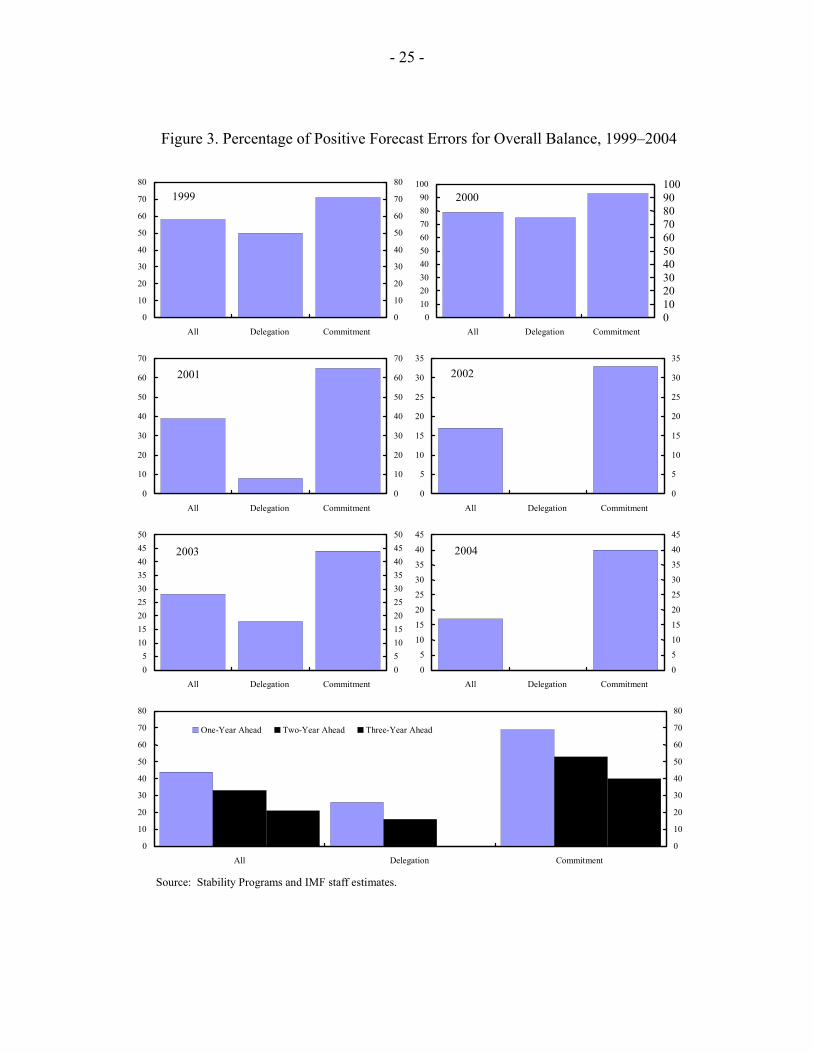
SGP.12 Also, again in line with previous research, there is some evidence that countries with independent forecasts seem to be associated with lower forecast errors, even controlling for the form of fiscal governance. There is also some evidence of more conservative forecasting among countries with high growth volatility, but only for the 2-year-ahead forecasts in the pooled OLS variant; this is again consistent with past research.13 Economic size matters little. The role of fiscal governance in forecasting is bolstered by examining the prevalence of positive forecast errors among countries. As can be seen from Figure 3, the frequency of positive surprises (a higher balance or a lower deficit than expected) is far higher among commitment countries. This is particularly pronounced during the downturn years, when positive surprises were rare to nonexistent among delegation countries, while they were a fairly common occurrence among commitment countries. Again, this lends support to the hypothesis that commitment countries are more likely to adopt cautious forecasts. In sum, when considering the different fiscal behavior before and after the introduction of the fiscal framework in Europe, the following conclusions are suggested: • The commitment form of fiscal governance contributed more to fiscal discipline in the
post-SGP period. In contrast, the delegation form of fiscal governance proved to be a bane only in the period prior to its adoption. The evidence does not support a similar positive role for commitment under the Maastricht treaty. Commitment countries also had a tendency to take Stability Programs more seriously in the SGP era, in the sense of having lower forecast errors in their budgetary projections.
• Countries experiencing high growth volatility tended to adopt more disciplined fiscal policy under the SGP, but only in the pooled OLS version of the model. Growth volatility was also associated with lower forecast errors.
• There is some (albeit weak) evidence in the pooled OLS model that larger countries, defined in terms of economic size, performed worse under the SGP and Maastricht than smaller counties, but not beforehand. This holds only if the fiscal governance variables are excluded from the equation, suggesting multicollinearity.
• The rules-based fiscal framework was successful in mitigating the adverse effects of electorally-motivated fiscal profligacy. While this distortion was evident in every
12 This result is evident only in the pooled OLS versions of the model, which again makes sense given the limited degree of time variation of these variables in the SGP era.
13 Output volatility could result in more cautious forecasts if policymakers are risk-averse (Strauch, Hallerberg, and von Hagen, 2004). This is compatible with the external anchor hypothesis.
- 24 -
period, it fell during Maastricht, and rose again under the SGP (while still lower than in the period prior to the adoption of the framework).
• Countries utilizing independent forecasts tended to have lower forecast errors under the SGP.
• A procyclical fiscal history (especially in the euro area) was eliminated after the advent of Maastricht, but returned during the SGP period.
Table 7. Forecast Errors Under Stability Programs, 1999–2004 (Dependent variable: forecast error of overall balance 1/)
(1) (2) (3) (4)
Forecasting period 1-year ahead 1-year ahead 2-year ahead 2-year ahead
EU-11 EU-11 EU-11 EU-11
Output gap -0.18* -0.25** -0.05 -0.05(0.11) (0.10) (0.19) (0.14)
Good times (1999-2000) 1.49*** 2.13*** 1.99*** 2.65***(0.37) (0.40) (0.72) (0.66)
Commitment 1.04** 0.42 1.32* -1.91(0.46) (1.55) (0.73) (1.72)
Delegation -0.18 1.54 0.50 ...(0.61) (1.20) (0.93)
Growth volatility 0.26 -0.22 1.00*** 0.52(0.22) (0.25) (0.32) (0.38)
Relative economic size 0.04* 1.33 0.03 2.09(0.02) (1.08) (0.04) (1.70)
Independent forecasts 0.80* ... 1.42** ...(0.48) (0.74)
R2 0.40 0.59 0.44 0.62
N 65 65 54 54
Estimation method Pooled OLS Fixed effects Pooled OLS Fixed effects
1/ Defined as fiscal balance minus projected fiscal balance from Stability Programs. ***= t-statistic significant at 1 percent level; **= t-statistic significant at 5 percent level; *= t-statistic significant at 10 percent level.
- 25 -
Figure 3. Percentage of Positive Forecast Errors for Overall Balance, 1999–2004
Source: Stability Programs and IMF staff estimates.
1999
0 10 20 30 40 50 60 70 80
All Delegation Commitment0
10
20
30
40
50
60
70
80
2000
0102030405060708090
100
All Delegation Commitment 0102030405060708090100
2001
0 10 20 30 40 50 60 70
All Delegation Commitment0
10
20
30
40
50
60
70
2002
0
5
10
15
20
25
30
35
All Delegation Commitment 0
5
10
15
20
25
30
35
2003
0 5
10 15 20 25 30 35 40 45 50
All Delegation Commitment05101520253035404550
2004
0
5
10
15
20
25
30
35
40
45
All Delegation Commitment 0
5
10
15
20
25
30
35
40
45
0 10 20 30 40 50 60 70 80
All Delegation Commitment 0
10
20
30
40
50
60
70
80
One-Year Ahead Two-Year Ahead Three-Year Ahead
- 26 -
V. CONCLUSION
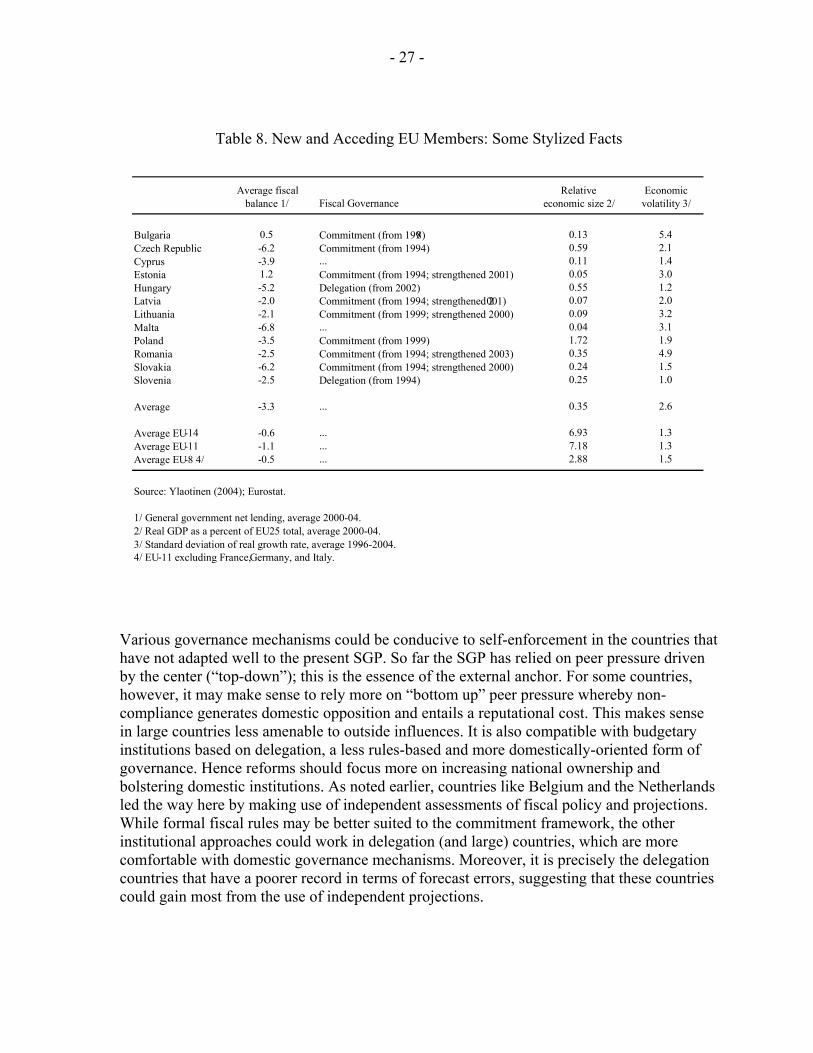
A primary conclusion is that a rules-based framework can be effective in combating politically-motivated fiscal policy distortions. The anchor provided by the Maastricht treaty led to substantial fiscal adjustment in Europe. And despite frequent criticism, the SGP (especially through its preventive arm) has been quite successful in contributing to fiscal discipline in countries like Austria, Belgium, Finland, Ireland, the Netherlands, and Spain (as well as Denmark and Sweden from outside the euro area). The empirical evidence points clearly to a diminished electoral motive for fiscal policy under the rules-based framework. Various factors contributed to the efficacy of the SGP in particular. As attested to by the empirical results, the incentives for self-enforcement were at play in commitment countries, in volatile countries, and in small countries. Commitment countries faced greater domestic political costs for violating an agreed fiscal contract. Volatile countries likewise saw the advantages of a credible external anchor. And small countries were more accepting of external peer pressure and were more likely to lose reputation in the event of non-compliance. Based on this premise, the credibility of the SGP should increase in the future. Many of the new and acceding members have higher-than-average deficits (Table 8). The SGP should work well for these countries, for a number of reasons. First, most of them have adopted some form of commitment technology. As documented by Ylaoutinen (2004), nearly all central and eastern European countries use some kind of proportional representation in their electoral processes, and rely predominantly on commitment; only Hungary and Slovenia have adopted delegation. Indeed, most of the commitment countries have strengthened their institutions in recent times, mainly by establishing multi-annual frameworks, possibly in anticipation of the SGP. Second, the economic size of these countries is far below the EU average, suggesting that they might be more amenable to external influences over fiscal policy. Third, these countries also tend to be among the more volatile countries in Europe in terms of economic growth; the standard deviation of growth over the past 10 years of the new and acceding members was twice that of the older EU members. Looking forward, it will be key to find ways to make the Pact more enforceable in the non-complying countries, while not harming its disciplining effect in the others. Many have argued that enforceability requires legitimacy (UK Treasury, 2004), and this calls for an element of flexibility. This premise featured prominently in the reform debate that led to the revisions to the SGP in 2005. But if flexibility is taken too far, the external anchor function of the SGP could be harmed. Laxity in applying the SGP to the larger countries could have a negative demonstration effect on the newer members; with the lower likelihood of being sanctioned, fiscal policy could become less disciplined (Berger, Kopits, and Szekely, 2004). Some have noted that the 3 percent anchor in particular is crucial in anchoring expectations and facilitates monitoring (Schuknecht, 2004). Increased flexibility could tilt the framework in the direction of the countries that are more inclined to rely on domestic governance institutions and respond to domestic circumstances.
- 27 -
Table 8. New and Acceding EU Members: Some Stylized Facts
Various governance mechanisms could be conducive to self-enforcement in the countries that have not adapted well to the present SGP. So far the SGP has relied on peer pressure driven by the center (“top-down”); this is the essence of the external anchor. For some countries, however, it may make sense to rely more on “bottom up” peer pressure whereby non-compliance generates domestic opposition and entails a reputational cost. This makes sense in large countries less amenable to outside influences. It is also compatible with budgetary institutions based on delegation, a less rules-based and more domestically-oriented form of governance. Hence reforms should focus more on increasing national ownership and bolstering domestic institutions. As noted earlier, countries like Belgium and the Netherlands led the way here by making use of independent assessments of fiscal policy and projections. While formal fiscal rules may be better suited to the commitment framework, the other institutional approaches could work in delegation (and large) countries, which are more comfortable with domestic governance mechanisms. Moreover, it is precisely the delegation countries that have a poorer record in terms of forecast errors, suggesting that these countries could gain most from the use of independent projections.
Average fiscal balance 1/ Fiscal Governance
Relative economic size 2/
Economic volatility 3/
Bulgaria 0.5 Commitment (from 1998) 0.13 5.4 Czech Republic - 6.2 Commitment (from 1994) 0.59 2.1 Cyprus - 3.9 ... 0.11 1.4 Estonia 1.2 Commitment (from 1994; strengthened 2001) 0.05 3.0 Hungary - 5.2 Delegation (from 2002) 0.55 1.2 Latvia - 2.0 Commitment (from 1994; strengthened 2001) 0.07 2.0 Lithuania - 2.1 Commitment (from 1999; strengthened 2000) 0.09 3.2 Malta - 6.8 ... 0.04 3.1 Poland - 3.5 Commitment (from 1999) 1.72 1.9 Romania - 2.5 Commitment (from 1994; strengthened 2003) 0.35 4.9 Slovakia - 6.2 Commitment (from 1994; strengthened 2000) 0.24 1.5 Slovenia - 2.5 Delegation (from 1994) 0.25 1.0
Average - 3.3 ... 0.35 2.6
Average EU - 14 - 0.6 ... 6.93 1.3 Average EU - 11 - 1.1 ... 7.18 1.3 Average EU - 8 4/ - 0. 5 ... 2.88 1.5
Source: Ylaotinen (2004); Eurostat.
1/ General government net lending, average 2000-04. 2/ Real GDP as a percent of EU25 total, average 2000-04. 3/ Standard deviation of real growth rate, average 1996-2004.- 4/ EU - 11 excluding France, Germany, and Italy.
- 28 -
REFERENCES
Alesina, Alberto, and Roberto Perotti, 1995, “Fiscal Expansions and Adjustments in OECD
Countries,” Economic Policy, Vol. 21, pp. 205-48. Alesina, Alberto, Nouriel Roubini, and Gerald Cohen, 1999, Political Cycles and the
Macroeconomy (Cambridge, Massachusetts: MIT Press). Alesina, Alberto, and Guido Tabellini, 2003, “Bureaucrats or Politicians,” IGIER Working
Paper, No. 238. Alesina, Alberto, and Roman Wacziarg, 1998, “Openness, Country Size, and Government,”
Journal of Public Economics, Vol. 69, pp. 305-321. Annett, Anthony, 2002, “Politics, Government Size, and Fiscal Adjustment in Industrial
Countries,” IMF Working Paper 02/162 (Washington: International Monetary Fund). Annett, Anthony, Jörg Decressin, and Michael Deppler, 2005, “Reforming the Stability and
Growth Pact,” IMF Policy Discussion Paper PDP/05/2 (Washington: International Monetary Fund).
Annett, Anthony, and Albert Jaeger, 2004, “Europe’s Quest for Fiscal Discipline,” Finance
and Development, Vol. 41 (Washington: International Monetary Fund), pp. 22-25. Balassone, Fabrizio, and Mauro Francese, 2004, “Cyclical Asymmetry in Fiscal Policy, Debt
Accumulation, and the Treaty of Maastricht,” Temi di Discussione No. 531, Banca D’Italia.
Berger, Helge, George Kopits, and Istvan Szekely, 2004, “Fiscal Indulgence in Central
Europe: Loss of the External Anchor?,” IMF Working Paper WP/04/62 (Washington: International Monetary Fund).
Buti, Marco, Sylvester Eijffinger, and Daniele Franco, 2003, “Revisiting the Stability and
Growth Pact: Grand Design or Internal Adjustment?,” European Economy Economics Papers No. 180, European Commission.
Buti, Marco, and Lucio R. Pench, 2004, “Why Do Large Countries Flout the Stability Pact”
And What Can be Done About It?” Journal of Common Market Studies, Vol. 42, pp. 1025–32.
Buti, Marco, and Paul van den Noord, 2004, “Fiscal Policy in EMU: Rules, Discretion, and
Political Incentives,” European Economy Economics Papers No. 206, European Commission.
- 29 -
Debrun, Xavier, and Hamid Faruqee, 2004, “Fiscal Policy Behaviors in a Heterogeneous
Monetary Union: the Case of EMU,” (unpublished; Washington: International Monetary Fund.
De Haan, Jakob, Helge Berger, and David-Jan Jansen, 2003, “The End of the Stability and
Growth Pact?” unpublished. De Haan, Jakob, Jan-Egbert Sturm, and Geert Beikhuis, 1999, “The Weak Government
Thesis: Some New Evidence,” Public Choice, Vol. 101, pp 163-76. European Commission, 2001, “Public Finances in EMU, 2001,” European Economy, No. 3. ———, 2003, “Public Finances in EMU, 2003,” European Economy, No. 3. Fatas, Antonio, and Illian Mihov, 2001, “Government Size and Automatic Stabilizers:
International and Intranational Evidence,” Journal of International Economics, Vol. 55, pp. 3-28.
Fatas, Antonio, Jurgen von Hagen, Andrew Hughes Hallett, Rolf Strauch, and Anne Sibert,
2003, Stability and Growth in Europe: Towards a Better Pact, Center for Economic Policy Research, London.
Gali, Jordi, and Roberto Perotti, 2003, “Fiscal Policy and Monetary Integration in Europe,”
Economic Policy: A European Forum, No. 37, pp. 533-572. Grilli, Vittorio, Donato Masciandaro, and Guido Tabellini, 1991, “Political and Monetary
Institutions and Public Financial Policies in the Industrial Countries,” Economic Policy, vol. 13, pp. 341-392.
Hallerberg, Mark, 2004, Domestic Budgets in a United Europe: Fiscal Governance from the
End of Bretton Woods to EMU, Cornell University Press. Hallerberg, Mark, and Jürgen von Hagen, 1999, “Electoral Institutions, Cabinet Negotiations,
and Budget Deficits in the European Union,” in Fiscal Institutions and Fiscal Performance, eds. James Poterba and Jurgen von Hagen, Chicago: University of Chicago Press.
Hallerberg, Mark, Rolf Strauch, and Jürgen von Hagen, 2001, The Use and Effectiveness of
Budgetary Rules and Norms in the EU Member States, Report prepared for the Dutch Ministry of Finance by the Institute of European Integration Studies.
Hallerberg, Mark, Rolf Strauch, and Jürgen von Hagen, 2004, “The Design of Fiscal Rules
and Forms of Fiscal Governance in European Union Countries,” ECB Working Paper, No. 419.
- 30 -
Haque, Nadeem Ul., M. Hashem Pesaran, and Sunil Sharma, 1999, “Neglected Heterogeneity
and Dynamics in Cross-Country Savings Regressions,” IMF Working Paper No. 99/128 (Washington: International Monetary Fund).
Hughes Hallett, Andrew, John Lewis, and Jürgen von Hagen, 2004, Fiscal Policy in Europe,
1991-2003: An Evidence-Based Analysis, Center for Economic Policy Research, London.
Inman, Robert. P., 1996, “Do Balanced Budget Rules Work? U.S. Experience and Possible
Lessons for the EMU,” NBER Working Paper No. 5838. International Monetary Fund, 2001, Fiscal Policy and Macroeconomic Stability, World
Economic Outlook, May 2001. ———, 2005, Promoting Fiscal Discipline: Is There a Role for Fiscal Agencies?, Fiscal
Affairs Department. Jaeger, Albert, 2001, “Cyclical Fiscal Policy Behavior in EU Countries,” IMF Staff Country
Report 01/201 (Washington: International Monetary Fund). Jonung, Lars, and Martin Larch, 2004, “Improving Fiscal Policy in the EU: the Case for
Independent Forecasts,” Economics Papers No. 210, European Commission. Judson, Ruth A., and Ann L. Owen, 1999, “Estimating Dynamic Panel Data Models: A
Guide for Macroeconomists,” Economics Letters, Vol. 65, pp. 9-15. Koen, Vincent, and Paul van den Noord, 2005, “Fiscal Gimmickry in Europe: Once-Off
Measures and Creative Accounting,” OECD Economics Department Working Paper No. 417. OECD.
Kontopoulos, Yianos, and Roberto Perotti, 1999, “Government Fragmentation and Fiscal
Policy Outcomes: Evidence from OECD Countries,” in Fiscal Institutions and Fiscal Performance, eds. James Poterba and Jurgen von Hagen, Chicago: University of Chicago Press.
Kopits, George, and Steven Symansky, 1998, “Fiscal Policy Rules,” IMF Occasional Paper
No. 162. Mills, Phillipe, and Alain Quinet, 2002, “How to Allow the Automatic Stabilizers to Operate
Fully? A Policymaker’s Guide for EMU Countries,” in Marco Buti, Jurgen von Hagen, and Carlos Martinez-Mongay, eds. The Behavior of Fiscal Authorities: Stabilization, Growth, and Institutions, European Communities.
- 31 -
Mühleisen, Martin, Stephan Danninger, David Hauner, Kornelia Krajnyak, and Bennett Sutton, 2005, “How Do Canadian Budget Forecasts Compare with Those of Other Industrial Countries?” IMF Working Paper WP/05/166 (Washington: International Monetary Fund).
Organization for Economic Cooperation and Development, 2005, Economic Survey: Euro
Area (Paris: OECD). Rodrik, Dani, 1998, “Why Do More Open Economies Have Bigger Governments?” Journal
of Political Economy, Vol. 106, pp. 997-1032. Rogowski, Ronald, 1987, “Trade and the Variety of Democratic Institutions,” International
Organization, Vol. 41, pp. 203-223. Roubini, Nouriel, and Jeffrey Sachs, 1989, “Political and Economic Determinants of Budget
Deficits in the Industrial Democracies,” European Economic Review, Vol. 33, pp. 903-938.
Schuknecht, Ludger, 2004, “EU Fiscal Rules: Issues and Lessons from Political Economy,”
ECB Working Paper, No. 421. Strauch, Rolf, Mark Hallerberg, and Jürgen von Hagen, 2004, “Budgetary Forecasts in
Europe: the Track Record of Stability and Convergence Programmes,” Economic Working Papers at Centro de Estudios Andaluces, E2004/42.
Tujula, Mika, and Guido Wolswijk, 2004, “What Determines Fiscal Balances? En Empirical
Investigation in Determinants of Changes in OECD Budget Balances,” ECB Working Paper, No. 422.
UK Treasury, 2004, “The Stability and Growth Pact: A Discussion Paper,” HM Treasury. Velasco, Andres, 1999, “A Model of Endogenous Fiscal Deficits and Delayed Fiscal
Reforms,” in Fiscal Institutions and Fiscal Performance, eds. James Poterba and Jurgen von Hagen, Chicago: University of Chicago Press.
Von Hagen, Jürgen, 1992, “Budgeting Procedures and Fiscal Performance,” European
Economy, Reports and Studies: Towards Greater Fiscal Discipline, No. 3 (Brussels: European Commission), pp. 311-418.
Von Hagen, Jürgen, 1998, “Budgeting Institutions for Aggregate Fiscal Discipline,” ZEI
Policy Paper No. B98-01, Center for European Integration Studies. Von Hagen, Jürgen, 2005, “Fiscal Rules and Fiscal Performance in the EU and Japan,”
Institute for Monetary and Economic Studies, Bank of Japan, Discussion Paper No. 2005-E-5.
- 32 -
Von Hagen, Jürgen, Andrew Hughes Hallett, and Rolf Strauch, 2000, Budgetary
Consolidation in EMU, Center for Economic and Policy Research. Von Hagen, Jürgen, and Ian Harden,1996, “Budget Processes and Commitment to Fiscal
Discipline,” IMF Working Paper, WP/96/78 (Washington: International Monetary Fund).
Von Hagen, Jürgen, and Guntham Wolff, 2004, “What do deficits tell us about debts?
Empirical evidence on creative accounting with fiscal rules in the EU,” CEPR Discussion Papers No. 4579.
Wyplosz, Charles, 2005, “Fiscal Policy: Institutions Versus Rules,” National Institute
Economic Review, No. 191, pp. 70-84. Ylaoutinen, Sami, 2004, “Fiscal Frameworks in the Central and Eastern European
Countries,” Finnish Ministry of Finance Discussion Paper No. 72.