energy sector white paper - asian development bank · this energy sector white paper is intended to...
TRANSCRIPT
SUSTAINABLE INFRASTRUCTURE ASSISTANCE PROGRAM:TECHNICAL ASSISTANCE FOR ENERGY RPJMN 2015-2019
Energy Sector White PaperTA-8484 INO: Sustainable Infrastructure Assistance Program
Technical Assistance Cluster Management Facility Subproject 1 (46380-003)
Developed by Tusk Advisory Pte. Ltd


ENERGY SECTOR WHITE PAPER
i
SUSTAINABLE INFRASTRUCTURE ASSISTANCE PROGRAM: TECHNICAL ASSISTANCE FOR ENERGY RPJMN 2015-2019
FOREWORD
Energy security is a national development priority and a key focus area for the RPJMN 2015-2019. During this period, the government seeks to expand and optimize the country’s energy mix to provide adequate supply of energy for industrial and commercial activities, as well as expanded energy access to all Indonesian households. Increased exploration and processing of the country’s energy resources, combined with their efficient usage within the country to enhance economic productivity, is crucial to achieve the target of national energy sovereignty.
Currently, fossil fuels dominate Indonesia’s energy mix. The decline in domestic production of oil creates dependency on imported oil to meet burgeoning domestic demand. The growth rate of gas production has similarly stalled in recent years, resulting in increased import of liquefied natural gas. In the power sector, generation capacity additions have been delayed; moreover underinvestment and infrastructural deficits extend to the transmission and distribution systems. Indonesia is well endowed with a range of renewable energy resources such as geothermal, biomass, solar, and hydropower. Nevertheless, its utilization to meet domestic energy demand and to create a healhty energy mix remain limited.
There are still much to be and could be done to establish a sound energy resilience and move towards energy sovereignty. The national electrification target of 100% requires utilization of various energy resources mentioned above, in accordance to its characteristics and location, to be able to reach and provide access to all Indonesian regions and population.
The government has taken concrete steps to reduce subsidies for fossil fuels and power, incentivize renewable energy, roll out energy efficiency measures, and find ways to stimulate investment in the oil and gas sector. However, much more needs to be done and will be done.
This Energy Sector White Paper is intended to provide an in depth view of the sector; it identifies key opportunities for growth and current constraints, and outlines priority interventions to be accomplished during the RPJMN 2015-2019. It also outlines broad investment needs in the sector and proposes a series of key performance indicators against which progress may be monitored. It is our hope that this White Paper will benefit the various energy sector stakeholders to undertake the energy resilience priority actions to ensure the realization of energy sovereignty.
We would like to express our appreciation and gratitude to the Asian Development Bank for their support and cooperation in preparing this White Paper, and for all stakeholders for their valuable contributions in the development of this White Paper.
Dr. Ir. Rr. Endah Murniningtyas, M.Sc.
Deputy Minister for Natural Resources and Environment of Ministry of National Development/BAPPENAS
Ir. Montty Giriana, M.Sc., MCP, Ph.D.
Deputy Minister for Energy and Mineral Resources of Coordinating Ministry of Economic Affairs

ENERGY SECTOR WHITE PAPER
ii
SUSTAINABLE INFRASTRUCTURE ASSISTANCE PROGRAM: TECHNICAL ASSISTANCE FOR ENERGY RPJMN 2015-2019
This page is intentionally left blank

ENERGY SECTOR WHITE PAPER
iii
SUSTAINABLE INFRASTRUCTURE ASSISTANCE PROGRAM: TECHNICAL ASSISTANCE FOR ENERGY RPJMN 2015-2019
ACKNOWLEDGEMENTS
This report was developed by a team of consultants from Tusk Advisory (TUSK), which included Nicholas Morris, Dodi Miharjana, Sagar Gubbi, Adelina Halim, Audi Prabowo and Dieter Napitupulu with editorial support from Margaret Augusta. TUSK was contracted by the Asian Development Bank (ADB) under TA-8484 (INO): Technical Assistance Cluster Management Facility Subproject-1, Sustainable Infrastructure Assistance Program of the ADB, which is financed by the Department of Foreign Affairs and Trade (Previously AusAid), Government of Australia. The Southeast Asia Department Energy Division of ADB supported the preparation of this report. Yuki Inoue and Maura Lillis (Consultants, ADB) provided additional technical support.
TUSK is also grateful to the many individuals from development agencies, who generously gave their time and expert input for the preparation of this study. In particular TUSK would like to thank David Braithwaite and David Aron (Indonesia Infrastructure Initiative – Petroleum Development Consultants), Paul Chambers (UK Embassy) Jeff Wilson (Dewan Energi Nasional), Muchsin Qadir (World Bank), Sophie Salomon (Agence Francaise de Developpement) and Juraku Masahiro (Japan International Cooperation Agency).
Finally, this work would not have been possible without the guidance and support provided by the leadership at BAPPENAS namely Dr. Lukita Dinarsyah Tuwo, Vice Minister of BAPPENAS, Dr. Ir. Dedy Supriadi Priatna, Deputy Minister for Infrastructure of BAPPENAS and Dr. Ir. Endah Murniningtyas, Deputy Minister for Natural Resources and Environment of BAPPENAS. Additionally, we are very grateful for the collaborative spirit and technical support provided by Dr. Ir. Montty Girianna (Formerly Director of Energy, Mines, and Mineral Resources of BAPPENAS and currently Deputy Minister for Energy and Mineral Resources of the Coordinating Ministry of Economic Affairs), Ir. Jadhie Ardajat (Director of Electricity, Telecommunications, and Informatics, BAPPENAS), Mr. Sunandar (Head of Oil and Gas Sub-division, BAPPENAS) and Mr. Andianto Haryoko (Head of Telecommunications Sub-division, BAPPENAS).

ENERGY SECTOR WHITE PAPER
iv
SUSTAINABLE INFRASTRUCTURE ASSISTANCE PROGRAM: TECHNICAL ASSISTANCE FOR ENERGY RPJMN 2015-2019
TABLE OF CONTENTS
EXECUTIVE SUMMARY | ix1 SCOPE AND OBJECTIVES | 12 STRATEGIC ENERGY SECTOR REVIEW | 2 2.1 Background | 2 2.1.1 Supply and Demand Overview | 2 2.1.2 Primary Energy | 3 A. Oil & Gas | 3 B. Coal | 6 C. New and Renewable Energy (NRE) | 8 2.1.3 Infrastructure | 14 A. Oil Storage, Refineries, and Distribution | 14 B. Gas Transmission and Distribution System | 15 C. Electricity Generation, Transmission, and Distribution | 15 2.1.4 Energy Access and Rural Electrification | 19 2.2 Policy Review | 21 2.2.1 Plans for the Energy Sector | 21 2.2.2 Subsidies and Price Distortion | 21 2.2.3 Energy Efficiency | 24 2.2.4 Environmental Sustainability | 26 2.3 Institutional Aspects | 27 2.3.1 Institutional Mapping | 28 2.3.2 Indonesian Energy SOEs | 30 A. PLN- National Electricity Company | 30 B. PT Pertamina National Oil Company | 31 C. PT PGN Tbk. (State Gas Company) | 32 2.3.3 Role of the Private Sector | 33 2.4 Energy Sector Performance | 34 2.4.1 Recent Performance | 34 2.4.2 Likely Future Outcome under Business-as-Usual | 353 CREATING A SUSTAINABLE ENERGY SYSTEM FOR INDONESIA: CHALLENGES AND SOLUTIONS | 37 3.1 Resolving Primary Energy Supply Constraints | 38 3.1.1 Diversify and expand supply of fossil fuel ene rgy | 38 A. Increasing Oil and Gas Reserves and Production | 38 B. Developing Specific PSC Regulations for Coal Bed Methane and Shale Gas | 40 C. Consolidating Policies on Coal Utilization and Coal Transport | 40

ENERGY SECTOR WHITE PAPER
v
SUSTAINABLE INFRASTRUCTURE ASSISTANCE PROGRAM: TECHNICAL ASSISTANCE FOR ENERGY RPJMN 2015-2019
3.1.2 Scaling Up Renewable Energy Development | 41 A. Reforming Geothermal Sector | 41 B. Optimizing Hydropower | 42 C. Increasing Deployment of Solar Power | 43 D. Developing Waste to Energy Power Infrastructure | 44 3.2 Expanding Downstream Energy Infrastructure | 44 3.2.1 Expand Oil Storage, Refinery and Distribution Network | 44 3.2.2 Develop Gas Pipeline and Distribution Network | 45 A. Leveraging Limited Opportunities to Utilize CNG for Transportation | 46 B. Developing Small-scale LNG infrastructure | 46 C. Strengthening Power Transmission and Distribution Network | 47 3.3 Scaling Up Energy Access In Rural And Remote Areas | 47 3.4 Investing In Energy Efficiency | 50 3.5 Enabling Dynamic Energy Markets | 53 A. Improving Effectiveness of SOEs | 53 B. Fostering Greater Private Sector Participation | 55 3.6 Addressing Cross Cutting Constraints | 54 3.6.1 Conducive Policy and Regulatory Framework | 54 A. Improving Gas Pricing Mechanisms | 50 B. Improving pricing mechanism for renewable energy | 57 C. Aligning Incentives and Energy Subsidies | 57 3.6.2 Strengthen Institutional Capacities and Coordination | 58 A. Resolving Regulatory Bottlenecks | 58 3.6.3 Streamline Energy Sector Planning and Performance Monitoring | 59 A. Improving Quality of Energy Sector Data | 59 B. Establishing Comprehensive Energy Sector Planning and KPIs | 60 3.6.4 Increase Effectiveness of Environmental Sustainability Measures | 60 3.6.5 Develop Comprehensive and Diversified Financing Plan | 61 A. Forecasting Investment Needs | 61 B. Identifying Potential Funding Sources | 624 RECOMMENDATIONS AND KEY PERFORMANCE INDICATORS (KPIS) FOR RPJMN 2015-2019 | 65 4.1 Selecting Appropriate KPIS and Targets for Priority Areas | 65 4.2 KPIS and RPJMN Targets | 66 4.3 Summary of Recommendations and Outcome KPIS | 67

ENERGY SECTOR WHITE PAPER
vi
SUSTAINABLE INFRASTRUCTURE ASSISTANCE PROGRAM: TECHNICAL ASSISTANCE FOR ENERGY RPJMN 2015-2019
LIST OF FIGURES
Figure 1 Indonesian Energy Sources and Uses | 3Figure 2 Oil Production and Consumption in Indonesia (1990-2012/3) | 4Figure 3 Indonesian Natural Gas Reserves | 5Figure 4 Location of principal coal resources | 6Figure 5 Coal Production and Consumption in Indonesia (1990-2012) | 7Figure 6 Map of Major Renewable Resource Potentials | 8Figure 7 Indonesian Geothermal Locations | 9Figure 8 Indonesian Solar Power Potential | 11Figure 9 Wind Potential in Flores and Sumba Region | 12Figure 10 Gas pipelines in Indonesia | 16Figure 11 PLN gap between Plan and Realization: Generation Capacity (IPP and PPU included) | 17Figure 12 PLN gap between Plan and Realization: Transmission and Distribution | 17Figure 13 Electrification Ratio in Indonesia (as of June 2013) | 19Figure 14 Past and planned energy mix of 2011, 2025, to 2050 | 22Figure 15 Who benefits from the fuel subsidies? | 23Figure 16 PSO benefit to each type of customer per month (IDR) | 24Figure 17 Energy Consumption (2012) and Conservation by Sector (Achievement and Targets) | 25Figure 18 Institutional responsibilities in Indonesian Energy | 27Figure 19 Pertamina’s Business Overview | 32Figure 20 National Energy Achievement compared to RPJMN Targets | 35Figure 21 Gap between energy production and needs in business-as-usual scenario | 36Figure 22 Process for identifying Action Plans | 37Figure 23 Funding Gap Methodology | 63
LIST OF TABLES
Table 1 Energy Sector Policy Map | 21Table 2 Government Responsibilities for the Coal Industry | 31Table 3 Investment Needs for Energy 2015-2019 | 62Table 4 Alternative Funding Methods | 64

ENERGY SECTOR WHITE PAPER
vii
SUSTAINABLE INFRASTRUCTURE ASSISTANCE PROGRAM: TECHNICAL ASSISTANCE FOR ENERGY RPJMN 2015-2019
LIST OF ABBREVIATIONS
BOE Barrel of Oil EquivalentBAPPENAS National Planning and Development Agency (Badan Perencanaan dan Pembangunan Nasional)BBM Petroleum Fuel (Bahan Bakar Minyak)BCF Billion Cubic FeetBP Migas Oil and Gas Upstream Implementation Agency (Badan Pelaksana Hulu Minyak dan Gas Bumi)BPD Barrels Per DayBPH Migas Oil and Gas Downstream Implementation Agency (Badan Pelaksana Hilir Minyak dan Gas Bumi)BPPT Agency for Assessment and Applicationof Technology (Badan Pengkajian dan Penerapan Teknologi)CBM Coal Bed MethaneCNG Compressed Natural GasCTL Coal to LiquidDEN National Energy Council (Dewan Energi Nasional)DGEEV Direct Eigen ValueEBR Energy Buffer ReservesEIA United States Energy Information AdministrationFIT Feed in TariffFSRUs Floating Storage and Regasification UnitsGBHN State Primary Development Guidelines (Garis Besar Haluan Negara)GCAs Government Contracting AgenciesGOI Government of IndonesiaGW Giga WattHVAC High Voltage Alternating CurrentHVDC High Voltage Direct CurrentICCTF Indonesian Climate Change Trust FundIDR Indonesian Rupiah (currency)IEA International Energy AssociationIGA Indonesian Gas AssociationIIAPC Independent Indonesian American Petroleum CompanyIPA Indonesian Petroleum AssociationIPP Independent Power ProducerIPPKH Forestry Area Lease and Use Permit (Izin Pinjam Pakai Kawasan Hutan)KEN National Energy Policy (Kebijakan Energi Nasional)KWH Kilo-Watt Hour (kWh)KTOE Kilo Tonne of Oil EquivalentLNG Liquefied Natural GasLPG Liquefied Petroleum GasMBTU Million British Thermal UnitMEMR Ministry of Energy and Mineral ResourcesMIC Middle Income CountryMMCF Million Cubic FeetMMSCFD Million Standard Cubic Feet per DayMMST Million Metric Short TonsMOF Ministry of Finance

ENERGY SECTOR WHITE PAPER
viii
SUSTAINABLE INFRASTRUCTURE ASSISTANCE PROGRAM: TECHNICAL ASSISTANCE FOR ENERGY RPJMN 2015-2019
MP3EI Master Plan for the Acceleration of Indonesian Economic Development and Implementation (Master Plan Percepatan Pembangunan dan Pelaksanaan Ekonomi Indonesia)MTOE Million Ton of Oil EquivalentMTPA Million Tons per AnnumMW Mega WattNRE New and Renewable EnergyPGN State Gas Company (Perusahaan Gas Negara)PIP State Investment Center (Pusat Investasi Pemerintah)PLN State Electricity Company (Perusahaan Listrik Negara)PPA Power Purchase AgreementPPP Public Private PartnershipsPSC Production Sharing ContractPSO Public Service ObligationPV PhotovoltaicRIKEN National Energy Conservation Master Plan (Rencana Induk Konservasi Energi Nasional)RKEN National Energy Policy Blueprint (Rancangan Kebijakan Energi Nasional)RPJMD Regional Medium Term Development Plan (Rencana Pembangunan Jangka Menengah Daerah)RPJMN National Medium Term Development Plan (Rencana Pembangunan Jangka Menengah Nasional)RPJPN National Long Term Development Plan (Rencana Pembangunan Jangka Panjang Nasional)RUED General Plan for Regional Energy (Rencana Umum Energi Daerah)RUEN General Plan for National Energy (Rencana Umum Energi Nasional)RUKN National General Plan for Electricity (Rencana Umum Keternagalistrikan Nasional)RUPTL National Plan for Electricity Development (Rencana Umum Pembangunan Tenaga Listrik)SAIDI System Average Interruption Duration IndexSAIFI System Average Interruption Frequency IndexSKK Migas Special Task Force for Oil and Gas Activities (Satuan Khusus Kegiatan Hulu Minyak dan Gas Bumi)TCF Trillion Cubic FeetTOE Ton of Oil EquivalentUS$ United States Dollar (currency)

ENERGY SECTOR WHITE PAPER: EXECUTIVE SUMMARY
ix
SUSTAINABLE INFRASTRUCTURE ASSISTANCE PROGRAM: TECHNICAL ASSISTANCE FOR ENERGY RPJMN 2015-2019
EXECUTIVE SUMMARY
1. Indonesia is Southeast Asia’s largest economy, with an estimated gross domestic product (GDP) of $878 billion in 2013. Even in the face of a global economic slowdown, the economy has performed well by consistently achieving 4.6-6.5% annual GDP growth over the last decade. Notwithstanding the recent slowdown, according to the Asian Development Outlook (ADO) 2014 report, the country will accelerate back to 6% in 2015.
2. Indonesia’s economic growth aspirations hinge on its ability to secure access to reliable and cost-effective sources of energy. In recent years, energy demand in Indonesia has grown by 7-8% per year, consistently outpacing the country’s economic growth rate. In order for the country to grow at its current rate, domestic demand for energy will have to grow by around 8.0-8.5% per annum.1 And if the new national government that will assume office in October 2014 seeks to accelerate the economic growth rate further, the country’s energy demand will need to grow at a concomitant higher rate.
3. Indonesia has abundant indigenous sources of energy.2 Nonetheless, most indicators suggest that the sector is underperforming and operating far below its potential. The country’s energy sector is characterized by increasingly high levels of oil imports, inefficient use of energy, gross under-investment in both downstream and upstream energy infrastructure, relatively low national electricity access levels for a middle income country, relatively low per capita electricity utilization, and annual consumption of nearly $30 billion in energy and electricity subsidies.
4. Most trends indicate that the country may be heading towards an energy crisis. Electricity shortages have led to recent blackouts and brownouts in North Sumatra and elsewhere, declining reliability of supply in Jakarta and other densely populated regions of Java, with brownouts projected by 2017.
5. The Government of Indonesia (GOI), realizing that the energy sector may well impede the country’s future economic prospects, has refocused its efforts on the sector. In the past 12-15 months, GOI has decisively moved to introduce energy sector reforms focused on bolstering energy security and sustainability. Reflecting this priority the country’s Ministry of Planning (BAPPENAS), has made the energy sector a key focus of the National Medium-Term Development Plan (Rencana Pembangunan Jangka Menengah Nasional, or RPJMN) 2015-2019.
1 For example, according to national power company PLN’s long-term electricity development plan (Rencana Usaha Penyediaan Tenaga Listrik, or RUPTL: 2013-2022) the country’s electricity peak demand is expected to grow from 189 TWh in 2013 to 385 TWh in 2022 which represents a growth rate of 8.4%.2 Remaining coal resources are estimated at 104.8 billion tons, proven oil resources at 4.04 billion barrels, and proven natural gas reserves at 104.7 trillion of cubic feet. The current demand for oil outpaces annual production levels. In recent years, Indonesia has tended to rely more on coal and gas to meet its electricity demand, and this reliance is expected to grow in the future. Indonesia is also well-endowed with renewable energy sources. Besides having the world’s largest level of geothermal resource (28,800 MW), Indonesia is also endowed with abundant hy-dropower (75,000 MW), micro and mini hydropower (769.69 MW), solar (4.80 kwh/m/day), biomass (49,810 MW), and modest wind resources (3-6 m/s), with some locations having higher potential.

ENERGY SECTOR WHITE PAPER: EXECUTIVE SUMMARY
x
SUSTAINABLE INFRASTRUCTURE ASSISTANCE PROGRAM: TECHNICAL ASSISTANCE FOR ENERGY RPJMN 2015-2019
Scope and Objectives6. The Asian Development Bank (ADB) has developed this white paper to inform
and support the energy sector development plans that will be included in the infrastructure section of the RPJMN 2015-2019. This report is based on a review of existing literatures and studies, as well as in-depth interviews of key stakeholders. It is a critical evaluation of the current state of the sector with the aim to identify key challenges and constraints, define key priority areas for strategic intervention, and outline specific strategies and interventions that can be addressed to yield short, medium and long term results. It is not intended to be an in-depth review of any of the energy sub-sectors or issues per se. References to additional sources of information and reports have been highlighted throughout the paper for the reader’s benefit.
Strategic Energy Sector Review7. Indonesia’s energy sector is complex, with widely varying energy demands
throughout an archipelago of 17,000 islands, of which about 6,000 are inhabited at different levels of population density and feature diverse economic activities. Indonesia’s primary energy mix (in terms of total primary energy supply or TPES) in 20123 was comprised of oil (46.7%), coal (23.9%), natural gas (24.1%) and renewable energy (5.1%).
Oil and Gas 8. As an oil producing country, Indonesia has depended heavily on oil to fulfill
its energy needs. However, oil production has fallen steeply from 1.1 million barrels per day (bpd) in 2008 to approximately 825,000 bpd in 2013, while oil consumption has climbed; reaching about 1.5-1.6 million bpd in 2013. Indonesia’s domestic oil production is expected to continue to dwindle at least in the short-to-medium term, meaning that GOI’s target of enhancing domestic oil production to 1 million barrels per day by 2014 is unlikely to be met.
9. In recent years, Indonesia has begun to rely increasingly on natural gas, especially for power production. However, this has not been without challenges. As a key exporter of Liquefied Natural Gas (LNG) for several decades, Indonesia has had to balance its export obligations with increased demand within the country. GOI’s national Energy Policy (Kebijakan Energi Nasional, KEN) emphasizes meeting domestic demand over exports going forward.
10. In the downstream gas sector, Indonesia has followed a policy of maintaining low domestic gas prices to encourage large industrial consumers and power producers to switch from oil to gas. Low domestic gas prices, together with regulatory environment uncertainties, prohibit producers from making further investments. Another challenge in the downstream gas sector is the distance between gas blocks and demand centers for domestic gas consumption. While Indonesia’s domestic production of gas has remained steady in recent years, production is not sufficient to keep up with demand, and the country has initiated imports of LNG, which are expected to increase in the coming years. Exploration of non-conventional sources of gas, such as shale gas and coal-bed methane (CBM), has been limited due to lack of investment and low incentives, compounded by difficulty in getting the gas to market.
3 More recent figures endorsed by the government were not available at the time of writing this report.

ENERGY SECTOR WHITE PAPER: EXECUTIVE SUMMARY
xi
SUSTAINABLE INFRASTRUCTURE ASSISTANCE PROGRAM: TECHNICAL ASSISTANCE FOR ENERGY RPJMN 2015-2019
Coal11. Indonesia is one of the world’s leading exporters of thermal coal with an annual
coal production of about 420 million tons in 2013. Most of Indonesia’s currently known coal reserves are located on the islands of Sumatra and Kalimantan, with Kalimantan accounting for most of high grade coal and Sumatra accounting for most of the country’s low and ultra-low-grade lignite (brown coal). Indonesia’s high quality coal resources, 70% categorized as bituminous and sub-bituminous, are estimated at 104.8 billion tons. Coal is also the most important source of power generation in the country, accounting for over 59% of the country’s capacity in 2012, and is expected to increase in prominence in the medium term. Domestic utilization of coal suffers from several infrastructure bottlenecks, such as limited port and rail transport infrastructure from Kalimantan and Sumatra to the demand centers of Java-Bali. In recent years, the government has stressed increased consumption of coal domestically and has put in measures, such as the capping of annual domestic coal production to about 400 million tons and promoting “mine-mouth” plants, along with long-distance high-voltage transmission lines to bring “coal-by-wire” from mines in Sumatra to demand centers in Java, Bali and even Malaysia. These efforts are yet to yield results and will need added attention in the near term.
New and Renewable Energy12. Renewable energy currently accounts for just about 5% of Indonesia’s primary
energy supply. However, tremendous potential for expansion exists – especially in the case of geothermal, hydropower, wind power, solar photovoltaic (PV) and biomass resources. The establishment of a separate Directorate General for Renewable Energy and Energy Conservation (DGREEC) under The Ministry of Energy and Mineral Resources (MEMR) in 2010 provided a major thrust for renewable energy development in the country.
13. In 2013 about 1,343 MW of geothermal power generation capacity was operational in Indonesia, which is the third largest in the world after the United States and the Philippines. Notwithstanding the passing of a Geothermal Law in 2003 and the inclusion of several projects in the government’s second “Fast Track Program” to accelerate generation expansion, there has been little if any progress in the sector until recently. In recent months, the enabling environment for geothermal power development appears to have improved. The revision of the existing tariff scheme in early 2014 with a more favorable scheme that uses an avoided cost-based ceiling price,4 the signing of financing agreements for a couple of large “keystone” geothermal projects led by independent power producers (IPPs), and the revision of the law to allow geothermal activity in forests are expected to spur further investments.
14. Hydropower development presents a similar situation. Installed capacity of about 3,881 MW is a small fraction of the estimated technical potential of 75,000 MW. Going forward, larger reservoir-based hydropower projects, including pumped storage hydropower plants, are well suited to supply power in high power demand regions of Java and Sumatra, whereas mini or micro hydro run-of-the-river hydropower projects are well suited for base load power generation in parts of Eastern Indonesia. Although hydropower projects with capacity over 1,900 MW are estimated to be under various stages of development currently, progress on permitting, environmental clearances, financing and construction has been
4 The ADB and World Bank provided the analytical basis for this scheme: “Unlocking the Potential for Geothermal Power Development in Indonesia” (ADB and World Bank, 2014, in preparation).

ENERGY SECTOR WHITE PAPER: EXECUTIVE SUMMARY
xii
SUSTAINABLE INFRASTRUCTURE ASSISTANCE PROGRAM: TECHNICAL ASSISTANCE FOR ENERGY RPJMN 2015-2019
slow in the last 5 years. The recent announcement of a favorable feed-in-tariff (FiT) for hydropower projects that are less than 10 MW and the successful financial closure of the IPP-led 47 MW Rajamandala augurs well for greater private sector interest in the sector.
15. GOI also has announced programs and incentives for other renewable sources. It has rolled out ceiling-prices based tendering program for solar PV mini-grids to add 140 MW at 80 locations across the country, and PLN has embarked on the “1,000 Island Program”. Recent studies suggest that there may be about 9 GW of wind potential in the country, with good prospects in South Sulawesi, NTT and perhaps even parts of Java. However, lack of reliable wind resource data and price incentives hinder wind power deployment at scale. It is too early to say if the government issuance of FiTs for small-scale biomass (<=10 MW) and waste-to-energy projects will lead to significant capacity additions. GOI’s efforts also have been conspicuously absent in decentralized generation in urban load centers using solar rooftop PV plants in conjunction with smart metering and distribution optimization.
Power Generation, Transmission and Distribution Infrastructure16. In 2013, Indonesia’s total power generating capacity (including captive and
off-grid generation) was approximately 44,000 MW, of which 36,897 MW was owned by PLN. GOI introduced a plan to accelerate power generation through dual Fast Track Programs, which were announced through Presidential Decree No. 71/2006 (later amended by Presidential Decree No 59/2009), and laid out in PLN’s National Plan for Electricity Development (RUPTL). This program is being rolled out by PLN in two phases. Phase I (FTP-I) was focused exclusively on bringing coal fired power plants online, of which just 5,707 MW out of the 9,975 MW have been delivered. The second phase, FTP-II, planned increases in geothermal power, hydropower, in addition to a bulk of coal power (3,000 MW), but this program, similar to FTP-I, is facing severe delays.
17. The transmission and distribution system in Indonesia is complex. It is installed, operated and maintained by PLN and serves approximately 52 million customer connections. The transmission and distribution network consists of the main interconnected Java-Madura-Bali (Jamali) network, eight other partially interconnected systems and over 600 isolated grid networks. According to RUPTL: 2013-2022, PLN plans to develop an additional 57,132 km transmission lines by 2022. The focus is on strengthening the interconnection backbones and connection among major power plants in Java-Bali, Sumatra and Sulawesi, as well as connecting isolated systems in Kalimantan. In addition, a grid interconnection system to connect Java and Bali and Malaysia, as well as bringing power generated by hydropower plants in Malaysia’s Sarawak province to West Kalimantan, is being implemented with financing support from ADB.
Expanding Energy Access and Rural Electrification18. The country’s national electrification ratio, which has increased in recent years
to 80.50% of households having electricity access in 2013, is still low relative to its middle-income neighbors in Southeast Asia. Moreover, this statistic does not provide a full indication of the duration or quality of supply that the communities are actually experiencing. Grid availability and security of electricity supply remains uneven, particularly in many parts of Eastern Indonesia where the quality of service is inadequate. Providing access to consistently quality electricity and energy services is a difficult and expensive proposition, complicated by limited institutional capacity and available infrastructure.

ENERGY SECTOR WHITE PAPER: EXECUTIVE SUMMARY
xiii
SUSTAINABLE INFRASTRUCTURE ASSISTANCE PROGRAM: TECHNICAL ASSISTANCE FOR ENERGY RPJMN 2015-2019
19. Responsibility for rural electrification and energy access is dispersed among various central government entities, including PLN, MEMR, the Ministry for Disadvantaged Regions, the Agency for Assessment and Application of Technology (Badan Pengkajian dan Penerapan Teknologi, BPPT), and local governments. In the absence of any overarching plan or framework, each actor has pursued isolated activities subject to budget consideration, technology fads, and political considerations. GOI’s overall target is to increase the national electrification ratio to 100% by 2020, but this will be difficult to achieve without a more integrated and concerted effort and clearer investment guidelines.
Energy Policy Review20. KEN (2006), and its 2014 revision, provide overall policy guidance for the
energy sector. A plethora of laws, master plans, and sub-sector policy statement and roadmaps also are prepared periodically by entities responsible for each of the subsectors. For example, PLN prepares its RUPTL, which is then used to support the preparation of the National General Plan for Electricity (Rencana Umum Keternagalistrikan Nasional) or RUKN. The country’s National Energy Conservation Master Plan (Rencana Induk Konservasi Energi Nasional, RIKEN) serves as the overall master document for energy efficiency efforts. A persistent issue with all these policies and strategy documents is that they are often not based on bottom-up extensive data analysis or realistic scenario or goal-setting analysis. Even when planners embark on preparing a more data-intensive planning exercise, such as the recent effort to prepare a gas master plan for the country, the lack of data and third-party verified statistics appear to be insurmountable.
21. Moreover, targets and Performance Indicators (KPIs) of related policies and strategies may not always be aligned, thus hampering the effective implementation of policies or regulations, and causing desired outputs and outcomes to remain out of reach.
Energy Subsidies22. The impacts of prevailing subsidies, widely recognized as a major burden to
Indonesia’s state budget, are well documented.5 Fuel subsidies, covering the difference between container price and the estimated “market” price; and kerosene and LPG subsidies for household use, form the largest group of subsidies, followed by electricity and fertilizer subsidies. Energy subsidies and accompanying price distortions have weakened fiscal balance, incentivized consumers towards energy-intensive behavior, and distorted incentives for investment. The cost of funding energy subsidies in Indonesia inevitably crowds out other uses of public revenues, notably infrastructure investment. In 2014, government spending on fuel subsidies was budgeted at IDR 285 trillion, while the electricity subsidy allocation was about IDR 107 trillion. This represented more than 17% of the total annual state budget. The current draft budget indicates that the subsidies may be reduced in 2015 with IDR 198 Trillion for fuel and IDR 69 Trillion for power.
23. The government has begun to take strong, corrective measures regarding subsidies. In June 2013, after months of delay, GOI announced a steep 44% increase in the price of gasoline and a 22% increase for diesel. The price rise impact on the poor was offset through cash transfer programs to moderate public response to the increase. The government also increased PLN’s electricity tariffs to consumers in mid-2014 by between 8% to 16% depending on the sector. Increased global prices for fuels, and runaway demand leading to a higher demand for imports, continue to challenge the government’s efforts to lower the overall level of subsidies.
5 ADB RETA-7834: Assessment and Implications of Rationalizing and Phasing Out Fossil Fuel Subsidies.

ENERGY SECTOR WHITE PAPER: EXECUTIVE SUMMARY
xiv
SUSTAINABLE INFRASTRUCTURE ASSISTANCE PROGRAM: TECHNICAL ASSISTANCE FOR ENERGY RPJMN 2015-2019
Energy Efficiency 24. The provision of large-scale energy subsidies has meant that the Indonesian
economy is relatively energy inefficient. The energy elasticity of the Indonesian economy is about 1.6. In comparison, Thailand and Singapore have elasticity of 1.4 and 1.1 respectively, and Japan and the U.S. register 0.95 and 0.8. GOI’s targets include the achievement of an energy elasticity of less than 1 and realizing savings of 17% from Business As Usual (BAU) energy consumption projections by 2020.
25. The largest energy conservation targets are set for the transportation sector, followed by industry and households. Removing fossil fuel subsidies is a step in the right direction towards achieving transport energy efficiency, in addition to the development of projects such as the Jakarta Mass Rapid Transit (MRT) system. The government is also in the process of developing minimum efficiency performance standards and related labeling programs for key household appliances, and announcing an energy efficiency building code. Nonetheless, targets cannot be met without an integrated national effort involving standards, policy incentives, regulatory measures, awareness programs, monitoring and enforcement, and coordinated financing/implementation programs.
Climate Change and Environmental Impacts26. While forestry and land use changes are currently the dominant contributors to
Indonesia’s greenhouse gas (GHG) emissions; in the coming years, the energy sector is expected to account for a significant portion. GOI’s national Green House Gases (GHG) reduction schemeor the National Action Plan for Green House Gases (RAN-GRK) aims to reduce CO2 emissions by 26% compared to estimated BAU emissions by 2020. The RAN-GRK is to be supported by a series of region-specific and sub-sector specific emission plans called RAD-GRK. Ongoing preparations of these plans have been delayed. Meanwhile, GOI has been putting into place emission reduction measures on an ad-hoc basis in each subsector, such as requiring large coal plants on Java and possibly Sumatra to deploy efficient boiler technologies, and putting in place incentives for small, fuel-efficient cars.
27. The government is also in the process of developing and registering a set of Nationally Approved Mitigation Actions (NAMAs) in consultation with UNFCCC, including for sustainable urban transport, renewable energy generation, cement industry emission reductions, and solid waste management. To finance the implementation of these NAMAs, GOI has set up the Indonesia Climate Change Trust Fund (ICCTF), which is intended to attract climate investments from international development institutions, bilateral funding sources, and other investors.
28. Despite progress in overall goal setting and planning, GOI will find it very difficult to balance its economic and infrastructure growth targets with emission reduction targets over the next few years. Further, inherent policy conflicts, such as an emphasis on forest protection causing roadblocks for the development of cleaner energy sources, including geothermal and hydropower, would need to be addressed effectively. In addition, expensive and technically challenging Carbon Capture and Storage (CCS) measures6 would be required to counter the country’s planned expansion in fossil fuel-based power generation and increased natural gas production. Overall, the country has been lagging behind in achieving its GHG emissions reductions target since 2013.
6 Both ADB and the World Bank are supporting CCS activities in the gas processing and coal-fired power sectors, respectively. ADB is supporting a pilot project in Java and has expressed interest in supporting a CCS center of excellence in Indonesia.

ENERGY SECTOR WHITE PAPER: EXECUTIVE SUMMARY
xv
SUSTAINABLE INFRASTRUCTURE ASSISTANCE PROGRAM: TECHNICAL ASSISTANCE FOR ENERGY RPJMN 2015-2019
Energy Sector Institutional Setup29. The Indonesian energy sector institutional context is generally regarded as complex;
consisting of MEMR, with its various departments and institutions responsible for regulatory oversight, such as SKK Migas (upstream oil and gas sector) and BPH Migas (downstream oil and gas sector), and state-owned companies (SOEs) such as PT Pertamina, PT PLN and PT PGN. The SOEs and their subsidiaries are managed and regulated by the Ministry of State Enterprises. Other significant stakeholders are the Ministry of Finance (GOI’s budget allocations, and public service obligations or subsidy payments), BAPPENAS (GOI’s central planning agency), and local governments (some tendering and licensing activities). This complex institutional framework covers the policymaking process, as well as the obtaining of regulatory permits and clearances. Since decentralization, it has become imperative that central government agencies and local governments, which are now effectively in charge of energy resources and the issuance of permits for infrastructure projects, coordinate effectively to prevent the stalling of project, as has occurred in the case of several large and small power generation projects across the country.
The Role of the Private Sector30. The private sector has been an important part of Indonesia’s energy sector over
the last two decades, with high levels of participation in mainly upstream oil and gas sectors, as well as in power generation, in which IPPs operate nearly 18% of the country’s power generation capacity. Nevertheless, uncertainties relating to Project Sharing Contracts (PSCs) in upstream oil and gas sectors have affected the confidence of private sector investors, as evidenced by Total’s review of its proposed investments to expand the capacity of its Mahakam gas block. In addition, oil subsidies and low gas prices for DMOs have limited private sector participation in downstream oil and gas sectors, although recent moves by the government to reduce oil subsidies might attract some attention from private sector oil retailers.
31. Recent clarity and incentives from the government for mine-mouth power plants and geothermal power development have increased private sector interest. Nevertheless, land acquisition and permitting procedure hurdles, such as those experienced by the country’s flagship Public Private Partnership (PPP) ultra-supercritical 2x1,000 MW coal power plant in Central Java, are countering these positive developments. The recent investment negative list announcement, which capped foreign direct investment (FDI) in mini-hydro power plants of capacity less than 10 MW to 49%, also has discouraged foreign investment in the mini hydropower sector. Hence, the government needs to re-visit the negative list provisions, while clearing the existing hurdles, to increase private sector participation.
Creating a Sustainable Energy System for Indonesia: Challenges and Solutions
Stabilization of Sector through Incremental Reforms32. A pragmatic approach to energy sector is required through which the sector can
be stabilized through incremental reforms during the upcoming RPJMN 2015-2019 period, and the targeting of major sector overhaul and rapid expansion for RPJMN 2020-2025. This means targeting (i) fast-tracking implementation of large and strategic projects that are either making slow progress or have been stalled, (ii) clearing regulatory and implementation bottlenecks that impede public and

ENERGY SECTOR WHITE PAPER: EXECUTIVE SUMMARY
xvi
SUSTAINABLE INFRASTRUCTURE ASSISTANCE PROGRAM: TECHNICAL ASSISTANCE FOR ENERGY RPJMN 2015-2019
private sector investments, (iii) rationalizing energy pricing to reflect market realities, (iv) speeding up essential policy reforms, and (v) increasing efficiency and capacity of government implementing agencies during the RPJMN 2015-2019 period.
33. The figure below highlights the key challenges faced by the sector as summarized above, and outlines priority areas for government intervention and specific steps within each intervention area.
Diversify and Expand Supply of Fossil Energy34. GOI should carry out regional basin analysis, and seek to identify Yet-to-Find
(YTF) reserves for further exploration by oil and gas companies. This would involve strengthening existing specialized research institutions such as the Geological Agency. Production in existing oil and gas wells should also be increased through the application of EOR. Increasing extraction of gas from high CO2 gas fields should also be encouraged. The government also could promote Coal Bed Methane (CBM) and shale gas development through regulatory reform and technology deployment. Shale gas development in Indonesia may require higher investment cost than in the U.S. due to geological constraints, although precise cost conditions in Indonesia have not yet been determined.
35. Reforms to the existing PSC allocation and extension mechanism should be made an urgent priority for RPJMN 2015-2019. Currently, a large portion of the gas supplied from new developments (approximately 50% or more) is exported, while there is a need to increase the share of gas allocated for the domestic market. A solution is required that will address increased domestic demand, but avoid deterring necessary investment. Reference pricing would help the transition to more attractive domestic prices relative to export options.
36. Value–addition in coal utilization and improving transportation infrastructure for conveying coal to markets are urgent tasks. One high priority coal sector solution would be providing further incentives to encourage the development and
Resolving PrimaryEnergy Supply
Constraints
Diversify and expand supply of fossil fuel
energy RPJMN 2015-2019
CHALLENGES PRIORITY AREAS SUMMARY
PRIORITY AREAS
• Conducive Policy and Regulatory Framework
• Institutional Capacities and Coordination
• Diversified and Comprehensive Financial Planning
• Streamline Energy Sector Planning and Performance Monitoring
• Deepen Implementation Capabilities
• Increase Effectiveness of Environmental Sustainability Measures
ExpandingDownstream Energy
Infrastructure
Scale up renewable energy development
POLICY DIRECTION AND DEVELOPMENT
STRATEGYScaling up EnergyAccess in Rural and
Remote Areas
Expand downstream energy infrastructure
ACTION PLAN WITH KPIS
Investing in EnergyEficiency
Scale-up energy access
FUNDING REQUIREMENTS
Enabling DynamicEnergy Markets
Invest in energy efficiency measures
Improve effectiveness of SOEs and foster private
sector participation
Solutions
UNDERLYING CROSS CUTTING CONSTRAINTS

ENERGY SECTOR WHITE PAPER: EXECUTIVE SUMMARY
xvii
SUSTAINABLE INFRASTRUCTURE ASSISTANCE PROGRAM: TECHNICAL ASSISTANCE FOR ENERGY RPJMN 2015-2019
deployment of mine-mouth power plants that use low-calorie lignite in Sumatra. Another solution would be major steps toward ensuring a smooth supply of coal to the domestic market through development and expansion of coal ports, stockpiling, enhancement of coal mixing capacity, development of an integrated coal transportation system from mine site to mine centers, and improvement of the security and reliability of the coal haulage fleet.
Scale Up Renewable Energy Development37. Despite recent encouraging developments in the geothermal sector, such as the
avoided costs based tariff ceiling and proposed reforms to the tendering mechanism, the current government target of achieving 6,000 MW capacity by 2020 and 9,500 MW by 2025 will be difficult to achieve and should be adjusted to a more reasonable figure. Geothermal projects need 2-4 years of exploration and feasibility study, and approximately another 3-4 years of construction, assuming all bottlenecks are resolved. There are very few projects in the current pipeline that can achieve COD by 2025. In the near–term, the government should focus on operationalizing the Geothermal Fund, reforming the tender process, debottlenecking existing Geothermal Power Development Areas (Wilayah Kerja Panas Bumi, WKP), and continuing to seek access to concessional funds from global sources for supporting brownfield development that is the responsibility of the SOEs.
38. PLN should immediately accelerate the development of identified large hydropower projects, such as Karama and the Sumatra Pump storage project, while seeking to develop a pipeline of projects from within the National Hydropower Master Plan. Additionally, an objective analysis of the feasibility of converting existing multipurpose dams into power projects is advisable. Furthermore, it will be necessary to integrate energy requirements with river basin management to utilize Indonesia’s estimated hydropower capacity of 75,000 MW. In addition, GOI should improve coordination among local governments7, MEMR, and PLN in order to facilitate small hydropower development. GOI should also reconsider the recent negative investment list update, which restricts Foreign Direct Investment (FDI) in small hydro projects.
39. In the case of solar energy, the government should review the solar PV minigrids tendering process and improve efficacy, perhaps through bundling. The feasibility of IPP-led conversion of PLN’s existing diesel grids to solar PV-diesel hybrids also should be evaluated. As well, GOI should roll out a solar PV rooftop program to address urban day-time loads in combination with smart metering and optimizing distribution. Wind and Waste-to-Energy (WTE) projects also require support through appropriate tariff incentives for the former, and incentives for more effective local government support for the latter.
Expanding Downstream Energy Infrastructure
Expand Oil Storage, Refinery, and Distribution Networks40. Indicative estimates suggest that Indonesia must invest approximately US$ 35.86
billion by 2025 to realize a reasonable degree of downstream energy security (30 days of operational reserves and 30 days of emergency buffer reserves), plus an additional US$ 46.14 billion by 2025 to address other downstream infrastructure shortfalls. This level of expenditure equates to US$ 7.6 billion per annum up
7 Local governments tend to hand out location permits to power developers on an unsolicited basis, and these developers often lack the necessary technical and financial capabilities and their development proposals are not technically optimal.

ENERGY SECTOR WHITE PAPER: EXECUTIVE SUMMARY
xviii
SUSTAINABLE INFRASTRUCTURE ASSISTANCE PROGRAM: TECHNICAL ASSISTANCE FOR ENERGY RPJMN 2015-2019
to 2025, which is more than 10 times the amount invested in 2012 (US$ 0.75 billion). To face this challenge, GOI could explore the less expensive “forward placement model” whereby offshore fuel suppliers and traders would be required to store products on Indonesian shores at their expense, rather than offshore, 30 days in advance. Measures to ensure national fuel and LPG supplies and reduce dependence on imports include revamping existing oil refineries and CNG processing plants to increase capacity and meet international fuel standards, providing incentives for upgrading of oil and LPG refineries, and the construction of depot, storage and stockpiling facilities for crude oil, fuel and LPG in order to improve services in remote areas, as well as improving the operational reserve and buffer capacity.
Utilize CNG for Transportation41. Increasing use of CNG for transportation in Indonesia requires the development of
a clear and solid CNG policy covering its usage for transportation and supported by clear environmental and fiscal considerations. Conversion from oil to gas should start in regions close to production sources; ideally within 100 km of supply. Additionally, the government should provide clear upfront incentives, primarily in the form of tax incentives, for CNG-based transportation. Initiation of short-term programs for accelerating conversion from gasoline to CNG would be most plausible for public transportation, for example CNG-powered bajajs and buses.
Develop Small-Scale LNG42. The long distances between production areas and final small markets in Eastern
Indonesia can be addressed most effectively through developing small-scale LNG infrastructure to accommodate small LNG vessels. These would be primarily equipped for coastal shipping and containerized barges, with a capacity of 5 to 30 million standard cubic feet per day (MMSCFD), that can cover the distance between islands. Once on land, LNG is transferred to specialized trucks and distributed to nearby power plants. A 2011 study by PLN8 has shown that small scale LNG shipping routes, such as those connecting Bontang’s LNG sites to gas-fired power plants in South Sulawesi, or Donggi to Bitung, minimize travel time and cost.
Strengthen Transmission and Distribution Network43. Numerous large PLN transmission projects have been delayed due to land
acquisition and funding problems. Additionally, the different systems and manufacturer standards adopted in the past cause incompatibility across regions, which hinders development of an interconnected transmission system. Nevertheless, PLN and the government should focus on fast-tracking planned and ongoing projects, such as backbone transmission networks for Java and Sumatra, and inter-island interconnection lines, such as the planned Java-Sumatra HVDC line. Besides, the government needs to fast-track transmission line projects between Malaysia’s Sarawak and West Kalimantan and Peninsular Malaysia and South Sumatra. Kalimantan is currently the third biggest power demand center in Indonesia after Java-Bali and Sumatra, and its power demand is growing rapidly. PLN’s transmission grid approach in Kalimantan should move away from building isolated grids to developing a backbone transmission network across the load centers of East and South Kalimantan and extending it up to North and North Western Kalimantan. This will also encourage exploitation of hydropower potential in North Kalimantan.
8 PLN Study by in cooperation with Bappenas, Tilburg University, and Pendawa, March 2011

ENERGY SECTOR WHITE PAPER: EXECUTIVE SUMMARY
xix
SUSTAINABLE INFRASTRUCTURE ASSISTANCE PROGRAM: TECHNICAL ASSISTANCE FOR ENERGY RPJMN 2015-2019
Scaling up Energy Access in Eastern Indonesia
Consolidate Multiple Energy Access Programs in a Dedicated Agency44. Meeting the country’s energy access and rural electrification target requires
that the government move away from the current “many agencies and many approaches” paradigm to a single, comprehensive program that integrates least cost electrification planning with innovative business models, and financing, as well as coordination and implementation, that leverage the respective roles and strengths of the central and local governments, the public, and the private sector. The successful rural electrification process of China or Vietnam could provide a model for rapid electrification in Indonesia. In these cases, the creation of well-funded and well-managed programs succeeded in providing electricity to households and communities in remote areas using a combination of off-grid hydro, solar and wind. These programs were coordinated by central agencies, while teams of well-trained and qualified individuals were sent to remote areas.
Investing in Energy Efficiency Formulate Energy Efficiency Action Plans45. Indonesia’s energy efficiency (EE) targets, as defined in RUKEN, need to be
translated into an integrated energy efficiency action plan that encompasses all energy consuming sectors. Key elements of GOI’s future strategy should be a comprehensive program of MEPs, labeling, awareness campaigns and capacity development programs. As well, intensive coordination is imperative among government institutions to empower local governments to implement energy efficiency plans, as well as to provide financing and incentives for the public and energy-intensive industries toward energy efficiency. However, the government appears to have slowed down in its resolve to set up an EE Fund, although Thailand’s success with this provides ample proof that these funds are instrumental in kick starting investments.
Enabling Dynamic Energy Markets
Improve the Effectiveness of SOEs46. The liberalization of the Indonesian energy market, as stipulated in various
policies and regulations, has not happened as expected. Pertamina continues to be the dominant player in both the upstream and down oil and gas sectors. Although Law 30/2009 on electricity ended PLN’s monopoly over the power sector, there have been no subsequent regulations to provide further elaboration or clarification of this partial liberalization. The large energy sector SOEs face the challenges of addressing the competing objectives of generating profits and fulfilling their public service roles, while struggling with limited capital raising capacity, the implementation of projects, and the ushering in of the latest technological innovations. The SOEs may need to be given the autonomy to differentiate between their business activities and “special assignments” as government-owned institutions. Moreover, the government might also consider moving away from the “cost-plus” framework for public service obligations to performance-based approaches wherein the SOEs have longer-term control over their cash flows, and are able to plan effectively.

ENERGY SECTOR WHITE PAPER: EXECUTIVE SUMMARY
xx
SUSTAINABLE INFRASTRUCTURE ASSISTANCE PROGRAM: TECHNICAL ASSISTANCE FOR ENERGY RPJMN 2015-2019
Foster Greater Private Sector Participation47. Private companies should be given a level playing field to compete against state
owned enterprises in which bidding procedures and parameters are clear and implemented transparently. A stable policy and a clear regulatory framework, including a firm incentive scheme will increase market confidence and attract more interest from the private sector. In turn, a competitive energy market is crucial to enhancing the competitiveness and service delivery of SOEs. Gas supply certainty also would help to convince the private sector to invest in the distribution networks and downstream facilities, especially if combined with the completion of Trans Java trunk line to create a huge opportunity to intensify gas use and reduce oil consumption. In the power sector, the government needs to provide certainty in the primary energy supply for coal and gas fired power plants, as well as ensure that newly announced favorable tariff regimes for geothermal, hydropower and other renewable energy resources can be implemented.
Addressing Cross Cutting Constraints Create Conducive Policy and Regulatory Framework48. Gas pricing reform, including a proxy reference price with some exceptions; the
appointment of a gas price aggregator; and a new gas tolling structure are urgently needed. Various existing power plant projects, such as those in Fast Track Program (FTP) 1 and 2, have been delayed due to various bottlenecks, including land acquisition and environmental permits. Currently, GOI is currently establishing the KPPIP (Committee for Acceleration of Priority Infrastructure Provision) to resolve these issues. Once established, KPPIP should debottleneck stalled power plant projects as a matter of priority.
Stay the Course on Removing Fuel and Power Subsidies49. Removing subsidies, and the distortions they create, is widely understood as the
key to improving Indonesia’s energy system. Some progress has been made in reducing price distortions by decreasing subsidies for petrol, diesel, LPG and power, with price rises occurring in 2008, 2013 and 2014. Despite this subsidy reduction progress, the government should continue on this path to attain cost-reflective prices over the next 2-3 years, while also ensuring social protection measures are in place, so that poor households are not over-burdened with increased energy costs.
Strengthen Institutional Capacities and Coordination50. Good governance is a necessary requirement for investment in the energy sector.
Strong and credible energy institutions, in both the public and private sector, are critical to achieving energy sector targets. Each public institution involved in the energy sector must have a clear role and responsibility with distinction between policy making, regulatory and program implementation. The National Energy Council (Dewan Energi Nasional, DEN) should be provided a clear mandate for policy intervention to ensure well-structured coordination of the energy sector. There are a number of options for improving the current institutional arrangements for the oil and gas sector. A single regulator (a new regulatory body) could be created, taking over the present regulatory functions of DG Migas and BPH Migas, while, alternatively, there could be a single contracting authority for the oil and gas sector, providing more consistency in the planning and implementation of downstream projects relative to upstream projects and vice versa. A more radical

ENERGY SECTOR WHITE PAPER: EXECUTIVE SUMMARY
xxi
SUSTAINABLE INFRASTRUCTURE ASSISTANCE PROGRAM: TECHNICAL ASSISTANCE FOR ENERGY RPJMN 2015-2019
proposal would be to combine all the energy sub-sectors into a single category, with one regulator and one contracting agency. From a policy development and implementation perspective, this third proposal merits consideration.
51. The government should also work towards enabling and incentivizing local governments to participate actively in the energy sector, such as making investments in local power generation infrastructure. These incentives can include transferring a portion of the energy subsidy burden to local government budgets.
Develop Comprehensive and Diversified Financial Planning52. Based on data and indicative estimates from various government agencies,
including DEN, BAPPENAS, PLN, MEMR, Ministry of Transportation (MoT), and other development partners and investors, this report estimates that a total of US$197 billion will be required between 2014-2019 to meet the goals of RPJMN 2015-2019, with nearly US$100 billion required in the power sector alone to develop power plants and transmission lines, especially if the government wants to ensure a 100% electrification ratio by 2019 or 2020. Previous studies for RPJMN by BAPPENAS show that the government has allocated US$119 billion for all infrastructure, indicating a possible gap in funding availability which will need to be covered by alternative mechanisms.
53. New investments for the energy sector are required for the exploration of new oil and gas fields, development of gas pipeline infrastructure and FSRU, national strategic fuel reserve for oil and LPG, development of power infrastructure including coal, hydro, gas, geothermal, biomass, and other forms of power plants, as well as transmission lines, and coal transport facilities.
54. The next largest investment is for oil and gas, particularly development of storage facilities for oil and LPG (US$35.92 billion in total) to ensure a sufficient strategic reserve. The development of gas infrastructure, including new fields for supply and new pipelines for transmission and distribution, will require approximately US$58 billion to ensure fulfillment of domestic demand and shifting use from oil to gas. The remaining investments are needed for coal-dedicated transportation, such as coal ports and railways to reduce the damage to national roads from massive volumes of coal transport and to increase productivity by reducing travel time.
Target Diversified Sources of Financing55. Government estimates suggest that IDR 1,370 trillion (US$119 billion) should be
allocated for priority infrastructure development during 2014-2019. However, this is barely enough for the development of power infrastructure alone, which clearly means the country cannot rely on the government budget alone to finance energy development. Currently energy projects are heavily reliant on a mix of state-budget based financing and IPP projects to finance its development. This is not an effective method of development as seen from the slow growth in energy development in the past 5 years. The large volume of funding required for the energy sector for the next 5 years cannot be covered by the national budget (Anggaran Pendapatan dan Belanja Negara, APBN) and IPP financing, and GOI will have to resort to more creative PPP schemes and allow for off-balance sheet financing and strategic financing for development.
Streamline Energy Sector Planning and Performance Monitoring56. The government needs to usher in systematic and ongoing energy sector
planning and performance monitoring across all subsectors. For example, most oil companies use the Society of Petroleum Engineers (SPE) Petroleum Resources
ENERGY SECTOR WHITE PAPER: EXECUTIVE SUMMARY
xxii
SUSTAINABLE INFRASTRUCTURE ASSISTANCE PROGRAM: TECHNICAL ASSISTANCE FOR ENERGY RPJMN 2015-2019
Management System to report their reserves, so it would be a significant improvement for Indonesia to align its categories to those of the SPE. Another case in point would be adopting globally recognized protocols for evaluation and communication of information about geothermal energy resources. When it comes to renewable energy tariff schemes, the data sources and assumptions made to calculate forecasts should be more readily accessible to all parties to improve transparency and understanding. The prices also should be updated at pre-determined regular intervals. In addition, a comprehensive set of energy sector KPIs, which should be applied cross sectorally, are urgently needed to allow for complete monitoring of economy-wide trends and progress.
RECOMMENDATIONS AND KEY PERFORMANCE INDICATORS (KPIS) FOR RPJMN 2015-2019
Key Energy Policies57. The key energy policies stipulated in the Technocratic Draft of RPJMN are:
a. Increase the production of primary energyb. Increase the energy buffer stock and operational reservec. Increase the role of new and renewable energy in the energy mixd. Increase energy accessibilitye. Improve fuel subsidy management to make it more effective and transparent f. Utilize water resources for hydropower
58. One of the problems facing Indonesia’s energy sector is the absence of appropriate indicators. The IAEA guidelines for energy indicators (2005) state that indicators should be able to reflect and guide policymaking and strategic decisions on where to apply policy pressure and where to initiate changes to bring desired results. Furthermore, the indicators should also clearly link with those of other sectors. That would require a thorough understanding of the interrelationships between economic activities to determine the effects of various economic, social and environmental scenarios and their impact on energy production and use.
59. The KPIs currently used in Indonesia’s energy sector lack coherence and clarity, and misrepresent the major energy priority areas. The absence of linkages between energy sector policies and other development goals prevents policies from being targeted more specifically. The indicators also fail to show the critical areas within which the public has the most chance to intervene. RPJMN should encourage application of more comprehensive KPIs.
Summary of Recommendations and Outcome KPIs60. The discussion above has outlined an Action Plan, with solutions intended
to address the various constraints facing the sustainable development of the Indonesian energy system. The following table sets out these solutions into categories of short, medium and long-term impact, as well as detailing KPIs that can be applied to track the implementation success of each solution.

ENERGY SECTOR WHITE PAPER
xxiii
SUSTAINABLE INFRASTRUCTURE ASSISTANCE PROGRAM: TECHNICAL ASSISTANCE FOR ENERGY RPJMN 2015-2019
Priority AreaActions with Short
Term ResultsKPI
Actions with Medium Term
ResultsKPI
Actions with Long Term
ResultsKPI
Diversifying and expanding supply of fossil fuel energy
Increase oil and gas geoseismic survey, including in offshore and deepsea areas
Reserve (mmboe)
Improved incentives for secondary/tertiary recovery
Production (mbpd for oil, mmscf for gas)
Enhance exploration efforts of CBM
Gas Reserve (mmscf)
Reform awarding and extension process of PSCs and blocks
Number of PSCs and processing time (days)
Expand supply of gas for domestic use
Capacity (mmscf)
Incentivize Exploration of Shale Gas
Gas Reserve (mmscf)
Accelerate development of coal transport infrastructure
Capacity (tons/year)
Accelerate development of minemouth power plants
Capacity (MW)
Upgrade brown coal
Capacity (tons)
Scaling up renewable energy development
Operationalize Geothermal Fund
Number of explorations funded and disburse-ment (IDR)
Reform geothermal tender process
Capacity tendered (MW) n/a n/a
Debottleneck existing geothermal WKPs
Number of projects that reach exploration stage
Use existing funding sources and identify new funding sources to undertake geothermal brownfield development
Capacity (MW)
n/a n/a
Speed up execution of hydropower projects under development
Capacity (MW)
Pursue rooftop solar PV
Capacity (MW) n/a n/a
Integrate energy planning into the river basin management
Planned capacity (MW)
Encourage waste to energy generation
Capacity (MW) n/a n/a
Create conducive environment for development of small hydro
Private investment (IDR)
n/a n/a n/a n/a
Improve tender mechanism for solar hybrid IPPs
Capacity tendered (MW)
n/a n/a n/a n/a
Expanding downstream energy infrastructure
Forward placement of oil as EBR
Capacity (days of import equivalent)
Develop operational reserve and EBR
Capacity (days of import equivalent)
n/a n/a
Upgrade existing refineries and integrate oil distribution network
Capacity (bpd)
Develop gas pipeline and distribution network
Capacity (mmscf) and length (km)
n/a n/a
Leverage limited opportunities to utilize CNG for transport
Volume (mmscfd)
Accelerate development of interconnection networks across islands
Capacity (kVA) and length (kms) n/a n/a
Develop small scale LNG transport and power infrastructure
Capacity (mmscf) and power produced (MWh)
n/a n/a n/a n/a

ENERGY SECTOR WHITE PAPER
xxiv
SUSTAINABLE INFRASTRUCTURE ASSISTANCE PROGRAM: TECHNICAL ASSISTANCE FOR ENERGY RPJMN 2015-2019
Priority AreaActions with Short
Term ResultsKPI
Actions with Medium Term
ResultsKPI
Actions with Long Term
ResultsKPI
Scaling Up Energy Access in Rural and Remote Areas
Develop and implement least cost electrification plan
Electrification ratio (%) n/a n/a n/a n/a
Redefine institutions for electrification plan implementation
Electrification ratio (%) n/a n/a n/a n/a
Investing in Energy Efficiency
Develop comprehensive energy efficiency management action plan
Availability of plan
Empower and incentivize local governments to implement and enforce energy efficiency plan
Reduction in energy intensity (%) n/a n/a
Provide financing and incentives for energy efficiency initiatives
Amount (IDR)
Define and implement minimum energy efficiency standards.
Reduction in energy use (%)
n/a n/a
Implement energy efficiency labeling program
Percentage of labeled items (%)
Build capacity to comply with energy efficiency measures
Number of ESCOs and compliance to energy efficiency regulations (%)
n/a n/a
Enabling Dynamic Energy Markets
Differentiate between KPIs for business activities and government assignments for SOEs
Availability of KPIs
Accelerate acquisition of upstream technology and management skills for Pertamina
Production cost (IDR / bbl) and production capacity (bpd)
n/a n/a
Incentivize PLN to promote efficiency
Reduction in cost of production (IDR / kWh)
Provide gas supply certainty to facilitate development of downstream gas sector
Domestic production for domestic supply (%)
n/a n/a
Level playing field for private companies to compete against SOEs
Private investment (IDR)
n/a n/a n/a n/a
Resolve common bottlenecks to allow IPPs to flourish
Installed capacity by IPPs (MW)
n/a n/a n/a n/a
Addressing Cross Cutting Constraints
Implement gas pricing reform
Domestic gas price over international gas price (%)
Develop new gas tolling structure
Private investment in gas sector (IDR)
Apply carbon capture and storage technology
Capacity (tons of GHG)
Develop gas price aggregator
Establish gas price aggregator
Strengthen institutional capacities and coordination for government agencies and SOEs
Achievement of energy targets
n/a n/a
Develop least-cost or avoided cost based pricing mechanism for renewable energy
Issuance of pricing regulation
Consolidate budget and funding sources to finance publicly funded energy sector projects
Available budget (IDR)
n/a n/a
Resolve bottlenecks hindering current power plant projects
Additional capacity (MW)
n/a n/a n/a n/a

ENERGY SECTOR WHITE PAPER
xxv
SUSTAINABLE INFRASTRUCTURE ASSISTANCE PROGRAM: TECHNICAL ASSISTANCE FOR ENERGY RPJMN 2015-2019
Priority AreaActions with Short
Term ResultsKPI
Actions with Medium Term
ResultsKPI
Actions with Long Term
ResultsKPI
Addressing Cross Cutting Constraints
Develop and implement subsidy removal plan, identify targeted subsidy beneficiaries
Reduction in energy subsidy (IDR)
n/a n/a n/a n/a
Manage energy sector data under specialized institution
Reduction of time lag for issuance of accurate energy sec-tor data
n/a n/a n/a n/a
Integrate overall energy sector planning
Reduction in number of energy sec-tor plans
n/a n/a n/a n/a
Develop and implement environmental safeguards
Number of projects adopting en-vironmental safeguards
n/a n/a n/a n/a
Utilize domestic and international funds to implement NAMAs
Reduction in GHG (tons) n/a n/a n/a n/a

ENERGY SECTOR WHITE PAPER
xxvi
SUSTAINABLE INFRASTRUCTURE ASSISTANCE PROGRAM: TECHNICAL ASSISTANCE FOR ENERGY RPJMN 2015-2019
This page is intentionally left blank

ENERGY SECTOR WHITE PAPER
1
SUSTAINABLE INFRASTRUCTURE ASSISTANCE PROGRAM: TECHNICAL ASSISTANCE FOR ENERGY RPJMN 2015-2019
Indonesia’s economic growth aspirations hinge on securing access to reliable, cost effective sources of energy. In recent years, energy demand in Indonesia has grown by 7-8% per year,9 consistently outpacing the country’s economic growth rate. In order for the country to grow at its current rate, domestic demand for energy will have to grow by around 8.0-8.5% per year.10 If the new national government assuming office in October 2014 seeks to accelerate the economic growth rate, the country’s energy demand will need to grow at a concomitantly higher rate.
Fortunately, Indonesia has abundant indigenous energy resources, including non-renewable oil, gas and coal reserves. Indonesia also has geothermal, hydropower, biomass, and wind power energy potential.11
The government of Indonesia (GOI) recognizes the economic importance of the energy sector, as well as the challenges faced. Over the past 12-15 months, GOI has moved towards introducing energy sector reforms, with energy security and sustainability at their core. The newly revised National Energy Policy (KEN), adopted in January 2014, aims to prioritize utilization of the country’s abundant coal, natural gas and renewable energy resources; tore-direct coal and natural gas production from exports to domestic consumption; and to achieve a primary energy supply mix by 2025 to ensure energy security amid growing energy demand, while reducing carbon emissions, as well as the energy elasticity and intensity of the country’s economy. In addition to KEN, the government also has increased fossil fuel and electricity prices and moved to unlock private sector investment in renewable power generation, for instance through revision of the Geothermal Law, improved pricing and tendering mechanisms for Geothermal projects, and Solar PV capacity tendering and auctions.The National Medium-Term Development Plan 2010-2014 (RPJMN) highlighted energy infrastructure and set targets for energy security indicators, including increases in oil production, generation capacity, electrification, and use of renewables. However, most of these targets have not been achieved. RPJMN 2015-2019 provides an opportunity for a comprehensive energy sector plan encompassing priority actions, strategic interventions and realistic targets.
Reflecting this priority, BAPPENAS, Indonesia’s Ministry of Planning, has made the energy sector a key focus of the upcoming RPJMN 2015-2019. To this end, BAPPENAS has requested that Asian Development Bank (ADB) facilitate a dialogue among development partners and relevant institutions within Indonesia to analyze key energy security issues, and support the development of priority actions for inclusion in RPJMN 2015-2019.
ADB has developed this white paper on the basis of existing literature and studies and interviews with key stakeholders to inform and support the energy sector development planning process. This critical evaluation of the current state of the sector aims to
9 Source: Bappenas, Background Study on Energy, RPJMN 2015-2019 (2013)10 For example, according to PLN, the national power company’s long-term electricity development plan (Rencana Usaha Penyediaan Tenaga Listrik, or RUPTL: 2013-2022) the country’s electricity peak demand is expected to grow from 189 TWh in 2013 to 385 TWh in 2022 which represents a growth rate of 8.4%.11 Current coal reserves in the country are estimated at104.8 billion tons, proven oil reserves at 4.04 billion barrels, and proven natural gas reserves at 104.7 trillion cubic feet, 23 remaining years of oil reserves, 59 years of gas, and 146 years of coal at current production rates. Beyond fossil fuel, Indonesia has large renewable energy resources. The country’s geothermal potential of 28,800 MW (estimated as largest in the world), while untapped hydropower potential is estimated at over 75,000 MW), solar power at4.80 kwh/m2/day, biomass at 49,810 MW, and wind power 9,290 MW.
SCOPE AND OBJECTIVES1

ENERGY SECTOR WHITE PAPER
2
SUSTAINABLE INFRASTRUCTURE ASSISTANCE PROGRAM: TECHNICAL ASSISTANCE FOR ENERGY RPJMN 2015-2019
identify key challenges and constraints, define key priorities for strategic intervention, and outline specific strategies and interventions.
Because addressing all current energy sector challenges will be difficult within the five-year period of the new RPJMN, this white paper identifies priority areas and suggests actionable solutions with targets that can be implemented within the 2015–2019 period. It also identifies reforms that will ensure consistent and sustainable development of the energy sector in the next decade. It is not intended to be an in-depth review of any of the energy sub-sectors or issues per se. References to additional sources of information and reports have been highlighted throughout the paper for the reader’s benefit.
2.1 BackgroundIndonesia’s energy sector is complex, with widely differing energy needs given that the country is an archipelago comprised of 17,000 islands; of which about 6,000 are inhabited, and have varying degrees of population density and economic activity. In 2012, Indonesia’s primary energy mix (in terms of Total Primary Energy Supply or TPES) was dominated by oil at 46.7%, followed by coal at 23.9%, natural gas at 24.3%,and renewable energy, including geothermal, hydro, solar, and biomass, at 5.1%.12 However, various challenges to the energy sector, such as inadequate infrastructural development and distorted energy prices, have created a mismatch between energy sources and their uses (See Figure 1). Only 23% of the country’s total coal production is used to meet domestic demand. Also, Indonesia is dependent on imported oil products, but exports 25% of its domestic oil supply. The transportation sector remains heavily dependent on oil (83%) despite the abundance of gas, of which 59% is exported. Despite large potential for renewable energy, hydro and geothermal energy provide just 2% combined of the total energy supply. Millions of households continue to rely on traditional biomass (84%), in particular wood, for cooking despite known respiratory hazards.
2.1.1 Supply and Demand OverviewIndonesia’s energy demand is projected to grow by 7-8% per year, higher than the country’s projected economic growth of 4.6-6.5%. Appropriate energy policy and infrastructure delivery will be required to ensure extensive expansion of reliable energy to support consistent economic growth.
The 2014 revision of the country’s National Energy Policy (KEN) sets a target energy mix of 25% oil, 22% gas, 30% coal, and 23% New and Renewable Energy (NRE) for a total of 380 mtoe by 2025. Compared to Indonesia’s 2011 energy mix (165 mtoe),13 the proportion of oil is expected to decrease significantly (50% to 25%), while NRE will increase significantly (4% to 23%). Reducing the role of oil will require major shifts in the transportation sector (consumes 35% of oil supply) and electricity sector (11%). Increasing the NRE contribution to 23% (from 6.5 mtoe in 2011 to 87.4 mtoe in 2025) will require that the majority of currently identified NRE resources be exploited by 2025. Achieving this by 2025 will require massive, comprehensive energy sector reforms, and increased targeted investments.
12 Excludes traditional biomass.Source:Bappenas, Policy Paper on KEN, 201213 Source: Bappenas, Policy Paper on KEN, 2012
2 STRATEGIC ENERGY SECTOR REVIEW

ENERGY SECTOR WHITE PAPER
3
SUSTAINABLE INFRASTRUCTURE ASSISTANCE PROGRAM: TECHNICAL ASSISTANCE FOR ENERGY RPJMN 2015-2019
COAL 50%
HYDRO & GEOTHERMAL 2%
BIOFUEL 2%
BIOMASS 9%
GAS 17%
OIL 20% (11% Domestic, 9% Imported)
EXPORT 38.5%
EXPORT 5%
ELECTRICITY 6.5%
ELECTRICITY 2%
ELECTRICITY 2.5%
ELECTRICITY 2%
NON-ENERGY USES 1%
TRANSPORTATION 7%
TRANSPORTATION 2%
EXPORT 10%
INDUSTRY 5%
INDUSTRY 7.5%
HOUSEHOLD 1.5%
HOUSEHOLD 1.5%
INDUSTRY 1.5%
INDUSTRY 4%
Map of Natural Energy Sources and Uses 2011
2.1.2 Primary Energy
A. Oil & GasIndonesia, once a net exporter of oil, saw production fall steeply from 1998. The country became a net importer in 2004, and its OPEC membership was suspended in 2008 (see Figure 2). Crude oil production decreased further from 1.1 million bpd in 2008 to approximately 825,000 bpd in 2013, or 925,00014 bpd, including condensates. Indonesia depends heavily on oil (diesel, gasoline and fuel oil among others) to fulfill its domestic energy needs, consuming 1.5-1.6 million bpd in 2013.The oil sector has been characterized by chronic under-investment in the last decade, especially in upstream oil infrastructure. The decline in oil production is due to several factors, including depleting reserves, inadequate investment in exploring new oil fields, and uncertainty over production sharing contract (PSC) extension, which has dis-incentivized investment for new secondary recovery technology (i.e. Enhanced Oil Recovery or EOR). SKK Migas, the government’s special task force institution for upstream oil and gas activities, estimates that there are still 43.7 billion barrels of oil to be extracted, although only 4.04 billion barrels is proven.15
Figure 1. Indonesian Energy Sources and UsesSource: Tusk Advisory Analysis, 2014 based on MEMR 2011 data (as of the writing of this paper, 2011 data was the most recent published.)
14 825,000 bpd crude oil (data from Bappenas) or 925,000 bpd production (data from US Energy Information Agency) including oil condensates15 Based on Workshop Presentation by Ir. Jarman, DG Electricity, MEMR, delivered on December 4th 2012
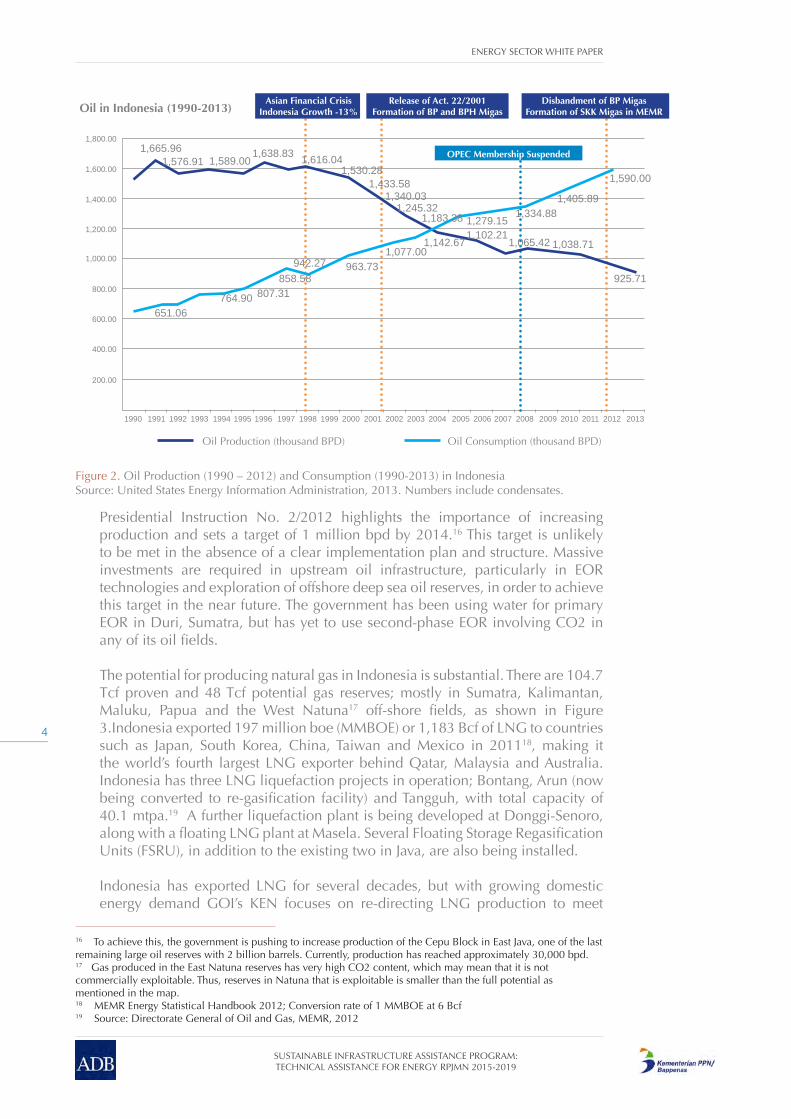
ENERGY SECTOR WHITE PAPER
4
SUSTAINABLE INFRASTRUCTURE ASSISTANCE PROGRAM: TECHNICAL ASSISTANCE FOR ENERGY RPJMN 2015-2019
Figure 2. Oil Production (1990 – 2012) and Consumption (1990-2013) in IndonesiaSource: United States Energy Information Administration, 2013. Numbers include condensates.
Presidential Instruction No. 2/2012 highlights the importance of increasing production and sets a target of 1 million bpd by 2014.16 This target is unlikely to be met in the absence of a clear implementation plan and structure. Massive investments are required in upstream oil infrastructure, particularly in EOR technologies and exploration of offshore deep sea oil reserves, in order to achieve this target in the near future. The government has been using water for primary EOR in Duri, Sumatra, but has yet to use second-phase EOR involving CO2 in any of its oil fields.
The potential for producing natural gas in Indonesia is substantial. There are 104.7 Tcf proven and 48 Tcf potential gas reserves; mostly in Sumatra, Kalimantan, Maluku, Papua and the West Natuna17 off-shore fields, as shown in Figure 3.Indonesia exported 197 million boe (MMBOE) or 1,183 Bcf of LNG to countries such as Japan, South Korea, China, Taiwan and Mexico in 201118, making it the world’s fourth largest LNG exporter behind Qatar, Malaysia and Australia. Indonesia has three LNG liquefaction projects in operation; Bontang, Arun (now being converted to re-gasification facility) and Tangguh, with total capacity of 40.1 mtpa.19 A further liquefaction plant is being developed at Donggi-Senoro, along with a floating LNG plant at Masela. Several Floating Storage Regasification Units (FSRU), in addition to the existing two in Java, are also being installed. Indonesia has exported LNG for several decades, but with growing domestic energy demand GOI’s KEN focuses on re-directing LNG production to meet
16 To achieve this, the government is pushing to increase production of the Cepu Block in East Java, one of the last remaining large oil reserves with 2 billion barrels. Currently, production has reached approximately 30,000 bpd. 17 Gas produced in the East Natuna reserves has very high CO2 content, which may mean that it is not commercially exploitable. Thus, reserves in Natuna that is exploitable is smaller than the full potential as mentioned in the map.18 MEMR Energy Statistical Handbook 2012; Conversion rate of 1 MMBOE at 6 Bcf19 Source: Directorate General of Oil and Gas, MEMR, 2012
Oil in Indonesia (1990-2013)Asian Financial Crisis
Indonesia Growth -13%Release of Act. 22/2001
Formation of BP and BPH Migas
OPEC Membership Suspended
Disbandment of BP MigasFormation of SKK Migas in MEMR
1990
200.00
651.06
1,665.961,576.91 1,589.00
1,638.83 1,616.041,530.28
1,433.581,340.03
1,245.32
764.90 807.31858.58
942.27 963.731,077.00
1,142.67
1,183.38 1,279.15 1,334.881,405.89
1,590.00
925.71
1,038.711,065.421,102.21
400.00
600.00
800.00
1,000.00
1,200.00
1,400.00
1,600.00
1,800.00
1991 1992 1993 1994 1995 1996 1997 1998 1999 2000 2001 2002 2003 2004 2005 2006 2007 2008 2009 2010 2011 2012 2013
Oil Production (thousand BPD) Oil Consumption (thousand BPD)

ENERGY SECTOR WHITE PAPER
5
SUSTAINABLE INFRASTRUCTURE ASSISTANCE PROGRAM: TECHNICAL ASSISTANCE FOR ENERGY RPJMN 2015-2019
domestic demand. Indonesia’s domestic production of gas has been stable in recent years and domestic consumption – at 1,329 Bcf in 2012 – is low compared to the large domestic production (2,559 Bcf).20 However, a large portion of upcoming gas production capacity has been committed to export markets, so growing domestic energy demand may necessitate some import of LNG.
According to PLN, Liquefied Petroleum Gas (LPG) is heavily utilized for household and industrial purposes, with 5.6 million tons consumed in 2013, of which 59% was imported, while 4.4 million tons were subsidized.21
The upstream gas infrastructure sector faces similar challenges; chronic under-investment in exploration of offshore and deep sea gas reserves and in technologies to extract gas from reserves with high carbon and sulphur content. Regulatory uncertainty and hurdles due to modifications to PSCs and SKK Migas, as well as the decentralizing of governance have had a negative impact. For example, the Indonesian subsidiary of French oil and gas giant Total, which is the country’s largest gas producer, announced in 2013 that amid uncertainties surrounding the extension of its PSC, it will revisit its investment plans for capacity expansion at the Mahakam gas block off of East Kalimantan.
Aside from conventional natural gas, Indonesia has vast potential in non-conventional sources of gas, such as Coal Bed Methane (CBM) and Shale Gas. CBM potential in Indonesia is 453 Tcf, making it the largest in the South East Asia region, whereas Shale Gas potential is 567 Tcf.22 There are 20 PSCs exploring CBM potential and one exploring Shale Gas potential.23 Neither of these resources has been exploited due to lack of regulations that clarify government support and incentives for concession holders.
20 Source for both consumption and production data: United States Energy Information Administration, 201321 International Institute of Sustainable Development, “Indonesia Energy Subsidy Review: Volume 1”, March 201422 Source for both CBM and shale: Gas Development Master Plan, developed by Petroleum Development Consultants, IndII, 201323 Based on latest public update from SKK Migas Website, retrieved on May 25th 2014
ACEH 5.56
NORTH SUMATRA 1.29
CENTRAL SUMATRA 9.01
WEST JAVA 4.24
NATURAL GAS RESERVES (TSCF)
EAST JAVA 5.73
KALIMANTAN17.36
SULAWESI3.03
MALUKU15.02
PAPUA 23.91
SOUTH SUMATRA 15.79
NATUNA 50.94
Figure 3. Indonesian Natural Gas ReservesSource: MEMR, 2011

ENERGY SECTOR WHITE PAPER
6
SUSTAINABLE INFRASTRUCTURE ASSISTANCE PROGRAM: TECHNICAL ASSISTANCE FOR ENERGY RPJMN 2015-2019
24 International price is above $14. Source for international price: Japan Liquefied Natural Gas Index, May 201425 Source: ADB Energy Outlook 2013.26 Based on Workshop Presentation by Ir. Jarman, DG Electricity, MEMR, delivered on December 4th 201227 Based on coal classification in IEA.
In the downstream gas sector, Indonesia maintains low domestic gas prices to encourage large industrial consumers and power producers to switch from oil to gas. Prices for domestic sale of gas, under the mandatory Domestic Market Obligation (DMO), are regulated by GOI. The domestic price of gas, while recently trending upwards toward US$9-10 per mmbtu, is still well below international prices; as in Singapore or Korea.24 Relatively low domestic gas prices, together with regulatory environment uncertainty, prohibit producers from investing in further exploration, capacity increases and efficiency improvements.
Another challenge in the downstream gas sector is the distance between gas blocks and demand centers. Gas distribution pipelines, which are owned and operated by state-owned PT Perusahaan Gas Negara Tbk. (PGN), are not well integrated due to lack of open access, which results in inefficient transmission and distribution of gas. Gas pipelines have not been well integrated with CNG stations and re-gasification units. The government relies on SOEs, such as PGN and Pertagas (a Pertamina subsidiary) to invest in transmission and distribution infrastructure, but progress has been slow. In 2013, only 16 gas filling stations had been developed and less than 80,000 households had access to piped gas.25
B. CoalIndonesia’s coal resources are estimated at over 104.8 26 billion metric tons. Figure 4 shows the location of different types of coal, with higher quality coal located in Kalimantan and parts of Java. The international market considers Indonesian coal to be of high quality, with 70% of the country’s coal reserves categorized as bituminous and sub-bituminous, while only 30% is categorized as low-grade lignite.27 Most lower quality (sub-bituminous and lignite) coal deposits, with calorific value of less than 6,100 cal/gram, are found in Sumatra.
Figure 4. Location of principal coal resourcesSource: PLN, MEMR Geological Agency, 2011
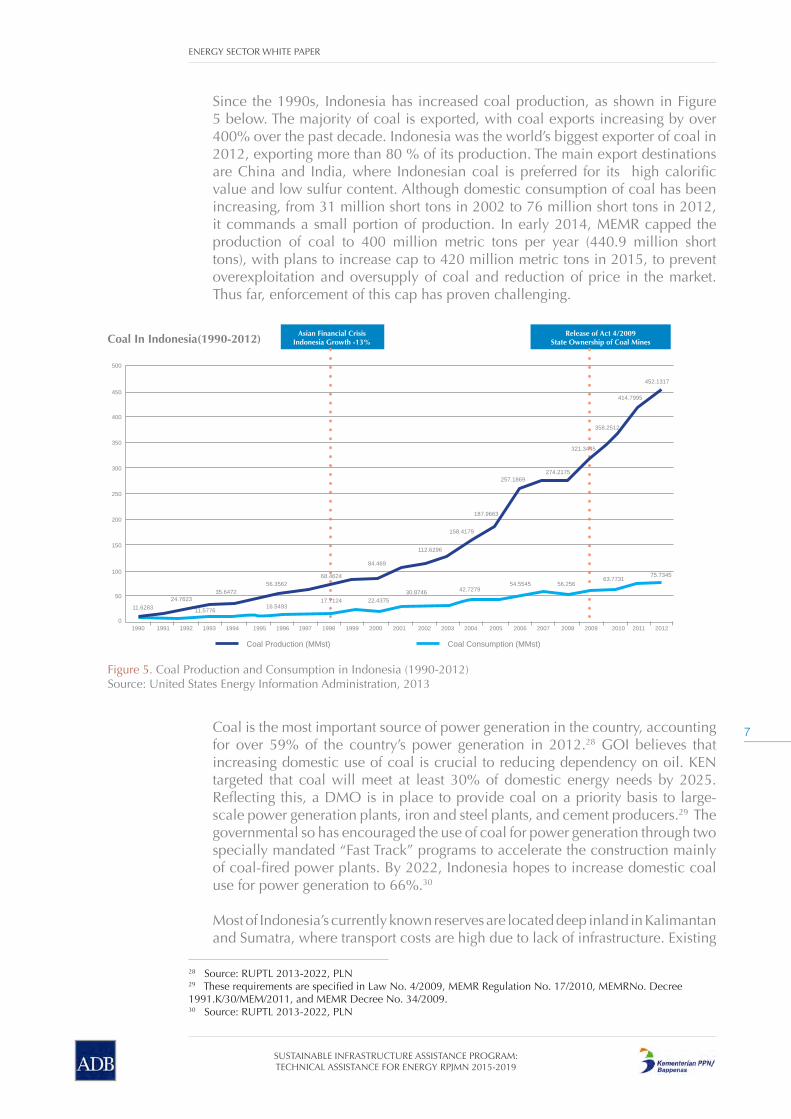
ENERGY SECTOR WHITE PAPER
7
SUSTAINABLE INFRASTRUCTURE ASSISTANCE PROGRAM: TECHNICAL ASSISTANCE FOR ENERGY RPJMN 2015-2019
Coal is the most important source of power generation in the country, accounting for over 59% of the country’s power generation in 2012.28 GOI believes that increasing domestic use of coal is crucial to reducing dependency on oil. KEN targeted that coal will meet at least 30% of domestic energy needs by 2025. Reflecting this, a DMO is in place to provide coal on a priority basis to large-scale power generation plants, iron and steel plants, and cement producers.29 The governmental so has encouraged the use of coal for power generation through two specially mandated “Fast Track” programs to accelerate the construction mainly of coal-fired power plants. By 2022, Indonesia hopes to increase domestic coal use for power generation to 66%.30
Most of Indonesia’s currently known reserves are located deep inland in Kalimantan and Sumatra, where transport costs are high due to lack of infrastructure. Existing
Figure 5. Coal Production and Consumption in Indonesia (1990-2012)Source: United States Energy Information Administration, 2013
28 Source: RUPTL 2013-2022, PLN29 These requirements are specified in Law No. 4/2009, MEMR Regulation No. 17/2010, MEMRNo. Decree 1991.K/30/MEM/2011, and MEMR Decree No. 34/2009.30 Source: RUPTL 2013-2022, PLN
Since the 1990s, Indonesia has increased coal production, as shown in Figure 5 below. The majority of coal is exported, with coal exports increasing by over 400% over the past decade. Indonesia was the world’s biggest exporter of coal in 2012, exporting more than 80 % of its production. The main export destinations are China and India, where Indonesian coal is preferred for its high calorific value and low sulfur content. Although domestic consumption of coal has been increasing, from 31 million short tons in 2002 to 76 million short tons in 2012, it commands a small portion of production. In early 2014, MEMR capped the production of coal to 400 million metric tons per year (440.9 million short tons), with plans to increase cap to 420 million metric tons in 2015, to prevent overexploitation and oversupply of coal and reduction of price in the market. Thus far, enforcement of this cap has proven challenging.
Coal In Indonesia(1990-2012)
1990
11.628324.7623
11.5776
35.647256.3562
68.4624
84.469
112.6296
22.437530.8746 42.7279
54.5545 56.25663.7731 75.7345
452.1317
414.7995
358.2512
321.3445
274.2175257.1869
187.9663
158.4179
16.5493
0
50
100
150
200
250
300
350
400
450
500
1991 1992 1993 1994
Coal Production (MMst) Coal Consumption (MMst)
1995 1996 1997 1998 1999 2000 2001 2002 2003 2004 2005 2006 2007 2008 2009 2010 2011 2012
Asian Financial CrisisIndonesia Growth -13%
Release of Act 4/2009State Ownership of Coal Mines
17.7124

ENERGY SECTOR WHITE PAPER
8
SUSTAINABLE INFRASTRUCTURE ASSISTANCE PROGRAM: TECHNICAL ASSISTANCE FOR ENERGY RPJMN 2015-2019
rail transport is insufficient, and truck haul cost to barge points and terminals is almost twice that of rail. Given the low prices in international markets and the high transport costs, it is generally not economically viable to export Sumatra’s low-grade coal. Additionally, congested ports also limit transport of coal from Kalimantan and Sumatra to demand centers in Java and Bali. Delays in realizing capacity enhancements to barge and transport infrastructure cause inefficiencies in domestic coal utilization.
GOI has made several attempts to improve coal transport infrastructure, but progress has been slow. The Ministry of Transport’s National Port Master Plan lists development of coal ports in Kalimantan, but implementation faces bottlenecks. Specialized railways for coal in Sumatra also exist in the draft National Railway Master Plan, but this planning document is still under development and has not yet received a higher-level mandate or legal authorization. Private sector and SOEs are keen to invest. For example PT Bukit Asam plans to build a railway line in Sumatra to exclusively carry high-grade coal. However, investment in specialized railways will not be financially feasible if restrictions remain in place.
C. New and Renewable Energy (NRE)Indonesia has abundant renewable energy potential. The country’s equatorial position, archipelagic geography, and tropical climate create many possibilities for hydropower, as well as geothermal, solar, wind and biomass energy. Indonesia’s hydro, geothermal and solar potential are illustrated in the figure below. In 2012, renewable energy accounted for just 5% of Indonesia’s primary energy supply.31 GOI, realizing the importance of tapping renewable energy resources, established a separate Directorate General of Renewable Energy and Energy Conservation under MEMR in 2010, which has provided a major thrust for renewable energy development, although the unit’s current capacity is limited.
Figure 6. Map of Major Renewable Resource PotentialsSource: Bappenas, PLN, WWF (various years); Tusk Analysis, 2014
31 Excluding traditional biomass.

ENERGY SECTOR WHITE PAPER
9
SUSTAINABLE INFRASTRUCTURE ASSISTANCE PROGRAM: TECHNICAL ASSISTANCE FOR ENERGY RPJMN 2015-2019
Geothermal PowerIndonesia’s geothermal potential is estimated as the largest in the world at about 28,800 MW (see Figure 7 for locations). In 2013, Indonesia had achieved about 1,343.5 MW of operational geothermal power generation, the third largest in the world after the U.S. and Philippines. Although GOI includes geothermal energy development as a key activity under the second national “Fast-Track” program, progress has been slow due to pricing mechanism uncertainty, power off-take contracts, inefficient regional tendering processes, lack of clarity on exploration investment and subsequent cost recovery, and delays in obtaining permits and clearances. As a result, just 135 MW of capacity has been added since 2010, and just two new Power Purchase Agreements (PPAs) have been signed between PLN and privates sector contractors since 2012 despite the passage of a new FiT regime.
PT Pertamina Geothermal Energy (PGE), a Pertamina subsidiary, suffers from lack of capital allocation and the burden of older, undeveloped concessions, which require renegotiation to be financially viable. Also, utilization of resources provided by the Clean Technology Fund (CTF), such as that of an initial allocation under CTF to Pertamina under a World Bank loan, has been slow. Project funding has yet to be disbursed; hindering progress. In addition, a $300 million Geothermal Fund set up by the government in 2011 to provide funding to de-risk exploration is not yet operational.
This and other recent progress by GOI is encouraging. Geothermal Law No. 27/2003 has been revised to allow geothermal exploration and exploitation in protected forests. Furthermore, tender authority, which was previously under local governments, is now with the central government. A pricing mechanism based on Feed-in-Tariff (FiT) for geothermal power projects, issued following a joint ADB-World Bank Study, was further refined in 2014 with ceiling prices based on avoided cost.32,33 Long-lingering projects also have started to move. The 330 MW Sarulla geothermal project in North Sumatra, developed by a consortium of investors from Japan, U.S. and Indonesia, achieved financial closure in May 2014 and is expected to start first phase operation by 2016. However, the sector will need to gather considerable momentum to reach the government’s stated targets of 6,000 MW total installed capacity by 2020 and over 9,500 MW by 2025.
Figure 7. Indonesian Geothermal LocationsSource: BadanGeologi, MEMR, 2013; Indonesian Geothermal Handbook, Bappenas, 2013
32 MEMR Decree No. 17/2014.33 ADB and World Bank. “Unlocking Indonesia’s Geothermal Potential” (final draft, 2014).
Number of Geothermal locations 299Total potency: 28.8GW (As of 2013) Volcanic system
Non-Volcanic system

ENERGY SECTOR WHITE PAPER
10
SUSTAINABLE INFRASTRUCTURE ASSISTANCE PROGRAM: TECHNICAL ASSISTANCE FOR ENERGY RPJMN 2015-2019
HydropowerThe hydropower sector situation is similar. Although 75,000 MW of hydropower potential exists, just 3,881 MW capacity has been installed. Larger reservoir-based hydropower projects, including pumped storage hydropower plants, are well suited to supply peaking power in high power demand regions of Java, whereas mini or micro run-of-the-river hydropower projects would be well suited for provinces in Eastern Indonesia. Although hydropower projects of over 3,754 MW capacity are under various stages of development, progress has been slow over the past few years.
GOI and PLN have been coordinating to ease the permitting process for four hydropower projects with total capacity 146 MW34 in East Java that are being developed by PT Indonesia Power, a PLN subsidiary. The 47 MW Rajamandala hydropower project in West Java and the 360 MW Maung hydropower project in Central Java also have been making progress. Another key project will be the Upper Cisokan pumped storage facility, which is planned to provide 1,040 MW to the Java grid. Besides these, additional pumped storage projects in Sumatra and Java are being looked into. Some of the larger projects, including IPP-led projects, were delayed by lack of off-take guarantees, but have begun to move, meaning that the sector may start to see progress.
Beyond these larger hydro projects, a series of successfully commissioned mini and micro hydropower projects by PLN and IPPs in NTB, NTT, Papua and other provinces of Eastern Indonesia have provided the necessary project development experience to build further capacity.35 In addition, PLN has signed PPAs for several run-of-the-river mini hydropower plants in Central Java, Sumatra and Sulawesi that are being developed by IPPs with financing support from private equity funds, such as Mandiri Investment Management and Armstrong Asset Management. MEMR also recently established a new FiT for mini-hydro energy under 10 MW to further encourage small-scale hydro power.36 The government is screening 239 possible locations to identify 5-6 dam sites of over 30 MW for possible conversion and development by IPPs into multipurpose dams to be managed by the Ministry of Public Works. Possible locations include Sutami, Kesamben, and Lodoyo in East Java.
Solar Power As an equatorial country with constant sun exposure, Indonesia has good solar power potential (see Figure 8). PLN has developed a plan to replace isolated diesel power with 140 MW solar PV by 2015 and 620 MW solar power plants by 2020 (including solar thermal power plants). These targets are modest compared to the 5,472 MW installed diesel capacity as of 201137 and the 10,058 MW of diesel captive power.38
GOI could use Indonesia’s solar power energy potential most optimally in three ways: 1) mini-grids for lighting and thermal purposes in isolated grids of eastern and rural Indonesia, or possibly for urban loads in these areas; 2) solar home systems in very remote areas of Indonesia, especially eastern Indonesia; and 3) solar rooftops in urban areas.
34 PLN RUPTL 2013-2022.35 Supported by ADB Loan-1982.36 MEMR Decree No. 12/2014.37 MEMR (2012), “Handbook of Energy & Economic Statistics of Indonesia.”38 GIZ (November 2013), “Overview of Diesel Consumption for Captive Power in Indonesia.”

ENERGY SECTOR WHITE PAPER
11
SUSTAINABLE INFRASTRUCTURE ASSISTANCE PROGRAM: TECHNICAL ASSISTANCE FOR ENERGY RPJMN 2015-2019
39 MEMR Decree No. 17/2013.40 Solar Home Systems (SHS) are less suitable for electrifying rural areas. Between 1997 and 2003, the World Bank ran a program to install SHS for rural areas but sustained benefit could not be reaped. Without continued funding assistance, rural households could not maintain the SHS provided. Furthermore, SHS companies were reluctant to provide maintenance service in remote areas. As a result, solar power plant becomes the preferred delivery method for rural electrification.
GOI has taken encouraging initiatives for solar power in recent years. MEMR and PLN have implemented several isolated grid and off-grid Solar PV projects in Indonesia, with installed Solar PV capacity estimated to be about 43 MW as of 2013. However, the use of standard design across diverse communities, particularly in MEMR systems, has resulted in some systems being technically inappropriate and unable to adjust to future load growth.
The government pricing regime for Solar PV power plants has created attractive investment opportunities for IPPs. MEMR has been applying a bidding process for tendering out grid-connected Solar PV capacity to IPPs based on a ceiling price of US$ 0.25 to US$ 0.30 per kWh39 since November 2013, with a proposed capacity allotment of 140 MW spread across 80 locations across the country. However, the process would be more efficient if larger capacities were on bid simultaneously. Additionally, IPPs have faced difficulties with site selection, lack of solar resource availability data, grid interconnection, and limited bid preparation time.
GOI and PLN have tried to use solar home systems to increase electrification in isolated rural areas of Indonesia with limited success. PLN’s “SEHEN” (Super Ekstra Hemat Energi) program for solar home systems, in which users pay a monthly rental fee to PLN, has achieved good coverage, but the lack of sustainable operations, maintenance and fee collection systems, has led to the defaulting of users and confiscation of their solar system equipment by PLN. Other government programs, particularly through MEMR, also have distributed solar home systems in rural areas, sometimes in overlapping villages, but they face similar challenges. Rooftop solar power could also provide distributed generation for urban consumers, in particular to office, commercial, and residential buildings that currently rely on diesel captive power during blackouts.40 However, awareness of the costs and benefits of rooftop solar is low, and there are no incentives.
Figure 8. Indonesian Solar Power PotentialSource: World Wildlife Fund; University of Utrecht 2013
Janua
ry3
3.5
4
4.55
5.5
66.5
7
Febr
uary
Marc
hApr
ilM
ay June
July
Augus
t
Septe
mber
Bandung
Bandung min
Bandung max
Jayapura
Jayapura min
Jayapura max
Daily Solar Irradiation (kWh/m2/day)
Irra
diat
ion
(kW
h/m
2 /da
y)
Octobe
r
Novem
ber
Decem
ber
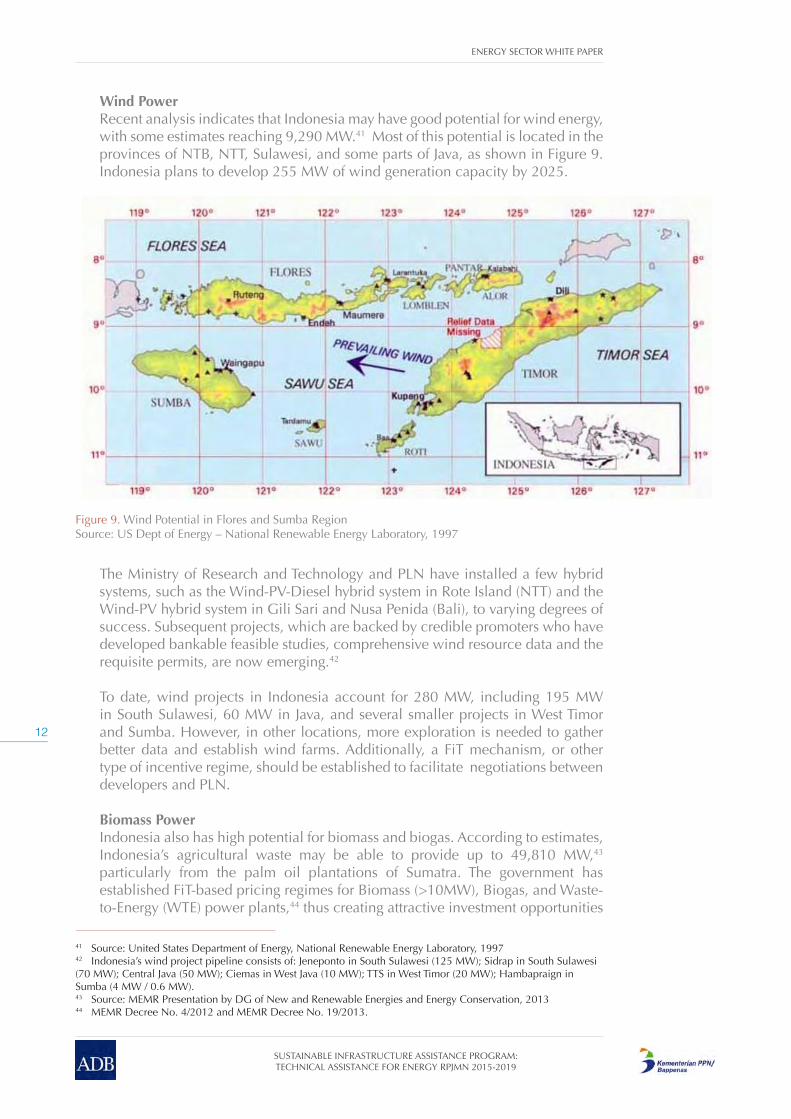
ENERGY SECTOR WHITE PAPER
12
SUSTAINABLE INFRASTRUCTURE ASSISTANCE PROGRAM: TECHNICAL ASSISTANCE FOR ENERGY RPJMN 2015-2019
41 Source: United States Department of Energy, National Renewable Energy Laboratory, 199742 Indonesia’s wind project pipeline consists of: Jeneponto in South Sulawesi (125 MW); Sidrap in South Sulawesi (70 MW); Central Java (50 MW); Ciemas in West Java (10 MW); TTS in West Timor (20 MW); Hambapraign in Sumba (4 MW / 0.6 MW).43 Source: MEMR Presentation by DG of New and Renewable Energies and Energy Conservation, 201344 MEMR Decree No. 4/2012 and MEMR Decree No. 19/2013.
Wind PowerRecent analysis indicates that Indonesia may have good potential for wind energy, with some estimates reaching 9,290 MW.41 Most of this potential is located in the provinces of NTB, NTT, Sulawesi, and some parts of Java, as shown in Figure 9. Indonesia plans to develop 255 MW of wind generation capacity by 2025.
Figure 9. Wind Potential in Flores and Sumba RegionSource: US Dept of Energy – National Renewable Energy Laboratory, 1997
The Ministry of Research and Technology and PLN have installed a few hybrid systems, such as the Wind-PV-Diesel hybrid system in Rote Island (NTT) and the Wind-PV hybrid system in Gili Sari and Nusa Penida (Bali), to varying degrees of success. Subsequent projects, which are backed by credible promoters who have developed bankable feasible studies, comprehensive wind resource data and the requisite permits, are now emerging.42
To date, wind projects in Indonesia account for 280 MW, including 195 MW in South Sulawesi, 60 MW in Java, and several smaller projects in West Timor and Sumba. However, in other locations, more exploration is needed to gather better data and establish wind farms. Additionally, a FiT mechanism, or other type of incentive regime, should be established to facilitate negotiations between developers and PLN.
Biomass PowerIndonesia also has high potential for biomass and biogas. According to estimates, Indonesia’s agricultural waste may be able to provide up to 49,810 MW,43 particularly from the palm oil plantations of Sumatra. The government has established FiT-based pricing regimes for Biomass (>10MW), Biogas, and Waste-to-Energy (WTE) power plants,44 thus creating attractive investment opportunities

ENERGY SECTOR WHITE PAPER
13
SUSTAINABLE INFRASTRUCTURE ASSISTANCE PROGRAM: TECHNICAL ASSISTANCE FOR ENERGY RPJMN 2015-2019
for IPPs. The private sector has built very few successful WTE plants. Although rare, successes like that of PT Growth Asia, which saves IDR 621 billion per year from its 2x15MW agricultural WTE plants, with 20 MW of capacity sold to PLN, should be promoted to other industry players. Provision of incentives, such as soft loans, also could encourage more WTE plant development.
Although FiTs, scaled according to region, are attractive for biomass and biogas plants, availability of feedstock for projects based on these technologies, along with WTE technology, is uncertain. Investments in these technologies could be further encouraged by government policy to secure feedstock supply, either through incentives to feedstock suppliers, or through public private partnerships (PPPs) between city/regional governments and IPPs for secured urban waste supply to WTE plants. WTE plant projects are in development in Batam, Jakarta, Bandung, and Bali. However, there is no incentive to accommodate such large scale WTE projects for big cities. In addition, projects have faced delays in negotiating off-take and tipping fees.
Biofuel Indonesia has some biofuel potential and has stated intentions to reduce oil imports by blending petroleum-based fuel with biofuel. First generation biofuels, which derive power from starch, sugar, animal fats or vegetable oil have been attempted, but are complicated by food provision, supply chain, and pricing issues, which may limit how widespread biofuel use can be in the future. Second generation biofuels (from biomass) and third generation biofuels (from algae) may have higher resource availability, but remain mostly in research and development stages.
Current biofuel mix content is 10% biodiesel for diesel fuel and 0% bioethanol for gasoline (efforts to introduce gasoline blended with bioethanol in 2006 failed). Consumption of biodiesel in 2013 was 1.048 billion liters, while only 0.14 billion liters of bioethanol was used.45 In 2025, MEMR will require that diesel fuel contain 25% biodiesel and gasoline contain 20% bioethanol. Fulfilling this demand will require a decrease in CPO exports and massive land clearing.46 This is because first generation biofuels have low efficiency compared to other land intensive alternatives, such as solar cells, which can produce 50 times more energy with the same acreage.47 Future plans for biofuel should be carefully weighed against Indonesia’s notorious propensity for annual fires and regional smog from land clearing for oil plan plantations.
Nuclear Power Nuclear power may be possible in Indonesia, but this would occur over the very long term. To date, Indonesia has constructed and operated three nuclear power plants for research purposes: in Bandung (since 1965), Yogyakarta (since 1979),
45 USDA Foreign Agricultural Service (2014), “Indonesia Biofuels Annual.”46 As many as 3.7 million ha of oil palm plantations are required to produce 15 billion liters of biodiesel, while 13.2 million tons of CPO are needed to produce 15 billion liters of biodiesel. Currently Indonesia produces enough CPO (30 million ton) to fulfill biodiesel demand to 2025, assuming the current 20 million ton export is reduced by more than 50%. As many as 2 million ha of sugar cane or 2.2 million ha of cassava plantations are required to produce 4.6 billion liters of bioethanol. Indonesia does not produce enough of either for consumption or bioethanol. Based on Tusk analysis of productivity data from FAO, (2008), “The State of Food and Agriculture, Biofuels: Prospects, Risks and Opportunities.”47 This ratio varies based on crops used and local conditions. This ratio is based on comparison between biodiesel produced from palm oil and solar PV under Indonesia condition.

ENERGY SECTOR WHITE PAPER
14
SUSTAINABLE INFRASTRUCTURE ASSISTANCE PROGRAM: TECHNICAL ASSISTANCE FOR ENERGY RPJMN 2015-2019
48 Indonesia Intelligence Agency (2012), “Development of Nuclear Power Plant in Indonesia”, retrieved on July 1, 2014.49 BATAN (2012), “Current Status of Indonesia’s Nuclear Power Programme,” presentation in IAEA Technical meeting in Vienna.50 Source: Study on Energy Buffer Reserve, DEN, 201351 Refineries are configured for type of crude oil used to produce specific petroleum products. Crude oil imports are required when the production of specific oil types is insufficient.
and in Serpong (since 1987). The National Atomic Energy Agency (BATAN) and the Ministry of Research and Technology have been the main drivers for nuclear power development. The Nuclear Energy Regulatory Agency (BAPETEN) currently holds the regulatory function. MEMR and PLN are intended to play a bigger role in the future.
The KEN has identified nuclear power as one of the new and renewable energy resources for development in Indonesia and set a target of 4,000 MW for installed nuclear capacity. BATAN has since identified several locations as potential nuclear power sites. The Bangka Island nuclear power project has proceeded to feasibility study stage. Indonesia also has identified modest uranium potential of 34,863 tons in Kalimantan and thorium potential of 5,487 tons in South Bangka.48 However, any new nuclear power plants would nevertheless use imported fuel due to its cheaper price.
An International Atomic Energy Agency (IAEA) review (2009) found that Indonesia was ready to develop nuclear power.49 Radioactive waste management also has been regulated by Presidential Regulation No. 84/2010. Nevertheless, issues remain with public perception about the safety and necessity of nuclear power plants, especially after the disaster in Fukushima, Japan. BATAN has tried to raise public awareness on Indonesia’s readiness, but opinion against the Bangka Island nuclear power plant, for example, remains strong. In addition, should Indonesia pursue nuclear power, it would need to significantly bolster its domestic human resource capacity, as well as health and safety regulations with regard to nuclear power utilization.
2.1.3 Infrastructure
A. Oil Storage, Refineries, and DistributionThere are 3 types of reserves defined in KEN: (1) operational reserves, (2) energy buffer reserves, and (3) strategic reserves. Operational reserves are undertaken both by Pertamina and the private sector, with 34 enterprises participating. Pertamina’s operational reserves currently amount to only 21 to 23 days for oil fuels, 16 days for LPG, and 14 days for crude oil.50 Apart from Pertamina, only four companies have storage capacity over 100,000 kl, with the majority of storage facilities being quite small. There is little incentive for the private sector to invest in storage and distribution infrastructure due to competition from Pertamina, which monopolizes distribution of subsidized fuel.
Indonesia does not have energy buffer reserves for times of natural disaster and/or conflict. In general, a country should have reserves amounting to at least 90 days of imports, according to recommendations from the IEA. To resolve this, the government plans to establish energy buffer reserves equivalent to 30 days of imports of gasoline, diesel, aviation fuel, LPG, and crude oil. Strategic reserves refer to crude oil reserves in the ground for future exploitation.

ENERGY SECTOR WHITE PAPER
15
SUSTAINABLE INFRASTRUCTURE ASSISTANCE PROGRAM: TECHNICAL ASSISTANCE FOR ENERGY RPJMN 2015-2019
52 Based on latest data from Indonesian Gas Association, reference from SKK and BPH Migas, 2012 data.53 Source: PGN Annual Report 201354 Being developed by INDII with technical input from World Bank under the Gas Development Master Plan study team
No refinery capacity additions have occurred for the past 10 years. In 2013, Indonesia produced 37.7 million kl of oil fuels, which fulfills 52% of domestic demand. The remaining demand was supplied by imports.51 With the dwindling domestic oil production, domestic refineries are increasingly dependent on crude oil imports. Indeed in 2013, over 30% of crude oil refined by Pertamina was imported. Importing crude oil and refining it domestically is more expensive than importing finished petroleum products. Even so, Pertamina is planning to build three new refineries over the next eight years with a combined capacity of 650,000 bbl/d. Furthermore, upgrades to the refineries built in the 1970s may be necessary because they are unable to carry out secondary processing and environmentally-friendly fuel production. However, additional refining capacity will not likely improve energy security, and may not be justifiable, unless Indonesia can increase crude oil production from new resources significantly.
The distribution of oil and its products relies on a series of floating storage units, back loading terminals, fuel depots, and transit terminals. Fuel is sold to the public mainly through filling stations, or in canisters, and sold to retail outlets. LPG is compressed into large canisters of various sizes and distributed through retail outlets. The 3 net kilogram LPG canister is subsidized through the fuel subsidy and can only be produced and distributed to the market by Pertamina. Other oil products, such as aviation fuel, are distributed through specified depots in air bases.
B. Gas Transmission and Distribution SystemAs of 2012, Indonesia’s gas network consisted of 3,633 km of transmission lines and 3,833 km of distribution in Sumatra and Java52. Indonesia’s existing gas pipelines, consisting of 4 separate developments linking Grissik-Duri, Grissik-Singapore, Medan-PekanBaru, Jakarta-Bogor, and South Sumatra-West Java are project specific and not well interconnected. While gas transportation and commercialization is open to licensed private companies and, in principle, all new pipelines are tendered openly, PGN and Pertagas still dominate the market. By the end of 2013 PGN was operating 5,997 km of natural gas pipelines, of which 3,950 km53 are for regional distribution. However, the limited size of the network and the lack of interconnectivity will be an obstacle to further domestic gas consumption. The East to Central Java pipeline, for example, has not been finished, due to uncertainty of gas supply, since it was conceived in the 2005-2009 planning period.
MEMR is currently developing a master plan for gas transmission and distribution.54 Currently, BPH Migas carries out the regulatory role for downstream distribution of gas. MEMR also is updating the national gas pipeline plan, which proposes a pipeline network from Sumatra, Natuna and Java to Kalimantan and Sulawesi (see Figure 10). The plan focuses both on open access gas routes and on dedicated upstream and downstream routes.

ENERGY SECTOR WHITE PAPER
16
SUSTAINABLE INFRASTRUCTURE ASSISTANCE PROGRAM: TECHNICAL ASSISTANCE FOR ENERGY RPJMN 2015-2019
Figure 10. Gas pipelines in IndonesiaSource: Kepmen ESDM No. 2700/2012
C. Electricity Generation, Transmission, and DistributionAs of 2013, Indonesia’s total generating capacity was over 44,000 MW, of which 83% (36,897 MW) was supplied by PLN and the rest by IPPs.55 Indonesia’s demand for power is unevenly spread across the archipelago: the islands of Java and Bali account for approximately 80% of Indonesia’s total power consumption and service the needs of 60% of the total population (140 million people). In addition to the Java-Bali system, other interconnected systems are found in main islands, such as Sumatra, Kalimantan and Sulawesi. The rest of PLN’s generating capacity is spread across 600 isolated systems. PLN’s generating capacity is currently through steam-turbine (40%), combined cycle (24%), diesel (15%), gas-turbine (10%), hydro (10%), and geothermal (1%).56 According to PLN’s national electricity development plan (RUPTL 2013), Indonesia will add 59.5 GW of generation capacity by 2022, with increased contributions from IPPs. PLN’s actual achievement in generation capacity (see Figure 11) slipped by around 9.8 GW between 2009 and 2013 relative to plan (after allowing for the increased contribution of IPPs and PPUs). As a result, Indonesia had only around 44 GW of installed electricity generating capacity in 2013 (34 GW PLN and 10 GW IPP), a significant shortfall from the plans outlined in the RUPTL, stipulating achievement of 53.8 GW capacity by 2013. With effective operational capacity of around 85%, only around 34 GW was in fact available to supply electricity to the grid.57
55 In addition there is around 9 GW of power designated for private industrial uses. Source: RUPTL 2013-2022, PLN56 Source: RUPTL 2013-2022, PLN57 Source: PLN Annual Report, 2012

ENERGY SECTOR WHITE PAPER
17
SUSTAINABLE INFRASTRUCTURE ASSISTANCE PROGRAM: TECHNICAL ASSISTANCE FOR ENERGY RPJMN 2015-2019
Figure 11. PLN gap between Plan and Realization: Generation Capacity (IPP included)Source: RUPTL 2013-2032 (2013 edition)
The constraints on PLN (see Figure 12) also have led to shortfall in installation targets for transmission lines of over 32,000 km.
Figure 12 PLN gap between Plan and Realization: Transmission and DistributionSource: RUPTL 2013-2032 (2013 edition)
Tran
smis
sion
Len
gth
(km
c)
Dis
tibut
ion
Leng
th (k
mc)
Transmission Projection (kms) Transmission Actual (kms)
Distribution Projection (kms) Distribution Actual (kms)
20,000
40,000
60,000
80,000
100,000642,228
639.517
40,114
34,94935,146 38,719 38,096 38,677
70,127
60,93657,511
53,265
681,727 679,242
741,956 741,956675,505
708,945743,989
778,773
120,000
2010 2011 2012 20132009
900,000
750,000
600,000
450,000
300,000
150,000
02009
Installed Capacity - PLN (GW) Installed Capacity - Non PLN (GW)Installed Capacity - Projection (GW) Total Installed Capacity - Actual (GW)
Demand Projection (TWh) Actual Production (TWh)
29.038
134.5
147.2157.9
173.9
216.189
205.8
186.2
153.1138.7
31.95933.983
39.943.528 44.04
37.71242.976
49.93353.88
24.366 26.338 30.529 31.943 34.037
7.593 7.6459.371
11.585 10.004
0
10
20
30
40
50
60
70
80
90
100
2010 2011 2012 2013
50
100
150
200
250
168.4In
stal
led
Cap
acity
(GW
)
Prod
uctio
n C
apac
ity (T
Wh)

ENERGY SECTOR WHITE PAPER
18
SUSTAINABLE INFRASTRUCTURE ASSISTANCE PROGRAM: TECHNICAL ASSISTANCE FOR ENERGY RPJMN 2015-2019
In 2013, PLN operated approximately 38,677 kmc of transmission lines with 93,095 MVA transmission transformercapacity.This consists of 500 kV, 275 kV, 150 kV and 70 kV58 interconnected transmission system. The distribution system consists of approximately 741,956 kmc of distribution lines and 41,987 MVA distribution transformer capacity, serving approximately 54 million customer connections.
According to RUPTL 2013-2022, PLN plans to develop additional 57,132 kmc transmission lines with a transformer capacity of 132,799 MVA up to 2022. Transmission priorities focus on strengthening the existing grid (especially Java-Bali, Sumatra and Sulawesi), interconnecting islands, and establishing power interconnections with neighboring countries. Major transmission projects include: (1) Java-Sumatra 500kV HVDC (financed by JICA), (2) Sumatra transmission backbone 500 kV and 275 kV (financed by PLN), (3) Java-Bali crossing 500 kV transmission from Paiton-New Kapal, including overhead line of 500 kV crossing the Bali Strait (financed by ADB), (4) Cross-border interconnection between West Kalimantan and Sarawak (Malaysia) (financed by ADB), (5) Southern Sulawesi interconnected grid, (6) HVDC subsea cable between Sumatra and Peninsular Malaysia (ADB in discussions for financing), (7) 150kV connection between Batam and Bintan (financed by PLN), and (8) 150 kV connection between Sumatra and Bangka (financed by PLN). PLN has opened the possibility for a private transmission build lease transfer (BLT) scheme under power wheeling arrangements (currently being pursued in North Sumatra 500 kV line).
The development of the distribution system is focused on quality improvement, reducing losses and replacement of aging network. Through 2022, PLN plans to add around 220,000 kmc medium voltage distribution lines, 217,000 kmc low voltage distribution lines, and 35,600 MVA distribution transformer capacities to improve the quality of services, as well as accommodate an additional 28,8 million customers. The electricity distribution projects also include island interconnection using 20 kV or 150kV subsea cables, such as Pulau Muna-Pulau Buton (Bau-Bau), Pulau Laut (Kotabaru)–Batulicin, Bitung– Pulau Lembeh (Sulut), Kepulauan Seribu, and Bali-Nusa Penida.
Figures provided for 2013 by PLN that reflect the distribution network’s System Average Interruption Frequency Index (SAIFI) (7.26) and System Average Interruption Duration Index (SAIDI) (5.76) appear reasonably healthy when viewed on a national basis. However they are low compared to those of developed countries, which are at a range of 1.0 to 2.0.59 Until now, the majority of transmission and distribution projects are experiencing delay. In addition to the limited availability of financing, the development of transmission and distribution systems are particularly constrained by land acquisition difficulties: getting right of way (ROW), confirming land use, changed spatial plan and related licensing and permitting issues. These in turn affect fund disbursement, contractor performance, and create delays leading to cost overrun. The development of the transmission and distribution system is also influenced by power generation development, which faces similar constraints.
58 For small islands only.59 Data as of 2011

ENERGY SECTOR WHITE PAPER
19
SUSTAINABLE INFRASTRUCTURE ASSISTANCE PROGRAM: TECHNICAL ASSISTANCE FOR ENERGY RPJMN 2015-2019
60 Source: Background Study on RPJMN 2015-2019 Infrastructure, Bappenas-JICA, February 201461 Source: Castlerock 2013, “ADB TA 8287-INO: Scaling up Renewable Energy Acces in Eastern Indonesia, Inception Report”.62 Source for both Indonesia and Thailand: Background Study on RPJMN 2015-2019 Infrastructure, Bappenas-JICA, February 2014
2.1.4 Energy Access and Rural ElectrificationIndonesia’s goal in its National Long-Term Development Plan (Rencana Pembangunan Jangka Panjang Nasional, RPJPN) is to increase its national electrification ratio to 100% by 2020. According to MEMR, in 2013, the national electrification ratio (80.51% was low relative to those of the country’s regional peers. Electrification nationwide is also uneven (see Figure 13), with rural ratios totaling just 32% in 2012.60 Indonesia’s archipelagic geography and regionally dispersed populations make energy access both challenging and costly. Grid availability and the quality of electricity supply in many parts of rural and eastern Indonesia are very low, with supply often limited to just 64 Wh per day61. Developed areas of the country, in particular Java and Bali, have much higher electrification ratios, yet even areas with strong grid connection suffer from costly blackouts due to over-extended grid utilization or ageing grid infrastructure. Furthermore, Indonesia’s average electricity consumption at 860 kWh/capita/year in 2012 is far lower than the standard of most middle-income countries (for example Thailand, the closest middle-income country to Indonesia, consumes 1,800 kWh/capita/year).62
Unlike many of its regional peers, including China and Vietnam, Indonesia lacks centralized planning and coordinating to achieve rural electrification, with efforts so far scattered across multiple actors, each with their own programs, budgets, methods and technologies. PLN, MEMR, Ministry of Disadvantaged Regions, Ministry of Cooperatives and Small-Medium Sized Enterprises, local governments, and local community organizations have individually pursued rural electrification programs, sometimes in overlapping areas. These programs – ranging from household solar systems to mini-grids – have employed a variety of standards, but are held back by lack of coordination, poor technical planning, unsuitability of the technology to the load demand and characteristics of the receiving community, and the low user income levels of populations in these remote areas. In the absence of an enabling environment, the private sector has yet to formulate successful business models for the setup or distribution of rural electrification technologies.
Figure 13. Electrification Ratio in Indonesia (as of June 2013)Source: RUPTL 2013-2022, PLN; ASEAN-RESP 2012
ELECTRIFICATION RATIOBENCHMARK
INDONESIA80.51%
PHILIPPINES89.7%
THAILAND99.3%
VIETNAM97.3%
PLN + Non-PLN 77.65% 80.51% 81.51%
ELECTRIFICATION RATIO 2013 Target 2013 Real 2014 Pred.
RIAU ISLANDS69.86%
S.E. SULAWESI62.51%
WEST JAVA80.15%
CENTRAL KAL66.21% WEST SUL.
67.60%
SOUTH SUL.80.15%
WEST PAPUA75.53%
WEST KAL.95.55%
EAST KAL.80.45%
ACEH 89.72%
NORTH SUMATRA87.62%
RIAU 77.56%
JAMBI 75.14%
BENGKULU 77.53%
WEST SUMATRA80.22%
SOUTH SUMATRA70.90%
BABEL 97.13%
LAMPUNG 77.55%
BANTEN 86.27%DIY 80.57%
BALI 78.08%
NORTH SUL.81.82% NORTH MAL.
87.07%
MALUKU78.63%
SOUTH KAL.81.61%
EAST JAVA79.26%
DKI JAKARTA99.99%
CENTRAL JAVA86.13%
NTB64.43%
NTT64.77%
GORONTALO67.81%

ENERGY SECTOR WHITE PAPER
20
SUSTAINABLE INFRASTRUCTURE ASSISTANCE PROGRAM: TECHNICAL ASSISTANCE FOR ENERGY RPJMN 2015-2019
PLN and development partners, such as ADB, World Bank and KfW have implemented several pilot programs to demonstrate the viability and efficiency of innovative, least-cost mini-grid systems powered by renewable energy technologies, such as micro-hydro, solar PV and wind-solar hybrid systems. PLN has made a significant push for energy access through its 1,000 Islands Program, but financing uncertainty, plus disagreements about the types of systems to be installed, have largely stalled implementation. Dutch NGO Hivos and ADB are leading a program on Sumba Island to develop an “Iconic Island” of renewable energy by powering one island with 100% renewable energy. This is intended as a testing ground for piloting approaches and models, which can then be scaled up across eastern Indonesia.
Even in areas with access to the grid, Indonesia has a large number of potential customers who are currently unable to connect to the PLN system due to limited system capacity. In 2011, PLN had 1.2 million potential customers, comprising 389,000 in Western Indonesia and 470,000 in Eastern Indonesia, with the remaining 385,000 in the Java-Bali system.63 PLN estimates that 40% of off-grid villages, largely located outside of Java, are unlikely to be reached by its grid due to their remoteness and geographically scattered population.64 For this reason, PLN has set up hundreds of mini-grids across Indonesia, most of which are powered by costly diesel generators.
The use of biomass fuels is also still hugely prevalent in rural areas of Indonesia. Biomass provided 27.6% of total final energy consumption in 2011, second only to oil.65 An estimated 40% of Indonesian households depend on solid biomass fuels for cooking, causing indoor air pollution which, according to estimates from the World Health Organization (WHO), prematurely kills about 165,000people annually.66
The government has actively promoted the use of cleaner fuels for cooking, particularly through its mostly successful effort led by Pertamina to convert kerosene use into LPG in designated, but wide-reaching areas of Indonesia (motivated also by hopes to decrease spending on kerosene subsidies). This kerosene-to-LPG conversion program, which also was motivated by hopes of decreasing kerosene subsidy expenditures, successfully provided 53.9 million LPG starter packets to poor households and totally withdrew kerosene from 13 provinces between 2009 and mid-2012.67 MEMR and Hivos also implemented Indonesia Domestic Biogas Program (BIRU) from 2009 to 2013 with the aim to construct 8,000 household-scale biogas reactors utilizing animal waste to provide energy for cooking and lighting (with gas lamps). However, the reach of these programs is not universal and biomass for cooking will continue to be prevalent in rural areas, even in the peri-urban and rural areas of relatively developed Java. Efforts to pilot clean cookstove designs have been held back by lack of financing and lack of suitable stove designs to fit users’ needs and customs. However, a program by MEMR, in collaboration with the World Bank and Global Alliance for Clean Cookstoves, is piloting clean cookstove designs and production in Indonesia. The program will start by developing national regulations and standards for traditional cookstoves, and will launch a pilot in Java in 2013.
63 Source: RUPTL 2013-2022, PLN64 Source:RUPTL 2013-2022, PLN65 MEMR Energy Statistical Handbook 2012.66 World Bank.“Indonesia: Towards Universal Access to Clean Cooking.” June 2013.67 PT Pertamina (Persero), Indonesia & the WLPGA, France. “Kerosene to LP Gas Conversion Programme in Indonesia: A Case Study of Domestic Energy.”

ENERGY SECTOR WHITE PAPER
21
SUSTAINABLE INFRASTRUCTURE ASSISTANCE PROGRAM: TECHNICAL ASSISTANCE FOR ENERGY RPJMN 2015-2019
2.2 Policy Review
2.2.1 Plans for the Energy SectorIndonesia’s energy sector is led by several documents steered by the sector’s key national players. With momentum from the overarching KEN sector plan issued in 2006 and updated in 2014, Indonesia began developing a substantial number of helpful policies and regulations (See Table 1). PLN publishes its yearly RUPTL planning document which links to MEMR’s Master Plan for Electricity (Rencana Umum Ketenagalistrikan Nasional, or RUKN). Under these planning documents, each subsector releases its own specific plans, such as the Energy Conservation sector’s National Energy Conservation Plan (Rencana Induk Konservasi Energi Nasional, or RIKEN) or the Master Plan for Energy Diversification (RIDEN). Unfortunately, this results in scattered coordination marked by inconsistent and even conflicting indicators (KPIs) across the sector, as well as conflicts with outside ministries or sectors such as forestry.
Source: Tusk Analysis, 2014.
KEN has emphasized diversification, environment sustainability concerns, and efforts to maximize utilization of domestic energy resources, such as coal (expected to triple from 38 mtoe in 2012 to 120 mtoe in 2025), gas (expected to more than double from 35 mtoe to 80 mtoe), and new and renewable energy (NRE) (expected to increase more than tenfold from 8 mtoe to 92 mtoe). KEN also has established energy conservation targets the decrease of demand elasticity to less than 1.6. The 2014 revision to KEN aims to further increase the share of coal, gas, and NRE sources in the national energy mix by 2050.68 These KEN targets have become the point of reference GOIs energy sector policies over the past few years, and both MEMR and PLN are beginning to adopt similar targets (See Figure 14).
68 Excludes traditional biomass.
Table 1. - Energy Sector Policy Map
Sector Level Policy Statements Law/RegulatiosMasterplan/Blue-
prints
Program
5 Year 1 Year
EnergyNational Energy Policy KEN (2003)
Law No.30/2007 on EnergyNational Energy Blueprint (2006)
MEMR Strategic Plan (RENSTRA)
Annual Program/Project
CoalNational Coal Policy (2004)
Law No.4/2009 on Coal & Mineral Resources
Roadmap Mineral dan Batubara
OilNational Oil & Gas Policy
Law No. 22/2001 on Oil & Gas
Blueprint Oil & Gas (2004)
GasDraft National Gas Masterplan
Renewable Energy
Policy on Ren. Energy & Energy Conserv. (2004)
Included in Law 30/2007Green Energy Roadmap
Geothermal Geothermal PolicyLaw No.27/2003 Revised in 2014
Geothermal Road-map (2006)
Nuclear Policy on Nuclear PowerLaw No.10/1997 on Nu-clear Power
Roadmap Nuclear Power
ElectricityPower Sector Restructur-ing Policy (1998)
Law No. 30/2009 on Electricity
RUKN (National) and RUPTL (PLN)

ENERGY SECTOR WHITE PAPER
22
SUSTAINABLE INFRASTRUCTURE ASSISTANCE PROGRAM: TECHNICAL ASSISTANCE FOR ENERGY RPJMN 2015-2019
Oil50%
Oil25%
Oil20%
165MTOE
380MTOE
Energy Mix 2011
RKEN Target Energy Mix 2025
RKEN Target Energy Mix 2050
980MTOE
Gas 20% Gas 22%Gas 24%
Coal 26%
(Hydro 2.1%,Geothermal 1.2%,
Other 0.9%)
Coal 30%
Coal 25%
NRE4%
NRE23%
NRE31%
Figure 14. Past and planned energy mix of 2011, 2025, to 2050Source: Policy Paper on KEN, Bappenas, 2012.
2.2.2 Subsidies and Price DistortionEnergy subsidies are widely recognized as a burden to Indonesia’s state budget. In 2013, spending on fuel subsidies was budgeted at IDR 200 trillion, while electricity subsidy allocation was IDR 100 trillion69, or over 17% of the total state budget (IDR 1,726 trillion). These have weakened fiscal balance, caused energy-intensive behavior in consumers, and distorted incentives for investment. The cost of funding energy subsidies in Indonesia inevitably crowds out other uses of public revenues, notably infrastructure investment. The government recognizes these burdens and has carefully been undertaking corrective measures.70
Three main energy subsidies are budgeted:• Fuel subsidies, including for gasoline and diesel– covering difference between
container price and estimated “market” price – and kerosene and LPG for household use. Recent programs to encourage substitution of LPG for kerosene have reduced the kerosene subsidy somewhat. Additionally, biodiesel and bioethanol are subsidized at a flat rate of IDR3,000 and IDR3,500, which will be reduced to IDR1,500 and IDR2,000 for a total of IDR6.4 trillion in 2015.
• Electricity subsidies – covering difference between PLN’s actual costs and its expected tariff revenues.
• Fertilizer subsidies, included because subsidy is directly linked by production costs to the price of gas, cover the difference between approved retail price and the cost of fertilizer production by PT Pupuk Indonesia.
• In 2013, GOI raised the price of gasoline and diesel by 44% and 22% respectively. For 2014, GOI capped quota for subsidized fuel, and predictions indicate that the quota will be exhausted before end of the year. Not only is the subsidy nearly double the state infrastructure budget (which was IDR 184.3 trillion in 2013), it also fails to reach the targeted beneficiaries (See Figure 15). Nearly 40% of the fuel subsidies benefit the richest 10% of households, while less than 1% goes to the poorest 10%.71
69 APBN Perubahan 2013.70 Global Subsidy Initiative: “Indonesia Subsidy Review”, p. 4, 201471 Ndiame Diop, World Bank (2014), ‘Reducing Indonesia’s energy subsidies: A prudent, fair and transformative reform’, in Economist Intelligence Unit, Powering Up Indonesia, 17.

ENERGY SECTOR WHITE PAPER
23
SUSTAINABLE INFRASTRUCTURE ASSISTANCE PROGRAM: TECHNICAL ASSISTANCE FOR ENERGY RPJMN 2015-2019
Figure 15. Who benefits from the fuel subsidies?: 2013 Tariff, costs and PSO by tariff categorySource: Indonesia Fuel to power value chain study (World Bank)
The government applies a national tariff structure for electricity that fails to take into consideration the widely varying costs in different parts of the country. The average PLN cost per kWh of power produced is IDR 1,290/kWh, with PLN recovering significantly less than its costs on average across its electricity network. Since costs are much greater in areas outside Java, PLN has little incentive to provide electricity access to these areas. Although PLN receives heavy subsidies to bridge the gap between basic cost of supply and its tariffs under the Public Service Obligations (PSO) scheme intended to assist small residential customers (less than 450VA), small businesses, and small industries, the subsidies are not well targeted.
41% of the electricity PSO has benefitted very small residential customers, while 34% benefitted large and very large industry and 16% benefitted medium-sized industries. The amounts of subsidy per customer vary widely (Figure 16).
Cross-subsidies through deviations between the cost of supply and tariffs for particular customer classes, which distort behavior and investment, also exist within the current electricity system. These have been exacerbated by recent increases in electricity tariffs.
The government has taken significant steps towards lowering subsidies for electricity and establishing a cost-reflective tariff, as well as setting into place cash transfers and smart subsidies to protect the poor from tariff increases. An electricity tariff increase averaging 15% was phased in on a quarterly basis in 2013 (MEMR Regulation No 30/2012). While there were some public protests, these moderate price increases (offset by government direct cash transfers to vulnerable populations) were met with relative acceptance compared to the unrest surrounding subsidy reductions in Indonesia in prior decades.
72 Nominal value. Real value is Rp. 1,128/kWh adjusted to 2008 current prices. Source: PLN, “Tanya Jawab Seputar Pengurangan Subsidi (Kenaikan Tariff Dasar Listrik) 2013”
WHO BENEFITS FROM THE FUEL SUBSIDIES?
GREY: SUBSIDY RECEIVED BLUE: TARIFF PAID BY CATEGORY
Sales: 183 TWh PSO: IDR 101 trillion
200
Social4.8TWh
Residential76.2TWh
Business28.7TWh
Industrial62.6TWh
Public6TWh
Other4.3TWh
Sales(TWh)
Cost per kWh
Average revenueTDL Rp 827/kWh
Average costRp 1,290/kWh
Revenue per kWh
PSO
PLN Revenue
400
600
1000
1200
1500Rp/kWh
Rp1,473/kWh
Rp1,274/kWh
Rp1,1,193/kWh
800
R1 upto 450 VA
R1 900 VA
R1 1300 VA
R1 2200 VA
R1 2200 VA to 6,600 VA
B2 > 2200 VA to 200 kVA
B3 > 200 kVA I4 > 30,000 kVA
I2 14 - 200 KVA
I3 > 200 KVA

ENERGY SECTOR WHITE PAPER
24
SUSTAINABLE INFRASTRUCTURE ASSISTANCE PROGRAM: TECHNICAL ASSISTANCE FOR ENERGY RPJMN 2015-2019
Figure 16. PSO benefit to each type of customer per month (IDR)Source: I.ndonesia Fuel to power value chain study (World Bank)
In mid-2014, the government announced further tariff hikes of 8% to 16%, depending on the sector, which will be phased in over the course of the year.
2.2.3 Energy EfficiencyEnergy conservation will become increasingly important with the depletion of as Indonesia’s indigenous fossil fuel resources, because, even if renewable energy capacity can be rapidly expanded, Indonesia will still need significant fossil-based energy by 2050.
Indonesia’s energy elasticity, which is 1.6, reflects inefficient overall use of energy. In comparison, Thailand and Singapore have energy elasticity 1.4 and 1.1 respectively,73 while the energy elasticity of developed countries, such as the U.S. and Japan, ranges from 0.8 to 0.95.74 Indonesia’s per capita energy consumption was just 0.85 Ton Oil Equivalent (TOE), below the world average consumption of 1.7 TOE, as well as that of some ASEAN countries (3.7 TOE for Singapore, Malaysia with 2.5 TOE, and Thailand with 1.5 TOE).75 As per capita incomes grow, Indonesia’s per capita use will tend towards that of other countries, implying continued demand growth in excess of GDP growth. To mitigate this, Indonesia targets reducing energy intensity by 1% annually to bring energy elasticity to less than 1 by 2025.
The transportation sector was the biggest energy consumer as of 2012, followed by the industrial sector, households, and the commercial sectors (See Figure 17). The government has set energy conservation targets for each sector to be achieved by 2020.
73 Sustainable Energy and Environment Forum, “Indonesia Country Report.”74 Thailand Ministry of Energy, “Energy Strategy: Energy for Thailand’s Competitiveness.”75 Various Source
Very Small
50087
137
220
216
439
1,968
22246
1,000
1,500
2,000
2,500
3,000
Rp ‘000
0Small
Residential (2013)
LargeMedium-Large
Monthly bill per customer Monthly PSO per customer
Large businesscustomers
100 208 240
146
44
200
300
400
Rp m
0Large Industrial
Customers
Large Customers (2013)
Monthly bill per customer Monthly PSO per customer
Street Lighting
5
0.9 0.10.3
5.0
3.3
11.6
2.11.6
10
15
20 Rp m
0Government
Office
Medium-sized(2013)
Medium-sized
Industry
Medium-sized
busines
Monthly bill per customer Monthly PSO per customer
Very large industry
5,000 13,434
10,155
10,000
15,000
20,000
25,000Rp m
0
Very Large Customers (2013)
Monthly bill per customer Monthly PSO per customer

ENERGY SECTOR WHITE PAPER
25
SUSTAINABLE INFRASTRUCTURE ASSISTANCE PROGRAM: TECHNICAL ASSISTANCE FOR ENERGY RPJMN 2015-2019
Household
Energy Consumption by Sector Energy Conservation Targets by Sector
Commercial
Others
Transportations
Industry
40%
39.7%
12.0%
4.4%
3.5%
TOTAL CONSERVATION TARGET 17% TO BAU
15% to BAU
15% to BAU
17% to BAU
20% to BAU
17% to BAU
Figure 17. Energy Consumption (2012) and Conservation by Sector (Achievement and Targets)Source: Background Study on Energy RPJMN, Bappenas, 2014
Government Regulation No. 70/2009 requires improved energy efficiency from industries using greater than 6,000 TOE annually through mandatory perform energy audits by certified auditors at least once every 3 years and the creation of energy management teams to implement energy conservation programs. From 2003 to 2013, free energy audits funded by the state budget (APBN) were provided for 974 industries and buildings.76 However companies have been reluctant to implement recommendations that require medium to large investments due to difficulty in obtaining financing for energy efficiency projects, for which commercial banks have not expressed interest. Eximbank has partnered with ADB to provide loans for export-oriented industries to undertake energy efficiency projects, but implementation remains slow due to limited awareness and capacities, resulting in long lead time between loan signing and first disbursement. The CTF allocates for energy efficiency, but deployment of funds has not been possible because of difficulties in developing project pipelines. GOI also has regulated incentives, such as soft loans and tax breaks for energy saving products, but these are only allowed for companies that have successfully implemented energy efficiency measures for 3 years.77 In the same vein, the government regulates disincentives in the form of fines and reduction of energy supply for companies that do not implement energy efficiency measures. However, the disincentive mechanism is convoluted, requiring the approval of local officials and MEMR on a one-by-one basis.
GOI initially proposed setting up a revolving fund for energy efficiency, but this has not been launched. In 2011, Indonesia began developing energy efficiency labels for Compact Fluorescent Lamps (CFL), refrigerators, air conditioners, electronic ballast, electric fans, rice cookers, and motorcycles. The CFL labeling regulation was finished on time in 2011, but labeling protocols have yet to be issued for refrigerators and air conditioners (due in 2012), as well as for electric
76 MEMR EBTKE Presentation, 2014.77 “Success” is universally defined as 2% decrease in energy consumption for 3 consecutive years (MEMR Decree no. 14/2012).
ENERGY SECTOR WHITE PAPER
26
SUSTAINABLE INFRASTRUCTURE ASSISTANCE PROGRAM: TECHNICAL ASSISTANCE FOR ENERGY RPJMN 2015-2019
ballast, fans, and TVs (due in 2013). Further, manufacturers are reluctant to implement the labeling regulations due to difficulties in finding accredited testing laboratories. In addition, the Indonesia National Standard (SNI) sets technical requirements for the energy efficiency and safety of several appliances. Donors have also been active in promoting energy efficiency, particularly through street lighting initiatives driven by GIZ, ADB, and USAID’s ICED program. Vehicle energy efficiency testing is currently limited to requirements for Low Cost Green Car (LCGC) incentives.
Although the potential for energy efficiency benefits is high in Indonesia, there is little awareness of its importance. Very few buildings are energy efficient.78 Existing building codes do not include electricity or energy saving components. Tenants also do not exhibit energy saving behavior, such as turning off air conditioners and lights when not in use. However, increasing energy prices are slowly driving change. The Jakarta government also has established green building codes (Governor Regulation No. 38/2012) for new and existing buildings. Unfortunately, enforcement for existing buildings has been difficult. On the other hand, the Green Building Council Indonesia (GBCI), established in 2008 through cooperation among various corporations, professional associations, media, and a government research institute (LIPI), has made some headway. This council is currently developing voluntary “greenship” certification for building materials, buildings, neighborhoods, and cities. It is also engaged in promotion of energy efficiency, as well as training green building professionals, especially because local architects have little knowhow about designing energy efficient buildings. 2.2.4 Environmental SustainabilityIndonesia is vulnerable to the negative effects of climate change, including increasing temperature and precipitation, as well as rising sea levels. The Indonesian Department of Marine and Fisheries has reported that 24 small islands have submerged in the last eight years due to rising sea levels, while a sea temperature increase by 0.5 degrees Celsius reduced fishery yield by 15-30% between 1997 and 2010,79 and a further rise of 2.1 to 4.6 degrees Celsius up to 2100 is expected to reduce fishery yield further by 40-60%.80 Also, throughout Southeast Asia, overall climate change is estimated to have decreased agricultural productivity through acute drought or overwhelming rainfall, which means reduction in food supply. In addition, the energy sector is vulnerable to these shifting climate conditions. Increases in water temperature will reduce the efficiency of water for cooling purposes, rendering steam power plants less productive. Increases in air temperature will reduce generation efficiency from solar panels, stress the capacity of grid networks by increasing demand for air conditioning, and increase line losses in transmission and distribution. Rising sea levels could damage coastal infrastructure.
Within this context, Indonesia is among the top 10 largest producers of greenhouse gases in the world.81 The majority of PLN’s power generation relies on coal and
78 According to GBCI, there are only 8 certified green buildings at present. Source: http://www.gbcindonesia.org, retrieved on 26 August 2014.79 Department of Marine and Fisheries, 2012; study supported by United Nations Food and Agricultural Organization80 Analysis by United Nations Food and Agricultural Organization, 201281 As stated in the RAN-GRK and United Nations Framework Convention of Climate Change (UNFCCC), 2013
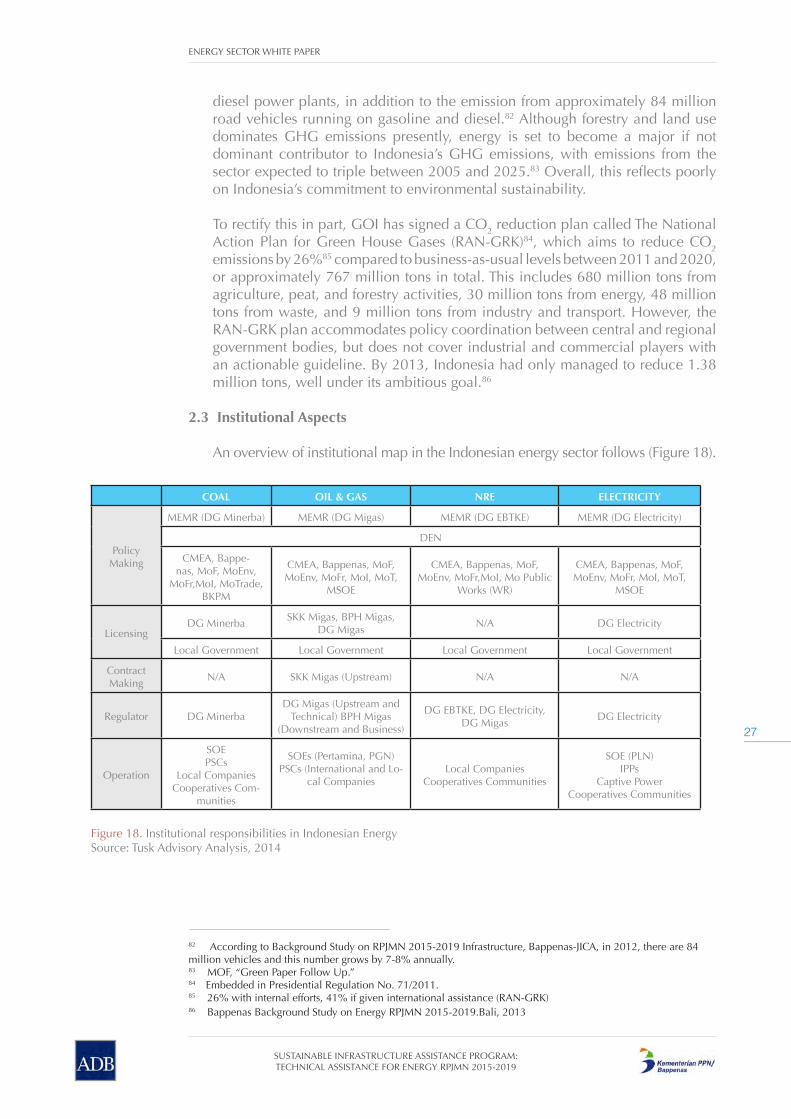
ENERGY SECTOR WHITE PAPER
27
SUSTAINABLE INFRASTRUCTURE ASSISTANCE PROGRAM: TECHNICAL ASSISTANCE FOR ENERGY RPJMN 2015-2019
82 According to Background Study on RPJMN 2015-2019 Infrastructure, Bappenas-JICA, in 2012, there are 84 million vehicles and this number grows by 7-8% annually.83 MOF, “Green Paper Follow Up.”84 Embedded in Presidential Regulation No. 71/2011.85 26% with internal efforts, 41% if given international assistance (RAN-GRK)86 Bappenas Background Study on Energy RPJMN 2015-2019.Bali, 2013
diesel power plants, in addition to the emission from approximately 84 million road vehicles running on gasoline and diesel.82 Although forestry and land use dominates GHG emissions presently, energy is set to become a major if not dominant contributor to Indonesia’s GHG emissions, with emissions from the sector expected to triple between 2005 and 2025.83 Overall, this reflects poorly on Indonesia’s commitment to environmental sustainability.
To rectify this in part, GOI has signed a CO2 reduction plan called The National Action Plan for Green House Gases (RAN-GRK)84, which aims to reduce CO2 emissions by 26%85 compared to business-as-usual levels between 2011 and 2020, or approximately 767 million tons in total. This includes 680 million tons from agriculture, peat, and forestry activities, 30 million tons from energy, 48 million tons from waste, and 9 million tons from industry and transport. However, the RAN-GRK plan accommodates policy coordination between central and regional government bodies, but does not cover industrial and commercial players with an actionable guideline. By 2013, Indonesia had only managed to reduce 1.38 million tons, well under its ambitious goal.86
2.3 Institutional Aspects
An overview of institutional map in the Indonesian energy sector follows (Figure 18).
Figure 18. Institutional responsibilities in Indonesian EnergySource: Tusk Advisory Analysis, 2014
COAL OIL & GAS NRE ELECTRICITY
Policy Making
MEMR (DG Minerba) MEMR (DG Migas) MEMR (DG EBTKE) MEMR (DG Electricity)
DEN
CMEA, Bappe-nas, MoF, MoEnv,
MoFr,MoI, MoTrade, BKPM
CMEA, Bappenas, MoF, MoEnv, MoFr, MoI, MoT,
MSOE
CMEA, Bappenas, MoF, MoEnv, MoFr,MoI, Mo Public
Works (WR)
CMEA, Bappenas, MoF, MoEnv, MoFr, MoI, MoT,
MSOE
LicensingDG Minerba
SKK Migas, BPH Migas, DG Migas
N/A DG Electricity
Local Government Local Government Local Government Local Government
Contract Making
N/A SKK Migas (Upstream) N/A N/A
Regulator DG MinerbaDG Migas (Upstream and
Technical) BPH Migas (Downstream and Business)
DG EBTKE, DG Electricity, DG Migas
DG Electricity
Operation
SOE PSCs
Local CompaniesCooperatives Com-
munities
SOEs (Pertamina, PGN)PSCs (International and Lo-
cal CompaniesLocal Companies
Cooperatives Communities
SOE (PLN)IPPs
Captive PowerCooperatives Communities

ENERGY SECTOR WHITE PAPER
28
SUSTAINABLE INFRASTRUCTURE ASSISTANCE PROGRAM: TECHNICAL ASSISTANCE FOR ENERGY RPJMN 2015-2019
2.3.1 Institutional Mapping
Oil and Gas Under Indonesia’s Constitution, all territorial natural resources are owned and controlled by the state (gas and oil under primary jurisdiction of central government, with some financial benefits allowed to local governments).
Law No. 22/2001 regulates restructured and liberalized state control over the oil and gas industry to encourage competition, open downstream sector to private investment, and end Pertamina’s monopoly. However, in 2006, the Constitutional Court ruled in that GOI should retain full control over pricing.
Pertamina’s upstream and downstream supervisory roles were transferred to two separate government agencies, BP Migas87 and BPH Migas, which were responsible directly to the president of Indonesia. In 2012, the Constitutional Court ruled for the dissolving of BP Migas and its replacement by SKK Migas, which handles upstream contracting and supervision, as well as selling GOI’s share of oil and gas production. BPH Migas supervises all downstream activities.
In 2003, Pertamina was converted into a state-owned limited liability company engaging in upstream and downstream oil and gas activities, and exploiting geothermal energy through its own operations, as well as in partnerships with other business entities.
Law No. 22/2001 has opened the way for private participation. In the upstream oil and gas sector, more than 230 private business entities, of which 170 are engaged in exploration activities, are active in Indonesia. The largest include Chevron, Conoco Phillips, Exxon Mobil, Total and the Chinese National Offshore Oil Corporation (CNOOC). In the downstream sector, two private companies were awarded downstream distribution rights for 0.01% of subsidized fuel in 2010.
Law No. 22/2001 liberalized the natural gas supply and trade so sellers and buyers can directly negotiate gas sales contracts, but SKK Migas and MEMR retain the right to approve them. Pertamina remains an important participant in Indonesia’s natural gas industry, although it is no longer dominant.
Gas pipelines are considered a natural monopoly, so GOI requires open access. BPH Migas is responsible for pipeline and storage service tariffs, but the regulatory system for natural gas distribution is not well developed. PT. Perusahaan Gas Negara (PGN), Indonesia’s state gas pipeline company currently shares this regulatory role with Pertamina.
CoalLaw No. 4/2009 on Mineral and Coal Mining and its implementing regulations set guidelines for licensing based on transparent tendering procedures, with involvement of local, provincial governments, and central government in awarding licenses. The central and regional governments play a vital role by formulating national mining policies, standards, guidelines and criteria, as well as deciding on mining authorization procedures, including post-licensing award activities (development, control, evaluation and conflict resolution).
87 BP MIGAS is dissolved in 2013 and now becoming SKK Migas under the ruling of the Constitutional Court

ENERGY SECTOR WHITE PAPER
29
SUSTAINABLE INFRASTRUCTURE ASSISTANCE PROGRAM: TECHNICAL ASSISTANCE FOR ENERGY RPJMN 2015-2019
Law No. 4/2009 allows central government more control over determining areas open for mining, and this reduces the overlapping of mining concessions with areas reserved for other purposes, such as forestry. In addition, the implementing regulations set up a Domestic Market Obligation (DMO) for producers, as Indonesia seeks to ensure sufficient supply of natural resources to meet expected growth in domestic demand.
The authority to issue a Production Operations IUP (mining license) has been decentralized, depending upon the location of the mine infrastructure, such as processing plants, hauling roads, stockpiles and port facilities, as well as the environmental impact of the project.
Indonesia’s coal mining sector is operated by a wide-range of domestic (state-owned or private) and international companies. Dominant Indonesian mining sector companies include PT Bumi Resources Tbk, which owns Kaltim Prima Coal (Indonesia’s largest mine) and and Arutmin (fourth-largest); PT Bukit Asam, which produces coal for export and power generation; and Adaro Energy, a large coal producer with investment in electricity generation.
New and Renewable Energy BAPPENAS has stipulated the promotion of renewable energy as a key issue in the provision of infrastructure, while the Ministry of Finance, which approves expenditure and incentives for this development, contributes to this policy. In 2010, the Directorate General (DG) of New Energy, Renewable and Energy Conservation (EBTKE) was created to strengthen regulatory supervision of MEMR over renewable energy. This directorate general focuses on converting renewable energy into electricity, whereas the DG of Electricity sets FiT and the ceiling price for electricity from renewable sources.
Local and regional governments have become important stakeholders in the implementation of new and renewable energy policy as they develop relevant regulations and issue permits. Furthermore, as part of their promotional strategies to attract investments, they can provide schemes that influence the implementation of the policies of the energy sector.
ElectricityIndonesia’s electricity sector is regulated by Law No. 30/2009, which introduced a number of key reforms, including removing PLN’s monopoly over supply and distribution of electricity, allowing private provision of electricity for public use if PLN is unable to provide the service, and giving local governments greater authority over licensing and tariff setting.
The national government or regional governments must approve the end user tariff, which is then ratified by the central and local parliaments. The law recognizes the need for non-uniform tariffs across regions, although current practice is uniform throughout the country. Indonesia’s retail electricity tariff is less than the cost of production, requiring PLN to rely heavily on the PSO subsidy.
MEMR’s DG of Electricity is the main electricity policymaking body. It is responsible for developing the electricity master plan, preparing laws and regulations, establishing tariff and subsidy policies, and issuing business licenses. PLN,

ENERGY SECTOR WHITE PAPER
30
SUSTAINABLE INFRASTRUCTURE ASSISTANCE PROGRAM: TECHNICAL ASSISTANCE FOR ENERGY RPJMN 2015-2019
formerly a monopoly, is a vertically integrated utility that operates around 85% of the country’s generating capacity and almost all transmission and distribution activities88, which makes it the dominant player in the electricity sector.
Private participation in the electricity sector began in the early 1990s, with players being captive power producers (for own consumption) that sell excess power to PLN, or Independent Power Producers (IPP) that sell all of their electricity to PLN. Until recently, PLN was the contracting agency for procurement of all electricity for public use in Indonesia. PLN has developed and improved Power Purchase Agreements (PPA) to expedite negotiations with potential IPPs and enhance the bankability of generation projects. IPP activity has been increasing recently, with the Cirebon and Paiton 3 projects reaching financial closure under the JBIC Overseas Investment Loan program. Other projects include the super-critical or ultra-super-critical coal-fired Central Java IPPs, and mine-mouth IPPs in South Sumatra, which are under development.
2.3.2 Indonesian Energy SOEs
A. PLN, Indonesia’s National Electricity CompanyThe state-owned PT Perusahaan Listrik Negara (PLN) once held the mandate as Indonesia’s sole provider of electricity, with monopoly over generation, transmission, and distribution. It still has first right to supply electricity to the public, but struggles to cope with growing demand.
According to RUPTL 2013, energy demand in Indonesia will increase 10.1% per year over the next decade, meaning the need for an estimated USD 125 billion in investment up to 2022. This is expected to come mainly from the private sector (IPP) at 59%, while PLN will have to fund the remaining 41%. This estimate is based on the target electrification ratio of 97.7% by 2022, while GOI wants to reach a 100% ratio by the end of 2019. However, investment requirements could be larger than RUPTL’s estimates and more challenging for PLN.
The 2013 unaudited figures show that PLN’s revenue was IDR 258 trillion, with a loss of IDR 30 billion, mainly attributed to foreign exchange fluctuation (PLN’s operating costs and loans are mostly in foreign currency). To cover the loss, GOI subsidizes the difference between cost of production and revenue, which means that the largest portion of PLN’s income is in subsidies. PLN, which has total assets of IDR 604 trillion, has total debt of IDR 466 trillion, of which IDR 220 trillion is long term debt. Currently, PLN’s own financing capacity is estimated at around USD $5 billion per year (between IDR 50 to 60 trillion). To finance further system expansion, PLN needs to rely on additional loans. PLN has issued USD-denominated bonds, while at least one export credit agency (ECA) and European Bilateral Agency have provided loans without a sovereign guarantee. However, PLN’s debt capacity has almost reached covenant level, meaning that PLN might not be able to meet its system development plans due to financial constraints.
According to RUPTL 2013, PLN’s total investment requirement for 2015 – 2019 is estimated to be USD $76,772 million. PLN’s own financing capacity is estimated at USD $39,864 million and private sector investment through IPP is expected at
88 As of 2012. Source: PLN Annual Report 2012

ENERGY SECTOR WHITE PAPER
31
SUSTAINABLE INFRASTRUCTURE ASSISTANCE PROGRAM: TECHNICAL ASSISTANCE FOR ENERGY RPJMN 2015-2019
Funding Requirements 2015 2016 2017 2018 2019 Total
Total Investment Requirement 12,809 16,435 18,095 16,757 12,676 76,772
IPP Funding Requirement4,592 7,540 9,110 8,951 6,717 36,910
PLN Funding Requirement8,218 8,895 8,985 7,806 5,960 39,864
Funding Gap for PLN 3,218 3,895 3,985 2,806 960 14,864
USD $36,910 million. Assuming that PLN fundraising capacity of USD $5 billion per year, the funding gap during 2015 – 2019 is USD $14,864 million as shown in table below. With limited debt capacity and difficulties to find other financing means other than increasing tariff, PLN might not be able to meet its system development plans due to financial constraints.
Table 2 PLN Funding Requirement for 2015-2019
Source: RUPTL 2013-2022, PLN. Units in million US$
Even so, increased electricity tariffs have eased PLN’s financial position somewhat, as well as lightening the national subsidy burden.
B. PT Pertamina National Oil CompanyPertamina has been involved in the oil and gas sector since the 1960s and was the primary implementing agency issuing rights and contracts for PSCs until 2001-2002. In 2013 Pertamina contributed 23% of overall oil production, and 17% of gas extraction. In 2013 it generated revenue of US$ 70.9 billion.
There are significant cross-subsidies across Pertamina’s business units. For example, sales of subsidized fuel generated a loss of US$ 90.47 million in 2012, despite receiving a subsidy in the form of PSO. This was due to higher than expected demand, as the government had only set a subsidy for approximately 38 million kl of gasoline compared to the 45 million kl demanded by the market.
Pertamina’s scope for oil distribution is the largest across Indonesia with 5,027 petrol filling stations, 107 depots, 532 LPG filling plants, and more than 58 aviation fuel depots across the country. Pertamina’s subsidiary, Pertagas, also has 1,589 km of gas pipelines installed, becoming a contender to PGN. In 2012 the company produced 71.66 million barrels of oil,89 approximately a quarter of the country’s 279.41 million production in that year.

ENERGY SECTOR WHITE PAPER
32
SUSTAINABLE INFRASTRUCTURE ASSISTANCE PROGRAM: TECHNICAL ASSISTANCE FOR ENERGY RPJMN 2015-2019
Figure 19. Pertamina’s Business OverviewSource: Pertamina Corporate Presentation, Bondholder’s Day, Q3 of 2013
Pertamina is expanding its upstream exploration activity, particularly overseas, although GOI expects a greater focus on domestic upstream activities, especially expired PSCs. Up until now, Pertamina’s major upstream operations in Indonesia have focused on exploitation of the Cepu block in association with Exxon Mobil.Pertamina also has entered the geothermal business through its subsidiary Pertamina Geothermal Energy, which manages production of 16.64 million tons of steam and 2,292 GWh of electricity. Pertamina is also one of the first PSCs to conduct exploration of Coal Bed Methane deposits, and holds licensing for shale gas exploration.
C. PT PGN Tbk. (State Gas Company)PT PGN, a publicly listed company majority owned by GOI, which gets no subsidies, operates more than 5,997 km of gas pipelines across Sumatra, Java, and Kalimantan. PGN opens access to gas and leads development of gas distribution to households and industries. However it does not have its own exploration and production infrastructure to supply its own gas, making it vulnerable in the gas supply market. To address this, PGN has formed Saka Energy, which now has participating rights in four PSCs. Aside from industrial, commercial, and household customers. PGN also sells gas to power plants as off-takers for electricity.
PGN also is involved in LNG trade and transportation, CNG supply and development (including filling stations), and is currently exploring non-conventional gas development (specifically CBM) for sale directly to the market.PGN has not developed sufficient pipelines because it cannot secure adequate gas supply due to long-term contracts made by upstream gas companies, such
89 Oil production 73.55 million barrels in 2013, while crude oil production figures have yet to be released by The Statistical Bureau (BPS).

ENERGY SECTOR WHITE PAPER
33
SUSTAINABLE INFRASTRUCTURE ASSISTANCE PROGRAM: TECHNICAL ASSISTANCE FOR ENERGY RPJMN 2015-2019
as Pertamina, Total, ConocoPhillips, and VICO, which allocate much of their production for export, leaving little for domestic use. PNG is planning to develop re-gasification and LNG facilities, but it is also not clear if it can acquire the necessary supply for these. PGN has built a re-gasification facility in the Jakarta bay area, with a capacity of 3 mtpa of gas to supply the Muara Karang receiving point, which Pertamina is now operating. However, PGN does not risk undertaking its own exploration efforts to supply its own gas pipelines, partly because this is not directly specified in its mandate.
In addition, competition by Pertagas in the gas pipeline market is slowly threatening PGN’s role and mandate as gas infrastructure developer in the domestic market. Pertagas plans to build a floating LNG receiving terminal in Central Java, with a capacity of 1.5 mtpa. As a result, going forward PGN’s role in the national energy context is not clear.
2.3.3 Role of the Private SectorAccording to MEMR data, foreign oil and gas companies currently own about 85.4% of the 137 national oil and gas working areas. National companies only control about 14.6% of working areas, with 8% of them held by Pertamina. The five largest foreign contractors in Indonesia are ExxonMobil, Chevron, Total, ConocoPhillips, and BP, who between them control 70% of the oil reserves and 80% of natural gas reserves, and have a production capacity of 68% for oil and 82% for natural gas.90
However, despite the fact that most investment is expected from the private sector, its participation in upstream oil and gas is now at a crossroads due to a lack of a favorable policy and regulatory environment. Ever changing policy and new regulations on PSCs have adversely impacted the attractiveness of investment in Indonesia’s upstream industry. Furthermore, PSC’s terms are negotiated on a case-by-case basis, which takes lengthy discussion without certainty of the outcome. This has reduced the appetite of the private sector for undertaking activities such as EOR and exploration of new fields, leaving the reserves untapped.
The downstream oil and gas sector has been liberalized, although in practice Pertamina still dominates the oil distribution business. Private investment in downstream oil is slow due to the relatively monopolistic structure and difficulties created by subsidy policy. In the gas transportation and pipeline industry, several players have emerged and now play a key role supplying gas to industrial areas in East Java, West Java, and Batam. The presence of Trans Java pipeline will give another push for private players to construct feeder pipelines. Similar infrastructure is also needed for industrial development in Sumatra, Kalimantan, and Sulawesi in the short to medium term. certainty of gas supply has blocked further development of downstream gas sector. While the domestic gas price is considered low, prices are artificially high due to rent seeking activities by gas brokers, due to the reluctance of existing players to build additional infrastructure. Furthermore, sharing alocation of DMO volume across gas users with different pricing has disincentivized the development of domestic gas market. Most players are taking positions as brokers rather than doing actual gas trading.
In the power sector, the private sector has been actively involved through IPP
90 Data as of March 2013: SKK Migas Presentation, 2013.

ENERGY SECTOR WHITE PAPER
34
SUSTAINABLE INFRASTRUCTURE ASSISTANCE PROGRAM: TECHNICAL ASSISTANCE FOR ENERGY RPJMN 2015-2019
mechanism since mid 1990s. Currently IPPs and private generators (captive power) are estimated to produce 22% of Indonesia’s electricity. The Electricity Law No. 30/2009 allows IPPs to generate and supply electricity to end-users in the Indonesian market, which is expected to bring improvements to the development of industrial and commercial areas. The 2013 RUPTL opens the opportunity for private transmission through BLT scheme as well as power wheeling. Another potential for private participation is decentralization to unlock opportunities for sub-national governments to enhance electricity supply in their respective regions.
So far, private investments in the electricity sector are below expectation. Development of IPPs is constrained by uncertainties of fuel supply, such as coal and gas, as well as unclear tariff regimes for geothermal, hydropower, and renewable energy plants. Small domestic IPPs are known to find difficulties in raising financing but the government, in its recent negative list ruling, has restricted FDI in small hydropower developers to 49%. Another issue relevant to IPPs is the availability of transmission lines connecting to the grid. Common hurdles, such as land acquisition and permitting procedures are also notable. Land acquisition was a particular problem for Indonesia’s flagship the PPP ultra-supercritical 2x1,000 MW coal power plant in Central Java, which has been stalled since the PPA was signed in 2004. This has caused a wait-and-see stance on the part of private sector investors.
Recent issuance of government regulations on mine-mouth power plants, geothermal avoided cost based ceiling prices, and the government’s push for hydro powerplant and solar power project development by IPPs have certainly peaked interest from the private sector. Nevertheless, the tendering system needs to be improved to ensure more stringent pre-selection of both domestic and foreign IPPs, thus ensuring that the winning bidder has the capacity to achieve financial closure and execute the project.
2.4 Energy Sector Performance
2.4.1 Recent PerformanceA review of the existing RPJMN for 2010-2014 indicates that the energy sector performed reasonably well against the targets and milestones laid out in that document. However, given the current troubling state of the sector and contemporary projections from international institutions, PLN, and the government of Indonesia itself, this may indicate that those milestones were not originally suited for the expansive growth the sector is facing now. This may be particularly relevant to generation, which is not growing at a rate capable of keeping up with burgeoning energy demand, while on the other hand oil and geothermal targets might have been optimistic given the conditions of those respective sectors. Currently, there are many power plants under development by PLN which have commercial operation dates. However, these plants are not yet operational, and have not been connected to the grid. As a result, PLN lends out diesel generators to fill the power demand gap.
The key targets and milestone achievements set for the national energy sector in RPJMN 2010-2014included: • Oil production of over 1 million BPD by 2014 (as per Presidential Instruction)• Increase in generation capacity by 3 GW per year, an additional total of about
15,000 MW by 2014

ENERGY SECTOR WHITE PAPER
35
SUSTAINABLE INFRASTRUCTURE ASSISTANCE PROGRAM: TECHNICAL ASSISTANCE FOR ENERGY RPJMN 2015-2019
• National electrification ratio of 80% by 2014• Utilization of 5,000 MW of generating capacity from Geothermal Energy• Development of the gas pipe network in 19 cities and connection to 80,000
households• Development of 21 new SPBG (Gas Fuel Filling Stations)
Based on Bappenas’ Medium Term Evaluation book (see Figure 20), summarizes performance relative to target. There have been shortfalls in all categories except electrification, in which captive generation enabled Indonesia to achieve electrification target.91
Figure 20. National Energy Achievement compared to RPJMN TargetsSource: Background Study for Energy RPJMN 2015-2019, Bappenas, 2014
2.4.2 Likely Future Outcome under Business-as-UsualA Business-as-Usual (BAU) scenario has been developed to explore what could happen to the energy sector in the absence of significant policy reform. The BAU demand scenario is taken from BAPPENAS LEAP analysis with assumptions including: (1) GDP growth as per base scenario of MTR/RPJMN; (2) industry sector growth based on BAPPENAS’ medium growth estimates and assuming growth in downstream industry; (3) private vehicles growth based on growth of GDP/capita; (4) public transportation growth based on GDP growth; (5) BAPPENAS-BPS population growth estimates and poverty reduction assumptions; and (6) failure to implement oil to gas conversion.
The BAU supply scenario has been developed based on current supply level and takes into account policies that are currently being implemented, but assumes that the speed of implementation will be similar to that which has occurred in the past. The assumptions underpinning the BAU supply scenario include: (1) oil production estimate based on existing, expiring, and potential PSCs as well as BAPPENAS estimate; (2) gas production estimate from Gas Development Master Plan; (3) coal production estimate from MEMR; (4) hydropower development based on PLN’s RUPTL; (5) geothermal development based on MEMR data of upcoming
91 GOI’s definition of “electrification” does not encompass reliable access to electricity, resulting in PLN regional offices using different “electrification” definitions, which means unreliable data. For example; overstatement of electrifications ratios in Eastern Indonesia, while understatement occurs in Bali.
2014 Target
Oil Production (bbl/d) 1,010 826
Natural Gas Production (mmscf/d) 1,633 1,442
Increase in Generating Capacity (MW) actual 15,000 9,321
Increase in Generating Capacity (MW) in development 15,000 14,559
Electrification Ratio (%) 80 80,51
Geothermal Capacity (MW) 1,343.5 5,000
Development of City Gas Infrastructure 19 17
Development of City Gas Connection 80,000 72,536
Development of Gas Filling Stations 21 16
0.00%
81.78%
88.30%
63.14%
97.06%
100.64%
26.87%
89.47%
90.67%
76.19%
20.00% 40.00% 60.00% 80.00% 100.00% 120.00%2013Achievement
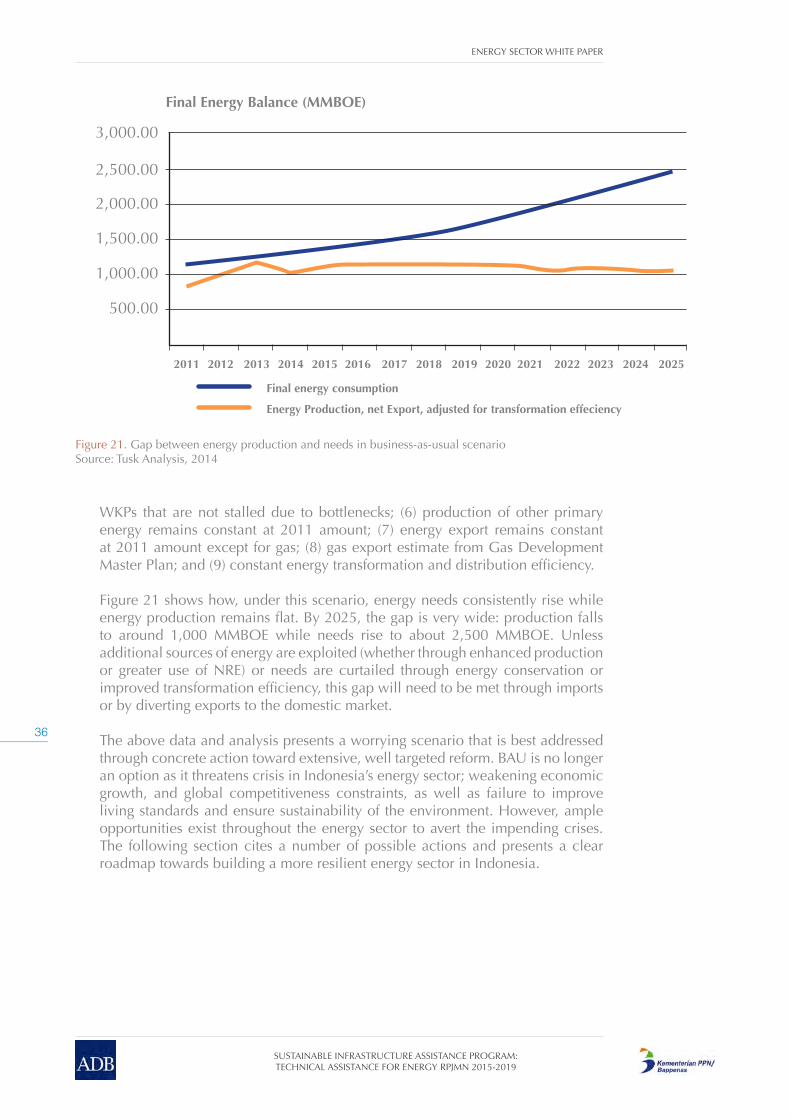
ENERGY SECTOR WHITE PAPER
36
SUSTAINABLE INFRASTRUCTURE ASSISTANCE PROGRAM: TECHNICAL ASSISTANCE FOR ENERGY RPJMN 2015-2019
WKPs that are not stalled due to bottlenecks; (6) production of other primary energy remains constant at 2011 amount; (7) energy export remains constant at 2011 amount except for gas; (8) gas export estimate from Gas Development Master Plan; and (9) constant energy transformation and distribution efficiency. Figure 21 shows how, under this scenario, energy needs consistently rise while energy production remains flat. By 2025, the gap is very wide: production falls to around 1,000 MMBOE while needs rise to about 2,500 MMBOE. Unless additional sources of energy are exploited (whether through enhanced production or greater use of NRE) or needs are curtailed through energy conservation or improved transformation efficiency, this gap will need to be met through imports or by diverting exports to the domestic market.
The above data and analysis presents a worrying scenario that is best addressed through concrete action toward extensive, well targeted reform. BAU is no longer an option as it threatens crisis in Indonesia’s energy sector; weakening economic growth, and global competitiveness constraints, as well as failure to improve living standards and ensure sustainability of the environment. However, ample opportunities exist throughout the energy sector to avert the impending crises. The following section cites a number of possible actions and presents a clear roadmap towards building a more resilient energy sector in Indonesia.
Figure 21. Gap between energy production and needs in business-as-usual scenarioSource: Tusk Analysis, 2014
Final Energy Balance (MMBOE)
3,000.00
2,500.00
2,000.00
1,500.00
1,000.00
500.00
2011
Energy Production, net Export, adjusted for transformation effeciency
Final energy consumption
2012 2013 2014 2015 2016 2017 2018 2019 2020 2021 2022 2023 2024 2025

ENERGY SECTOR WHITE PAPER
37
SUSTAINABLE INFRASTRUCTURE ASSISTANCE PROGRAM: TECHNICAL ASSISTANCE FOR ENERGY RPJMN 2015-2019
Indonesia’s energy sector faces several challenges and constraints. In order to achieve its full potential and address these challenges, it is imperative for GOI to prioritize several actions and solutions, which BAPPENAS can incorporate into the energy planning section of its upcoming RPJMN 2015-2019.
A pragmatic approach to energy sector reforms is recommended, wherein the government must aim to stabilize the sector through incremental reforms during the upcoming RPJMN period (see Figure 22) and target a major sector overhaul and rapid expansion only during the next period of (RPJMN 2020-2024). This means that during the RPJMN 2015-2019 period, the government should target low hanging fruits such as (i) fast-tracking implementation of large and strategic projects that are either making slow progress or have been stalled, (ii) clearing regulatory and implementation bottlenecks that impede public and private sector investments, (iii) rationalizing energy pricing to reflect market realities, (iv) speeding up essential policy reforms, and (v) increasing efficiency and capacity of government implementing agencies. In essence, in the upcoming RPJMN period, the government must aim to operationalize projects that have been planned and/or under development, while also preparing an energy market ready for rapid expansion and large-scale investments during the next period. An estimate of funding required for implementing these solutions is also provided, along with a discussion of financing.
Figure 22. Process for identifying Action PlansSource: Tusk Advisory Analysis, 2014
Resolving PrimaryEnergy Supply
Constraints
Diversify and expand supply of fossil fuel
energy RPJMN 2015-2019
CHALLENGES PRIORITY AREAS SUMMARY
PRIORITY AREAS
• Conducive Policy and Regulatory Framework
• Institutional Capacities and Coordination
• Diversified and Comprehensive Financial Planning
• Streamline Energy Sector Planning and Performance Monitoring
• Deepen Implementation Capabilities
• Increase Effectiveness of Environmental Sustainability Measures
ExpandingDownstream Energy
Infrastructure
Scale up renewable energy development
POLICY DIRECTION AND DEVELOPMENT
STRATEGYScaling up EnergyAccess in Rural and
Remote Areas
Expand downstream energy infrastructure
ACTION PLAN WITH KPIS
Investing in EnergyEficiency
Scale-up energy access
FUNDING REQUIREMENTS
Enabling DynamicEnergy Markets
Invest in energy efficiency measures
Improve effectiveness of SOEs and foster private
sector participation
Solutions
UNDERLYING CROSS CUTTING CONSTRAINTS
3 Creating a Sustainable Energy System for Indonesia: Challenges and Solutions
ENERGY SECTOR WHITE PAPER
38
SUSTAINABLE INFRASTRUCTURE ASSISTANCE PROGRAM: TECHNICAL ASSISTANCE FOR ENERGY RPJMN 2015-2019
The immediate implementation of the reform recommendations in this chapter is imperative, particularly in light of the concerns cited in recent OECD and World Bank reports. The latest OECD economic survey92 identifies the energy sector’s challenges as an impediment to Indonesia’s economic development, and suggests substantial reduction in energy subsidies to free up resources and reforms to energy pricing. Lack of electricity infrastructure is also highlighted as a threat to the development of SMEs93; the World Bank ranked Indonesia 161st out of 183 countries on the parameter of access to reliable electricity supply for businesses.94
3.1 Resolving Primary Energy Supply Constraints
3.1.1 Diversify and expand supply of fossil fuel energyIndonesia is now one of the world’s largest oil importers, with imports of nearly 650,000 bpd, or 30% greater than domestic production. Oil imports now cost nearly US$40 billion,95 and are a major contributor to Indonesia’s balance of payments deficit. Exploration has failed to identify enough new reserves: of the 1.9 billion BOE found in Southeast Asia in 2012, only 14% was found in Indonesia.96 Expiry of existing PSCs,97 along with policy and regulatory uncertainties in the oil industry,98 have reduced incentives for exploration of both new deep sea oil reserves and secondary/tertiary EOR, so the decline in oil production is likely to continue unless radical reforms are implemented. Although Indonesia has been a major exporter of LNG for several decades and domestic gas production has remained stable over the last decade, a significant portion of gas from existing and upcoming gas fields are committed to export, which might necessitate some gas import in the near future. Even though an abundant amount of coal is produced locally, a large portion is exported. Besides, the government’s plans to increase domestic utilization of coal and ease domestic coal transport infrastructure face bottlenecks and need a further push before they start showing results. The lack of coal ports in key production areas has led to coal smuggling, which has cost the country more than IDR 5 trillion per year.99 Furthermore, lack of sufficient coal transport, especially along the southern parts of Sumatra, makes logistical operations costly, with the profit margin for exporting low grade coal lower now than before the 2008 global financial crisis, when demand began decreasing. Currently, most coal produced is sent in large trucks by road, which causes heavy damage to infrastructure. A sufficient rail network is needed to lower transport costs, as well as reduce road congestion and damage.
A. Increasing Oil and Gas Reserves and ProductionIncrease oil and gas geoseismic surveying, including in offshore and deepsea areas. Oil and gas companies, with government support, need to undertake regional basin analysis and further explore for Yet-to-Find (YTF) reserves.
92 OECD Economic Surveys INDONESIA September 2012. 93 Smaller firms suffer frequent power outages because they cannot back-up generation: Survey of 13,000 companies experiencing power outages at least three times a week; p. 99, OECD, op cit.94 World Bank (2012), “Doing Business Indonesia,” The World Bank Group, Washington, D.C.95 Indonesia Subsidy Overview, May 2013. Global Subsidies Initiative, IISD96 Mahfoedz, op. cit., 11.97 More than 60% of Indonesia’s oil (1.2m boe per day) comes from PSCs that are scheduled to expire in the next ten years, with half of this from PSCs which expire in the next five years.Source: Gas Development Master Plan, Petroleum Development Consultants, IndII, 201398 For example, additional taxes on land and buildings within the working areas covered by PSCs, as imposed in 2010.99 Source: Platts, Indonesia’s Plan for Dedicated Coal Ports: http://www.platts.com/latest-news/coal/manila/indonesias-plan-for-dedicated-coal-ports-will-26827449, taken 23rd July 2014

ENERGY SECTOR WHITE PAPER
39
SUSTAINABLE INFRASTRUCTURE ASSISTANCE PROGRAM: TECHNICAL ASSISTANCE FOR ENERGY RPJMN 2015-2019
Exploration of new potential offshore resources, and in deepwater basins, as well as the finding of more deposits to increase oil and gas supplies, can be facilitated by mastering exploration and exploitation skills. Currently, exploratory surveying is the responsibility of MEMR’s regulatory institution DG MIGAS. In the future, partnering or reallocating the task to a specialized research institution, such as the Geological Agency, may prove more efficacious.
Improve incentives for secondary/tertiary recovery technology. Production in existing oil wells should also be increased through determination of secondary/tertiary recovery stages, including the application of EOR, during RPJMN 2015-2019, with continued EOR application and development of new fields in the medium term. The decision–making process for the transfer of expiring PSCs must be accelerated from long before the PSC expires to ensure contract extension for successful past performance. This will motivate operators to inject necessary funding for operations, rather than letting field production decline when licenses are expiring. Additionally, gas fields need to be well mapped-out to prevent PSCs from exploring fields with high CO2 and sulphur content.
Expand Gas Supply for Domestic Use and Streamline Licensing and Incentives Uncertain licensing, policy and regulatory regimes have impeded private sector investment in the country’s energy sector in the last few years. GOI will only be able to unlock investments from the private sector for both YTF exploration and EOR by providing stable policy and regulatory mechanisms, particularly with regard to the PSC regime. RPJMN 2015-2019 should urgently prioritize reforms to the existing PSC allocation and extension mechanism.
Reform awarding and extension processes for PSCs and blocks. The PSC awarding and extension processes need to be more investor-friendly. Currently there are 26 active PSCs that are due to expire between 2017 and 2025, but the status of their extension is unclear. The system must include clear technical guidelines for both awarding and extension. Incentives for secondary/tertiary recovery, such as profit-sharing, taking into account research and EOR feasibility study expenditures, or credit investment, and DMO, are essential. Additionally, the establishment of a mechanism for cost sharing for expensive EOR technologies between GOI and PSC holders is imperative. It will also be necessary for GOI to forge cooperation with PSC holders for research and feasibility studies, as well as for EOR pilot projects. In particular, MEMR needs to undertake more intensive and effective pre-exploration to facilitate the location of potential basins to reduce the risk of dry holes.
In the gas market, the government needs to balance its export obligations from upcoming fields with gradual increases in supply for domestic consumption. Long-term status for and early renewal of PSCs could result in increased investment in the upstream gas sector, whereas a more rational domestic gas pricing regime would make domestic supplying of gas attractive to downstream investors. The establishment of a separate agency within SKK Migas to focus on exploration and development of unconventional sources, such as shale gas and CBM, also will be necessary to encourage investments.
Expand supply of gas for domestic use. The share of gas for the domestic market must increase to ensure adequate energy supplies, while the strategy of exporting large segments of gas (currently around 50%) should continue. This would offer higher economic return than prioritizing exports at the expense of the

ENERGY SECTOR WHITE PAPER
40
SUSTAINABLE INFRASTRUCTURE ASSISTANCE PROGRAM: TECHNICAL ASSISTANCE FOR ENERGY RPJMN 2015-2019
domestic market, or allocating gas supplies exclusively to the domestic market at risk of deterring necessary investment. A gradual increase in the allocation of production share to the domestic market will eventually correct the price of gas in the domestic market to realistic market levels. In the interim, reference pricing would ease this transition to domestic prices that are more attractive for suppliers relative to export options.
B. Developing Specific PSC Regulations for Coal Bed Methane and Shale GasEnhance CBM exploration efforts. Indonesia has significant potential for CBM, yet very little exploration has been done. To accomplish this, it will be necessary to introduce regulatory reform to support exploration and development of unconventional resources. Although preliminary action is needed now, CBM cannot be expected to make a significant contribution until after 2020.
Incentivize exploration of shale gas in Indonesia. Shale gas development in Indonesia may require a higher investment cost than in the U.S. due to geological constraints, although precise cost conditions in Indonesia have not yet been determined. Nevertheless, Indonesia has significant potential for shale gas, so formulation of appropriate policy and regulatory reform on unconventional energy resources are imperative.
C. Consolidating Policies on Coal Utilization and Coal TransportAccelerate development of power plants. Providing further incentives to encourage the development and deployment of mine-mouth power plants that use low-calorie lignite in Sumatra should be a high priority solution because a majority of coal mines in the southern parts of Sumatra produce low calorie coal, which does not provide reasonable export margins. First of all, GOI needs to clarify the categorization of low calorific coal and set usage guidelines. Second, GOI should develop the necessary infrastructure to transmit power generated by mine-mouth power plants to demand centers.
Upgrade brown coal. Measures to improve utilization of low-calorie coal include research and pilot projects to improve the quality of coal through technological up-grading of brown coal (UBC) to reduce water content. Other actions include incentivizing the development of coal liquefaction plants to supply more environmentally friendly fuel, or substituting gasified coal for gas in EOR steam-flooding. The construction of coal gasification plants for power generation or for raw material for the chemical industry could be incentivized, as well as the further development of mine-mouth coal power plants.
Accelerate development of coal transport infrastructure. Domestic market demand for coal will increase, creating a need for more supporting infrastructure, such as coal ports, stockpiling and coal blending capacity, as well as the integrating of multimodal linkages from site to port and haulage fleet. A number of rail projects, such as in Bengkulu, South Sumatra, as well as in Central, South and East Kalimantan, have been proposed, but have faced extensive delays. These projects need to be facilitated as soon as possible. In addition, GOI’s plans to improve the performance of 14 ports (seven in Kalimantan and seven in Sumatra) must be facilitated. Development of main coal ports for coal export and consolidation of the port export data recording by MEMR and the Customs Directorate of the Ministry of Finance are also important, particularly in regard to reducing illegal export of coal through small ports.

ENERGY SECTOR WHITE PAPER
41
SUSTAINABLE INFRASTRUCTURE ASSISTANCE PROGRAM: TECHNICAL ASSISTANCE FOR ENERGY RPJMN 2015-2019
3.1.2 Scaling Up Renewable Energy DevelopmentDespite ambitious utilization targets, Indonesia has yet to scale-up its renewable energy capacity. Potential investors face policy and regulatory uncertainties and delays while PLN’s conflicting mandates have resulted in slow progress on PPAs. In addition, DG EBTKE under MEMR, which is tasked with pushing forward GOI’s renewable energy generation agenda, has internal problems with under-staffing and requires capacity building. Externally, there are regulatory hurdles, such as slow permitting and clearances. For example, obtaining forestry permits for geothermal development has been one of the most significant bottlenecks. However, the recently revised Geothermal Bill addresses this issue by re-classifying the license as Geothermal License instead of IUP for mining projects, to allow for their development in conservation forest areas. This law also has taken a major step by moving tender authorities from local governments to the central government. However, implementation will require further government and ministerial regulations as well as clear guidelines on the use of the Geothermal Fund.
In hydropower, local governments often award “mutually exclusive projects”, which hinders hydropower development by more than one party in the same river. Permitting, clearance and land acquisition also affect hydropower projects. Another pressing issue is mismatched supply and demand locations; for example, Papua has abundant hydro energy resources, but lacks demand, while Java lacks free steam for generating hydropower to meet its burgeoning needs.
Solar rooftop systems can be developed in urban areas, however in the absence of an enabling environment, no business models have emerged in Indonesia. In November 2013, PLN announced its readiness to take excess electricity produced by rooftop solar and credit it back for customer use. However, PLN does not yet have a mechanism to pay rooftop solar owners who do not require this customer use credit.
For rural and isolated grids, solar systems should be combined with other energy systems, such as diesel or hydro power, because solar systems cannot cope with rapid increases in demand. However PLN faces challenges in increasing exposure to diesel, as it has been restricted due to the high cost of diesel. This has created further challenges in building solar systems in rural and isolated areas.
A. Reforming the Geothermal SectorOperationalize Geothermal Fund. The Indonesian Investment Agency (PIP), under the auspices of MoF, has set up a US$300 million Geothermal Fund. However, PIP has faced challenges in operationalizing the fund such as the need for coordination with MEMR, which has the sole authority of exploration before tender, and the lack of technical capacity to implement exploration activities. Therefore, the clarity for the Geothermal Fund to conduct exploration through a joint agreement between MOF and MEMR and detailed operation procedures, including the assignment of sufficient full-time staff for the fund and appropriate panel of experts, need to be resolved in parallel with MEMR’s preparation of new government regulations on tender processes under the new Bill.
The recent report by ADB and WB suggests that providing credible exploration data to IPPs prior to tendering is crucial in attracting developers. Therefore, the

ENERGY SECTOR WHITE PAPER
42
SUSTAINABLE INFRASTRUCTURE ASSISTANCE PROGRAM: TECHNICAL ASSISTANCE FOR ENERGY RPJMN 2015-2019
Geothermal Fund needs to follow internationally accepted geothermal reporting codes in its exploration activities. Furthermore, at least three wells should be drilled and tested prior to each WKP tender, with the costs recovered from the successful bidder at the time of financial closure of the project.
Define geothermal tender process. Based on the new Bill on Geothermal, GOI needs to issue a government regulation to establish an effective tender mechanism. It is recommended that a central tender institution also be established in this process to coordinate with representatives from all stakeholders, including local governments and PLN to ensure that their interests are accommodated. PPAs should also be standardized to include a uniform tariff escalation formula, which is clear at the time of tender. Furthermore, there needs to be a mechanism such as the strict enforcement of a performance bond guarantee to ensure that winning bidders commence their exploration activities in a timely manner. The swift preparation of the new government regulation to resolve these issues through intensive stakeholder consultations is the first priority in taking advantage of the progress made by the new Geothermal Bill.
Debottleneck existing WKPs. The regulation on geothermal ceiling prices (MEMR No. 17/2014) has set deadlines for existing IUP holders to conclude PPAs with PLN and stipulated that the IUPs would need to be returned to the government if the deadlines are not met. This requirement will likely accelerate PPA negotiations and motivate IUP holders to start development activities. However, MEMR’s data for August 2013 on the development status of WKPs cites obtaining permits for exploration in conservation forests as the biggest bottleneck faced by project developers. The revision of the Geothermal Law now allows geothermal development in these conservation forest areas, where permits could not be issued before. While this is a significant progress, the lack of permitting process before implies that a new mechanism has to be developed. Close coordination between MEMR and the Ministry of Forestry to design this permitting mechanism will be the key in debottlenecking the development of existing WKPs.
Use existing funding sources and identify ones for geothermal brownfield development. The Clean Technology Fund, which has about US$200 million allocated for geothermal development in Indonesia has been used to finance geothermal projects by Pertamina and IPPs along with financing by the World Bank and ADB. The World Bank has also prepared US$500 million to support geothermal projects in developing countries under the Global Geothermal Development Plan. The Green Climate Fund, with a funding target of US$100 million a year by 2020, has recently been set up under UNFCCC to fund renewable energy development in developing countries. These facilities can potentially unlock the financing bottleneck for geothermal projects, as funds like CTF can even be used for exploration drilling. The GOI should coordinate closely with the providers of these funds to encourage and facilitate the use of these funds by geothermal developers like Pertamina/PGE and private IPPs.
B. Optimizing HydropowerSpeed up execution of hydropower projects under development. PLN’s Karama hydropower project, which is part of Fast Track Program 2, and the Lake Toba pumped storage project, should be accelerated to make way for other developments. The latest hydropower master plan published in 2012 has identified a number of large hydropower projects with a total capacity of 8,040

ENERGY SECTOR WHITE PAPER
43
SUSTAINABLE INFRASTRUCTURE ASSISTANCE PROGRAM: TECHNICAL ASSISTANCE FOR ENERGY RPJMN 2015-2019
MW that will require estimated funding of US$16.07 billion. These projects, which should be earmarked for immediate implementation, have been selected based on benefit and ease of implementation, minimizing environmental damage and resettlement.100 Additionally, the government plans to evaluate the potential of multi-purpose dams for energy generation. All of these projects should be accelerated through sufficient funding and other support for project development, such as the facilitating of permits and clearances, and land acquisition, as well as speeding up the signing of PPAs.
Integrate energy planning into river basin management. It will be necessary to integrate Indonesia’s energy requirements with river basin management to use the country’s estimated 75,000 MW of hydropower potential. There are currently three entities managing energy development in river basins: the Ministry of Forestry (for catchment areas), River Basin Boards (for water utilization),101 and local governments (for tenders and locations). Any attempt to utilize hydropower must be coordinated well, and is best relegated to the River Basin Boards. In the future, even the authority for tendering hydropower projects should be in the hands of the River Basin Boards to ensure maximum use of each river and to prevent “mutually exclusive projects”. In addition, MEMR and the DG of Water Resources should complement and support the roles of the River Basin Boards by formulating an optimal and wide-ranging hydropower development plan for major rivers that evaluates the trade-offs between agricultural, industrial and power use of hydro resources, and includes small-scale hydropower projects.
C. Increasing Deployment of Solar PowerImprove tender mechanism for solar hybrid IPPs. The ceiling price based tender process applied for auctioning 140 MW of grid-connected solar power capacity to IPPs is a positive development. However, this tender process can be optimized and made more efficient through auctioning larger numbers of projects simultaneously in phases, as is done in tender auctions in other countries, such as China, India and South Africa. A central tendering authority will be required to bundle projects. Additionally, investors require and must be provided with exact location and grid information, along with time for location survey. With sufficient information, investors will be able to submit better proposals and tender failure can be reduced. The above will help to address the current reality in which PLN’s solar program for mini-grids on islands is progressing slowly, given PLN’s restrictions on developing diesel backup. A diesel hybrid approach could provide least-cost generation as it combines locally available renewable energy resources (usually solar PV) with diesel generation. However, MEMR restricts PLN from developing any new diesel installation.
Pursue rooftop solar PV. The government should aggressively explore the potential for rooftop solar generation in Jakarta and other urban areas for demand-side energy management, in combination with net metering, smart grid technologies and incentives. Government, commercial and office building owners, in particular, should be mandated to generate a portion of their energy through renewable resources. This can be regulated through building codes in synergy with energy efficiency strategies. To encourage greater capacity installation by
100 The master plan does not, however, cover potential for small scale, localized and off-grid run-of-river hydropower, conversion of existing dams, or how to improve overall river basin management.101 River Basin Boards are under the Directorate General (DG) of Water Resources of the Ministry of Public Works

ENERGY SECTOR WHITE PAPER
44
SUSTAINABLE INFRASTRUCTURE ASSISTANCE PROGRAM: TECHNICAL ASSISTANCE FOR ENERGY RPJMN 2015-2019
customers, PLN should provide a cash payment on the balance instead of meter credit, similar to practices in the USA, Germany, and other countries. Other funding incentives, such as mortgage lines for households, loans for companies, and tax breaks for solar PV, should also be considered. Various rooftop solar business and implementation models, such as direct off-take of power by PLN, FiT-based PPAs, and net metering should be evaluated by MEMR and PLN before devising a policy and implementation plan. Learning and best practices from rooftop solar programs in Germany, Shanghai and India must be incorporated into any plan.
D. Developing Waste to Energy Power InfrastructureEncourage WTE generation. The government should provide local government funding assistance in the form of the Special Allocation Fund (DAK) for Waste to Energy (WTE) projects. Existing FiT incentive for WTE projects should be expanded for larger projects (>10 MW capacity) that can accommodate MSW produced by large cities. Partnerships between IPPs and local governments should be facilitated to replace tipping fee based waste procurement. In other countries, this is done through equity share for local governments in exchange for guaranteeing feedstock supply. Vertical integration of waste collection, transport, and waste management could also be considered to increase the financial attractiveness of WTE projects, as all three phases have revenue potential (waste collection fees are currently paid by households, waste transport and tipping fees are currently paid by local governments, while energy from WTE projects can generate revenue from PLN).
3.2 Expanding Downstream Energy InfrastructureThe lack of infrastructure in the downstream energy sector exacerbates the supply shortfall and endangers Indonesia’s capacity to ensure secure energy reserves beyond 2018. Immediate action to upgrade, expand and develop appropriate infrastructure is imperative, beginning with the provision of the considerable investment required to prevent the looming energy shortages.
3.2.1 Expand Oil Storage, Refinery and Distribution NetworkDevelop operational reserves and Energy Buffer Reserves (EBR). In 2013 the portion of imports in each type of major oil product reached 48% for fuel, 50% for LPG, and 33% for crude oil. Currently Indonesia does not have sufficient EBR storage facilities for stockpiling; shortages loom because there are no mandatory operational reserves (OPR) for traders other than Pertamina. Indonesia is expected to face thinning operational reserves by 2017 or mid 2018102, making the establishment of an emergency fuel reserve imperative by 2016 at the latest.103 However, any attempt to rectify this situation will require considerable investment estimated at US$ 35.86 billion for just 30 days each of OPR and EBR, and another US$ 46.14 billion to address other downstream infrastructure shortfalls, or a total annual expenditure of US$ 7.6 billion, which is more than ten time the US$ 0.75 billion invested in 2012 (see Section 3.6.5 for further details).
102 According to the Gas Development Master Plan (GDMP) team, the absence of a mandatory Operational reserve would make all existing oil fuel storage in Indonesia to be operationally full by end of 2017/mid 2018.103 This section is based on “Summary of Key Recommendations From Consulting Project Conducted For DEN On “Improving Indonesia’s Energy Security Through Regulatory Reform”, updated 20th March 2013, provided by David Braithwaite of the GDMP team
ENERGY SECTOR WHITE PAPER
45
SUSTAINABLE INFRASTRUCTURE ASSISTANCE PROGRAM: TECHNICAL ASSISTANCE FOR ENERGY RPJMN 2015-2019
104 BPH Migas Report, 2013
Another issue the government needs to address is the limitation of private sector players to compete with Pertamina in the downstream oil market. The current downstream market is deregulated and yet has Pertamina securing distribution of more than 98% of subsidized oil distributed in the market.104 These regulations must be reformed to allow more open market competition.
BOX A: Forward Placement Stock of Oil as EBR
The “forward placement model”, in which offshore fuel suppliers and traders are required to store products 30 days in advance at their cost on Indonesian shores rather than offshore, can provide GOI with a way to develop EBRs with minimal expenditure. Such forward placement agreements need to be implemented uniformly by both Pertamina and private sector entities to off-take imports domestically, rather than importing them directly.
To do this, open access principles must guide the development of forward placement stock (FP Stock) and storage (FP Storage) to ensure the reserve will remain independent of intervention by suppliers and traders while stored in Indonesia. In this system the FP Stock and Storage, to which GOI must have unrestricted access, serve as an EBR at no cost to GOI, except when it needs to withdraw stock in an emergency situation.
Upgrade existing refineries and integrate oil distribution network. Measures to ensure national supply of fuel and LPG and reduce dependence on imports include upgrading existing oil and CNG refineries to increase capacity and meet international fuel standards, as providing incentives for the upgrading of several oil and LPG refineries, along with construction of depots, storage and stockpiling facilities for crude oil, fuel and LPG in order to improve services in remote areas. Operational reserves and buffer capacity also must be improved. Oil distribution needs to be integrated. A pipeline network to transport oil would be practical; however it should only be implemented in areas where the demand makes it more economic than traditional truck logistics.
3.2.2 Develop Gas Pipeline and Distribution NetworkIndonesia’s natural gas transmission and distribution network will require aggressive development to increase delivery of gas to consumers. Experience with natural gas infrastructure development in other countries, such as Pakistan and Iraq, suggests that once the infrastructure is complete, the demand for natural gas will increase rapidly. A thorough plan to further develop a downstream industrial gas industry is needed. The soon-to-be published national gas master plan is a concrete step toward developing a viable downstream with its clear guidelines for development activities.
Currently, pipeline development -- with existing pipelines in Java, Sumatra and Kalimantan far from supply regions -- is not integrated with sources of natural gas, or with LNG plants, re-gasification plants, or CNG depots. This adds to the cost of transporting gas from port to pipe, hindering both efficiency and effectiveness of natural gas distribution networks.
Large industrial consumers of gas are generally concentrated in Java. On the other hand, the main sources of gas are located in Natuna, Kalimantan and Papua.

ENERGY SECTOR WHITE PAPER
46
SUSTAINABLE INFRASTRUCTURE ASSISTANCE PROGRAM: TECHNICAL ASSISTANCE FOR ENERGY RPJMN 2015-2019
Therefore, development of gas infrastructure to transport the gas to Java is required. Additionally, the government should promote industrial development near to gas production areas. This can be done by developing large scale de-gasification plants and pipelines in the Java-Sumatra-Kalimantan regions. Additionally, the government should develop mechanisms for gas infrastructure financing, either by the government/SOE or by involving the private sector through PPP or otherwise.The current tendering system for gas pipelines is not effective as many awarded projects have not yet been developed. One example of this is the Gresik-Semarang pipeline (East Java to Central Java), which was part of the 2005-2009 list of strategic projects, but never completed because there was no guarantee of a secure gas supply. This lack of supply security is rooted in several factors, among them being long-term export contracts that tie up the production of existing and under development gas production fields, domestic gas prices that are well below the regional market price, which makes producers reluctant to sell within Indonesia, and a lack of an established market mechanism to especially guarantee supply.
The Gas Development Master Plan (GDMP) recommends that the tendering system be retained, but with a focus on better pricing rather than guarantees. Up to now, the tendering process has worked satisfactorily, however gas pipeline developers are reluctant to start construction due to uncertainty that the pipelines will be utilized. Therefore, GDMP suggests that GOI should take on the risk of gas supply by coordinating advance negotiation arrangements or insuring bidders against risk of no supply. GDMP also recommends that GOI take on, or assist in, obtaining permits and land acquisition as required.
A. Leveraging Limited Opportunities to Utilize CNG for TransportationCNG opportunities should be focused in public transport sector. Shifting fuel usage from gasoline to CNG could reduce fuel subsidies and pollution in urban environments. In the past, GOI pushed widespread usage of CNG. For example, in 2012, GOI, through Pertamina, issued kits to enable conversion from gasoline to CNG in private vehicles. On a national scale, the program aimed to provide up to 82,000 converter kits between 2012 and 2014. However, the high cost of the converter kits and lack of CNG distribution points means only vehicles with clear route structures, such as buses, could benefit from the use of CNG. Increasing the use of CNG in public transportation in Indonesia requires the development of a solid policy, supported by clear environmental and fiscal backgrounds, for CNG use. In addition, conversion from oil to gas should start in regions that are close to production sources.105 Ideally, CNG should be utilized within around 100 km of supply. Additionally, the government should provide clear upfront incentives for CNG-based transportation, primarily in the form of tax incentives. Due to the extent of reform needed to convert use of gasoline to CNG, in the short-term, it is most plausible to initiate programs to convert gasoline to CNG for public transportation. Existing efforts are reflected in CNG-powered buses and bajajs, but conversion needs to be accelerated.
B. Developing Small-Scale LNG InfrastructureDevelop small scale LNG transport and power infrastructure. Transportation of LNG106 involves relatively simple infrastructure, as it does not require a vast network of transmission and distribution pipes. Instead, LNG can be transported
105 Greater Jakarta, for starters, has a potential for CNG. There are a number of small fields within 100 km that can supply gas.

ENERGY SECTOR WHITE PAPER
47
SUSTAINABLE INFRASTRUCTURE ASSISTANCE PROGRAM: TECHNICAL ASSISTANCE FOR ENERGY RPJMN 2015-2019
via maritime vessels and distributed to re-gasification plants along the coast, from whence it can then be used to supply small-scale power generation and, in appropriate cases, replace expensive diesel sets. With LNG supply, the power produced can become an anchor for development on island or specific localities.
According to Pertamina,107 small-scale shipping of LNG is one of the best means of transportation for natural gas products across Indonesia. The distances between islands are within the reach of small LNG vessels with a capacity of 5 to 30 MMSCFD. A 2011 study by PLN108 shows that small scale LNG shipping routes can be established within the Eastern Indonesian region to minimize travel time and cost. For example, the transporting of LNG from Bontang to supply gas plants in South Sulawesi, or from Donggi to Bitung. Once on land, LNG is transferred to specialized trucks and distributed to nearby power plants.
C. Strengthening Power Transmission and Distribution NetworkAccelerate the development of interconnection networks across islands. With long distances between sources of power supply and demand centers, Indonesia needs a reliable and stable power transmission system to accommodate growing demand for electricity. However, numerous large transmission projects have been delayed due to land acquisition problems and funding shortages. Additionally, existing electricity transmission is not compatible across regions as a result of the different systems and manufacturer standards adopted in the past. This creates difficulties in developing an interconnected transmission system. Nevertheless, GOI and PLN should focus on fast-tracking planned and ongoing projects, such as backbone transmission networks for Java and Sumatra and inter-island interconnection lines, including the planned Java-Sumatra HVDC line. Besides this, GOI needs to fast-track transmission line projects between Malaysia’s Sarawak and West Kalimantan and Peninsular Malaysia and South Sumatra, to reduce acute power shortages in these regions.
Kalimantan, where the need for power is growing rapidly, is currently the third largest power demand center in Indonesia after Java-Bali and Sumatra. Inter-island interconnections between Sumatra and Kalimantan and Java and Kalimantan will eventually be needed to create an efficient national grid system. A transmission line project between Malaysia’s Sarawak and West Kalimantan, which is being financed by ADB, is a step in the right direction. Nevertheless, PLN’s transmission grid approach in Kalimantan should move away from building several isolated grids to building a backbone transmission network across the load centers of East and South Kalimantan and extending it up to North Kalimantan and Northwestern Kalimantan. This will also encourage exploitation of the hydropower potential in North Kalimantan.
3.3 Scaling Up Energy Access in Rural and Remote AreasDevelop and implement least-cost electrification plan. While GOI targets achieving a 100% electrification ratio by 2020, it should also focus on providing reliable electricity
106 Volume of LNG is 1/600th of its gaseous state, which can be maintained at a minimum temperature of -161ºC107 M. Taufik Afianto (Pertamina, VP for Oil and Gas Commerce), Small Scale LNG; The Best Suited for Indonesia’s Archipelagos, 2012108 PLN Study by in cooperation with Bappenas, Tilburg University, and Pendawa, March 2011

ENERGY SECTOR WHITE PAPER
48
SUSTAINABLE INFRASTRUCTURE ASSISTANCE PROGRAM: TECHNICAL ASSISTANCE FOR ENERGY RPJMN 2015-2019
to all households and businesses in remote parts of Indonesia to aid local economic development. The key to achieving 100% electrification ratio and delivering reliable and efficient electricity services to rural areas is least cost electrification planning for rural energy access. PLN should work out an implementation plan for provinces in Eastern Indonesia on the basis of guidelines set out in the recently completed least cost electrification plan from the World Bank. This planning could then be scaled up for national coverage. Simultaneously, it is important to ensure PLN’s public service obligations are met, which might mean some cross subsidization of tariffs to keep the price of electricity for poor households low.
Redefine institution to implement electrification plans. While MEMR, PLN, and local governments have implemented several energy access programs, most efforts have not been integrated or coordinated. A regional or national electrification plan could ensure that activity is planned, coordinated and aligned with the energy access programs of international development institutions. This has been done effectively in China and Vietnam, where a central authority with sufficient funds in rural electrification combined off-grid hydro, solar and wind power sources. The planning activity should incorporate learning and best practices from GOI’s own programs, as well as from donor funded programs, such as those implemented by ADB and KfW-PLN. As has been proven in ADB’s “Scaling up Renewable Energy Access in Eastern Indonesia” program, which is being implemented with Hivos, mini and micro-grid models powered by renewable energy sources can be viable models in remote parts of Indonesia where grid extension might not be a viable option. It is recommended that the government create a strong and systematic regulatory and institutional setup that can aid rapid electrification in the country. This could involve PLN’s creating of a separate rural electrification agency, which might then access concessional funding from international development partners.

ENERGY SECTOR WHITE PAPER
49
SUSTAINABLE INFRASTRUCTURE ASSISTANCE PROGRAM: TECHNICAL ASSISTANCE FOR ENERGY RPJMN 2015-2019
BOX B: Least Cost Electricity Generation Planning: Sumba Island Case Study
Sumba is an island in Indonesia’s East Nusa Tenggara (NTT) region where people still rely on kerosene and firewood for cooking and lighting. Sumba has approximately 140,000 households of which just 32,000 have access to electricity from PLN’s grid. Even for those households living close to the grid, many cannot afford to pay connection fees. Production cost is high at US$ 0.25-0.30/kWh compared to the tariff of US$ 0.07/kWh. Alternative power generation is limited – just 8.84 MW powered by mostly diesel generators. Coal-fired power plants are not economically feasible given the logistical challenges of shipping coal to Sumba. Approximately 23,000 households are equipped with solar home systems through PLN or government programs, in particular SEHEN, but untold numbers have fallen into disrepair without proper maintenance services.
PLN estimates that energy demand in Sumba will peak at 13.4 MW by 2016. Since the island has abundant renewable energy resources, an energy-related initiative was established by Sumba’s local and regional governments, MEMR, and Dutch development organization Hivos. This program intends to turn Sumba into an “Iconic Island” of renewable energy, with goals of achieving a 95% electrification rate using 100% renewable energies by 2025. ADB joined this initiative in 2013 with a technical assistance grant eventually totaling US$ 2 million to MEMR1 to scale-up renewable energy development on Sumba Island and eastern Indonesia in general.
PLN’s RUPTL aims to develop 13.8 MW of local renewable energy by 2016 to enable diesel generation to be phased out entirely. Studies have identified more than 60 MW of renewable energy potential in Sumba including hydropower (3.8 MW already developed with additional 4.2 MW in planning stages), wind (17 MW potential), solar PV farms (9.1 MW potential), and biomass energy from future plantations on the island (30.9 MW potential). However, no network development has been included in this plan – which this will be a challenge in itself. The government’s effort in Sumba is supported by a Steering Committee consisting of MEMR, Sumba’s local government, Hivos, and other entities, as well as several Working Group with specific responsibilities, including monitoring and evaluating the program. These groups have jointly developed a blueprint for expanding renewable energy access in Sumba. Since 2013, ADB’s activities have included developing a detailed energy access plan for Sumba, identifying and preparing priority investment projects to be developed by small independent power producers, and strengthening the implementation of ongoing and planned energy access programs financed by the government. If achieved, Sumba would become a national example for the use of renewable energies to power rural and remote areas.
1 The grant was provided $1 million in funding from the Multi-Donor Clean Energy Fund under the Clean Energy Financing Partnership Facility (financing partners: governments of Australia, Norway, Spain and Sweden), and administered by ADB. In September 2013, the Government of Norway provided an additional $1 million in grant, also administered by ADB.
Source: Hivos, “Sumba: An iconic island demonstrating renewable energy”.

ENERGY SECTOR WHITE PAPER
50
SUSTAINABLE INFRASTRUCTURE ASSISTANCE PROGRAM: TECHNICAL ASSISTANCE FOR ENERGY RPJMN 2015-2019
3.4 Investing in Energy EfficiencyDevelop comprehensive action plan on energy efficiency management. Indonesia’s energy efficiency targets, as defined in RIKEN, need to be translated into an integrated energy efficiency action plan that encompasses all energy consuming sectors, such as the transport, industrial, household, commercial, and power sectors. Intensive coordination among government institutions will also be crucial. For example, MEMR for providing energy audits and establishing the use of energy labels; Ministry of Public Works for establishing building codes; Ministry of Trade for enforcing energy labels; Ministry of Education for instilling energy efficiency awareness and training programs; and local governments for implementing public transportation and enforcing building codes. A national team should be formed under the Coordinating Minister for Economic Affairs to create an integrated national strategy and action plan.
Empower and incentivize local governments to implement and enforce energy efficiency plan. Implementation and enforcement of an energy efficiency action plan is best managed by city/regency governments. At its core, energy efficiency is a bottom-up effort, which has to start with individual awareness and behavioral change. Local governments are in the best position to promote this change within communities. Furthermore, energy efficiency plans often include improvement of public transportation, which is within the domain of local governments. The central government, through the national team mentioned above, should assist local governments in developing locally tailored, integrated plans that are in line with national strategy and policies. The national team will then guide implementation through funding policies and incentives/disincentives for local governments.109
Provide financing and incentives for energy efficiency initiatives. The government should consider replicating the ADB-Eximbank program for providing non-collateralized loans for energy efficiency projects. Thailand’s Energy Conservation Fund’s structure and experience can be incorporated. The fund provides 0% interest capital to private lending institutions, which then provide loans at less than 4% to businesses for energy efficiency improvements. In addition to financing, other incentives should also be provided upfront. The tax incentives that Indonesia offers for energy saving equipment should be given during or immediately after purchase, rather than after 3 years of successful implementation.110
Incentives and disincentives should be considered for companies and buildings based on energy audit results compared to their peers, because different industries and buildings have different standards. Companies or buildings with the highest levels of energy efficiency in peer groups can be awarded with incentives.
109 GOI should provide upfront funding to local governments for energy efficiency programs, such as energy efficiency audits and public transportation. Many donors have such programs that can be tapped. For example, the North-South section of MRT in Jakarta is funded with donor assistance. Incentives can be provided for local governments that achieve energy efficiency targets. World Bank’s Output Based Aid (OBA) provides an incentive system for local government, OBA provides incentive for successful delivery of infrastructure through Special Purpose Grants (DAKs) to local governments, which can provide 10% counterpart funding, which is reimbursed once the local government has delivered infrastructure projects successfully.110 Based on international best practices, Indonesia could adopt various incentive schemes. For example, in Mexico, the government partnered with mortgage providers to allow higher mortgages for purchasing energy efficient houses, which encouraged property developers to build green. Scaling up energy efficiency programs for small-scale users also presents a challenge, so many countries establish partnerships with utility providers. For example, in the U.S., utility companies provide energy saving equipment for free to customers. In Mexico, a state owned utility company sells energy efficient refrigerators to poor customers through installments included in their electricity bills.
ENERGY SECTOR WHITE PAPER
51
SUSTAINABLE INFRASTRUCTURE ASSISTANCE PROGRAM: TECHNICAL ASSISTANCE FOR ENERGY RPJMN 2015-2019
Define and implement minimum energy efficiency standards. Green building codes should be set, mandated and enforced. Jakarta’s building codes provide a good template for national implementation.111 Government leadership, through early adoption of energy efficiency measures in public buildings, is another powerful tool to raise awareness. In Europe, buildings are obligated to put up their audit results in publicly prominent locations and in sales/rental advertisements to raise awareness.
111 While the legal basis for green buildings can be set nationally, an example of best practices sets energy standards based on regional climate, with areas with milder climate having more stringent standards. Building types also factor into standard setting,. For example, buildings that are operated for 24 hours such as hospitals often have more relaxed standards.
BOX C: Making the Energy Efficiency Fund Work
Although GOI’s effort to scale up its energy efficiency program will need to involve banks for the funding of end user projects, Indonesian banks are not comfortable with uncollateralized lending and lack sufficient capacity and experience to measure returns from energy efficiency projects. Energy efficiency funds in Thailand and Malaysia can provide good examples of coping with these financing issues for energy efficiency measures. The Energy Efficiency Revolving Fund (EERF), which was put into effect in Thailand from 2003 to 2013 with funding from taxation of oil products, provided facility owners, project developers and ESCOs with soft loans through commercial banks to finance energy efficiency projects. It provided 0% interest loans to participating commercial banks (later increased to 0.5% to cover administration costs), which could be lent out for up to 7 years at a maximum rate of 4% to finance energy efficiency projects. This 3.5-4% margin allowed banks to add in other funding sources, so they ended up disbursing over 2 times more in loan amounts. To ensure that the loans reached their targets, the Department of Alternative Energy Development and Efficiency (DEDE) provided technical evaluation of the projects, to support the financial appraisal by banks. It took 1-2 weeks to get technical approval. EERF funded 295 projects and realized savings of 1.2 GWh/year of electricity and 234 million liters/year of fuel. EERF required that banks assume the credit risk, so companies with weak balance sheets, such as start up ESCOs, were not funded. To further develop the energy services sector, Thailand later established the ESCO fund with US$ 15 million to provide up to 50% equity participation and venture capital investment to ESCOs. The Green Technology Financing Scheme (GTFS) in Malaysia provides interest subsidies and guarantees for energy efficiency loans disbursed by commercial banks to Malaysian-owned equipment manufacturers (up to 15 years) or users (up to 10 years). Malaysian Green Technology Corporation (Green Tech Malaysia), an SOE, implements GTFS and provides technical assessments. Users with projects that have been certified by Green Tech Malaysia can apply for loans from any banks. The banks can then obtain the guarantee derived from users who pay a 0.5% guarantee fee per year. GTFS then rebates 2% of the interest paid to the banks. In its early phases, GTFS faced issues similar to those confronting the EERF, such as lack of capacity and the lack of awareness among banks of the need to assess energy efficiency projects. Initially, the loan application rejection rate was more than 50% even if the projects had technical certification. Compared to EERF, the administration of the GTFS is slow, with technical certification taking up to 3 months.
ENERGY SECTOR WHITE PAPER
52
SUSTAINABLE INFRASTRUCTURE ASSISTANCE PROGRAM: TECHNICAL ASSISTANCE FOR ENERGY RPJMN 2015-2019
In the industrial sector, targets should be set for each industry after baseline audits to determine their current efficiency levels. For example, the cement industry in Indonesia is relatively energy efficient and thus should have a different energy efficiency target than relatively inefficient industries, such as steel.112
Implement energy efficiency labeling programs. Although Indonesia’s CFL lighting program is deemed a success, experience shows that mandatory implementation of energy labels will be slow because Indonesia does not have labeling criteria for most appliances nor a sufficient number of accredited laboratories. If Indonesia seriously intends to achieve RIKEN targets, it will be necessary to consider following international labeling standards. At the same time, domestic energy labeling programs for appliances and Minimum Energy Performance Standards (MEPS) should be accelerated and gradually brought to international levels. Targeted items also should be increased to include vehicles113 and personal devices, with all results audited and communicated to consumers.114 Coordination between the Ministry of Industry and Ministry of Trade should be intensified to ensure that items that do not meet MEPS cannot be sold. Additionally, MEPS should be reviewed each year and enhanced to reflect current technology.
Build capacity to comply with energy efficiency measures. Energy Service Companies (ESCOs)115 are almost non-existent in Indonesia, due to financing constraints and limited incentives for consumers to implement energy efficiency measures. In other countries, the ESCO industry is nurtured through government projects, while government energy management projects are rare in Indonesia. In other countries, Energy Savings Performance Contracts (ESPCs) are used, but this is not possible in Indonesia because GOI is reluctant to accommodate the amount of time ESPCs require to break even, while local governments are not allowed to commit to multi-year contracts that end after the tenures of locally elected officials.116 Going forward, procurement regulations should be amended to allow long-term performance based energy service contracts for both central and local governments.
It is also important to bridge the knowledge gap throughout transition periods to new standards. In particular, GBCI has highlighted the difficulty in finding energy auditors and local architects with knowledge of green building design. Korea has established the Construction and Economy Research Institute of Republic of Korea (CERIK) to provide learning modules for existing professionals. Similarly, Japan has Institute for Building Environment and Energy Conservation to provide higher learning of energy efficiency. GOI should consider working with these institutions to build local skills and capacity.
112 Indonesia’s cement industry uses 800 Kcal/kg clinker, which compares favorably to Japan (773 Kcal/kg clinker). On the other hand, Indonesia’s iron and steel industry uses 650 kWh/Ton, which compares poorly to Japan (350 kWh/Ton). Source: Indonesia Exim Bank, Energy Efficiency Project Finance Program.113 A Corporate Average Fuel Economy (CAFE) system is applicable for vehicles. The U.S. has imposed an an-nually adjusted average fuel economy standard for vehicles produced in a given year since 1975, with non-con-forming manufacturers required to pay fines. In the Indonesian context, the CAFE system should be applied to all vehicles sold in Indonesia, regardless whether they are imported or produced domestically.114 For example, the US has www.fueleconomy.gov and www.energystar.gov where customers can search for products based on energy efficiency metrics.115 ESCOs audit and implement energy efficiency measures in buildings at their own cost, which will be paid through savings in energy bills. Installment payments are set at an amount smaller than corresponding savings in energy bills. Energy Savings Performance Contracts (ESPCs) are generally performance based, where ESCOs are not paid if they do not achieve efficiency targets.116 Currently, revision to the multi-year contract regulation is underway to make it easier for central government institutions to form multi-year contracts. Unfortunately, Ministry of Finance is still reluctant to loosen the restriction on local governments’ multi-year contracts due to prevalent corruption among local governments.

ENERGY SECTOR WHITE PAPER
53
SUSTAINABLE INFRASTRUCTURE ASSISTANCE PROGRAM: TECHNICAL ASSISTANCE FOR ENERGY RPJMN 2015-2019
3.5 Enabling Dynamic Energy MarketsDespite its stipulation in various policies and regulations, the liberalization of the Indonesian energy market has not met expectations.
In the upstream oil and gas sector, efforts to increase or at least maintain reserve and production levels have been hampered by several factors, such as lack of credible technical information and the uncertainty surrounding regulations on cost recovery, taxation, incentives, and extension of PSCs. Market growth has been slow due to the challenging market conditions caused by Pertamina’s virtual monopoly (>90% despite efforts at opening up competition since 2001), which has led to stagnation or decline in investments in the downstream sector in recent years. Pertamina’s limited technological ability to manage production capacity, and lack of basic infrastructure in remote areas to facilitate the production processes, have slowed down oil and gas production. As a result, neither Pertamina, nor the private sector, has been able to play an effective role and Indonesia’s performance in the upstream oil and gas market has declined.
In the electrical power sector, although Law No. 30/2009 ended PLN’s monopoly, there have been no subsequent regulations to provide further elaboration or clarification of this partial liberation of the energy sector.
PLN’s capacity to keep up with demand for new power generation and transmission infrastructure remains limited. With insufficient tariffs to cover the full costs of generation, PLN is unable to meet new capital expenditure requirements. Although local governments are now allowed to participate in power generation activities, GOI needs to provide suitable incentives because their participation has been negligible. Numerous regulatory restrictions remain in place, which discourage market competition in all energy sectors. These constraints will eventually force the downstream sector into crisis without reforms to encourage private sector investments.
A. Improving the Effectiveness of SOEsDifferentiate between KPIs for business activities and government assignments for SOEs. PLN, Pertamina and PGN must be given a sufficient autonomy make decisions on a purely commercial basis, as well as establishing incentives for performing the developmental tasks assigned by GOI. This may result in the need for separate bookkeeping systems for commercial actions and the developmental tasks that could cause losses for SOEs. In the power sector, PLN should be allowed to focus more on established markets, such as Java-Bali and Sumatra, to improve service without sacrificing its financial condition. The development of power infrastructure and services on other islands could be accommodated in another set of books, or the development tasks relegated to another, especially established, SOE. Incentivize the promotion of efficiency in PLN. Performance Based Regulation (PBR), which sets allowed revenues (AR) on the basis of efficiency benchmarks, offers one option. PBR establishes efficient values for controllable costs, with pass-through for costs that are outside the control of PLN. Controllable costs include fuels used in power plants (heat rates); operating costs for transmission, distribution, and retailing; and corporate costs. Capital costs are determined in steady state as the financing cost required for an agreed investment plan. However, transition arrangements will be needed before steady state is reached. In the immediate future, cash needs would be determined based on committed projects117.
117 Recommendations based on briefing: “Introduction of a new regulatory methodology to Indonesia’s power sec-tor for 2014 - Performance-Based Regulation (PBR)”.

ENERGY SECTOR WHITE PAPER
54
SUSTAINABLE INFRASTRUCTURE ASSISTANCE PROGRAM: TECHNICAL ASSISTANCE FOR ENERGY RPJMN 2015-2019
Accelerate Pertamina’s acquisition of upstream technology and management skills. High priority also should be given to developing institutional capacity at all levels to ensure effective operations. Pertamina also needs to accelerate the acquisition of upstream oil and gas technology through several options, such as strategic partnerships, JV, acquisitions, technology purchases, and/or management contracts.
B. Fostering Greater Private Sector ParticipationCreate level playing field for private companies to compete with SOEs. A stable policy and a clear regulatory framework, including a firm incentive scheme, will increase market confidence and attract more interest from the private sector. Bidding procedures and parameters must be clear and implemented in a transparent and accountable manner to control the implicit cross subsidies enjoyed by SOEs. A competitive energy market is not only attractive for the private sector, but also crucial for shaping the competitiveness of SOEs and improving the quality of service delivery.
Provide clarity on future gas supply to facilitate development of downstream gas sector. Clarity about gas supply is necessary for convincing the private sector to invest in distribution networks and facilities. In tandem with the completion of the Trans Java trunk line, gas supply security will create vast opportunity to intensify the use of gas and reduce dependence on oil, which will bring the gas trade into line with market reality and eliminate price distortions.
Resolve common bottlenecks to allow IPPs to flourish. Common hurdles, such as land acquisition and permitting procedures must be resolved in order for IPPs to develop adequately. To accomplish this, GOI must clarify the primary energy supply situation for coal and gas fired power plants. Suitable pricing regimes need to be implemented. This will require close collaboration between key stakeholders, such as MEMR, PLN, MoF and local governments. Private transmission must also be realized to accelerate implementation of IPPs that have been constrained by lack of connection to the main system.
3.6 Addressing Cross Cutting ConstraintsGOI must address and resolve a number of constraints that cut across the entire energy sector with the establishment of a stable policy and regulatory regime for the energy sector, which includes attractive pricing and tariff mechanisms, an effective PSC regime, and implementation of a rational and targeted subsidy mechanism, in the next RPJMN 2015-2019.
3.6.1 Conducive Policy and Regulatory Framework
A. Improving Gas Pricing MechanismsImplement gas pricing reform. The current market for natural gas in Indonesia faces many issues. Delays in the development of new fields hinder supply availability, which slows infrastructure development, and reduces potential for domestic utilization. The market mechanism is constrained by lack of supply, with larger operators, such as PGN, dominating the market by restricting open access to most of its network.
To resolve these issues, a reference price should be set to proxy the value of gas based on existing market usage (e.g. fertilizer, power, industry). These prices will then become the basis for generating a competitive market price for gas in Indonesia that can accommodate both supply and demand. As a result the price

ENERGY SECTOR WHITE PAPER
55
SUSTAINABLE INFRASTRUCTURE ASSISTANCE PROGRAM: TECHNICAL ASSISTANCE FOR ENERGY RPJMN 2015-2019
must not be capped, but rather be derived from the diversity of domestic and export prices among the various sub-sectors.
Of course there will be special conditions which may require the reference prices to be exempted, as when gas supplies relate to LNG supplies. For example, high-cost fields could allow PSCs to sell at a more economically-friendly rate, and managing gas prices in Eastern Indonesia could facilitate replacement of diesel in power generation.
Develop gas price aggregator. A new gas aggregator will be necessary to facilitate the formulation of a reference price and remove the existing disparities between users. This new entity would be expected to enable the roll-in of new higher-cost gas supplies without disadvantaging new customers and to end the current rent-seeking and lobbying for allocations. A secondary benefit could be the facilitation of planning and coordination of infrastructure investments.
The gas aggregator would need to be a professionally run state-owned enterprise, and preferably not an expansion of existing players in the gas sector, such as PGN, because this could result in conflicts of interest. An independent aggregator would be able to function as a buffer between upstream and downstream players to ensure the market would be competitive.
Regulations regarding trade margins will be required to ensure market control, as gas traders enjoy the advantage of an oligopolistic market with little leeway for their customers to choose. The aggregator itself would not have the authority of a monopoly, but would leverage the positions of major players, such as PGN and Pertagas, so that any PSCs aiming to bypass the aggregator’s price would need to sell at a higher, more premium cost to secure gas supplies.
The aggregator must have the capacity to play the role of a pooling operator in such a way to ensure transactions between suppliers and their networks benefit consumers. Its responsibility, aside from setting prices, is to forecast supply and demand of gas for the following years to come. This will help the market as a whole in forecasting potential investment requirements and prevent stockpiling/depletion of resources.
Develop new gas tolling structure. A new gas tolling structure will be required eventually. GOI could establish and regulate a national gas pipeline toll fee to ensure standard toll collection and that pipeline developers are compensated in line with the proportion of their pipeline development within an agreed framework. As a result, users and operators will see the value of contributing directly to the development of gas infrastructure in Indonesia. The GDMP envisages the establishment of national transmission pricing mechanisms, to be introduced over the short to medium term to allow cross-subsidies from heavily to lightly-utilized infrastructure, which will remove the demand risk for infrastructure investors.

ENERGY SECTOR WHITE PAPER
56
SUSTAINABLE INFRASTRUCTURE ASSISTANCE PROGRAM: TECHNICAL ASSISTANCE FOR ENERGY RPJMN 2015-2019
BOX D: Gas Aggregator to Balance Domestic Gas Market Mechanism
To increase domestic gas supply, a gas aggregator will be required to balance the costs of old and new gas production fields, because new gas fields with lower economic feasibility require higher costs compared to older fields. An example of successful a national gas aggregator is the Gas Aggregator Company Nigeria (GACN), which was mandated by the government to help implement their version of what Indonesia calls its National Gas Master Plan. In more advanced markets such as the US, gas aggregation is managed on the community level.
The GACN manages demand of domestic gas by contacting potential buyers and conducting due diligence. If successful, buyers would be allowed access to the demand pool. GACN also manages the escrow account and aggregate price of gas. They also have the power to securitize gas supplies to gain capital from the market. As well, GACN manages the logistics operation of gas from suppliers to buyers and manages the metering systems installed to ensure accountability.
Similar to the GACN, Indonesia’s aggregator must play the role of pool operator to administer contracts between suppliers and sellers, as well as creating a solid billing system procedure. To accommodate the transportation, pool administration, and clearing house process, Indonesia must develop and possess its own infrastructure network.
One option for the establishment of a gas aggregator, although not the best, would be to use an existing SOE, such as PGN. Alternatively, the government can create an entirely new company to serve the role such as in the case of the GACN. Whatever form the aggregator takes, it must be given special privileges as the central window of entry for gas trade between upstream and downstream producers. Strong government regulation and clarity of institutional structure will be necessary to prevent the aggregator from becoming a market monopoly.
ExistingGas 1
P= $5/mmbtuQ = 100
P= $5/mmbtuQ = 100
C = $500 C = $700C = $1500
Total = $3500 Total = $3500
C = $1750C = $1500 C = $1050
P= $6/mmbtuQ = 250
P= $6/mmbtuQ = 250
P= $10/mmbtuQ = 150
P= $10/mmbtuQ = 150
User A User AUser B User BUser C User C
ExistingGas 1
ExistingGas 2
ExistingGas 2
Aggregator
NewGas 3
NewGas 3
P= $7/mmbtuQ = 100
P= $7/mmbtuQ = 250
P= $7/mmbtuQ = 150

ENERGY SECTOR WHITE PAPER
57
SUSTAINABLE INFRASTRUCTURE ASSISTANCE PROGRAM: TECHNICAL ASSISTANCE FOR ENERGY RPJMN 2015-2019
B. Improving pricing mechanism for renewable energyDevelop least-cost or avoided cost based pricing mechanism for renewable energy. Even though attractive feed-in-tariff mechanisms have been introduced by MEMR for some renewable energy sources, progress on the signing of PPAs between PLN and IPPs has been slow, partially due to PLN’s reluctance to purchase renewable power at higher tariffs, which conflicts with government set profitability mandates. Hence, GOI is advised to switch to a least cost or avoided cost based pricing mechanisms for renewable energy, similar to the recently adopted mechanism for geothermal energy based on recommendations from ADB and World Bank. Renewable energy pricing can be reduced further using a ceiling price based reverse bidding or tendering mechanism, as is planned in the geothermal sector. MEMR should evaluate the benefit of extending this pricing model to all renewable energy technologies. Eventually, renewable energy pricing should be technology agnostic, with least cost renewable energy being produced locally and supplied to the electricity grid.
C. Aligning Incentives and Energy SubsidiesDevelop and implement subsidy removal plan, and identify targeted subsidy beneficiaries. Removing subsidies and the distortions they create is widely understood as the key to improving Indonesia’s energy system. However, all options are politically difficult: reducing the subsidy to PLN will require increases in electricity tariffs; reducing subsidies on fuel will require increases in petrol prices; and reducing fertilizer subsidies may reduce agricultural productivity. An effective way to achieve public understanding and support of subsidy removal is to publicize the amount subsidized for each consumer’s energy bill. This has been successfully implemented in EU countries, leading wealthy consumers to voluntarily give up their subsidy entitlements.
Some progress was made with the price increases in 2008 and 2013118, which have resulted in the reduction of subsidies for petrol, diesel and LPG, which has decreased price distortion. Nevertheless, Indonesia still has the lowest fuel prices among major economies that are net consumers of oil.119
The fuel subsidy needs to be reduced on a gradual basis. The main steps to implement this include controlling subsidized fuel distribution system, improving quality (grade of fuel with a higher octane content), and developing infrastructures in line with the quality of fuel supplied. Despite this progress towards reducing energy subsidies, it is necessary for the government to ensure that poor households are not over-burdened with increased energy prices and tariffs.
Also in 2013, electricity tariffs were increased, but the progressive tariff structure prevented this from affecting power tiers below 900VA.120 The reduction of the electricity subsidy, currently channeled through PLN, would be more effective if local governments co-financed it and channeled it directly to the poor on a basis of a life line quota (kwh/person or household/month). If the beneficiary utilizes more that the subsidized allocation, they would have to pay the actual price for the excess consumption. However, this can only be done if the electricity price
118 These increases were accompanied by compensation packages to reduce the impact of higher prices on the poor, including unconditional cash transfers119 NdiameDiop, World Bank (2014), ‘Reducing Indonesia’s energy subsidies: A prudent, fair and transformative reform’, in Economist Intelligence Unit, Powering Up Indonesia, Figure 3.120 Diop, op. cit., 15.

ENERGY SECTOR WHITE PAPER
58
SUSTAINABLE INFRASTRUCTURE ASSISTANCE PROGRAM: TECHNICAL ASSISTANCE FOR ENERGY RPJMN 2015-2019
is cost reflective on regional or system basis. Another possibility is to subsidize the development of locally available renewable energy sources to compete with conventional plants. The level of renewable energy use can be linked with a central government incentive scheme to subsidize regional energy development. 3.6.2 Strengthen Institutional Capacities and Coordination
A. Resolving Regulatory BottlenecksResolve bottlenecks hindering current power plant projects. Various existing power plant projects, such as those in FTP 1 and 2, have been delayed due to various bottlenecks, such as land acquisition and environmental permits. PLN and MEMR do not have the authority across government institutions that are needed for effective debottlenecking. The government is currently establishing the KPPIP (Committee for Acceleration of Priority Infrastructure Provision) to solve this. Once established, KPPIP must immediately act to debottleneck stalled power plant projects. Strengthen institution capacities and coordination for government agencies and SOEs. Institutional arrangements for the oil and gas industry are currently separated into upstream and downstream activities. For upstream activities, the regulatory role is performed by the MEMR (i.e. DG Migas), while for the downstream activities, it is shared between DG Migas and BPH Migas.121 In the electricity sector, the sector regulator is the DG Electricity (MEMR). Thus, the regulator is part of the ministry, which may give rise to a conflict of interest between its policy making and regulatory functions. In addition to the DG Electricity, local governments are also authorized to perform regulatory functions for locally operated electricity businesses that are not connected to national transmission grid or outside PLN working area.
There are two options to improve current institutional arrangements for the oil and gas sector. Firstly it could be re-aligned according to a model where a single regulator (a new regulatory body) would be created, taking over present regulatory functions of DG Migas and BPH Migas, with the result that the policy-making, regulatory and contracting roles, as in Nigeria and Thailand, would no longer be performed by different institutions. Alternatively there could be a single contracting authority for the oil and gas sector, providing more consistency in the planning and implementation of downstream projects relative to upstream projects and vice versa.
A more radical proposal would be to combine all the energy sub-sectors into a single category, with one regulator and one contracting agency. This proposal, for which there are several international precedents, such as in UK and Australia, merits serious consideration from a policy development and implementation perspective.
Key players, particularly the state owned enterprises such as PLN, Pertamina and PGN must be given sufficient autonomy make decisions purely on commercial basis and to be incentivized for performing developmental tasks assigned by the Government. Pertamina needs to master the upstream oil and gas technology
121 As discussed above, these arrangements are being revised in order to be consistent with Constitutional Court rulings.

ENERGY SECTOR WHITE PAPER
59
SUSTAINABLE INFRASTRUCTURE ASSISTANCE PROGRAM: TECHNICAL ASSISTANCE FOR ENERGY RPJMN 2015-2019
quickly, while upgrading aging infrastructure. PGN should be incentivized to complete the gas network both in the main trunkline and distribution areas. High priority should also be given to developing institutional capacity at all levels, covering the human, system and other resources required for them to operate effectively. PLN needs mandate its regional offices to make decisions based on development guidelines to accelerate project development.
There is a clear need to increase the role of the private sector to cope with rapid growth in the energy sector. With limited public resources available, private parties are expected to provide much needed resources and expertise for energy supply. In principle, Indonesia’s energy sector policy and regulations are geared towards more private participation; however implementation still faces many constraints. Private companies should be given a level playing field to compete against the state owned enterprises, although some amount of cross subsidization might still be required to support poor households.
GOI should also work towards enabling and incentivizing local governments to participate actively in the energy sector, such as making investments in local power generation infrastructure. These incentives can include transferring a portion of the energy subsidy burden, through policy and regulations related to savings and expenditures, to local government budgets.
3.6.3 Streamline Energy Sector Planning and Performance MonitoringIndonesia lacks a long-term energy strategy and guidelines for its implementation. A case in point is the poorly implemented oil to gas fuel conversion policy. No measures were taken to debottleneck and no consequences were imposed on implementing agencies for missing KPIs. It is imperative for GOI to rectify this situation, by replacing unachievable targets with a realistic and clear long-term national energy strategy, which, in turn, would inform regional strategies. Other countries, such as China, which collects data and records data at regency level, have successfully improved their energy security through applying a clear and firm energy strategy at both the national and regional levels.
In Indonesia, data problems must be addresses before a robust and credible energy policy can be formulated and applied. The lack of availability or inconsistency in data in the country means that statistical information falls short of international standards. For example, the discrepancies in data collected at customs and that provided by MEMR. Furthermore, oil sales are overstated due to double-counting caused by mark-ups at both wholesale and retail levels. Local energy resource and reserves data in particular are lacking or below standard. One case in point being that the recording of electrification does not follow a consistent standard for the quality and quantity of electrification provided.122
A. Improving the Quality of Energy Sector DataManage energy sector data underspecialized institutions. Quality and accuracy of data in the field of energy is scattered and often unaligned among the various energy sectors. For example, in the oil sector, most oil companies report their reserves following the Petroleum Resources Management System of the Society of Petroleum Engineers (SPE). Indonesia could significantly improve the accuracy
122 In China, the electrification ratio is calculated based on the number of households that receive at least 4 hours of electricity daily.

ENERGY SECTOR WHITE PAPER
60
SUSTAINABLE INFRASTRUCTURE ASSISTANCE PROGRAM: TECHNICAL ASSISTANCE FOR ENERGY RPJMN 2015-2019
and effectiveness of its database on probable and possible reserves if it aligns its categories to those of the SPE. A single body, under the auspices of SKK Migas, should be responsible for this change. In addition, Indonesia needs to develop its own independent view of prospective resources, and that responsibility should be handed over to LEMIGAS (Oil and Gas Research and Development Agency under the MEMR).
In the power sector, the DG of Electricity needs to work in tandem with PLN, in particular to define electrification standards and compile electrification ratio data. In general the collection, compiling and issuance of data are slow, for example energy balance data from 2012 has yet to be published. In addition, the lack of a well-defined energy elasticity formula123 makes the setting and monitoring of targets difficult.
B. Establishing Comprehensive Energy Sector Planning and KPIsIntegrate overall energy sector planning. Once data is well managed, the government will have to integrate energy sector planning to prevent overlapping on the technical level. For example, in the gas sector, a major drawback of the National Gas Transmission and Distribution Master Plan (Kepmen ESDM No. 2700 K/11/MEM/2012) is that it excludes FSRU and onshore LNG developments, which can either compete with or complement planned pipelines. The Master Plan also fails to accommodate regulatory updates as detailed support information. The GDMP team recommends the inclusion of all midstream and downstream infrastructure (notably FSRU) into the Master Plan. Data sources and assumptions made to calculate forecasts should be made more readily accessible to all parties to improve transparency and understanding, and the plan should be updated at pre-determined regular intervals. A gas coordinating committee also must be established, consisting of key senior officials from governing entities such as DEN, MEMR, BPH Migas, CMEA, MoF, and BAPPENAS, to reduce the risks resulting from overlap in the gas market. This committee must be responsible for the formulation and publication of gas developments, and empowered to take final decisions on implementation plans.
3.6.4 Increase Effectiveness of Environmental Sustainability MeasuresDevelop and implement environmental safeguards. In Indonesia, the enforcement of environmental safeguards is prerequisite for increasing the effectiveness of environmental sustainability measures. Currently only the AMDAL feasibility study measures actively function as regulatory safeguards to prevent environmental damage from development activities. An Initial Environmental Examination needs to be applied in infrastructure projects; in particular energy projects. An Environmental Assessment Review Framework also must be set into place as a standard document, along with a human resource capacity building mechanism to implement it. Environmental Impact Assessments, calculating both the environmental and social impact of projects must also be set into place as a precondition for energy development.
Utilize domestic and international funds to implement NAMAs. Another environmental sustainability application is the Nationally Appropriate Mitigation Actions (NAMA). One form of NAMA, which is making noticeable progress in
123 If energy elasticity is defined as growth of primary energy consumption (excluding biomass) over GDP growth in the past 10 years, then Indonesia’s energy elasticity in 2011 (0.85) was already below the target of (<1) that RIKEN sets: IEA 2014 data and Tusk analysis.

ENERGY SECTOR WHITE PAPER
61
SUSTAINABLE INFRASTRUCTURE ASSISTANCE PROGRAM: TECHNICAL ASSISTANCE FOR ENERGY RPJMN 2015-2019
various major cities in Indonesia, is the sustainable urban transport program, involving reducing use of private vehicles and increasing use of public transport and non-motorized transportation. NAMA smart-street-lighting initiatives are in the investment pipeline and programs are being developed to help city governments refit streetlights with LEDs (or other forms of low-emission lighting) to reduce energy consumption and CO2 impact.
Another major NAMA earmarked for investment is the development of bioenergy, in particular the development of biogas technology for utilizing agricultural waste and palm oil to generate electricity. Other NAMAs currently being developed include the application of green building codes, reduction of emission from solid waste collection, reduction of emissions in cement production and usage, and reduction of emissions from lumber activities through the use of wood pellets. The ICCTF is actively involved in the development of NAMAs and has abundant information with its regards.
Apply carbon capture and storage technology in power plants. In terms of energy production, carbon capture storage (CCS) can be used to reduce carbon emissions from conventional sources of power generation. Currently there is a pilot project for natural gas combined cycle plant capture in Java, which could reduce 10,000 tons of CO2 per year. Potential also has been identified for coal power plants, although no action has been taken. Considering that coal is projected to account for 66% of the power generation mix in the RUPTL, CCS for coal fired plants needs to be explored.
In Indonesia over the past few years, primarily due to the dwindling resources of UNFCCC, funding for climate change mitigation actions has been lacking. To address this gap, Indonesia must take advantage of the multilateral sources of carbon credit mechanisms available in the country, such as funds pooled by the ICCTF and the Joint Credit Mechanism established by Japan. It is imperative that Indonesia utilize these programs well to ensure GHG emission reduction targets can be achieved to the level stated by RAN-GRK and RAD-GRK. 3.6.5 Develop Comprehensive and Diversified Financing Plan
A. Forecasting Investment NeedsNew energy sector investments are required for exploration of new oil and gas fields, development of gas pipeline infrastructure and FSRU, as well as national strategic fuel reserves for oil and LPG, along with development of power infrastructure including coal, hydro, gas, geothermal, biomass, and other forms of power plants, and the development of transmission lines, and coal transport facilities. This section provides an indicative overview of estimated investment needs for each of the energy sub-sectors into 2019, based on data and projections from various government agencies, including DEN, BAPPENAS, PLN, MEMR, MoT, and other development partners and investors.
Nearly US$ 100 billion is required to develop power plants and transmission lines alone if GOI expects to ensure a 100% ratio can be achieved by 2019/2020 based on RUPTL 2012 assumptions.
The next largest investment of US$ 35.92 billion is required for oil and gas, in particular to secure a sufficient energy reserve, while the coal sector, especially

ENERGY SECTOR WHITE PAPER
62
SUSTAINABLE INFRASTRUCTURE ASSISTANCE PROGRAM: TECHNICAL ASSISTANCE FOR ENERGY RPJMN 2015-2019
the development of appropriate logistics and transportation facilities, such as ports and railways, also will require intensive investment.
While other costs are taken from various studies, the investment requirements for the power infrastructure are developed on the basis of: 100% electrification ratio; per capita consumption of 1,440 kWh per year by 2019 (equal to RUPTL 2012 assumptions); plant factors based on international practice (IEA, 2010); energy mix adjusted in accordance with Presidential Decree No. 5 of 2006 on National Energy Policy; unit costs for generation based on IEA (2010) and EU Sustainable Energy Communities (SEC) (2008) with adjustments for coal and hydroelectricity; and transmission and distribution of energy proportional to RUPTL.
Table 3. Investment Needs for the Energy Sector 2015-2019
Source: Tusk Advisory Analysis, 2014
B. Identifying Potential Funding SourcesIn general, the APBN state budget allocation has not been sufficient for the urgent needs of infrastructure development (see Figure 23). Yet BAPPENAS forecasts that only IDR 1,370 trillion is available in the APBN for infrastructure development in 2015-2019. This means that the country cannot rely on the APBN alone to finance energy development.
Type of Development
Estimated Investment Cost (US$
Billion)
Estimated Investment Cost (IDR Trillion)
Output
Investment for Oil Infrastructure $7.90 IDR90.80 Exploration, new depots, upgrading refineries
Upstream Gas Development $36.02 IDR417.88 New exploration in 30+ basins
Downstream Gas Pipeline Infra $14.06 IDR163.05 1000+ km new pipeline
Energy Buffer Reserve $18.75 IDR217.50 30 days reserve
Operational Storage Reserve $17.11 IDR198.48 30 days reserve
Coal Fired Power Plants $24.80 IDR287.66 17.04 GW, 112 TWh
Geothermal Power Plants $27.02 IDR313.46 6.37 GW, 47 TWh
Gas Power Plants $0.53 IDR6.09 0.49 GW, 2.6 TWh
Hydro Power Plants $13.36 IDR154.96 3.87 GW, 11.2 TWh
Diesel Power Plants $0.04 IDR0.46 0.03 GW, 0.15 TWh
Other Renewables $5.29 IDR61.32 1.41 GW, 5.2 TWh
Development of Transmission Lines $8.48 IDR98.32 40,509 Kmc
Development of Distribution Lines $21.17 IDR90.80 221,355 Kmc
Coal Port Facilities $0.71 IDR8.18 Sumatra, Java, Kalimantan
Coal Railway Facilities $2.44 IDR28.10 Sumatra and Kalimantan, Dedicated
Need to allocate additional budget for unconventional gas support and energy efficiency
Total Investment Requirement in Energy for 2015-2019
$197.65 IDR2,137.04
Note: Based on IDR 11,500 per US$

ENERGY SECTOR WHITE PAPER
63
SUSTAINABLE INFRASTRUCTURE ASSISTANCE PROGRAM: TECHNICAL ASSISTANCE FOR ENERGY RPJMN 2015-2019
Currently the development of energy projects is heavily reliant on a mix of state-budget based financing and IPP project funding; this approach may not be effective as can be seen from the slow growth in energy development in the past 5 years. Historically, the power sector averages 11.7% of the infrastructure budget allocation. If the same portion applies, the forecasted government allocation only reaches IDR 137 trillion for 2015-2019. This indicates that APBN and IPP financing will not be able to cover the amount of funding required for the energy sector for the next 5 years, which will necessitate the utilization of more creative PPP schemes and the allowance of a margin for off-balance sheet and strategic financing.
If the supply of gas and its market price were at a feasible level, energy projects could be adequately profitable. In line with the need to tap this potential, Pertagas and PGN are both assigned under the gas master plan to develop 1000+ km of new gas pipeline infrastructure, which will require the support of incentives from GOI. GOI should also allow SOEs to gain direct sub-sovereign loans at commercial levels of interest to mitigate risk.
Another form of alternative financing would involve encouraging PPP with government guarantee, so that any development undertaken by the private sector would be at better value-for-money.
Figure 23. Forecasted Funding Gap for Infrastructure for 2015-2019Source: Bappenas, Background Study for RPJMN 2015-2019 on Infrastructure Workshop, January 2014
IDR (6,000)
IDR (5,000)
IDR (4,000)
IDR (3,000)
IDR (2,000)
IDR (1,000)
IDR -
Funding GapRemaining Funding GapPure Private
PPPPPP with VGF
PPP Funding SOE FundingIn Trillion Rupiah
SOE FundingGovernmentFunding
Investment Need for Infrastructure
SOE Fundingwith Guarantee
Off Balance Sheet Funding
IDR (5,452) IDR (1,370)
IDR (150)IDR (200)
IDR (93)IDR (648)
IDR (442)
IDR (2,549)

ENERGY SECTOR WHITE PAPER
64
SUSTAINABLE INFRASTRUCTURE ASSISTANCE PROGRAM: TECHNICAL ASSISTANCE FOR ENERGY RPJMN 2015-2019
Table 4. Alternative Funding Methods
Source: Medium Term Infrastructure Strategy 2015-2019, BAPPENAS-JICA, 2014
GOI also has established the Indonesia Infrastructure Guarantee Fund (IIGF), an institutional mechanism for infrastructure financing, which can be used to raise the required investments from development partners and private investors. It was established to guarantee the government’s contractual obligations in concession agreements. GOI also established long term infrastructure funding non-bank financial institutions – PT. Sarana Multi Infrastruktur (SMI) and PT. Indonesia Infrastructure Financing (IIF) -- that are partly owned by MoF via PT SMI. In addition, GOI also operates the Government Investment Center (PIP), which finances local government infrastructure development as well as PLN. These institutions can assist in financing the development of the energy sector.
Strategic Financing Scheme: Bundling and Unbundling of ProjectsThe strategic financing scheme is an innovative method of financing energy projects, especially at the infrastructure level. This involves the development of a strategic business entity with GCA like roles but the flexibility and capacity of a corporation. This company can then mix various financing schemes, ranging from commercial debt to sovereign guarantees. This strategic financing involves the bundling and unbundling
Funding Method Description
Government Funding
Central Government
APBNAnnual central budget allocated for infrastructure.
ODA LoanForeign currency based loan from donor.
Country BondBond issuance based on country credit rating.
Asset LiquidationFund generated from asset sales, secu-ritization, IPO of BUMN.
Regional Government
APBDAnnual regional budget allocated for infrastructure.
Municipal BondBond issuance based on municipal credit rating.
Regional Direct Loan Direct lending to regional government.
SOE Funding
Cash pool+ operating CFFunded by SOE’s liquid asset or operat-ing cashflow
Company BondBond issuance based on SOE credit rating.
SOE Direct LoanDonor’s sub-sovereign loan. Commer-cial bank loan.
PPP FundingPrivate Fund with Gov’t support
Investor’s equity with project finance + VGF and guarantee
Private Funding Pure Private FundingFunding purely from private sector with no government support
Strategic Funding
Vertical, Horizontal SplitHybrid of above methods by splitting assets
Cross-sector packageHybrid of above methods by packaging linked projects
OthersInfrastructure fund/bond, Project bond and other financial pack

ENERGY SECTOR WHITE PAPER
65
SUSTAINABLE INFRASTRUCTURE ASSISTANCE PROGRAM: TECHNICAL ASSISTANCE FOR ENERGY RPJMN 2015-2019
of projects, with the strategic entity managing the entire development. China has utilized this to great effect. In the case of the energy sector, the development of specific gas fields, pipelines, and processing facilities can be bundled, but implementation divided and developed by various other entities.
4.1 Selecting Appropriate KPIs and Targets for Priority Areas
Based on the Long Term National Development Plan (RPJPN), the 3rd Development Plan (2015-2019) is intended to further strengthen overall development in various fields by emphasizing the achievement of competitive advantage that is based on natural resources, quality of human resources and the mastering of science and technology. The RPJPN does not specify specific targets of achievement for the energy sector except the use of nuclear power for the generation of electricity by2019.
The draft RPJMN 2015 – 2019 indicates the following main development targets: 1. Improving the quality of human resources toward equitable welfare 2. Enhancing sustainable and inclusive economic growth 3. Evenly balancing regional development 4. Improving the quality of environment, disaster mitigation and climate change5. Preparation of strong foundation for development6. Acceleration of infrastructure development for growth and equity7. Improving the management and value added of natural resources sustainably
In that regard, BAPPENAS has identified the following strategic issues:• The need for fiscal reform to achieve economic transformation and stability• Development of natural resources and environment to ensure food, water, and
energy security• Politics, security and defense, including eradication of corruption, enhancement
of law enforcement, and development of institutional framework for good governance
• Equitable development that includes poverty alleviation and expansion of employment
• Development of basic and other infrastructure, including connectivity and logistics system efficiency
• Balancing regional development through development of strategic rural and urban areas
Energy, which holds the unique position as both enabler of Indonesia’s development and primary revenue source, will play a pivotal role in addressing the above issues. The key energy policies stipulated in the Technocratic Draft of RPJMN are: 1. Increasing the production of primary energy2. Increasing the energy buffer stock and operational reserve3. Increasing the role of new and renewable energy in the energy mix4. Increasing energy accessibility5. Improving management of the fuel subsidy to make it more effective and
transparent 6. Utilization of water resources for hydropower
4 Recommendations and Key Performance Indicators (KPIs) for RPJMN 2015-2019
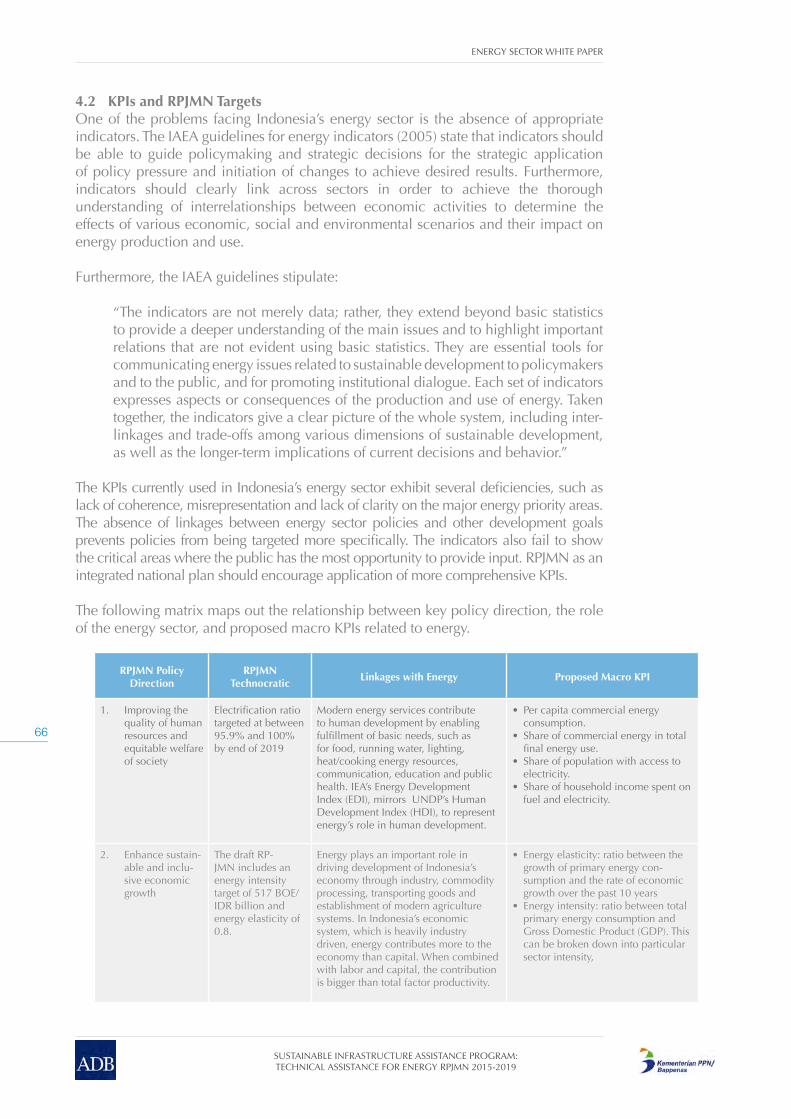
ENERGY SECTOR WHITE PAPER
66
SUSTAINABLE INFRASTRUCTURE ASSISTANCE PROGRAM: TECHNICAL ASSISTANCE FOR ENERGY RPJMN 2015-2019
4.2 KPIs and RPJMN TargetsOne of the problems facing Indonesia’s energy sector is the absence of appropriate indicators. The IAEA guidelines for energy indicators (2005) state that indicators should be able to guide policymaking and strategic decisions for the strategic application of policy pressure and initiation of changes to achieve desired results. Furthermore, indicators should clearly link across sectors in order to achieve the thorough understanding of interrelationships between economic activities to determine the effects of various economic, social and environmental scenarios and their impact on energy production and use.
Furthermore, the IAEA guidelines stipulate:
“The indicators are not merely data; rather, they extend beyond basic statistics to provide a deeper understanding of the main issues and to highlight important relations that are not evident using basic statistics. They are essential tools for communicating energy issues related to sustainable development to policymakers and to the public, and for promoting institutional dialogue. Each set of indicators expresses aspects or consequences of the production and use of energy. Taken together, the indicators give a clear picture of the whole system, including inter-linkages and trade-offs among various dimensions of sustainable development, as well as the longer-term implications of current decisions and behavior.”
The KPIs currently used in Indonesia’s energy sector exhibit several deficiencies, such as lack of coherence, misrepresentation and lack of clarity on the major energy priority areas. The absence of linkages between energy sector policies and other development goals prevents policies from being targeted more specifically. The indicators also fail to show the critical areas where the public has the most opportunity to provide input. RPJMN as an integrated national plan should encourage application of more comprehensive KPIs.
The following matrix maps out the relationship between key policy direction, the role of the energy sector, and proposed macro KPIs related to energy.
RPJMN Policy Direction
RPJMN Technocratic
Linkages with Energy Proposed Macro KPI
1. Improving the quality of human resources and equitable welfare of society
Electrification ratio targeted at between 95.9% and 100% by end of 2019
Modern energy services contribute to human development by enabling fulfillment of basic needs, such as for food, running water, lighting, heat/cooking energy resources, communication, education and public health. IEA’s Energy Development Index (EDI), mirrors UNDP’s Human Development Index (HDI), to represent energy’s role in human development.
• Per capita commercial energy consumption.
• Share of commercial energy in total final energy use.
• Share of population with access to electricity.
• Share of household income spent on fuel and electricity.
2. Enhance sustain-able and inclu-sive economic growth
The draft RP-JMN includes an energy intensity target of 517 BOE/IDR billion and energy elasticity of 0.8.
Energy plays an important role in driving development of Indonesia’s economy through industry, commodity processing, transporting goods and establishment of modern agriculture systems. In Indonesia’s economic system, which is heavily industry driven, energy contributes more to the economy than capital. When combined with labor and capital, the contribution is bigger than total factor productivity.
• Energy elasticity: ratio between the growth of primary energy con-sumption and the rate of economic growth over the past 10 years
• Energy intensity: ratio between total primary energy consumption and Gross Domestic Product (GDP). This can be broken down into particular sector intensity,

ENERGY SECTOR WHITE PAPER
67
SUSTAINABLE INFRASTRUCTURE ASSISTANCE PROGRAM: TECHNICAL ASSISTANCE FOR ENERGY RPJMN 2015-2019
RPJMN Policy Direction
RPJMN Technocratic
Linkages with Energy Proposed Macro KPI
3. Evenly balance regional development
The uneven spread of energy resources in Indonesia creates development imbalances across regions. Even resource rich regions struggle with electricity supplies as the main input for industrial activities. Better distribution of energy, including through inter-island electricity connections, could enhance availability of energy across regions, thus narrowing development gaps.
• Energy availability (BOE) per region• Electricity system capacity (MW) per
region• Energy use per capita
4. Improve quality of environment, disaster and climate change mitigation
Energy subsidy at 0.6% of the state budget in 2013 and GHG reduction by 26%
Because every development activity, including production, distribution and consumption of energy, has a negative impact on the environment, energy supply must be efficient and its use appropriate to achieve sustainability. Cleaner energy systems, low-carbon technology innovations, and new energy technologies will play critical roles in meeting energy demand in a sustainable way.
• Energy mix• Energy price• Green House Gas (GHG) emissions
from energy production and use per capita and per unit of GDP
5. Preparation of strong foundation for development
Similar to role of economic development (point 2) with additional emphasis on energy security to ensure that there will be no disruption of energy supply.
• Reserves to production ratio• Energy dependency (ratio between
import and domestic energy)• Energy price
6. Acceleration of infrastructre development for growth and equity
Similar to economic, human resource, and social aspect development (point 2)
n/a
7. Improving the management and value addition for natural resources sustainably
Installed capacity of 92.9 GW
Availability of energy, particularly in the form of electricity, is a prerequisite to improving the value added of natural resources through processingraw material into finished products.
• Electricity system capacity (MW)
Source: RPJMN Technocratic Draft, Bappenas August 2014
4.3 Summary of Recommendations and Outcome KPIsThe basis for a solution action plan has been identified through the analysis set out in Chapter 3. The following table categorizes possible solutions as having short, medium or long-term impact, and suggests detailed KPIs to track the success of implementation.

ENERGY SECTOR WHITE PAPER
68
SUSTAINABLE INFRASTRUCTURE ASSISTANCE PROGRAM: TECHNICAL ASSISTANCE FOR ENERGY RPJMN 2015-2019
Priority AreaActions with Short Term
ResultsKPI
Actions with Me-dium Term Results
KPI
Actions with Long
Term Results
KPI
Diversifying and expanding supply of fossil fuel energy
Increase oil and gas geoseismic surveying, including in offshore and deepsea areas
Reserve (mmboe)
Improved incentives for secondary/ter-tiary recovery
Production (mbpd for oil, mmscf for gas)
Enhance exploration efforts of CBM
Gas Reserve (mmscf)
Reform awarding and extension of PSCs and blocks
Number of PSCs and processing time (days)
Expand supply of gas for domestic use
Capacity (mmscf)
Incentivize exploration of Shale Gas
Gas Reserve (mmscf)
Accelerate development of coal transport infrastructure
Capacity (tons/year)
Accelerate develop-ment of mine-mouth power plants
Capacity (MW)
Upgrade brown coal
Capacity (tons)
Scaling up renewable energy development
Operationalize Geothermal Fund
Number of explorations funded and disbursement (IDR)
Reform geothermal tender process
Capacity tendered (MW)
n/a n/a
Debottleneck existing geothermal WKPs
Number of projects that reach exploration stage
Use existing and identify new fund-ing sources for geo-thermal brownfield development
Capacity (MW)
n/a n/a
Speed up execution of hydropower projects under development
Capacity (MW)
Pursue rooftop solar PV
Capacity (MW)
n/a n/a
Integrate energy planning into river basin management
Planned capacity (MW)
Encourage waste to energy generation
Capacity (MW)
n/a n/a
Create conducive environment for developing small hydro power facilities
Private investment (IDR)
n/a n/a n/a n/a
Improve tender mechanism for solar hybrid IPPs
Capacity tendered (MW)
n/a n/a n/a n/a

ENERGY SECTOR WHITE PAPER
69
SUSTAINABLE INFRASTRUCTURE ASSISTANCE PROGRAM: TECHNICAL ASSISTANCE FOR ENERGY RPJMN 2015-2019
Priority AreaActions with Short Term
ResultsKPI
Actions with Me-dium Term Results
KPI
Actions with Long
Term Results
KPI
Expanding downstream energy infrastructure
Forward placement of oil as EBR
Capacity (days of import equivalent)
Develop operational reserve and EBR
Capac-ity (days of import equivalent)
n/a n/a
Upgrade existing refineries and integrate oil distribution network
Capacity (bpd)
Develop gas pipe-line and distribution network
Capac-ity (mmscf) and length (km)
n/a n/a
Leverage limited opportunities to utilize CNG for transport
Volume (mmscfd)
Accelerate develop-ment of intercon-nection networks across islands
Capac-ity (kVA) and length (kmc)
n/a n/a
Develop small scale LNG transport and power infrastructure
Capacity (mmscf) and power produced (MWh)
n/a n/a n/a n/a
Scaling Up Energy Access in Rural and Remote Areas
Develop and implement least cost electrification plan
Electrification ratio (%)
n/a n/a n/a n/a
Redefine institutions for electrification plan implementation
Electrification ratio (%)
n/a n/a n/a n/a
Investing in Energy Efficiency
Develop comprehensive energy efficiency management action plan
Availability of plan
Empower and incentivize local governments to implement and enforce energy ef-ficiency plan
Reduction in energy intensity (%)
n/a n/a
Provide financing and incentives for energy efficiency initiatives
Amount (IDR)
Define and imple-ment minimum energy efficiency standards.
Reduction in energy use (%)
n/a n/a
Implement energy efficiency labeling program
Percentage of labeled items (%)
Build capacity to comply with energy efficiency measures
Number of ESCOs and compliance to energy efficiency regulations (%)
n/a n/a
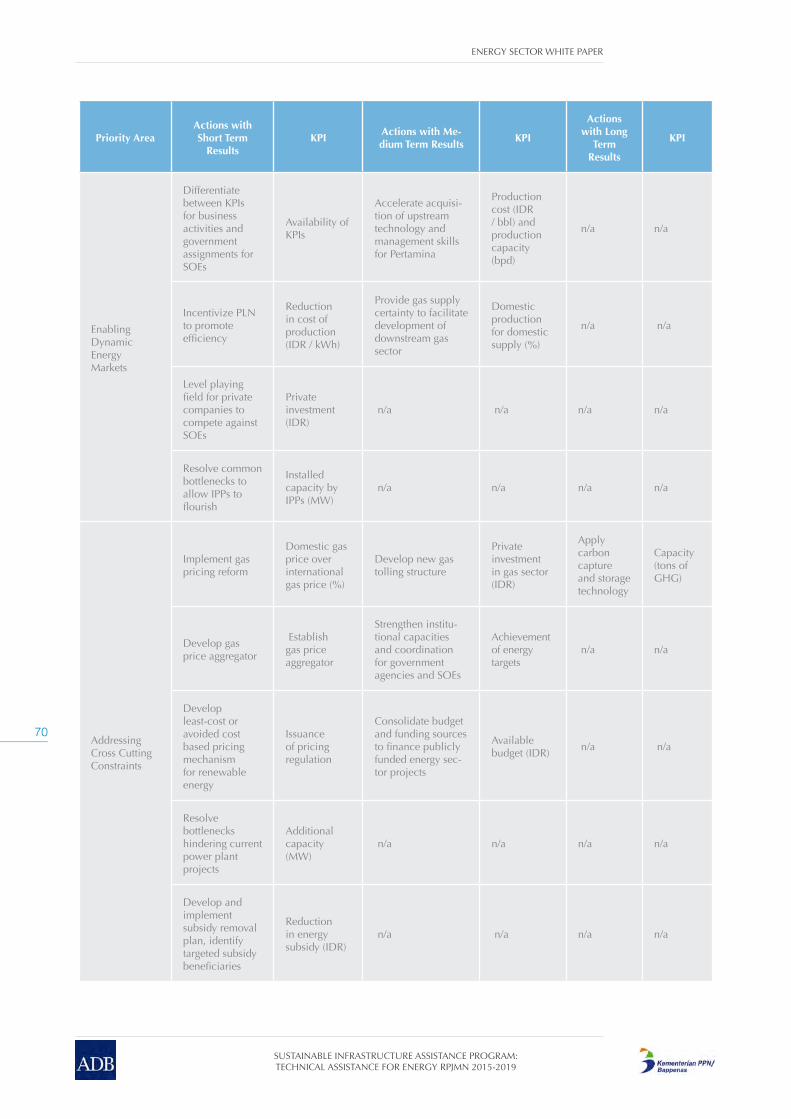
ENERGY SECTOR WHITE PAPER
70
SUSTAINABLE INFRASTRUCTURE ASSISTANCE PROGRAM: TECHNICAL ASSISTANCE FOR ENERGY RPJMN 2015-2019
Priority AreaActions with Short Term
ResultsKPI
Actions with Me-dium Term Results
KPI
Actions with Long
Term Results
KPI
Enabling Dynamic Energy Markets
Differentiate between KPIs for business activities and government assignments for SOEs
Availability of KPIs
Accelerate acquisi-tion of upstream technology and management skills for Pertamina
Production cost (IDR / bbl) and production capacity (bpd)
n/a n/a
Incentivize PLN to promote efficiency
Reduction in cost of production (IDR / kWh)
Provide gas supply certainty to facilitate development of downstream gas sector
Domestic production for domestic supply (%)
n/a n/a
Level playing field for private companies to compete against SOEs
Private investment (IDR)
n/a n/a n/a n/a
Resolve common bottlenecks to allow IPPs to flourish
Installed capacity by IPPs (MW)
n/a n/a n/a n/a
Addressing Cross Cutting Constraints
Implement gas pricing reform
Domestic gas price over international gas price (%)
Develop new gas tolling structure
Private investment in gas sector (IDR)
Apply carbon capture and storage technology
Capacity (tons of GHG)
Develop gas price aggregator
Establish gas price aggregator
Strengthen institu-tional capacities and coordination for government agencies and SOEs
Achievement of energy targets
n/a n/a
Develop least-cost or avoided cost based pricing mechanism for renewable energy
Issuance of pricing regulation
Consolidate budget and funding sources to finance publicly funded energy sec-tor projects
Available budget (IDR)
n/a n/a
Resolve bottlenecks hindering current power plant projects
Additional capacity (MW)
n/a n/a n/a n/a
Develop and implement subsidy removal plan, identify targeted subsidy beneficiaries
Reduction in energy subsidy (IDR)
n/a n/a n/a n/a

ENERGY SECTOR WHITE PAPER
71
SUSTAINABLE INFRASTRUCTURE ASSISTANCE PROGRAM: TECHNICAL ASSISTANCE FOR ENERGY RPJMN 2015-2019
Priority AreaActions with Short Term
ResultsKPI
Actions with Me-dium Term Results
KPI
Actions with Long
Term Results
KPI
Addressing Cross Cutting Constraints
Manage energy sector data under specialized institution
Reduction of time lag for issuance of accurate energy sector data
n/a n/a n/a n/a
Integrate overall energy sector planning
Reduction in number of energy sector plans
n/a n/a n/a n/a
Develop and implement environmental safeguards
Number of projects adopting environmental safeguards
n/a n/a n/a n/a
Utilize domestic and international funds to implement NAMAs
Reduction in GHG (tons)
n/a n/a n/a n/a

ENERGY SECTOR WHITE PAPER
72
SUSTAINABLE INFRASTRUCTURE ASSISTANCE PROGRAM: TECHNICAL ASSISTANCE FOR ENERGY RPJMN 2015-2019
Annex: Key Sources of Data and Information used for this study
Primary References:• Policy and Statistical Information from Bappenas, MEMR, CMEA, M.o.Forestry,
M.o.Environment, REDD, ICCTF, RAN-GRK, Regional Governments, National Energy Board (DEN).
• Existing documents and analysis from relevant stakeholders in the energy sector, including SOEs; PGN, PLN, Pertamina, PSCs, IPPs, Captive Power markets, NGOs.
• Annual reports, publications, data, papers, including research done by BPPT, and the Energy Statistical Agency managed by the MEMR.
• International reports from OECD, World Bank, ADB, IEA, APEC, UNDP, UN, DFID, JICA, GFW, and comparator countries, including drafts of work-in-progress from projects currently underway.
Bibliography• Aecom (2011), Geothermal Fund Report, published by ADB• Aldi Hutagalung, (November 2011), Regulatory Reform In the Indonesian Natural
Gas Market• APEC Energy Overview, (2012), Indonesia• Asian Development Bank (September 2013), Potential of Carbon Capture and
Storage in South East Asia• Asian Development Bank (September 2013) Prospects for Carbon Capture and
Storage in South East Asia• Asian Development Bank (October 2013), Energy Outlook for Asia and the Pacific• Asian Development Bank, (2014), Wave Energy Conversion and Ocean Thermal
Energy Conversion Potential in Developing Member Countries• Badan Geologi Indonesia (May 7th 2013) Unconventional Oil and Gas Potential
in Indonesia with Special Attention to Shale Gas and Coal Bed Methane• Bank Mandiri (2011), Energy Security Challenges In Indonesia• Bappenas, (2013), Pedoman Umum, Pemantauan, Evaluasi, dan Pelaporan
Pelaksanaan RAN-GRK dan RAD-GRK• BBC UK (2008) Indonesia to Withdraw from OPEC. Source: http://news.bbc.
co.uk/2/hi/business/7423008.stm(taken on May 13th, 2014)• Bloomberg, (2012), Global Trends in Renewable Energy Investment• BP, (June 2013), Statistical Review of World Energy• BPPT, (2006), Indonesia 2005-2025 BukuPutih• BPPT, (2012), Perencanaan Efisiensidan Elastisitas Energi• BPPT, (2013), Indonesia Energy Outlook • Castlerock Consulting, Phase 1 Report, Review and Analysis of Prevailing
Geothermal Policies, Regulations and Costs, December 2010, Report to MEMR.• CBM Asia Development Corp, (March 2013), Indonesian Coalbed Methane• Center for Energy Studies, Rice University, (December 2013), The Geopolitics of
Natural Gas• Christopher Joshi Hansen, Linacre College, Oxford University, (2008), A bottom-

ENERGY SECTOR WHITE PAPER
73
SUSTAINABLE INFRASTRUCTURE ASSISTANCE PROGRAM: TECHNICAL ASSISTANCE FOR ENERGY RPJMN 2015-2019
up Model of Electricity Reform for Developing Countries: A Case Study of Gujarat, India
• Danish Maritime Authority (April 2012) North European LNG Infrastructure Project: A feasibility study for an LNG filling station infrastructure and test for recommendations. Co-financed by the European Union under Trans-European Transport Network (TEN-T)
• Danish Maritime Authority, (2011), A Feasibility Study For an LNG Filling Station Infrastructure
• David Nelson and Brendan Pierpoint, Climate Policy Initiative, (March 2013), The Challenge of Institutional Investment in Renewable Energy
• Departemen Energi dan Sumber Daya Mineral, (2003), Pedomandan Pola Tetap Kebijakan Pemanfaatan Gas Bumi Nasional 2004-2020
• Department of Communication, Energy & Natural Resources Ireland, (2012), Ireland’s Second National Energy Efficiency Action Plan to 2020
• Detik Finance (February 23rd, 2014) RI Masih Punya Potentsi Cadangan Minyak Baru 43.7 Milliar Barel. Source:http://finance.detik.com/read/2014/02/23/133920/2505878/1034/ri-masih-punya-potensi-cadangan-minyak-baru-437-miliar-barel (taken on May 16th 2014)
• Directorate General of Mineral and Coal, (March 2014), Some Aspects of National Coal Policy
• Direktorat Jenderal Energi Baru Terbarukandan Konservasi Energi, (Januari 2013), Laporan Akuntabilitas Kinerja Instansi Pemerintah (LAKIP)
• Direktorat Jenderal Energi Baru Terbarukan dan Konservasi Energi, (November 2012), Kebijakandan Program Konservasi Energi
• DNV, (2011), Opportunities and Risks of Small Scale LNG Development in Indonesia
• Dr. Balarama, (2013), USAID , Wind Power Evacuation - Indonesia Wind Sector Impact Assessment
• Dr. Dadan Kusdiana, (2010), Directorate General of New Renewable Energy and Energy Conservation, Bioenergy Policies Needed and Implementation Target
• Egil Rensvik, (2013), Experience From Norwegian Small Scale LNG Use and Distribution
• Food and Agriculture Organization for the United Nations (2013) Climate Change Guidelines for Forest Managers
• Food and Agriculture Organization for the United Nations (2014) State of the World’s Forests: Enhancing socioeconomic benefits from the forests
• GIZ, (2013), Smart Street Lighting Initiative (SSLI) Name - Overview• Hadi Purnomo, (March 2014), DEN, National Energy Policy (Energy Security) • Hanan Nugroho, June (2004), Increasing the Share of Natural Gas In National
Industry and Energy Consumption: Infrastructure Development Plan• Hivos Indonesia, (February 2012), Small Wind Power Development Opportunity
in Indonesia• IAEA, (2005), Energy Indicators for Sustainable Development: Guidelines and
Methodologies• IndII, (December 2013), Gas Development Master Plan Indonesia, Benchmarking
Report• IndII/World Bank - Petroleum Development Consultants (October 10th, 2013)
Gas Development Master Plan; Technical Committee Presentation, Draft Policy Note 8 - Regulation of Consumer Prices.
• Indonesia Climate Change Trust Fund, January 2013, ICCTF Progress Report 2010-2012
• Indonesia Infrastructure Initiative, World Bank, PDC (2013) Gas Development Master Plan Indonesia. Draft Policy Note 5: Framework for Gas Infrastructure

ENERGY SECTOR WHITE PAPER
74
SUSTAINABLE INFRASTRUCTURE ASSISTANCE PROGRAM: TECHNICAL ASSISTANCE FOR ENERGY RPJMN 2015-2019
Development; Draft version 22nd March 2013• International Energy Agency (2008), Energy Policy Review of Indonesia• International Energy Agency (September 2013), Southeast Asia Energy Outlook• International Energy Agency, (2013), Renewable Energy Outlook• International Energy Agency, (2012), Anuschka Hilke, Economic Instruments For
Low- Energy Buildings• International Energy Agency, (2013), CO2 Emissions From Fuel Combustion• International Energy Agency, (2013), Coal Information• International Energy Agency, (2013), Electricity Information• International Energy Agency, (2013), Energy Efficiency, Market Trends and
Medium Term Prospects• International Energy Agency, (2013), Energy Policy Highlights• International Energy Agency, (2013), Energy Prices and Taxes• International Energy Agency, (2013), Energy Statistic of OECD Countries• International Energy Agency, (2013), Energy Technology Initiatives, Implementation
through Multilateral Co-Operation• International Energy Agency, (2013), Natural Gas Information• International Energy Agency, (2013), Oil Information• International Energy Agency, (2013), Renewable Information• International Energy Agency, (2013), Secure and Efficient Electricity Supply,
During The Transition Low Carbon Power Systems• International Energy Agency, (2013), Transition to Sustainable Buildings• International Energy Agency, (2014), Technology Roadmap, Energy Storage• International Institute For Sustainable Development, (2012), A Citizens’ Guide To
Energy Subsidies In Indonesia• International Renewable Energy Agency (June 2012), Hydropower• Jarman, (2012), Directorate General of Electricity, Indonesia Electricity
Infrastructure Development• Jarman, (December 2012), Direktur Jenderal Ketenagalistrikan, Rencana Aksi
Pemerintah Untuk Mewujudkan Energi Yang Berkelanjutan Untuk Semua• JICA, (September 2007), Master plan for Geothermal Development in Indonesia• Kementerian Energi dan Sumber Daya Mineral (2011) Cadangan Shale Gas
Indonesia Teridentifikasi. Source: http://www.esdm.go.id/berita/40-migas/4215-cadangan-shale-gas-indonesia-teridentifikasi-di-4-wilayah.html(taken on May 9th, 2014)
• Kementerian Energi dan Sumber Daya Mineral (2011) Peta Cadangan Gas Bumi 2011
• Kementerian Energi dan Sumber Daya Mineral (2011) Peta Cadangan Minyak Bumi 2011
• Kementerian Energi dan Sumber Daya Mineral (2012) Keputusan Menteri Energi dan Sumber Daya Mineral Nomor: 2700 K/11/MEM/2012
• Kementerian Energi dan Sumber Daya Mineral, (2010), Rencana Strategis Kementerian Energidan Sumber Daya Mineral
• LNG Shipping News (September 2013), CNG Ship Piloted In Indonesia• M. Taufik Afianto (2012) Small Scale LNG, The Best Suited for Indonesia’s
Archipelagos• Maritje Hutapea, (March 2014) Directorate of Energy Conservation, Policies on
Energy Efficiency and Conservation in Indonesia• McKinsey & Company (April 2014), The Disruptive Potential of Solar Power• McKinsey & Company (January 2012), Mobilizing For a Resource Revolution• McKinsey & Company (March 2014), Are You Ready for The Resource Revolution• Ministry of Energy Mineral Resources, (2011), Investment Opportunities EMR

ENERGY SECTOR WHITE PAPER
75
SUSTAINABLE INFRASTRUCTURE ASSISTANCE PROGRAM: TECHNICAL ASSISTANCE FOR ENERGY RPJMN 2015-2019
Sector• Ministry of Energy Mineral Resources, (2006) Blue Print Pengelolaan Energi
Nasional 2006-2025• Ministry of Energy Mineral Resources, (March 2014) Energy Policy Planning• Ministry of Energy Mineral Resources, (March 2014)The In-depth Review National
Energy Policy• Mr. Pandu P. Sjahrir, (2012), Issues to Energy Policy In Coal & Power Sector• Nico Muhyiddin, (March 2014), Inpex Corporation, Meeting Indonesia’s Future
Energy Needs• OECD, (2013), Effective Carbon Prices• OECD, (2014), How to Guide for Wind Energy, Roadmap Development and
Implementation• OECD, (2014), Indonesia Main Economic Indicators• Ofgem (2014), State of the Market Assessment• P. Meier, J. Randle, and J. Lawless (2014), Unlocking Indonesia’s Geothermal
Potential, prepared for Ministry of Energy and Mineral Resources• Paiton Energy (March 2014), Some Thoughts About The Electricity Sector• Partnership International, Inc. (2013), The Indonesia Geothermal Handbook,
published by Bappenas• Pertamina (2013) Pertamina Annual Report 2013: Towards Global Recognition.• Pertamina (September 10th, 2012) Pertamina’s role and strategy to safeguarding
national’s energy security. Jakarta, delivered by Pertamina Director of Human Resources
• Petroleum Development Consultants (December 2013), Gas Development Master Plan Indonesia, Benchmarking Report
• Petroleum Development Consultants- Petroleum Development Consultants (October 10th, 2013) Gas Development Master Plan; Technical Committee Presentation, Draft Policy Note 8 - Regulation of Consumer Prices.
• Petroleum Development Consultants (2013) Gas Development Master Plan Indonesia: Final Report - 10th December 2013 version.
• Petroleum Development Consultants (31st March 2014) Energy Sector Review Medium Term Development Strategy (2015-2019) Draft Working Paper - Use of CNG in the Transport Sector
• PGN (2013) PGN Annual Report 2013: Expertise• PLN (2013) Feeding Asia’s Next Tiger, Fulfilment of Indonesia Domestic Coal
Demand• PLN, Long Term Investment Plan (RUPTL) 2012 - 2021, Table 5.11.• Poyry, (2010), How Can Small-Scale LNG Help Grow The European Gas Market • Price Waterhouse Coopers (2012) Oil and Gas in Indonesia - Investment and
Taxation Guide 2012.• Poyry Management Consulting (2013) How can small-scale LNG help grow the
European gas market? Poyry Point of View: Being Resource Smart• PT PLN (PricewaterhouseCoopers International Limited) (2011) Electricity in
Indonesia, Investment and Taxation Guide 2011, p. 26.• PUStatin ESDM, (2012), Handbook of Energy & Economic Statistics of Indonesia• PwC, (2013), The Economic Impact of Small Scale LNG• Quoted from Bappenas report• Rida Mulyana, (August 2013), Directorate General for Renewable Energy,
Development of New Renewable Energy and Energy Conservation• Rida Mulyana, March 2014, Directorate General for Renewable Energy, NREEC
Sector Overview

ENERGY SECTOR WHITE PAPER
76
SUSTAINABLE INFRASTRUCTURE ASSISTANCE PROGRAM: TECHNICAL ASSISTANCE FOR ENERGY RPJMN 2015-2019
• SKK Migas (2012) Laporan Tahunan SKK Migas 2012• SKK Migas (2014) Knowing the History of Oil and Gas Business• SKKMIGAS, (2012), Laporan Tahunan• Suara Hijau (2013) Perubahan Iklim 24 Pulau Indonesia Menghilang. Source:
http://suarahijau.wordpress.com/2013/12/24/perubahan-iklim-24-pulau-indonesia-menghilang/, retrieved 10 July 2014
• The Economist Intelligence Unit (2013) Powering Up: Perspectives on Indonesia’s Energy Future.
• The Lantau Group (June 2013) Onshore Small Scale LNG a Way to Market for Stranded Gas - Some Examples in Indonesia. Energy Nusantara LNG Workshop June 2013
• The Lantau Group, (June 2013), Onshore Small Scale LNG a Way to Market for Stranded Gas - Some Examples from Indonesia
• Thornton, P. and Cramer, L. (eds.), (2012), Impacts of climate change on the agricultural and aquatic systems and natural resources within the CGIAR’s mandate, CCAFS Working Paper 23, Copenhagen, Denmark: CGIAR Research Program on Climate Change, Agriculture and Food Security
• Tisnaldi, (March 2014) MEMR Up-Date on Geothermal Energy Development and Utilization in Indonesia
• United Nations REDD, (2013), REDD in Indonesia. Source: http://theredddesk.org/countries/indonesia, retrieved 10 July 2014
• U.S. Energy Information Administration, (February 2013), Thailand• U.S. Energy Information Administration, (March 2014), Indonesia• United States Energy Information Administration (2014) Data on Oil and Gas
Production and Consumption in Indonesia (1980-2013 data). Taken on 22nd April 2014
• WHyPGen, (2013), Blowing the Wind Energy in Indonesia• WHyPGen, (2013), Wind Energy Potential and Development in Indonesia• World Bank, (2011), One Goal Two Paths - Achieving Universal Access To Modern
Energy in East Asia and The Pacific• World Bank, (June 2012), Indonesia Fuel to Power Value Chain Study - Preliminary
Findings• World Bank/IndII - Petroleum Development Consultants (2013) Gas Development
Master Plan Indonesia: Final Report - 10th December 2013 version.• World Bank/IndII - Petroleum Development Consultants (31st March 2014)
Energy Sector Review Medium Term Development Strategy (2015-2019) Draft Working Paper - Use of CNG in the Transport Sector
• World Energy Council, (2013), Energy Sustainability Index• World LNG Report, (2013), International Gas Union


ADB Indonesia Resident MissionGedung BRI II, 7th FloorJl. Jendral Sudirman Kav. 44-46Jakarta 10210, Indonesia