energy management strategies at metropolitan water … · energy management strategies at...
TRANSCRIPT
1
Energy Management Strategies at Metropolitan Water District
Roy L Wolfe, Ph.D.
Japan – U.S. Joint Conference on Drinking Water Quality Management and Wastewater Control
March 2, 2009
California Water and Energy
California is the third-largest state in the U.S. by land area. Its geography is diverse and includes foggy coastal lands, alpine mountain ranges, hot and arid deserts, and a fertile central valley. The Central Valley, one of the most productive farming areas in the world, dominates the central portion of the state. California is the most populous state in the U.S. In 2006, its population exceeded 37 million people and was one of the fastest-growing states.
This large population drives the interlinked demands for water and energy in the state. The water-energy nexus in California is highlighted by the fact that two-thirds of the state’s precipitation occurs in Northern California while two-thirds of the population resides in Southern California. Separating Southern California from the rest of the state is a series of east-west trending traverse mountain ranges, including the Tehachapi. California has made significant investments in conveyance projects to address this north-south water imbalance. Eight large water projects have been constructed since the mid-1930’s to lift and transport water over mountain ranges and across hundreds of miles of land for use in other parts of the state to supply agricultural needs in the Central Valley and the growing metropolitan areas of Los Angeles and San Diego.
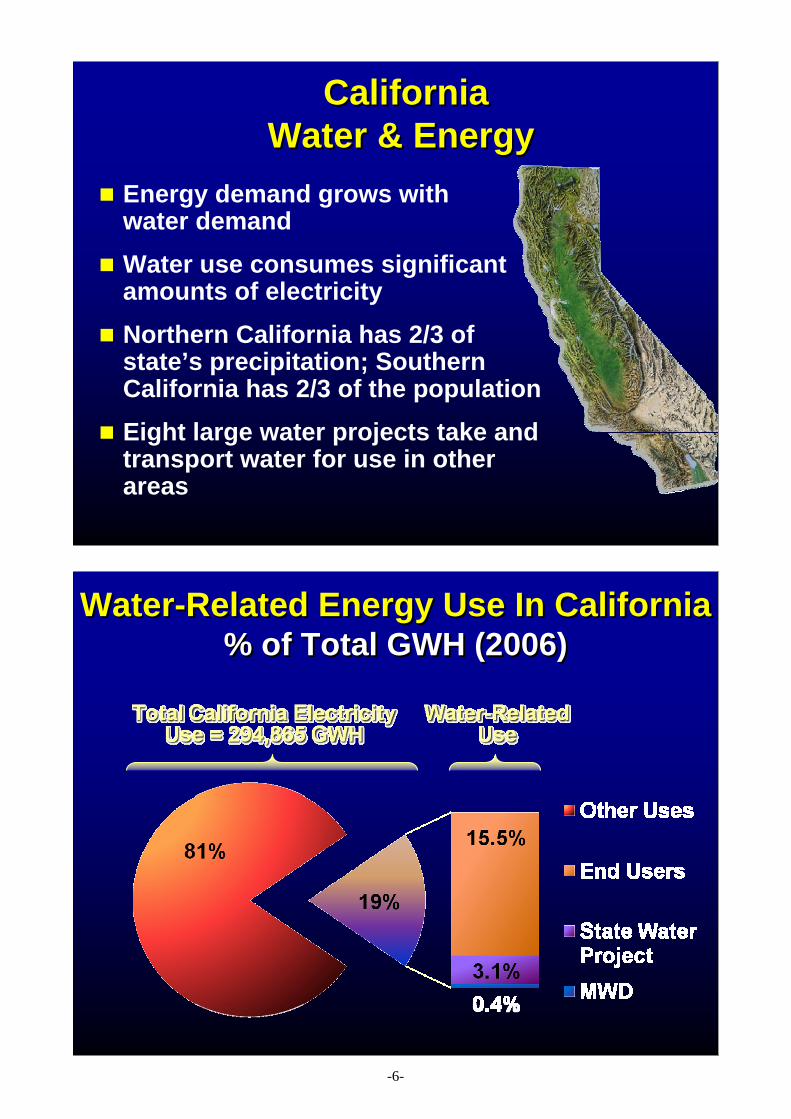
The movement of water on this scale requires considerable energy resources. The California Energy Commission (CEC) estimates that water-related energy use consumes 19% of the state’s electricity and 30% of its natural gas usage every year, and demand is growing. Although lifting water over mountain ranges requires a significant amount of pumping energy, CEC’s analysis indicates that over 73% of water-related electricity consumption occurs with the end user in the residential, commercial and agricultural sectors.
Electricity consumed in California is generated by a mix of energy resources. More than 60% of California’s electricity is generated by greenhouse gas-producing natural gas and coal, and less than 12% is generated from renewable resources. Electricity generation contributes 23% of California’s greenhouse gas emissions. In 2006, California enacted Assembly Bill 32 to reduce greenhouse gas emissions in the state. AB 32 requires a state-wide reduction of greenhouse gas emissions to 1990 levels by 2020.
Energy Management at Water Agencies
Energy management is a critical concern to water agencies due to rising cost, increasing energy demands of advanced water treatment technologies and the need to address greenhouse gas emissions. From 1996 to 2005, California experienced an average retail electrical rate increase of 3%. This rate is expected to range from 5 to 20% by 2013 as a result of increased integration of renewable energy supplies.
Water agencies face increased energy consumption by new water treatment technologies. Advanced treatment techniques are implemented to meet increasingly stringent water quality requirements. Ultraviolet disinfection, advanced filtration and ozonation are added to or replace conventional treatment technology. Increased
-1-
2
electricity needs require greater levels of reliable electricity delivery systems. These issues drive water agencies to manage energy use to reduce costs and maintain reliable water quality compliance.
Metropolitan Water District
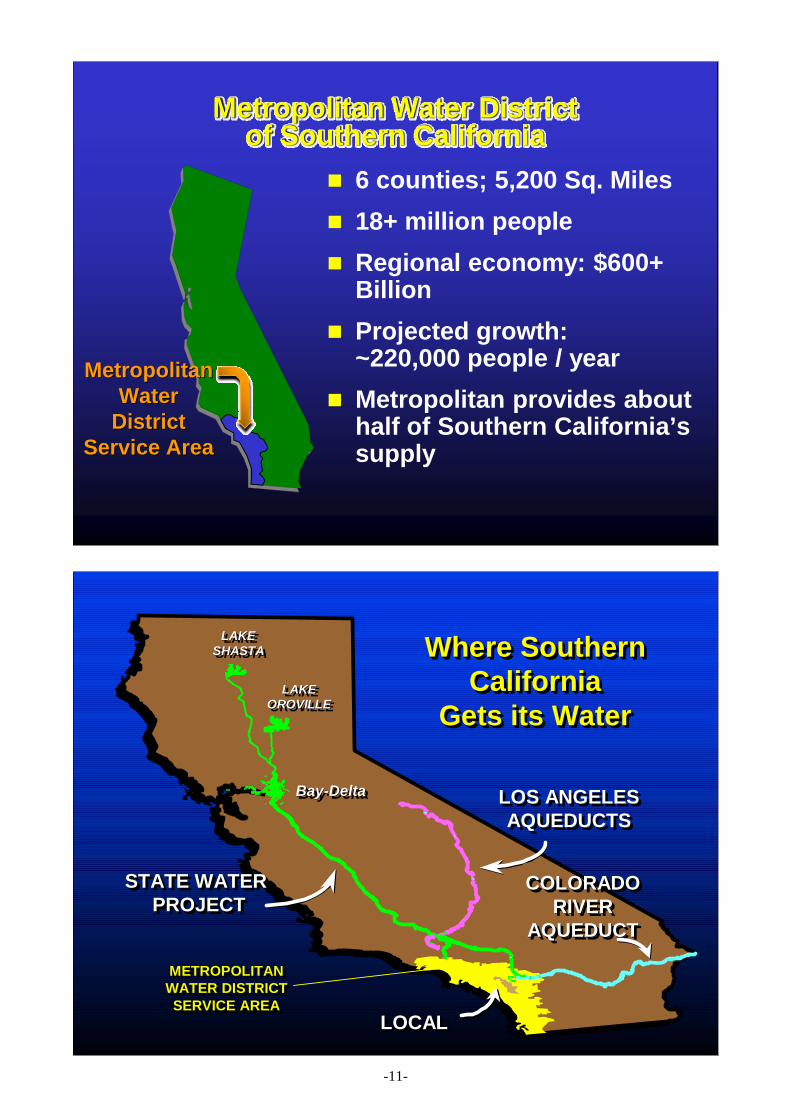
Metropolitan Water District (MWD) is a public agency charged with providing its service area with adequate and sufficient supplies of high quality water. MWD was incorporated in 1928 by an Act of the California Legislature to serve its 13 original founding Member Agencies. Today, MWD provides water to 26 cities and water agencies serving more than 18 million people in six counties. On average Metropolitan delivers 1.9 billion gallons of water per day.
MWD imports water to its service area through two significant conveyance projects. The Colorado River Aqueduct (CRA), a 242-mile system of canals, tunnels, and buried conduits driven by five pumping plants, is owned and operated by MWD and is capable of delivering 1.3 million acre feet of water a year from Lake Havasu on the Colorado River. MWD also imports water from Northern California as a contractor on California’s State Water Project (SWP) a massive system of 17 pumping plants, 29 dams and reservoirs, 8 hydroelectric plants and 675 miles of aqueducts, tunnels and pipelines. During normal water supply years, the CRA supplies about 36% of Southern California’s needs and the SWP supplies about 19%. The balance of Southern California’s water needs are met by local water supplies.
MWD’s water treatment and distribution system consists of five water treatment plants with a combined treated water capacity of 2,580 million gallons per day, 775 miles of distribution pipelines, more than 400 water connections to member agencies, 16 hydroelectric power plants, and numerous water storage reservoirs and support facilities.
Energy Management Program
MWD initiated its Energy Management Program to ensure its facilities are designed, constructed and operated in an energy-efficient, cost-effective and sustainable manner. Four strategies were developed to achieve this goal: reduce greenhouse gas emissions, improve energy efficiency and energy conservation, manage power resources in a cost-effective manner, and implement cost-effective renewable energy projects.
MWD has inventoried its greenhouse gas emissions and reported this information to the California Climate Action Registry. Approximately 95% of MWD’s emissions are indirect and result from electricity purchased to operate its facilities. The remainder of emissions comes from mobile sources and stationary combustion equipment. MWD is reducing direct emissions by increasing the percentage of fuel-efficient hybrid vehicles in its fleet and increasing the efficiency of gas-fired equipment. MWD is also reducing indirect emissions by improving efficiency, promoting energy conservation and installing renewable energy systems.
Renewable Energy Technologies
MWD is pursuing cost-effective renewable energy projects to reduce purchased electricity required to operate its facilities. MWD has a long history of hydroelectric energy generation and currently operates 16 hydro plants along its distribution system. With a combined installed capacity of 140 MW, MWD generated 523,000 MWh of non-polluting, greenhouse gas emission-free energy and netted revenues of $26 million in 2006. Engineering staff is currently assessing the feasibility to expand total generation capacity.
-2-
3
Solar PV projects are also in progress at MWD facilities. The first, a 1-MW capacity project, is in construction at a water treatment plant. When completed in April 2009, this plant will satisfy approximately ½ of the current demand and supply almost 25% of annual electricity consumption. Studies are underway for an additional 10-MW of solar PV capacity to be brought on-line during the next four years. These projects will be located at MWD facilities and may utilize alternate acquisition methods such as power purchase agreements.
While MWD fully supports the development of renewable energy projects to meet its needs and the greater needs of California, significant obstacles exist. One considerable obstacle is cost. Renewable energy remains more expensive than fossil fuel alternatives. This pricing condition will realign as renewable energy technologies become more cost-effective and carbon-based energy alternatives are priced according to their climate change and environmental impacts. Cost also plays a big part in the required upgrade and construction of transmission systems to carry renewable energy from remote locations to densely populated urban areas. In addition, certain renewable energy technologies such as solar PV and wind are inherently intermittent and variable. These systems require additional flexible energy resources in order to maintain reliable electricity grid operation.
MWD, like other water agencies, is faced with greater electricity demands for higher cost energy supplies. We intend to continue our energy management strategies and broaden them where possible to continue energy efficiency and conservation activities and implement cost-effective renewable energy projects. MWD is also developing a greenhouse gas reduction policy proposal for consideration and adoption by its Board of Directors. The policy, if adopted, would define emission reduction targets on a short-term and long-term basis.
-3-
Energy Management Energy Management StrategiesStrategiesatat
Metropolitan Water DistrictMetropolitan Water District
Japan – U.S. Joint Conference on Drinking Water Quality Management and Wastewater Control
March 2, 2009
Roy L Wolfe, Ph.D.
TopicsTopics
California Water & EnergyEnergy Management at Water AgenciesMetropolitan Water DistrictEnergy Management ProgramNext Steps
-4-
California2006
California2006
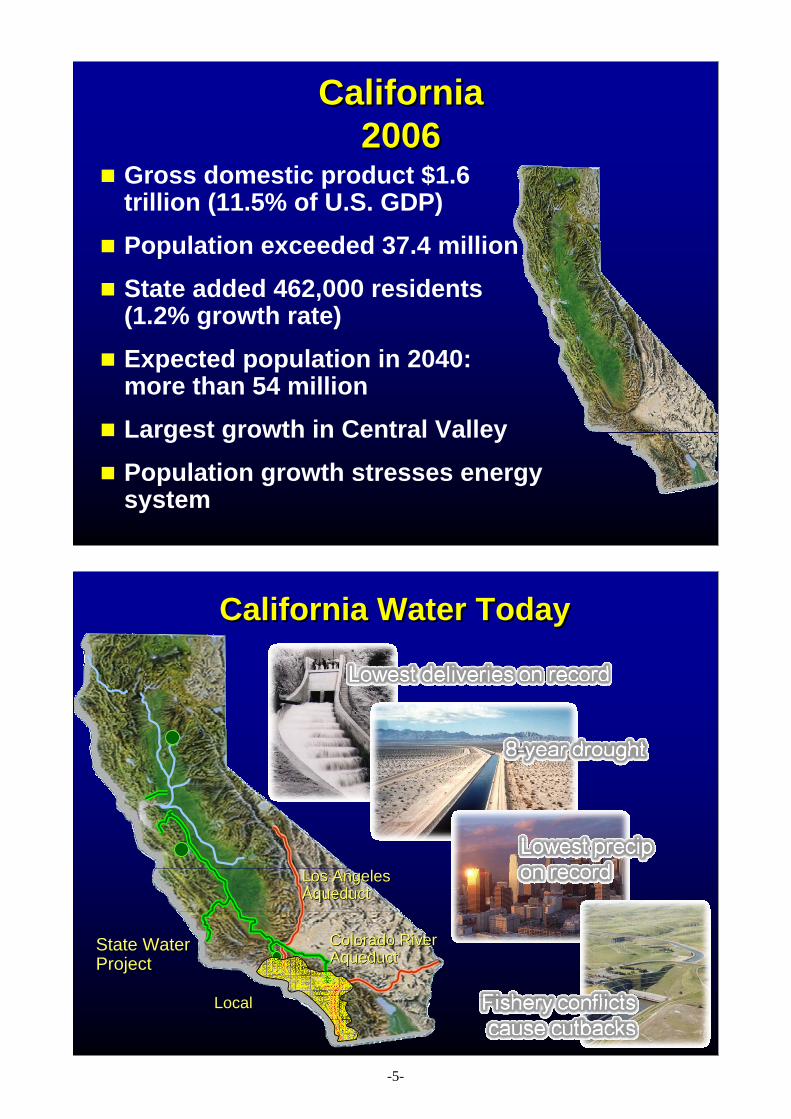
Gross domestic product $1.6 trillion (11.5% of U.S. GDP)Population exceeded 37.4 millionState added 462,000 residents (1.2% growth rate)Expected population in 2040: more than 54 millionLargest growth in Central ValleyPopulation growth stresses energy system
California Water TodayCalifornia Water Today
Los Angeles Los Angeles AqueductAqueduct
Colorado RiverColorado RiverAqueductAqueduct
State Water State Water ProjectProject
LocalLocal
-5-
CaliforniaWater & Energy
CaliforniaWater & Energy
Energy demand grows with water demandWater use consumes significant amounts of electricityNorthern California has 2/3 of state’s precipitation; Southern California has 2/3 of the populationEight large water projects take and transport water for use in other areas
Water-Related Energy Use In California% of Total GWH (2006)
Water-Related Energy Use In California% of Total GWH (2006)
-6-
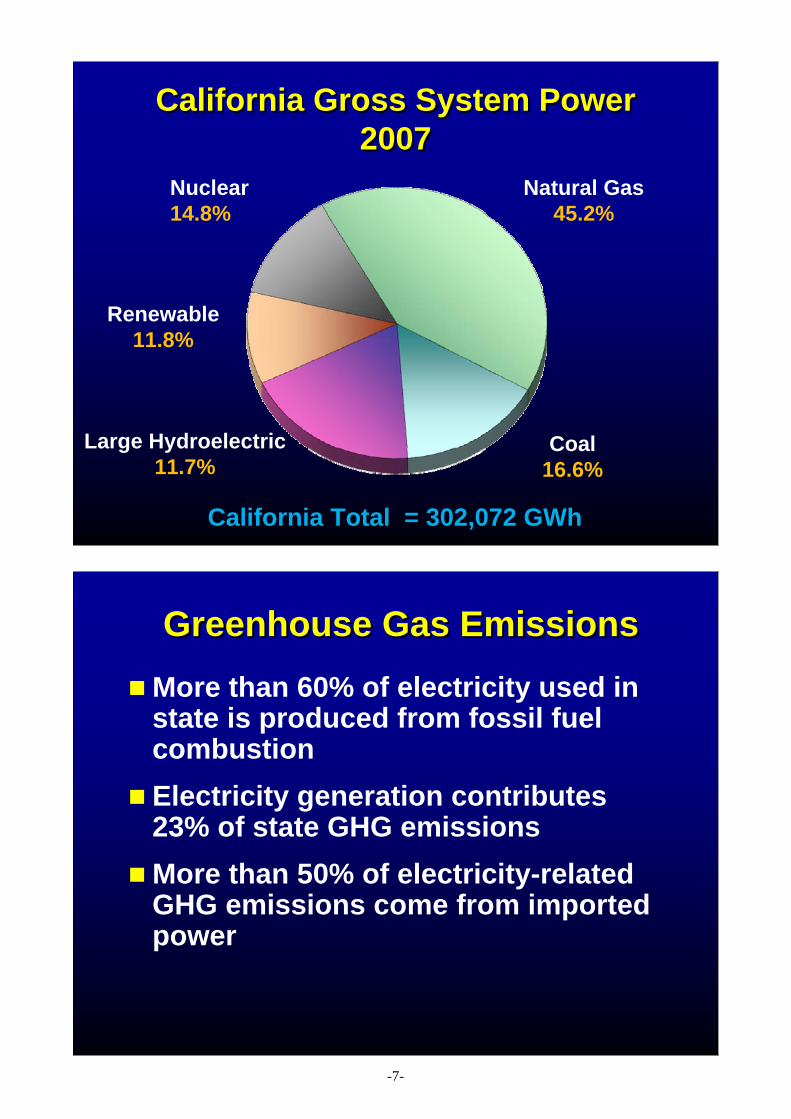
California Gross System Power 2007
California Gross System Power 2007
Nuclear14.8%
Natural Gas45.2%
Coal16.6%
Large Hydroelectric11.7%
Renewable11.8%
California Total = California Total = 302,072 302,072 GWhGWh
Greenhouse Gas EmissionsGreenhouse Gas EmissionsMore than 60% of electricity used in state is produced from fossil fuel combustionElectricity generation contributes 23% of state GHG emissionsMore than 50% of electricity-related GHG emissions come from imported power
-7-
California’s Initiative to Reduce Greenhouse Gas Emissions
AB 32
California’s Initiative to Reduce Greenhouse Gas Emissions
AB 32
Reduce state-wide greenhouse gas emissions
to 1990 levels by 2020
Energy Management Importance to Water Agencies
Energy Management Importance to Water Agencies
CostEnergy intensive water treatment technologiesGreenhouse gas emissions related to energy generation
-8-
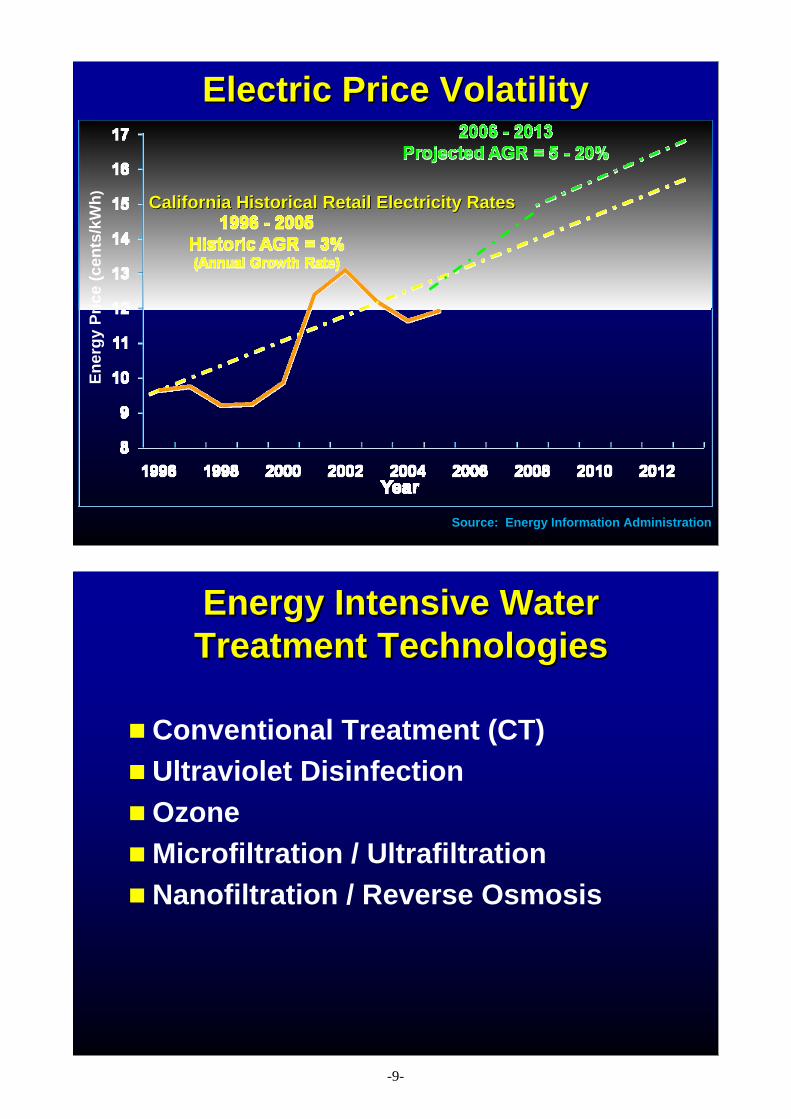
Electric Price Volatility Electric Price Volatility
Source: Energy Information AdministrationSource: Energy Information Administration
California Historical Retail Electricity RatesCalifornia Historical Retail Electricity Rates
Ener
gy P
rice
(cen
ts/k
Wh)
Energy Intensive Water Treatment TechnologiesEnergy Intensive Water Treatment Technologies
Conventional Treatment (CT)Ultraviolet DisinfectionOzoneMicrofiltration / UltrafiltrationNanofiltration / Reverse Osmosis
-9-
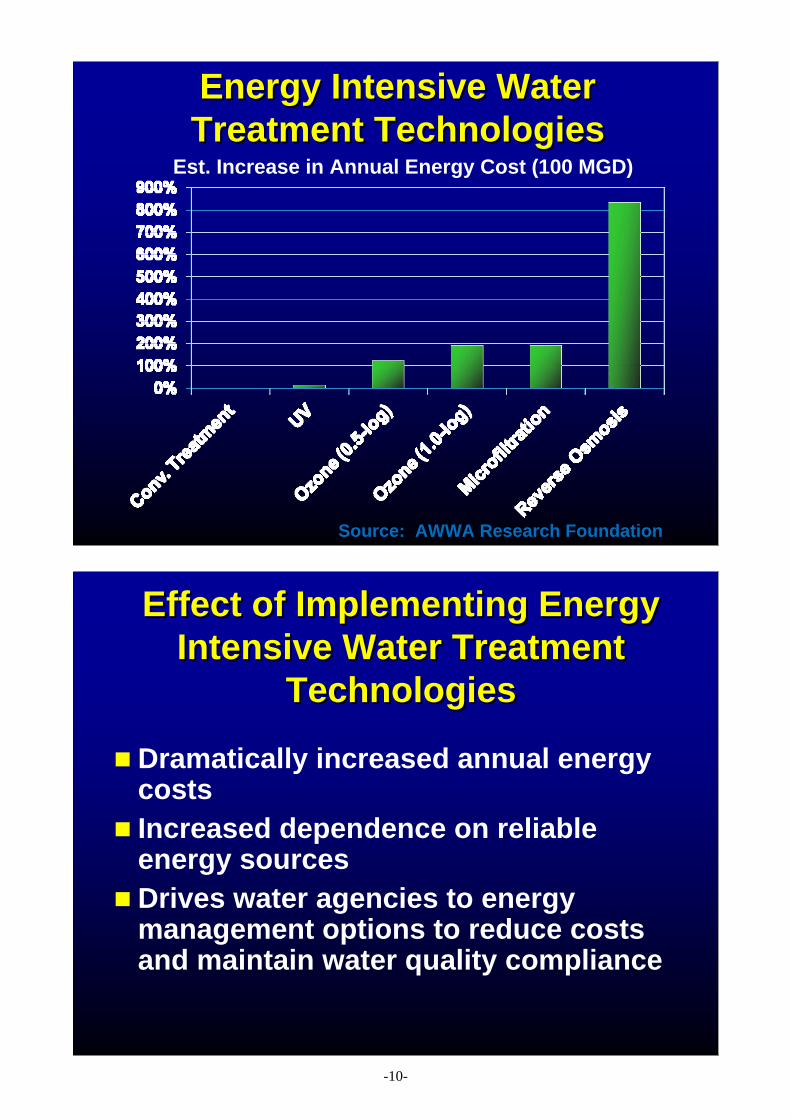
Energy Intensive Water Treatment TechnologiesEnergy Intensive Water Treatment Technologies
Source: AWWA Research Foundation
Est. Increase in Annual Energy Cost (100 MGD)
Effect of Implementing Energy Intensive Water Treatment
Technologies
Effect of Implementing Energy Intensive Water Treatment
Technologies
Dramatically increased annual energy costsIncreased dependence on reliable energy sourcesDrives water agencies to energy management options to reduce costs and maintain water quality compliance
-10-
Metropolitan Water Districtof Southern California
6 counties; 5,200 Sq. Miles18+ million peopleRegional economy: $600+ Billion Projected growth:~220,000 people / yearMetropolitan provides about half of Southern California’s supply
Metropolitan Metropolitan Water Water
District District Service AreaService Area
Where SouthernCalifornia
Gets its Water
Where SouthernWhere SouthernCaliforniaCalifornia
Gets its WaterGets its Water
LAKESHASTALAKELAKE
SHASTASHASTA
LAKEOROVILLE
LAKELAKEOROVILLEOROVILLE
Bay-DeltaBayBay--DeltaDelta
STATE WATER PROJECT
STATE WATER STATE WATER PROJECTPROJECT
LOS ANGELESAQUEDUCTS
LOS ANGELESAQUEDUCTS
COLORADORIVER
AQUEDUCT
COLORADOCOLORADORIVERRIVER
AQUEDUCTAQUEDUCT
METROPOLITANWATER DISTRICTSERVICE AREA
METROPOLITANMETROPOLITANWATER DISTRICTWATER DISTRICTSERVICE AREASERVICE AREA
LOCALLOCALLOCAL
-11-
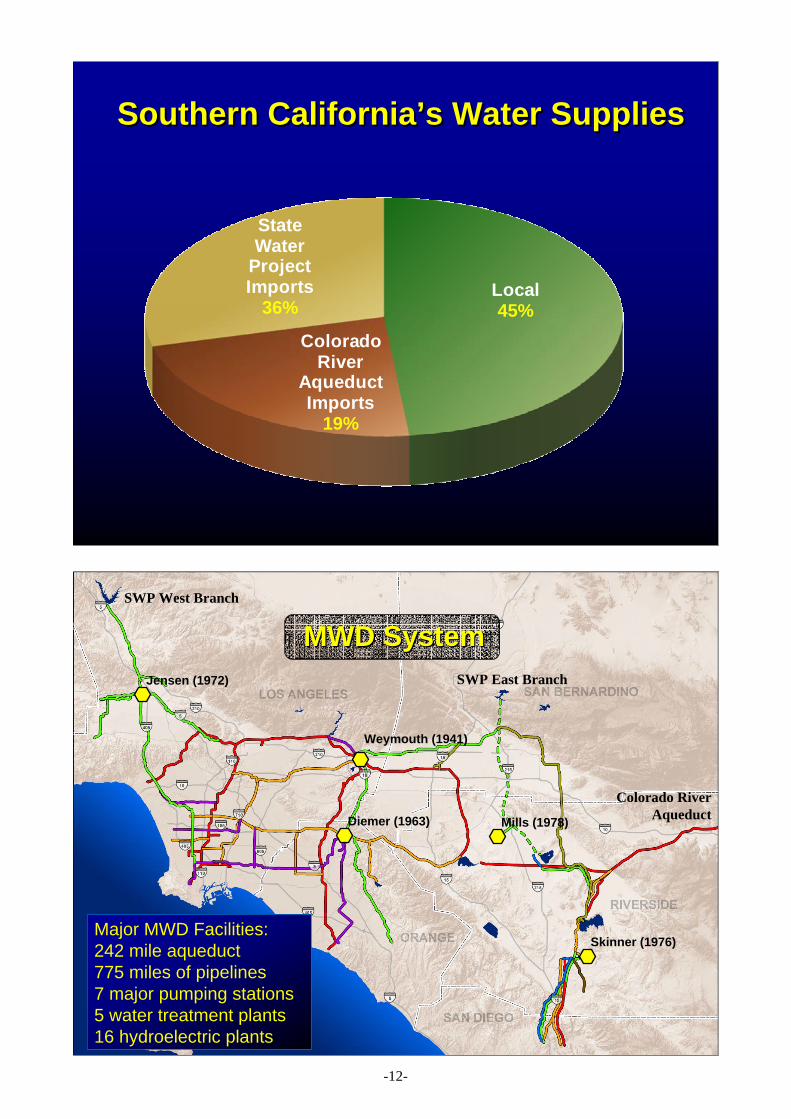
Local45%
Colorado River
Aqueduct Imports
19%
State Water
Project Imports
36%
Southern California’s Water SuppliesSouthern California’s Water Supplies
MWD SystemMWD System
Mills (1978)
Skinner (1976)
Jensen (1972)
Weymouth (1941)
Diemer (1963)
Major MWD Facilities:242 mile aqueduct775 miles of pipelines7 major pumping stations5 water treatment plants16 hydroelectric plants
SWP West Branch
SWP East Branch
Colorado River Aqueduct
-12-
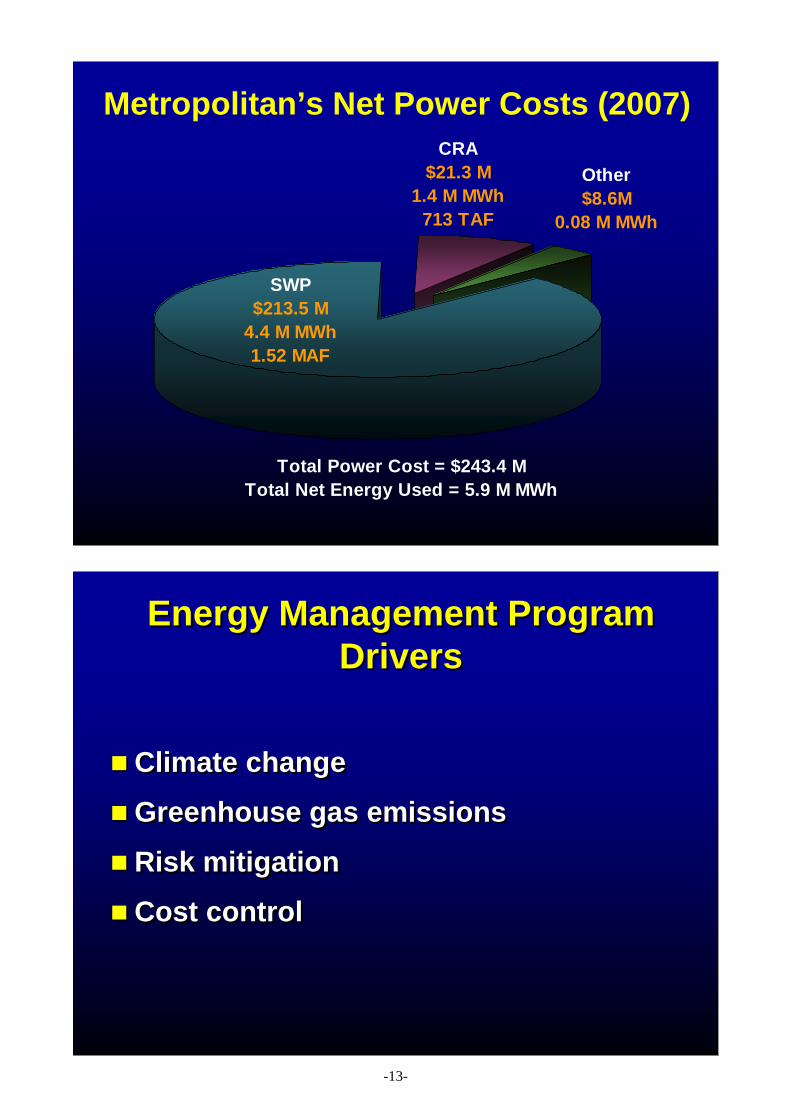
Metropolitan’s Net Power Costs (2007)
Other$8.6M
0.08 M MWh
Total Power Cost = $243.4 MTotal Net Energy Used = 5.9 M MWh
SWP$213.5 M
4.4 M MWh1.52 MAF
CRA$21.3 M
1.4 M MWh713 TAF
Energy Management Program Drivers
Energy Management Program Drivers
Climate change
Greenhouse gas emissions
Risk mitigation
Cost control
Climate change
Greenhouse gas emissions
Risk mitigation
Cost control
-13-
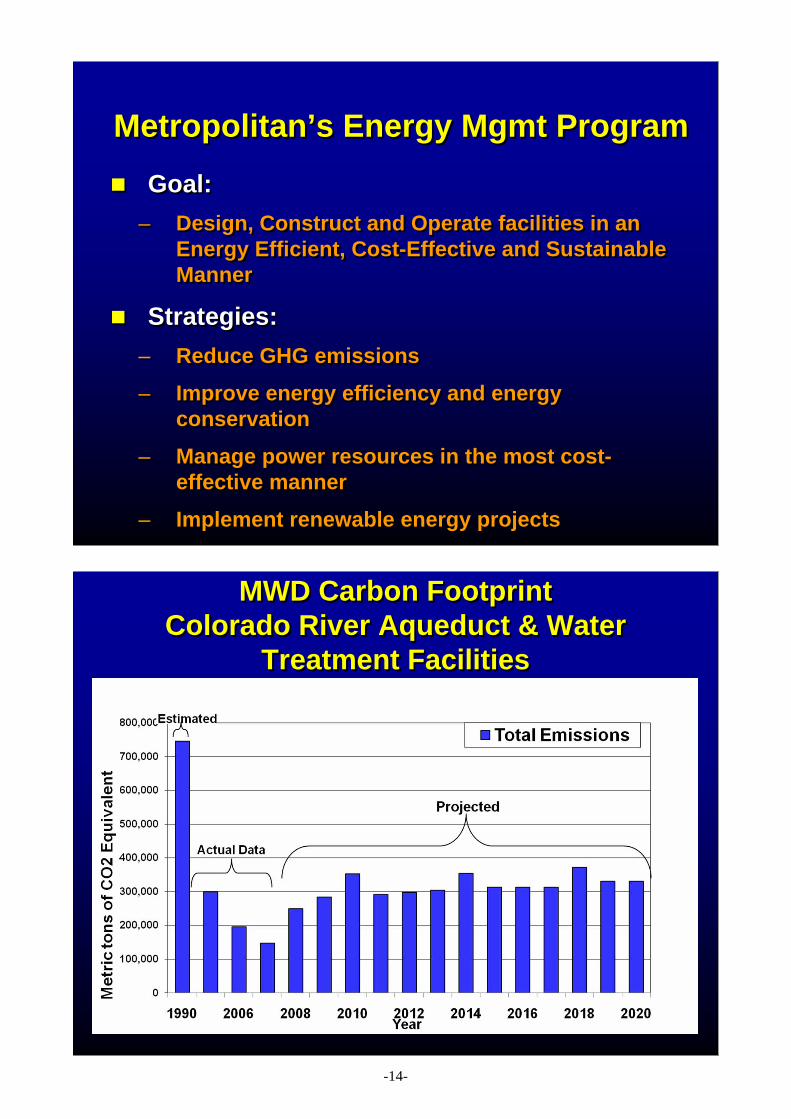
Metropolitan’s Energy Mgmt ProgramMetropolitan’s Energy Mgmt Program
Goal:– Design, Construct and Operate facilities in an
Energy Efficient, Cost-Effective and Sustainable Manner
Strategies:– Reduce GHG emissions
– Improve energy efficiency and energy conservation
– Manage power resources in the most cost-effective manner
– Implement renewable energy projects
Goal:– Design, Construct and Operate facilities in an
Energy Efficient, Cost-Effective and Sustainable Manner
Strategies:– Reduce GHG emissions
– Improve energy efficiency and energy conservation
– Manage power resources in the most cost-effective manner
– Implement renewable energy projects
MWD Carbon FootprintColorado River Aqueduct & Water
Treatment Facilities
MWD Carbon FootprintColorado River Aqueduct & Water
Treatment Facilities
-14-
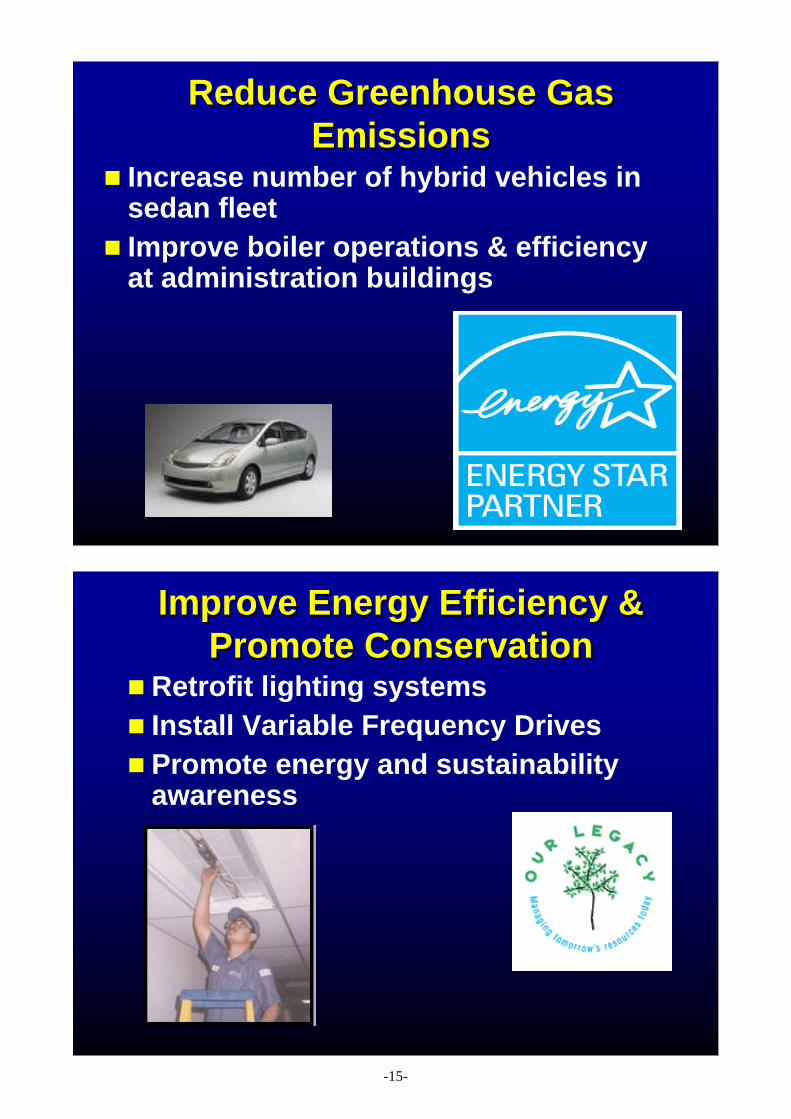
Reduce Greenhouse Gas Emissions
Reduce Greenhouse Gas Emissions
Increase number of hybrid vehicles in sedan fleetImprove boiler operations & efficiency at administration buildings
Improve Energy Efficiency & Promote Conservation
Improve Energy Efficiency & Promote Conservation
Retrofit lighting systemsInstall Variable Frequency DrivesPromote energy and sustainability awareness
-15-
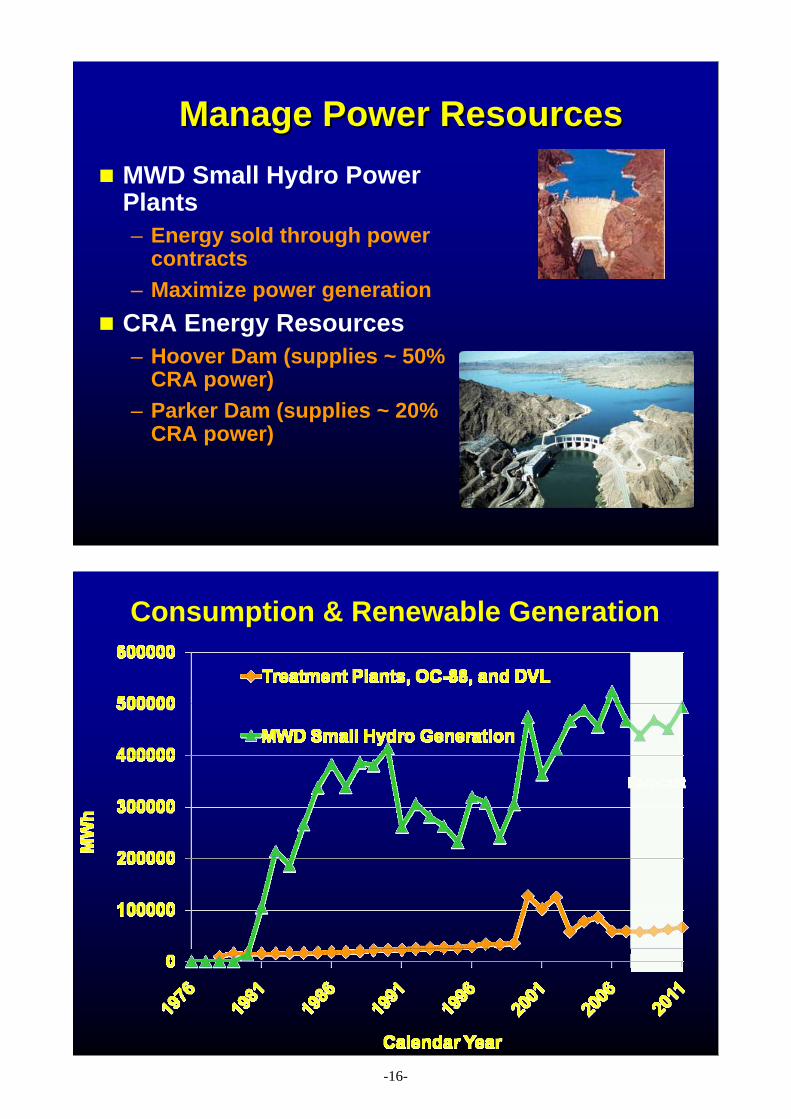
Manage Power ResourcesManage Power ResourcesMWD Small Hydro Power Plants– Energy sold through power
contracts– Maximize power generation
CRA Energy Resources– Hoover Dam (supplies ~ 50%
CRA power)– Parker Dam (supplies ~ 20%
CRA power)
Consumption & Renewable Generation
-16-
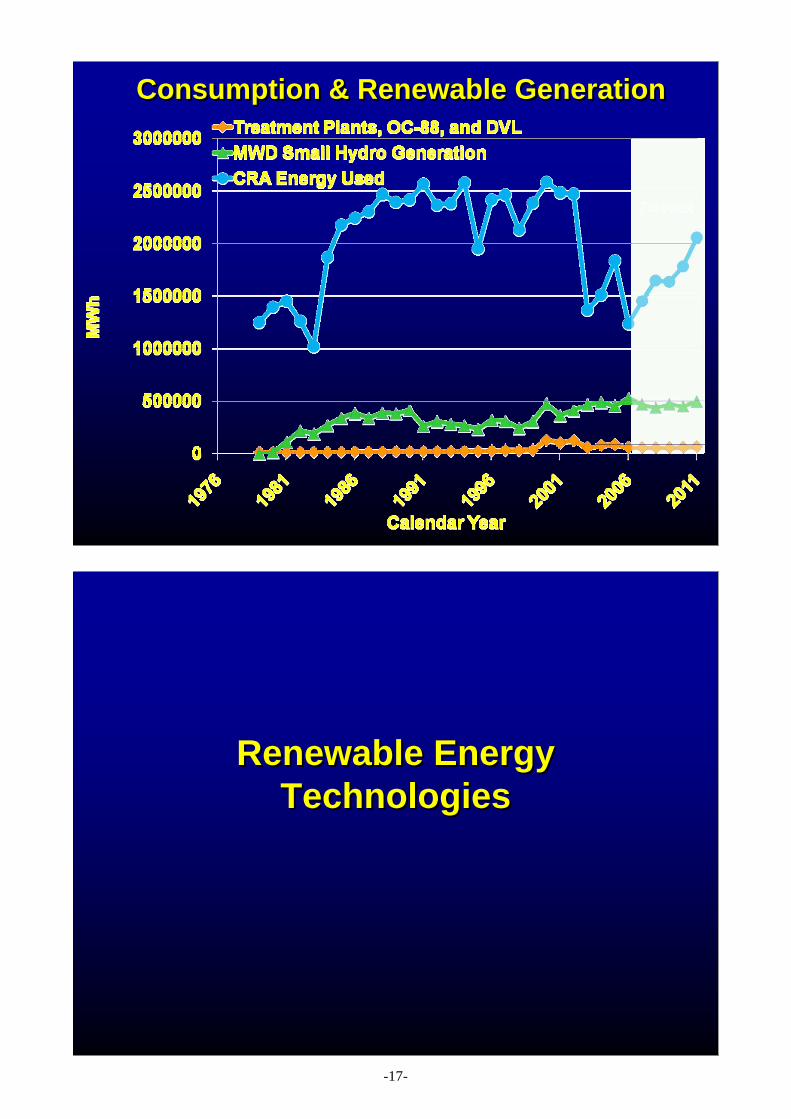
Consumption & Renewable GenerationConsumption & Renewable Generation
Renewable Energy Technologies
Renewable Energy Technologies
-17-
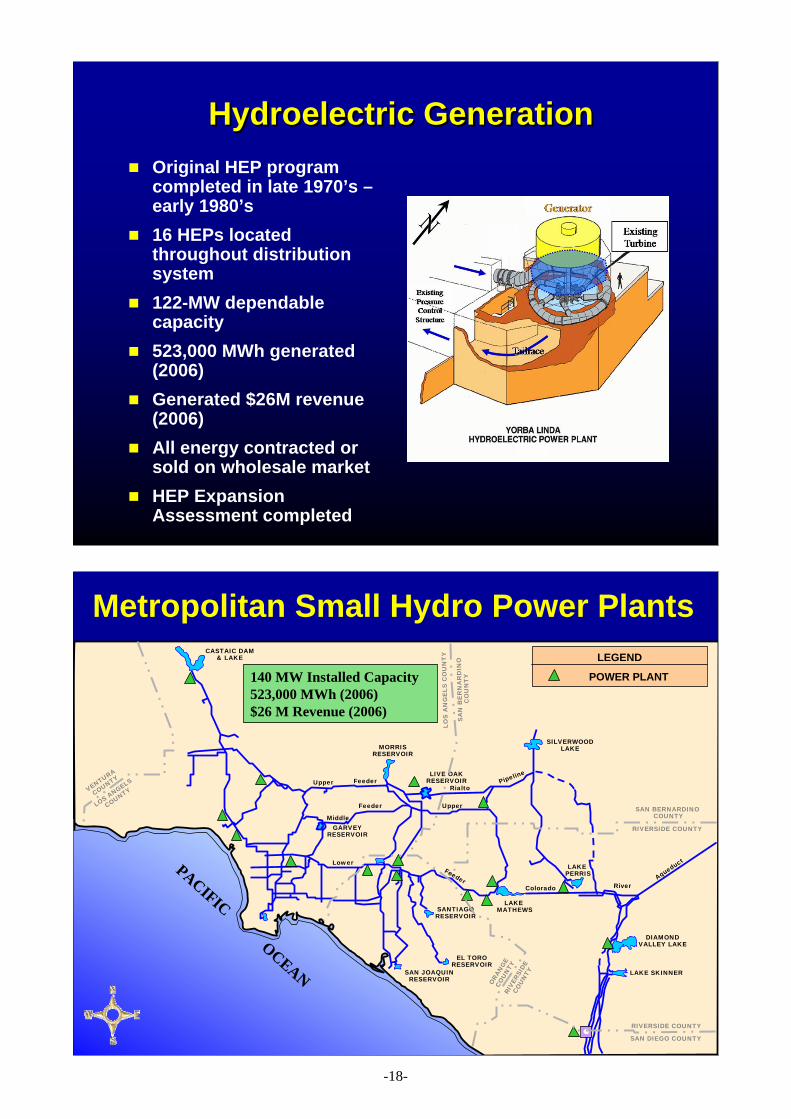
Hydroelectric GenerationHydroelectric GenerationOriginal HEP program completed in late 1970’s –early 1980’s16 HEPs located throughout distribution system122-MW dependable capacity523,000 MWh generated (2006)Generated $26M revenue (2006)All energy contracted or sold on wholesale marketHEP Expansion Assessment completed
Metropolitan Small Hydro Power Plants
PACIFIC OCEAN
CASTAIC DAM& LAKE
MORRIS RESERVOIR
LIVE OAK RESERVOIR
SILVERWOODLAKE
LAKEMATHEWS
DIAMOND VALLEY LAKE
EL TORO RESERVOIR
SANTIAGO RESERVOIR
LAKE SKINNER
LAKEPERRIS
SAN JOAQUIN RESERVOIR
GARVEY RESERVOIR
VENTURA
COUNTY
LOS ANGELS
COUNTY
LOS
AN
GE
LS C
OU
NT
Y
SA
N B
ER
NA
RD
INO
CO
UN
TY
SAN BERNARDINOCOUNTY
RIVERSIDE COUNTY
RIVERSIDE COUNTY
RIVE
RSID
ECO
UN
TY
ORA
NGE
COU
NTY
SAN DIEGO COUNTY
Upper Feeder
Middle
Feeder
Lower
Colorado
Feeder
Upper
RialtoPipeline
RiverAqueduct
LEGEND
POWER PLANT 140 MW Installed Capacity523,000 MWh (2006)$26 M Revenue (2006)
-18-
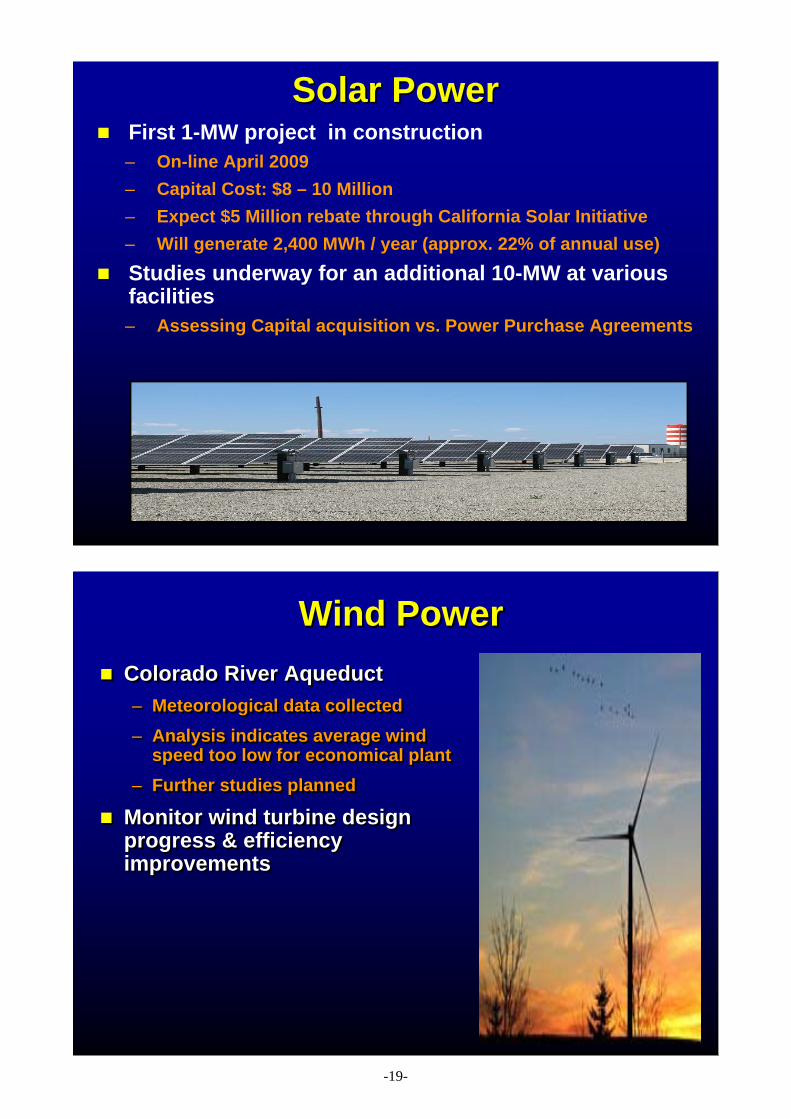
First 1-MW project in construction– On-line April 2009– Capital Cost: $8 – 10 Million– Expect $5 Million rebate through California Solar Initiative– Will generate 2,400 MWh / year (approx. 22% of annual use)Studies underway for an additional 10-MW at various facilities– Assessing Capital acquisition vs. Power Purchase Agreements
Solar PowerSolar Power
Wind PowerWind PowerWind PowerColorado River Aqueduct– Meteorological data collected – Analysis indicates average wind
speed too low for economical plant– Further studies planned
Monitor wind turbine design progress & efficiency improvements
Colorado River Aqueduct– Meteorological data collected – Analysis indicates average wind
speed too low for economical plant– Further studies planned
Monitor wind turbine design progress & efficiency improvements
-19-
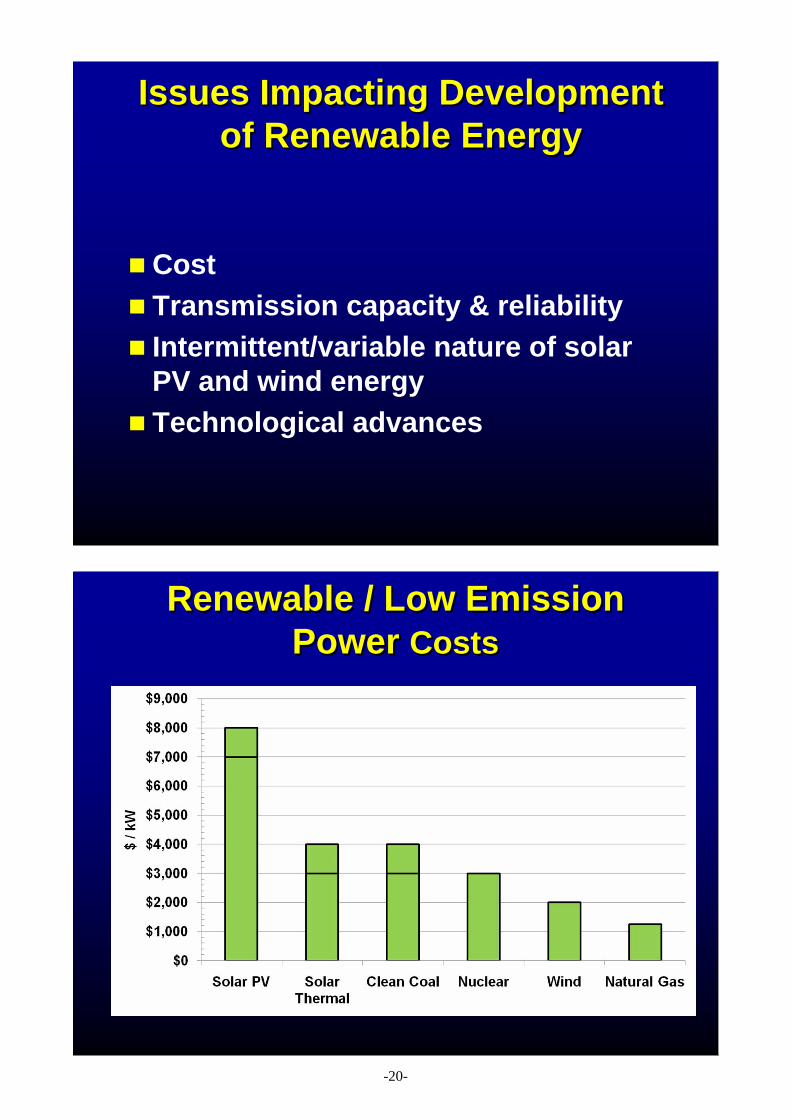
Issues Impacting Development of Renewable Energy
Issues Impacting Development of Renewable Energy
CostTransmission capacity & reliabilityIntermittent/variable nature of solar PV and wind energyTechnological advances
Renewable / Low EmissionPower Costs
Renewable / Low EmissionRenewable / Low EmissionPower Power Costs Costs
-20-
Next Steps for MetropolitanNext Steps for MetropolitanContinue energy efficiency & conservation activitiesContinue implementation of cost effective Renewable Energy projects:– Solar PV– Hydroelectric Power Plant Expansions– Wind Energy
Develop Board policy to address reduction of greenhouse gas emissions
-21-