energy & environmental science - stanford university · b department of nuclear science and...
TRANSCRIPT

This journal is©The Royal Society of Chemistry 2017 Energy Environ. Sci.
Cite this:DOI: 10.1039/c6ee02685k
Self-healing SEI enables full-cell cyclingof a silicon-majority anode with a coulombicefficiency exceeding 99.9%†
Yang Jin,‡abc Sa Li,‡d Akihiro Kushima,‡b Xiaoquan Zheng,a Yongming Sun,c
Jin Xie,c Jie Sun,c Weijiang Xue,b Guangmin Zhou,c Jiang Wu,a Feifei Shi,c
Rufan Zhang,c Zhi Zhu,b Kangpyo So,b Yi Cui*ce and Ju Li*bd
Despite active developments, full-cell cycling of Li-battery anodes with 450 wt% Si (a Si-majority
anode, SiMA) is rare. The main challenge lies in the solid electrolyte interphase (SEI), which when formed
naturally (nSEI), is fragile and cannot tolerate the large volume changes of Si during lithiation/delithiation.
An artificial SEI (aSEI) with a specific set of mechanical characteristics is henceforth designed; we
enclose Si within a TiO2 shell thinner than 15 nm, which may or may not be completely hermetic at the
beginning. In situ TEM experiments show that the TiO2 shell exhibits 5� greater strength than an
amorphous carbon shell. Void-padded compartmentalization of Si can survive the huge volume changes
and electrolyte ingression, with a self-healing aSEI + nSEI. The half-cell capacity exceeds 990 mA h g�1
after 1500 cycles. To improve the volumetric capacity, we further compress SiMA 3-fold from its tap
density (0.4 g cm�3) to 1.4 g cm�3, and then run the full-cell battery tests against a 3 mA h cm�2
LiCoO2 cathode. Despite some TiO2 enclosures being inevitably broken, 2� the volumetric capacity
(1100 mA h cm�3) and 2� the gravimetric capacity (762 mA h g�1) of commercial graphite anode is
achieved in stable full-cell battery cycling, with a stabilized areal capacity of 1.6 mA h cm�2 at the 100th
cycle. The initial lithium loss, characterized by the coulombic inefficiency (CI), is carefully tallied on
a logarithmic scale and compared with the actual full-cell capacity loss. It is shown that a strong,
non-adherent aSEI, even if partially cracked, facilitates an adaptive self-repair mechanism that enables
full-cell cycling of a SiMA, leading to a stabilized coulombic efficiency exceeding 99.9%.
Broader contextNano silicon is the most promising alternative to the graphite anode for lithium-ion batteries due to its high theoretical capacity (4200 mA h g�1). However, itsfragile solid electrolyte interphase (SEI) cannot tolerate the large volume changes of bare Si, resulting in low coulombic efficiency. As shown in previousresearch studies, the yolk–shell design can effectively improve the coulombic efficiency. But like most nanoparticle-based powders, it faces the problem of lowtap density. Even though the gravimetric capacity is impressive, the volumetric capacity would still be non-competitive compared to the commercial graphiteanode. In this work, the speed and efficacy of self-repair of a crushed yolk–shell electrode have been systematically evaluated. It is shown that an exceptionaldegree of protection against liquid electrolyte flooding of nano Si can be eventually established, even though the number of cycles and the initial Li loss it takesto achieve this final condition are admittedly high. However, the final electrode thickness and volumetric/gravimetric specific capacities are still significantlyenhanced over graphite. Highly compressed yolk–shell Si@TiO2 nanotissue, despite unavoidable imperfections at the beginning, is resilient functionally andcan achieve a high level of specific capacities and a stabilized coulombic efficiency at low cost, making lithium-constrained full-cell cycling of silicon-majorityanodes (SiMAs) an imminent reality.
a State Key Lab of Electrical Insulation and Power Equipment, School of Electrical Engineering, Xi’an Jiaotong University, Xi’an 710049, P. R. Chinab Department of Nuclear Science and Engineering and Department of Materials Science and Engineering, Massachusetts Institute of Technology, Cambridge, MA 02139,
USA. E-mail: [email protected] Department of Materials Science and Engineering, Stanford University, Stanford, California, 94305, USA. E-mail: [email protected] School of Materials Science and Engineering, Tongji University, 4800 Caoan Road, Shanghai 201804, Chinae Stanford Institute for Materials and Energy Sciences, SLAC National Accelerator Laboratory, 2575 Sand Hill Road, Menlo Park, CA 94025, USA
† Electronic supplementary information (ESI) available. See DOI: 10.1039/c6ee02685k‡ These authors contributed equally to this work.
Received 14th September 2016,Accepted 8th December 2016
DOI: 10.1039/c6ee02685k
www.rsc.org/ees
Energy &EnvironmentalScience
PAPER
Publ
ishe
d on
06
Janu
ary
2017
. Dow
nloa
ded
by S
tanf
ord
Uni
vers
ity o
n 06
/01/
2017
21:
37:3
8.
View Article OnlineView Journal

Energy Environ. Sci. This journal is©The Royal Society of Chemistry 2017
Introduction
Silicon is a promising alternative to the graphite anode for lithium-ion batteries because of its natural abundance, environmentalfriendliness, low discharge potential and high theoretical capacity(4200 A h kg�1 if Li4.4Si).1–3 However, the practical adoption of aSi-majority anode (SiMA), defined by Si occupying more than0 wt% of the dried anode paste including binder and conductiveagents, has been impeded by the enormous volume change(300–400%) and solid electrolyte interphase (SEI) instabilityexperienced during lithiation/delithiation.4–7 Because liquidelectrolytes reductively decompose at the low working potentialof Si (o0.5 V versus Li/Li+), a passivating SEI layer always formson any freshly exposed conductive surface and usually containsnon-cyclable (‘‘dead’’) lithium ions (LiF, Li2O, etc.), trapped byirreversible side reactions.8,9 Such a naturally formed SEI, whichis fragile, easily breaks off and forms fluffy debris as the activecontent expands and contracts. This results in continuousconsumption of the solvent molecules and cyclable (‘‘live’’)lithium,10–13 and full-cell batteries with a SiMA or other high-capacity anodes (Al, Sn, etc.) often die quickly (within tens ofcycles) because of Li- and/or solvent exhaustion. Therefore,ensuring SEI stability at the electrolyte–electrode interface iscritical for long-life and lightweight Li-matched full cells. Avariety of nanostructure designs have been developed to overcomethe issues of mechanical breaking and spallation of the SEI.14
Among them, the yolk–shell structure15–22 has been shown to bean effective approach to stabilize fragile natural SEIs (nSEIs), byproviding an artificial SEI (aSEI) layer support that does notexpand/contract as much, even when the active materialsencapsulated within do, as there is often void space left inbetween. This artificial SEI (for example thin-shell C and TiO2)is often conductive to both electrons and Li ions, but stops thesolvent molecules and large-sized anions like PF6
� and TSFI�.23,24
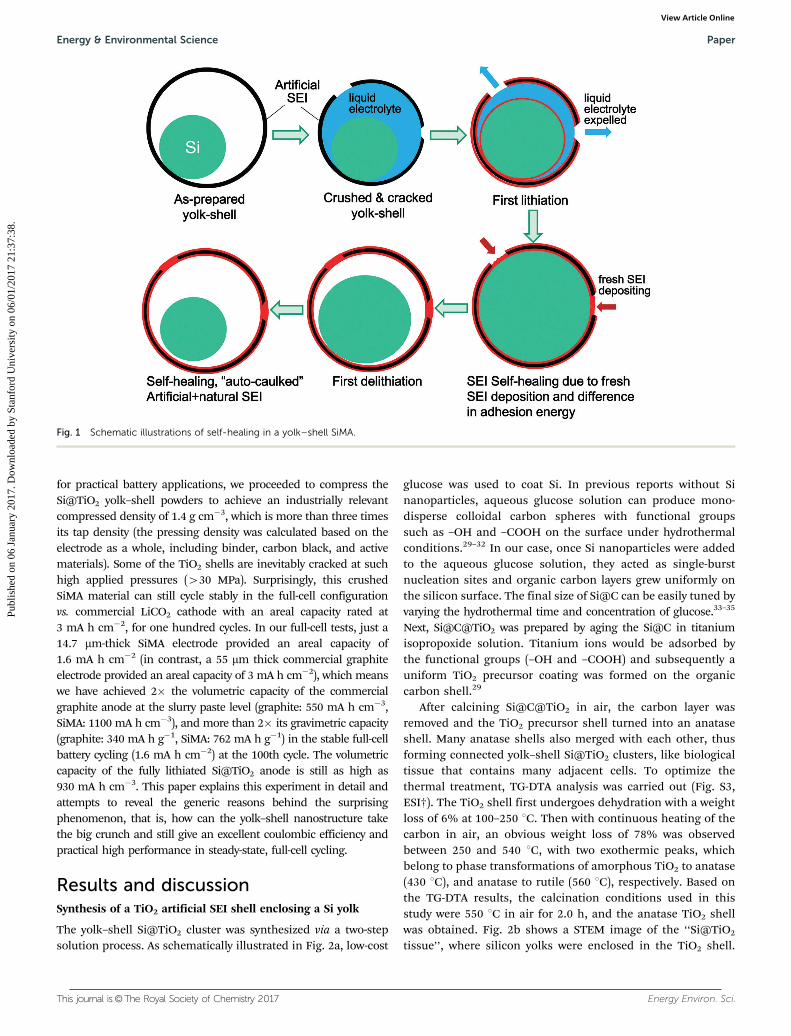
To survive the huge internal stress fluctuations and keep theliquid electrolyte away from the active material within the yolk–shell, three generic mechanical properties of the best aSEIencapsulation could be critical: (a) it should adhere weakly tostay semi-detached from the active material (e.g. Si), (b) is strongitself, and (c) adheres strongly to the nSEI that forms later. TheaSEI should also be thin for weight saving and have high ionicconductance. (a) and (b) are needed for load-isolation of a nSEI.If (a) is not true and the aSEI sticks too much with the Si, during‘‘steady-state’’ cycling, too much of the dimensional changewould be transferred to the aSEI and could cause it to break. (b)is also necessary because the aSEI layer would still sustain someload, especially at the contact points with Si which expands/shrinks, and it should not break at those points, just like goodclothing should be made of strong fabric that does not stick tothe body. Lastly, (c) is needed for self-healing, a central conceptof this work. It turns out that, a nSEI, despite its fragility andsoftness and being the cause of low coulombic efficiency (CE)initially, is nonetheless self-healing and would work muchbetter in combination with a strong aSEI.
Self-healing is a concept from biology, but may be generalizedto some other dissipative emergent systems, where invasion can
be adapted to in situ and the flaws get remedied sufficiently.Self-healing in the context of the yolk–shell SiMA means thefollowing: if the aSEI enclosure is not completely hermetic andthere are cracks in the shells (especially after being crushed to1.4 g cm�3, more than three times its tap density), inevitablyliquid electrolyte would flow inside and inundate the Si. This seemscatastrophic, as it could invalidate the whole yolk–shell designconcept of isolating Si from the liquid electrolyte. But upon firstlithiation with a reducing voltage, two things would happen:(i) there is solid nSEI formed on the TiO2 shell and Si surface,and (ii) Si expands in volume due to lithiation, expelling liquid outof the cracks. Finally, the expanded Si + nSEI could touch the TiO2
inner wall, and fresh nSEIs formed on both the surface of siliconand the TiO2 shell, which will connect and ‘‘caulk’’ the crack, since anSEI should adhere more strongly to TiO2 than to Si underassumptions (a) and (c); see the illustrations in Fig. 1. Then uponfirst delithiation, the Si core would retract, leaving behind an in siturepaired artificial + natural SEI cocoon, sealing off and isolatingthe Si core from the liquid electrolyte. Self-healing in thepresent context thus means self-evacuating plus self-sealing.
The illustration in Fig. 1 is of course a gross simplification.In reality the repairs may be done in tens of cycles, and in somesystems, full repair may never be done. In this paper we willtrack the coulombic efficiency (CE) as a quantitative indicatorof the self-repair process. The CE, or rather the coulombicinefficiency (CI � 1 � CE), is a measure of irreversible SEIgrowth per cycle. There is a battery industry lore that thestabilized CE needs to exceed 99.9% in order for a Li-matched(anode areal capacity E cathode areal capacity) full-cell to cycle200 times. However, many papers publish CE vs. cycle number nin a linear-scale plot, which hides valuable information about theself-healing process and nSEI accumulation. In this paper, we willcarefully examine CI evolution on the logarithmic scale, to extractquantitative information about the major structural repairs thatmust happen in the first tens of cycles (the ‘‘transient CE’’), aswell as the degree to which repair is eventually perfected to stopliquid electrolyte invasion (the ‘‘stabilized CE’’).
Amorphous carbon (aC) has been used as an aSEI in theyolk–shell design.22–24 A TiO2 nanoshell could be potentiallysuperior to an aC shell in terms of (b) and (c).25,26 With respect to (c),the polar nature of TiO2 could mean stronger adhesion strength withthe nSEI, which contains polar components LiF, Li2O, etc. For (b), wewill show experimentally that our TiO2 nanoshell is much stiffer andstronger than an aC shell, and therefore is better for load-isolation.In our previous work,27 it has been shown that TiO2 is mechanicallyrobust and an electrochemically high-performing aSEI, whichsupports full-cell cycling of Al nanoparticles encapsulated within,for hundreds of cycles, with greatly improved coulombic efficiency.The same will be demonstrated with Si cores here.
But like most nanoparticles-based materials, our Si@TiO2
yolk–shell powder has a low tap density (o0.4 g cm�3). Thus, eventhough the gravimetric capacity is very impressive (B1000 mA h g�1
even after 1500 cycles in a half cell), the volumetric capacitywould be much less impressive when compared with thecommercial graphite anode, which has a compressed density of1.4–1.8 g cm�3. To further improve the SiMA’s volumetric capacity
Paper Energy & Environmental Science
Publ
ishe
d on
06
Janu
ary
2017
. Dow
nloa
ded
by S
tanf
ord
Uni
vers
ity o
n 06
/01/
2017
21:
37:3
8.
View Article Online
This journal is©The Royal Society of Chemistry 2017 Energy Environ. Sci.
for practical battery applications, we proceeded to compress theSi@TiO2 yolk–shell powders to achieve an industrially relevantcompressed density of 1.4 g cm�3, which is more than three timesits tap density (the pressing density was calculated based on theelectrode as a whole, including binder, carbon black, and activematerials). Some of the TiO2 shells are inevitably cracked at suchhigh applied pressures (430 MPa). Surprisingly, this crushedSiMA material can still cycle stably in the full-cell configurationvs. commercial LiCO2 cathode with an areal capacity rated at3 mA h cm�2, for one hundred cycles. In our full-cell tests, just a14.7 mm-thick SiMA electrode provided an areal capacity of1.6 mA h cm�2 (in contrast, a 55 mm thick commercial graphiteelectrode provided an areal capacity of 3 mA h cm�2), which meanswe have achieved 2� the volumetric capacity of the commercialgraphite anode at the slurry paste level (graphite: 550 mA h cm�3,SiMA: 1100 mA h cm�3), and more than 2� its gravimetric capacity(graphite: 340 mA h g�1, SiMA: 762 mA h g�1) in the stable full-cellbattery cycling (1.6 mA h cm�2) at the 100th cycle. The volumetriccapacity of the fully lithiated Si@TiO2 anode is still as high as930 mA h cm�3. This paper explains this experiment in detail andattempts to reveal the generic reasons behind the surprisingphenomenon, that is, how can the yolk–shell nanostructure takethe big crunch and still give an excellent coulombic efficiency andpractical high performance in steady-state, full-cell cycling.
Results and discussionSynthesis of a TiO2 artificial SEI shell enclosing a Si yolk
The yolk–shell Si@TiO2 cluster was synthesized via a two-stepsolution process. As schematically illustrated in Fig. 2a, low-cost
glucose was used to coat Si. In previous reports without Sinanoparticles, aqueous glucose solution can produce mono-disperse colloidal carbon spheres with functional groupssuch as –OH and –COOH on the surface under hydrothermalconditions.29–32 In our case, once Si nanoparticles were addedto the aqueous glucose solution, they acted as single-burstnucleation sites and organic carbon layers grew uniformly onthe silicon surface. The final size of Si@C can be easily tuned byvarying the hydrothermal time and concentration of glucose.33–35
Next, Si@C@TiO2 was prepared by aging the Si@C in titaniumisopropoxide solution. Titanium ions would be adsorbed bythe functional groups (–OH and –COOH) and subsequently auniform TiO2 precursor coating was formed on the organiccarbon shell.29
After calcining Si@C@TiO2 in air, the carbon layer wasremoved and the TiO2 precursor shell turned into an anataseshell. Many anatase shells also merged with each other, thusforming connected yolk–shell Si@TiO2 clusters, like biologicaltissue that contains many adjacent cells. To optimize thethermal treatment, TG-DTA analysis was carried out (Fig. S3,ESI†). The TiO2 shell first undergoes dehydration with a weightloss of 6% at 100–250 1C. Then with continuous heating of thecarbon in air, an obvious weight loss of 78% was observedbetween 250 and 540 1C, with two exothermic peaks, whichbelong to phase transformations of amorphous TiO2 to anatase(430 1C), and anatase to rutile (560 1C), respectively. Based onthe TG-DTA results, the calcination conditions used in thisstudy were 550 1C in air for 2.0 h, and the anatase TiO2 shellwas obtained. Fig. 2b shows a STEM image of the ‘‘Si@TiO2
tissue’’, where silicon yolks were enclosed in the TiO2 shell.
Fig. 1 Schematic illustrations of self-healing in a yolk–shell SiMA.
Energy & Environmental Science Paper
Publ
ishe
d on
06
Janu
ary
2017
. Dow
nloa
ded
by S
tanf
ord
Uni
vers
ity o
n 06
/01/
2017
21:
37:3
8.
View Article Online

Energy Environ. Sci. This journal is©The Royal Society of Chemistry 2017
The pristine commercial Si has a very thin oxidation layer(Fig. S4, ESI†). To verify whether nano Si was oxidized severelyduring the 550 1C calcination, TG and XRD measurements ofthe pristine nano Si were collected. Fig. S5 (ESI†) shows that theincrement of weight was less than 2.5% after 550 1C calcinationin air, which will be much lower with the protection of theanatase shell. And no additional signal was found after calcinationfrom the XRD results (Fig. S6, ESI†).
Elemental mapping verifies the presence of TiO2 shells andSi yolks. XRD (Fig. 2c) demonstrates that the carbon is completelyeliminated after thermal treatment in air and the final productconsists of Si yolks and anatase nanoshells only. Fig. 2d–f showscanning electron microscopy (SEM) images and transmissionelectron microscopy (TEM) images of the Si@C@TiO2 composite(Fig. 2d) and yolk–shell Si@TiO2 (Fig. 2e and f). As revealed byhigh resolution TEM (Fig. 2g), the shell is continuous and theanatase lattice planes {110} and {002} can be identified. The weightratio of Si and TiO2 was calculated to be 73 : 27 (Si : TiO2) based onthe full Si oxidation experiment at 1200 1C (Fig. S7, ESI†).
Mechanical strength of the TiO2 artificial SEI
To characterize the strength of the TiO2 shell synthesizedabove, in situ TEM indentation experiments were performed
on the aC and TiO2 shells, as shown in Fig. 3a. An atomic forcemicroscopy (AFM) cantilever probe (Nanosensors PPP-NCHR)(Fig. 3b) with a spring constant of 30 N m�1 was attached to thetip of the gold wire using a conducting epoxy (ChemtronicsCW2400). aC and TiO2 shells were attached to the tungstenprobe with a conducting epoxy glue. The gold wire and thetungsten probe were then mounted on a Nanofactoryt STM-TEMholder. Using the 3D piezo-manipulator, the shell was broughtinto contact with the cantilever tip and compression was appliedto the shell by imposing a displacement (D) against the cantilever.The force acting on the shell was calculated by measuring thecantilever deflection. For comparison, hollow TiO2 and aC shellswith nearly the same thickness and diameter were chosen for theAFM indentation experiment. Fig. 3c and d show the dynamicdeformation of hollow aC and TiO2 shells under compressionuntil the shells crack. The force–displacement curve measuredby the in situ TEM indenter is shown in Fig. 3e, and the stiffnessof the TiO2 and aC shell was calculated to be 500 N m�1 and90 N m�1, respectively.
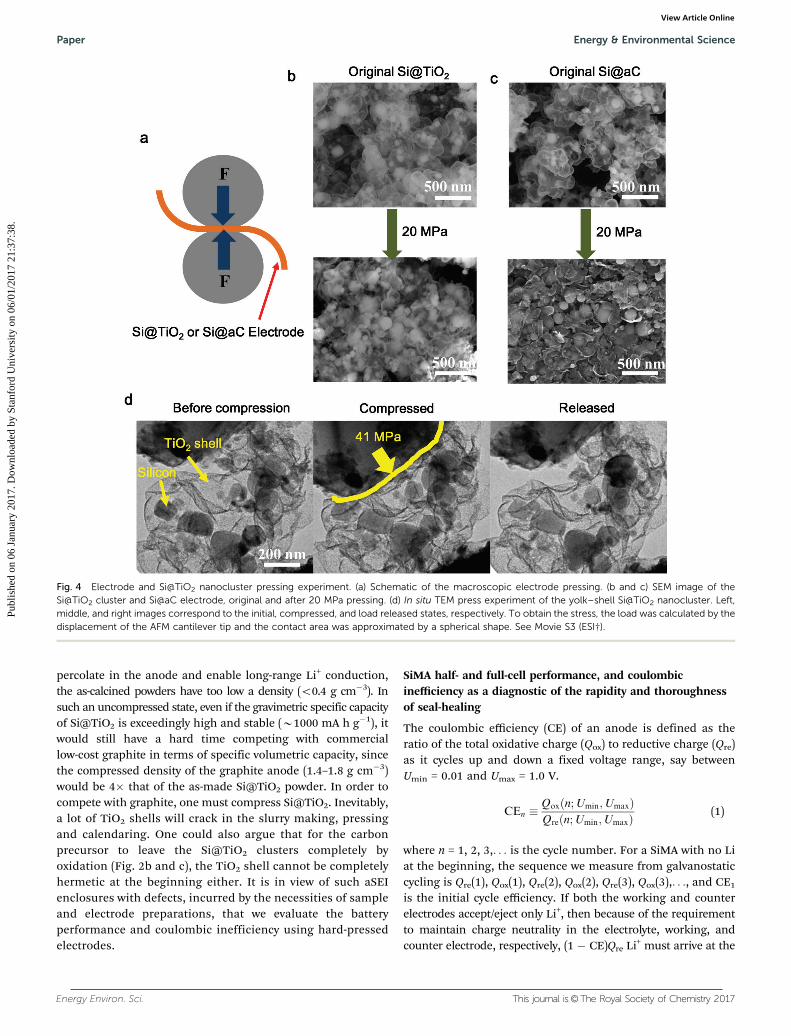
The calendering process in commercial electrode fabricationis a big challenge for hollow nanostructured materials (yolk–shells,multi-shells, etc.), as the thin shells would sustain significantpressure (Fig. 4a). To examine the deformation and fracture of
Fig. 2 Fabrication and characterization of the yolk–shell Si@TiO2 cluster electrode. (a) Schematic of the synthesis of the yolk–shell Si@TiO2 cluster.(b) STEM image and elemental mapping of Ti, O and Si, confirming the yolk–shell structure. (c) XRD data of the commercial nano silicon precursor, Si@Cafter hydrothermal treatment and the as-obtained Si@TiO2 after 550 1C heat treatment in air. The organic layer was completely eliminated and the finalproduct consists of pure silicon and anatase. (d) SEM image of Si@C@TiO2 after titanium ion adsorption. (e and f) SEM and TEM images of the yolk–shellSi@TiO2 cluster after heating at 550 1C in air for 2 h. TEM image shows that several Si nanoparticles are encapsulated in a continuous thin TiO2 shell.(g) High resolution TEM image of TiO2 shell.
Paper Energy & Environmental Science
Publ
ishe
d on
06
Janu
ary
2017
. Dow
nloa
ded
by S
tanf
ord
Uni
vers
ity o
n 06
/01/
2017
21:
37:3
8.
View Article Online

This journal is©The Royal Society of Chemistry 2017 Energy Environ. Sci.
the yolk–shell ‘‘Si@TiO2 tissue’’, a quantitative macroscopicpressing experiment was conducted. Fig. 4b is the SEM imageof the Si@TiO2 electrode. It is obvious that under the samemacroscopic pressure, the Si@TiO2 cluster maintains its structuralintegrity better than Si@aC (Fig. 4c), with which many moreshells are completely destroyed. In situ TEM indentation ofa mm-piece of ‘‘Si@TiO2 tissue’’ also validates its superiormechanical robustness (see Movie S3, ESI†). After 41 MPapressing, the Si@TiO2 tissue did not break as a whole(Fig. 4d), and this overall structural robustness persists to a
final pressure as high as 160 MPa (Fig. S8 and Movie S4, ESI†).Nonetheless, it is hard to ascertain (and indeed to believe) thatthe TiO2 shells are all completely hermetic, as small crackswould be hard to detect by TEM.
Pressing low-density powders into higher-density electrodes
It is clear from Fig. 2e, f and 4b that the yolk–shell Si@TiO2
cluster has a large interstitial volume. Even though someinterstitial porosity is needed for the liquid electrolyte to
Fig. 3 In situ TEM indentation of a hollow TiO2 shell and hollow aC shell. (a) Schematic. (b) Optical image of the in situ TEM indenter. (c and d) Dynamicdeformation of the hollow TiO2 shell and hollow aC shell under an applied force (Movie S1 and S2, ESI†). The diameter of the hollow TiO2 shell is 230 nmand the thickness is 16 nm. The diameter of the hollow aC shell is 258 nm and the thickness is 15 nm. (e) Force vs. compressive strain (Dd/d) of the hollowTiO2 shell and hollow aC shell.
Energy & Environmental Science Paper
Publ
ishe
d on
06
Janu
ary
2017
. Dow
nloa
ded
by S
tanf
ord
Uni
vers
ity o
n 06
/01/
2017
21:
37:3
8.
View Article Online
Energy Environ. Sci. This journal is©The Royal Society of Chemistry 2017
percolate in the anode and enable long-range Li+ conduction,the as-calcined powders have too low a density (o0.4 g cm�3). Insuch an uncompressed state, even if the gravimetric specific capacityof Si@TiO2 is exceedingly high and stable (B1000 mA h g�1), itwould still have a hard time competing with commerciallow-cost graphite in terms of specific volumetric capacity, sincethe compressed density of the graphite anode (1.4–1.8 g cm�3)would be 4� that of the as-made Si@TiO2 powder. In order tocompete with graphite, one must compress Si@TiO2. Inevitably,a lot of TiO2 shells will crack in the slurry making, pressingand calendaring. One could also argue that for the carbonprecursor to leave the Si@TiO2 clusters completely byoxidation (Fig. 2b and c), the TiO2 shell cannot be completelyhermetic at the beginning either. It is in view of such aSEIenclosures with defects, incurred by the necessities of sampleand electrode preparations, that we evaluate the batteryperformance and coulombic inefficiency using hard-pressedelectrodes.
SiMA half- and full-cell performance, and coulombicinefficiency as a diagnostic of the rapidity and thoroughnessof seal-healing
The coulombic efficiency (CE) of an anode is defined as theratio of the total oxidative charge (Qox) to reductive charge (Qre)as it cycles up and down a fixed voltage range, say betweenUmin = 0.01 and Umax = 1.0 V.
CEn �Qox n;Umin;Umaxð ÞQre n;Umin;Umaxð Þ (1)
where n = 1, 2, 3,. . . is the cycle number. For a SiMA with no Liat the beginning, the sequence we measure from galvanostaticcycling is Qre(1), Qox(1), Qre(2), Qox(2), Qre(3), Qox(3),. . ., and CE1
is the initial cycle efficiency. If both the working and counterelectrodes accept/eject only Li+, then because of the requirementto maintain charge neutrality in the electrolyte, working, andcounter electrode, respectively, (1 � CE)Qre Li+ must arrive at the
Fig. 4 Electrode and Si@TiO2 nanocluster pressing experiment. (a) Schematic of the macroscopic electrode pressing. (b and c) SEM image of theSi@TiO2 cluster and Si@aC electrode, original and after 20 MPa pressing. (d) In situ TEM press experiment of the yolk–shell Si@TiO2 nanocluster. Left,middle, and right images correspond to the initial, compressed, and load released states, respectively. To obtain the stress, the load was calculated by thedisplacement of the AFM cantilever tip and the contact area was approximated by a spherical shape. See Movie S3 (ESI†).
Paper Energy & Environmental Science
Publ
ishe
d on
06
Janu
ary
2017
. Dow
nloa
ded
by S
tanf
ord
Uni
vers
ity o
n 06
/01/
2017
21:
37:3
8.
View Article Online

This journal is©The Royal Society of Chemistry 2017 Energy Environ. Sci.
tested electrode via the electrolyte from the counter electrode andnot return, to compensate for the ‘‘lost electrons’’ metered on theouter circuit. So the coulombic inefficiency (CI),
CIn � 1 � CEn (2)
is an indicator of Li-transfer from the counter-electrode (‘‘corroded’’)to the tested electrode (‘‘plated’’) as a battery cycles up and down afixed voltage range. For this potential range then, the transferredCInQre(n) Li+ in this cycle is likely physically converted from ‘‘liveLi-ion’’ to ‘‘dead Li-ion’’ (at least ‘‘dead’’ for this fixed voltage range)embedded in the SEI, and following this assumption the totalamount of ‘‘live Li-ion’’ in the cell will sustain an exponential decaywith the number of cycles. This is the rationale for the batteryindustry lore of ‘‘the CE needs to be better than 99.9%’’, since0.999200 E 0.8, and 20% capacity fading is set as an industrialcriterion for cell life. In reality, it could be even worse than thisprojection if Li cations are incorporated together with the saltanions into the SEI (for example, for each ‘‘lost electron’’, one freeLi+ cation and three LiPF6 are incorporated into the SEI of the testedanode), or under certain circumstances, it could be better than thisprojection if the electrolyte supports reversible shuttling.27,28 Withthe caveats stated above, CI is commonly understood as a roughindicator of SEI growth and accumulation on the tested anode. CIn
usually decays with n. People often distinguish between ‘‘transient’’coulombic efficiency, when the CIn curve varies rapidly with n in theinitial cycles, vs. ‘‘stabilized’’ coulombic efficiency:
CEstablized � limn!1
1
2M þ 1
XnþM
n0¼n�MCEn0 ;
CIstablized � limn!1
1
2M þ 1
XnþM
n0¼n�MCIn0
(3)
where 2M + 1 is a running-window average. In the context of self-sealing and self-healing, the ‘‘transient’’ CIn curve represents howquickly the anode responds to initial electrolyte invasion andaccomplishes major repairs of the structure to reduce flooding ofthe active content, in the first few tens of cycles. In contrast,CIstablized characterizes the degree of eventual repairedness andhermiticity of the protective structure as it constantly fights againstthe fluctuating stress and damage. In the battery industry, it is oftendemanded that the ‘‘transient’’ CIn drops below 5 � 10�3 (CE 499.5%) in less than 10 cycles (graphite accomplishes this in 5 cyclesor less), reflecting the extreme rapidity of the self-healing of micron-scale commercial graphite particles. Another requirement is thatCIstablized needs to be smaller than 1� 10�3 (CEstablized 4 99.9%) forthe electrode to be considered commercially viable. From a full-cellperformance perspective, CEstablized = 0.99 (CIstablized = 0.01) isindeed poor and signifies significant mechanical instabilities ofthe SEI (if reversible shuttling could be excluded), therefore plottingCEn on a linear-scale hides really valuable diagnostic information.We recommend plotting CIn on the log-scale (Fig. 6b, red symbols).In actual experiments, one can also measure negative CIn data(CEn 4 1), for example when CI gets very small and the noise risesup to instrumentation precision. For these n, we will just plot �CIn
on the log-scale, but with a different color (Fig. 6b, green symbols).
We would also like to define a ‘‘coulombic inefficiencycumulant (CIC)’’, as
CICn �1
Qreð1ÞQreð1Þ �Qoxð1Þ½
þQreð2Þ �Qoxð2Þ þ � � � þQreðnÞ �QoxðnÞ�
¼ CI1 þQreð2ÞQreð1Þ
CI2 þ � � � þQreðnÞQreð1Þ
CIn
(4)
which is the cumulant of ‘‘capacity-weighted’’ individual-cyclecoulombic inefficiencies. If the coulombic inefficiency indeedreflects the ‘‘live Li’’ - ‘‘dead Li’’ conversion per cycle, CICn
should numerically represent the total percentage of conver-sion from ‘‘live Li’’ - ‘‘dead Li’’ in a lithium-matched (initialanode areal capacity = initial cathode areal capacity) full-cell,e.g. the ‘‘live’’ lithium exhaustion fraction. In lithium-constrainedfull cells, how CICn increases with n should thus give us a goodindication of how the full cell battery capacity decays with n, iflithium exhaustion is the main driver of (full-cell) capacity fade.We will test this hypothesis experimentally. To facilitate thecomparison, let us also define the actually measured ‘‘capacityfade fraction’’
Fn �1
Qreð1ÞQreð1Þ �QoxðnÞ½ � (5)
which compares the nth-cycle discharge capacity with the first-cycle charge capacity, which is a practical metric. By contrasting(4) with (5), we note that if
Qre(n0 + 1) = Qox(n0) (6)
for all n0 o n, then such a numerical comparison would beunnecessary because then mathematically
CICn = Fn (7)
We will show subsequently, with hard-pressed and partiallycracked Si@TiO2 in a slurry-pasted electrode, that our full-cellbattery gives CICn E Fn, but not exactly, which means (6) does nothold up exactly in reality. Nonetheless, CICn and Fn are bothcomputed based on experimental data and plotted against n anddiscussed, and their still significant agreement means the full-cellcapacity fade is indeed mainly driven by ‘‘live Li’’ - ‘‘dead Li’’conversions related to SEI growth.
For our materials, galvanostatic cycling from 0.01 to 1 V wasperformed in type 2032 coin cells. The Si@TiO2 electrodeexhibits a remarkable performance in half cells against super-abundant lithium metal. As shown in Fig. 5a, at a rate of0.05C, the first discharge and charge capacities are 2374 and1562 mA h g�1, respectively, giving an initial cycle CE1 = 65.8%,and then the specific capacity stabilizes at 1070 mA h g�1 for latercycles at 0.5C. Even after 1500 cycles, the gravimetric capacity is990 mA h g�1. CE can reach 99% in the 6th cycle, and 99.5% inthe 20th cycle. The voltage profiles for the different cycles areshown in Fig. S6 (ESI†). The shape of the profile does not changemuch from the 250th to the 1500th cycle, indicating the stableelectrochemical behavior of the Si@TiO2 cluster.
Energy & Environmental Science Paper
Publ
ishe
d on
06
Janu
ary
2017
. Dow
nloa
ded
by S
tanf
ord
Uni
vers
ity o
n 06
/01/
2017
21:
37:3
8.
View Article Online

Energy Environ. Sci. This journal is©The Royal Society of Chemistry 2017
This cycling stability is attributed to the mechanically robustTiO2 nanoshells. To further explore the structural integrity after1500 cycles, we used X-ray photoelectron spectroscopy (XPS) tomeasure the spatial distribution of the elements (Si, Ti, F, Li)under ion sputtering. Each sputtering will strip away a certain
thickness. As demonstrated in Fig. 5e, before sputtering, noSi signal could be detected while the intensity of Ti, F, Li(aSEI + nSEI elements) could be clearly seen. It is obvious thatsilicon was still under the protection of the aSEI + nSEI. Withincreasing sputtering times, peak density of Si gradually
Fig. 5 Electrochemical characterization of the Si@TiO2 pressed electrode. All specific capacities reported are based on the total mass of Si + TiO2.(a) Cycling life and the corresponding coulombic efficiency over 1500 cycles. The charge/discharge rate was C/20 for the first cycle, then C/10 for thenext 5 cycles, and C/2 (1C � 4.2 A g�1 Si) for the following cycles. The mass loading of all active materials was about 0.8 mg cm�2. (b) Full cellperformance of the Si@TiO2 cluster anode (2.1 mg cm�2) paired with a lithium cobalt oxide cathode. (c) SEM image of the Si@TiO2 crushed electrode(30 MPa) after 100 cycles (full cell); left part is with SEI and right part is after ion beam etching. (d) SEM image of the Si@aC crushed electrode (30 MPa)after 50 cycles. (e) Relative peak intensity (Si, Ti, F, and Li) of the Si@TiO2 cluster electrode after 1500 cycles of discharging and charging, measured byX-ray photoelectron spectroscopy (XPS) for 3 ion sputtering times; time 0 means before sputtering. (f) Electrode thickness variation. (g) Volumetricspecific capacity of Si@TiO2 vs. commercial graphite.
Paper Energy & Environmental Science
Publ
ishe
d on
06
Janu
ary
2017
. Dow
nloa
ded
by S
tanf
ord
Uni
vers
ity o
n 06
/01/
2017
21:
37:3
8.
View Article Online

This journal is©The Royal Society of Chemistry 2017 Energy Environ. Sci.
becomes intense while Ti tails away, as the sputtering strips theaSEI + nSEI shells and exposes the inner silicon.
While the yolk–shell design can effectively extend the cyclelife of silicon anodes and improve CEstabilized, it suffers from alow transient CEn (due to the larger surface area, the amount ofSEI formed is large), and low tap density. Pre-lithiation is aneffective approach to improve the low initial CE, even thoughthe cost of pre-lithiation technology used by industry is stillhigh. However, new and cheap pre-lithiation methods are beingdeveloped at laboratory scales.36–38 Besides, electrolyte additivessuch as FEC and VC39–41 can also improve the CE of the Sianode. On the other hand, the anode density could be improvedby mechanical compression, which inevitably would crack someaSEIs, leading to non-hermiticity and electrolyte ingression. It ishere that we expect the self-sealing and self-healing mechanismshown in Fig. 1 to play a central role.
To characterize the self-sealing ability of the Si@TiO2 clusterelectrode, a full-cell test, where the areal capacities of theanode and cathode are initially matched (‘‘Li-matched’’) to be3 mA h cm�2, was conducted. A high pressure (30 MPa) wasapplied to press and make the Si@TiO2 electrode. Fig. 5f showsthe electrode thickness variation at different stages of preparationand usage. Before pressing, the thickness of Si@TiO2 cast onto theCu foil was 50 mm, which changed to 14.7 mm after pressing. Afterovernight immersion in EC/DEC electrolyte, the electrode thick-ness increases to 16 mm. Some TiO2 encapsulations are inevitablycracked at such a high pressure (Fig. S9, ESI†). Surprisingly, theelectrode shows excellent full cell performance. As shown inFig. 5b, when paired with a commercial lithium cobalt oxide(LCO) cathode rated at 3 mA h cm�2, the crushed Si@TiO2
electrode exhibits stable cycling at industrially relevant levels ofareal current density. At a high mass loading of the Si@TiO2
cluster (2.1 mg cm�2), with a first discharge capacity of Qre(1) = 3mA h cm�2 to perfectly match that of commercial LCO cathode,a high areal capacity was attained (Fig. 5b, red circles), whichis above 1.6 mA h cm�2 even after 100 cycles at 0.7 mA cm�2
(see voltage profile in Fig. S12, ESI†). In addition, the elec-trode thickness increased by 22% (16 - 19.5 mm) afterthe first lithiation. After the 20th cycle (lithiation stage), whenthe CE gets as high as 99.5%, the electrode thickness was about17.2 mm (Fig. 5f). When the electrode was assembled in a coincell, a spring was inserted to accommodate the pressure andelectrode thickness variation. Such an external spring is acommon feature used in solid electrolyte/Li metal batteries tomaintain good contact: since our Si has a high capacity andvolume change like Li metal, and because our aSEI + nSEI aresolid electrolytes, we are well justified to use such spring loadsas well (the spring stiffness is B104 N m�1). During the firstdelithiation process, because of the compressing force from thespring, the electrode shrinks and the thickness decreases.During the second lithiation process, some of the Si loses electricalcontact and becomes inactive. These Si will not participate in thefollowing lithiation/delithiation process, and fail to contribute tothe volume expansion continuously, which is consistent with acapacity of 2.1 mA h cm�2. The whole aSEI + nSEI frameworkneeds some cycles to fully accommodate the Si volume change
under the spring load, in a ‘‘shake-down’’ process. That is why theelectrode thickness was increased during the first lithiationprocess and then decreased during the following cycles. Oncethe self-healing is done with a rigid hermetic solid-electrolyteskeleton around Si, the spring can be taken away.
Fig. 5c shows the structure of the Si@TiO2 cluster electrodeafter full cell cycling. The shell’s outer surface became thickerand rougher after the battery cycling, indicating the coating of anSEI on the TiO2 shell. It is very important to explore the innerintegrity of the nanostructured electrode. If the broken TiO2
shell fails to self-seal, a nSEI will grow on the surface of siliconand continuously consume lithium. Accumulated nSEIs willoccupy the inner empty space. Here, a focused ion beam (FIB)was used to cut the compressed Si@TiO2 electrode (Fig. 5cright). After ion beam etching, it is clear that the inner voidspace still remains, like the survival space in post-earthquakecrumbled buildings. The SEI must not grow on the inner siliconsurface after self-healing of cracked TiO2 shells, otherwise theaccumulated SEI will occupy almost all of the inner space, asFig. 5d shows for the crushed Si@aC electrode (30 MPa) aftercycling, where nSEI debris completely fills up electrode. So incontrast to Si@TiO2, a full-cell of Si@aC completely dies aftertens of cycles. As the anatase shell was in the lithiated stateduring cycling, to further verify the mechanical strength oflithiated anatase structure, acid (0.5 M HCl) was used to removethe surface SEI. Even after 100 cycles, the yolk–shell structurewas still maintained, indicating that the lithiated anatase shellwas mechanically stable during the charge/discharge processes(Fig. S13, ESI†). Fig. S14a (ESI†) shows the electrode thicknessafter 100 cycles for the SiMA. From the 20th (lithiation stage) to100th cycle (delithiation stage), the thickness increases byabout 0.6 mm (3.4%), which means almost no electrode volumechange during the later cycles, and a stable and hermeticaSEI + nSEI combination (Fig. 5f). For comparison, after 100 cycles,the electrode thickness increment of Si@aC is 66%, much higherthan that of Si@TiO2 (25.5%), which can be seen in Fig. S14b (ESI†).Based on the areal capacity and electrode thickness, the volumetriccapacity of the crushed Si@TiO2 cluster electrode is about 1100 mAh cm�3, two times the volumetric capacity of commercial graphite(550 mA h cm�3, Fig. 5g). The first CE is not high because the Sinano powder was still accessible to the electrolyte during the firstlithiation because some of the TiO2 shell was broken in the highpressure calendaring process and the electrolyte penetrated into theshell. The irreversible capacity contributed by the TiO2 shell (whichneeds to be lithiated to conduct Li+) in the first lithiation was verysmall (Fig. S15 and S16, ESI†).
The half-cell coulombic inefficiency over 1500 cycles isplotted in Fig. 6a on a logarithm scale. In about 20 cycles, theCI drops to a level below 0.005 (CE 4 99.5%). In about 100 cycles,the CI drops to a level below 0.001 (CE 4 99.9%). The read-outprecision of the electrochemical testing station we used is4 decimal digits, that is, CEn is at best reported as 0.9999or 1.0001, therefore we see clustering of the lowest data at1 � 10�4 after n 4 B300. This in itself does not signifyCEstablized reaching 99.99%, since we still have plenty of pointsat 2 � 10�4, 3 � 10�4, etc. What it is also showing, however,
Energy & Environmental Science Paper
Publ
ishe
d on
06
Janu
ary
2017
. Dow
nloa
ded
by S
tanf
ord
Uni
vers
ity o
n 06
/01/
2017
21:
37:3
8.
View Article Online

Energy Environ. Sci. This journal is©The Royal Society of Chemistry 2017
is the appearance of green circles (negative CI) at approximatelythe same frequency as the red circles after n B 800 or so, whichlargely cancel out the red circles (positive CI) in the running-window average, eqn (3). A strong long-term decreasing trend ofCIn is clear in Fig. 6a, signifying the self-adaptive repair of theSiMA toward near perfect hermiticity, that is, complete preventionof liquid electrolyte flooding of any Li-active Si. Since experimentallythere are temperature fluctuations and instrument noise, onceCEstablized is below 99.99% (the instrument precision) the greencircles would start to show up nearly as much as the red circles.
Fig. 6b and c compare the coulombic inefficiency of theSiMA half cell and full cell in the first 100 cycles, when themajor repairs are accomplished. While CI fluctuates more infull-cell configuration, the quantitative similarity between thehalf- and full-cell in terms of magnitude and timescale isstriking. To double-check, we ‘‘integrate’’ both Fig. 6b and cin the manner of eqn (4), to compute the coulombic inefficiencycumulant, CICn, shown in Fig. 6d (red and black). Agreeing withthe Fig. 6b and c comparison, the CIC curve shape and thevalue of the half cell and full cell are almost the same. After onehundred cycles, both CICs approach 65% (the red filled circlesare almost on top of the black filled circles in Fig. 6d aftern 4 50), which would suggest B60% ‘‘live’’ Li+ is lost. Theactual capacity loss (Fn) in the full cell was also plotted in
Fig. 6d as the blue circles. The magnitude and shape of Fn weresimilar to CICn, but the eventual full-cell capacity loss (Fn) wasonly about 45%, lower than 65%. This gentle disagreementbetween Fn and CICn, with the actual capacity being better thanthe CIC projection, is intriguing. We believe that there could beseveral reasons for this discrepancy, as we checked earlier,eqn (6) does not hold true exactly. It could mean there isshuttling in the liquid electrolyte,27,28 especially duringmechanical adjustments of the SEI and new nSEI formation,when species other than Li+ are soluble in the liquid electrolyteand can diffuse to the cathode and accomplish redox reactions.In any case, our full cell can indeed cycle stably with only 45%capacity loss at the 100th cycle, achieving an industriallyrelevant stabilized areal capacity of 1.6 mA h cm�2, with astabilized thickness of 17.8 mm that is only about 1/4 thethickness of the commercial graphite anode (55 mm). Eventhough the initial lithium loss is admittedly high (especiallyin the first 20 cycles), the full cell eventually does reach anindustrially satisfactory or even excellent level of CE. Duringthe transient stage, excess Li ions were needed to build up theself-defense, which can be accomplished cost-effectively bypre-lithiation, that is, using an additional source of ‘‘live Li’’so as to not tie down the heavy (expensive) transition metalelements like Co, Ni, Mn, Fe.36
Fig. 6 Coulombic inefficiency analysis of the Si@TiO2 cluster electrode. Coulombic inefficiency (CI = 1 � CE) was defined to reflect the lithium-ion lossin each cycle. (a) |CI| of the Si@TiO2 cluster (half cell) over 1500 cycles (vertical axis is in logarithmic scale). Red circles stand for CI 4 0, green circlesstand for CI o 0. Magenta circles stand for |CI| of Si@aC (half cell) over 200 cycles. Blue line stands for CI = 0.005. (b) CI of the half cell over 100 cycles(linear coordinates). (c) CI of the Si@TiO2 cluster electrode (full cell) over 100 cycles (linear coordinates). (d) Total lithium-ion loss and capacity losspercentage of the Si@TiO2 cluster electrode (half cell and full cell) over 100 cycles. Lithium loss was calculated using eqn (4) based on the CI of eachcycle. Capacity loss was the real measured capacity loss, eqn (5), in the lithium-constrained full cell.
Paper Energy & Environmental Science
Publ
ishe
d on
06
Janu
ary
2017
. Dow
nloa
ded
by S
tanf
ord
Uni
vers
ity o
n 06
/01/
2017
21:
37:3
8.
View Article Online

This journal is©The Royal Society of Chemistry 2017 Energy Environ. Sci.
In situ TEM lithiation/delithiation
The macro-tests worked well, to a degree we did not reallyanticipate at the beginning. To double check how the systemworks, we also applied in situ electrochemical TEM to directlymonitor the structural evolution during the lithiation/delithiationof the yolk–shell Si@TiO2 cluster. The experimental setup isschematically shown in Fig. S20a (ESI†), which is similar to thatin our previous work.42–44 Fig. S20c (ESI†) shows a series ofimages taken from the in situ lithiation/delithiation of theSi@TiO2 cluster (Movie S5, ESI†). Initially (0 s), pristine Sinanoparticles are visible within the TiO2 shell (15 nm). Whena bias potential of +5 V was applied, the Si particles expanded involume immediately as Li+ diffused through the TiO2 shell andreacted with the Si particles. As shown in the second image(53 s), the diameter of the silicon particle increased, and at thistime the silicon core was just partially lithiated, forming anamorphous LixSi shell/crystalline Si core structure. Later, theexpanding silicon touches the inner surface of the TiO2 shell,shown in the image (84 s). With continuous lithiation, theexpansive force exerted on the TiO2 shell grew larger and larger,and the TiO2 shell deforms to follow the expansion withoutgross structural failure. In the ensuing delithiation, the biasvoltage changes to �5 V, silicon shrinks to almost the originalsize, as shown in image (253 s). Then we repeat the lithiationprocess (260–312 s), and find surprisingly that even at such ahigh rate (discharging in Bminute, i.e. 60C), the TiO2 frame-work still retains overall integrity despite the load transfer at thecontacts with Si.
The in situ TEM experiments revealed important details.First, although TiO2 is thin and the void is not big enough, theTiO2 shell can bend and later deform without total disintegration.Second, the TiO2 cluster is robust enough at the ‘‘multi-cellulartissue’’ level, and can stay connected during lithiation/delithiationand does not disrupt the electron conduction path, which is animportant electrode decrepitation mechanism. Lithium cantransfer through the lithiated anatase shell and get inserted/extracted into/out of the silicon. The successful lithiation/delithiation indicates satisfactory contact between the TiO2
shells and Si particles. Indeed, the rate of Li diffusion throughthe TiO2 shell is fast enough to support 45–60C, which indicatesthat even though the Si core and TiO2 shell only come intocontact in a small area, high current densities and chargingrates are intrinsically achievable.
Conclusions
For the first time the speed and efficacy of self-repair of apressed yolk–shell electrode is systematically evaluated. It isshown that an exceptional degree of protection against liquidelectrolyte flooding of Li-active Si can be eventually established,even though the number of cycles and the initial Li loss it takesto achieve this final condition are admittedly high. However,these are not show stoppers for SiMAs, if effective means ofpre-lithiation can be devised, since the final electrode thicknessand volumetric/gravimetric specific capacities are still much
better than those of graphite. In long-term cycling, when self-healing was already completed and the aSEI + nSEI was fullysealed, the inner Si active materials will not touch the liquidelectrolyte and Li ions were transferred through the aSEI + nSEIsolid electrolyte, which means almost no side reaction occurs.Then the limited Li ions from the cathode can be cycledwithout loss for oxidation/reduction. The stabilized CE can beas high as 99.99%. From Fig. 6a it can be seen that a lot of greencircles (CI o 0) appeared after several hundred cycles. Ourstabilized CE actually already reached the machine precisionof the battery testing equipment, and lithium consumption inthe full cell can be reduced to essentially zero. The highlycompressed yolk–shell Si@TiO2 tissue, despite the unavoidableimperfections at the beginning, is surprisingly resilient functionallyand can achieve a startling level of specific capacities and stabilizedcoulombic efficiency at low cost, making lithium-constrained full-cell cycling of a silicon-majority anode (SiMA) an imminent reality.
ExperimentalSynthesis of yolk–shell Si@TiO2 powder
First, 7 g of glucose was fully dissolved in 70 ml of DI water andthen transferred to a 80 ml Teflon autoclave, then 50 mg ofcommercial silicon nanoparticles (o100 nm, Sigma Aldrich)was added under sonication. After 30 min of sonication, theautoclave was put in an oven at a temperature of 170 1C for 8 h.The brownish Si@C core–shell particles were harvested by threerounds of centrifugation/washing/sonication in water and absoluteethanol and subsequently dried under vacuum for more than 4 h.Generally speaking, commercial Si nanoparticles with higheruniformity and smaller diameters cost more. Here we chooserelatively cheap commercial Si nanoparticles with a wide diameterrange of 20–200 nm (Fig. S1a, ESI†). After the hydrothermalprocess in glucose solution, peanut-like Si@C structures wereformed with typical diameters of 300–600 nm (Fig. S1b, ESI†).100 mg of the Si@C core–shell particles above was dispersed in20 mL of absolute ethanol and sonicated for about 10 min toavoid the agglomeration of the particles. Subsequently, a certainamount of titanium isopropoxide (TIPP) was added into thebrownish solution and aged for about 10 h. After aging, thesolution was subjected to 3 rounds of centrifugation/ethanolwash/sonication subsequently and dried in a vacuum oven formore than 8 h. The resultant powder was annealed in a furnaceat 550 1C for 2 h with a heating rate of 10 1C min�1 and the finalmulti-yolks–shell Si@TiO2 powder was obtained.
Characterization
XRD was carried out using a Bruker D8-Advance diffractometerwith Ni filtered Cu Ka radiation. The applied current andvoltage were 40 mA and 40 kV, respectively. During the analysis,the sample was scanned from 10 to 701 at a speed of 41 min�1.SEM images were collected using a FEI Sirion scanning electronmicroscope (accelerating voltage 5 kV) equipped for energy-dispersive X-ray spectroscopy, and TEM images were collectedon a JEOL JEM-2010 transmission electron microscope operated
Energy & Environmental Science Paper
Publ
ishe
d on
06
Janu
ary
2017
. Dow
nloa
ded
by S
tanf
ord
Uni
vers
ity o
n 06
/01/
2017
21:
37:3
8.
View Article Online

Energy Environ. Sci. This journal is©The Royal Society of Chemistry 2017
at 200 kV. TG-DTA analysis was performed using a Netzsch STA449 with an air flow at a heating rate of 10 1C min�1 from roomtemperature to 600 1C under a simulated air atmosphere(20% O2/80% N2, both are ultrapurity grade gases from Airgas).X-ray photoelectron spectroscopy (XPS, Phi5000 VersaProbe,Ulvac-Phi) was carried out with Al Ka radiation.
In situ transmission electron microscopy (TEM) of lithiation/delithiation
A Nanofactory TEM holder was used in the experiment. Theholder was equipped with a 3D piezo-manipulator and hadelectrical biasing capability. Si@TiO2 clusters were attached toa tungsten probe using a conducting epoxy (ChemtronicsCW2400) and mounted on one side of the holder. On the otherside, we mounted another tungsten rod after scratching a pieceof Li metal to transfer a small piece of Li to the tip. The Si@TiO2
clusters and the piece of Li metal were brought into contactinside the TEM. By applying a voltage to the working electrode(Si@TiO2 clusters) versus the counter electrode (Li), Li+ ionsdiffuse through the oxide/nitride layer on the Li metal and reactwith the Si@TiO2 particles at the working electrode. To drivethe Li+ into Si@TiO2, a bias of �5.0 V was applied to theworking electrode with respect to the Li metal for the lithiation,and +5.0 V was used for the delithiation. The experiment wasperformed using a JEOL 2010F TEM operated with a 200 kVacceleration voltage. The movies in the ESI† were recorded at arate of 5 frames per s.
In situ TEM compression experiments
A similar setup to that described above was used for thecompression test of the C and TiO2 shells and Si@TiO2 cluster.An atomic force microscopy (AFM) probe (Nanosensors PPP-NCHR)with a spring constant of 30 N m�1 was attached to the tip of thegold wire using a conducting epoxy (Chemtronics CW2400). Eitherthe aC or TiO2 shells or the Si@TiO2 cluster was attached to thetungsten probe by bringing the tungsten probe with conductingepoxy on the tip into contact with the powder of the shells. The goldwire and the tungsten probe were then mounted on a NanofactorySTM-TEM holder. Using the 3D piezo-manipulator, the shell wasbrought into contact with the cantilever tip and compression wasapplied to the shell by giving a displacement (D) against thecantilever. The schematic illustration of the setup and the TEMimage are shown in Fig. 3a. The force acting on the shell wascalculated by measuring the deflection of the cantilever tipduring the compression. Other conditions were the same asthose used in the lithiation/delithiation experiment.
Electrode fabrication
The SiMA electrode was prepared by mixing Si@TiO2 (70.0 wt%),15.0 wt% conductive carbon black (Super C65, Timcal), and15.0 wt% poly(vinylidene fluoride) binder (Sigma-Aldrich) inN-methyl-2-pyrrolidinone solvent (Sigma-Aldrich). The obtainedslurry was coated onto 15 mm thickness copper foil and dried at60 1C in a vacuum oven for 12 h. The samples were then pressed(20 MPa for half cell and 30 MPa for full cell) and cut into 1 cm2
disks at a mass loading of 0.8–2.1 mg cm�2 (active material,
including Si and TiO2). For pressing, the cast electrode wasplaced between two pieces of Cu foil and transferred into a coldpressing machine (MTI). The applied pressure is displayed onthe pressure gauge. Before pressing, the thickness of Si@TiO2
cast onto the Cu foil was 50 mm, which changed to 14.7 mm afterpressing. 2032 coin cells were assembled in an Ar-filled gloveboxusing these working electrodes with a polymer separator(Celgard 2250). Li metal (Alfa Aesar) was used as the counterelectrode (half cell) and lithium cobalt oxide (LCO) was used asthe cathode (full cell). 80 mL of 1.0 M LiPF6 in 89 vol% 1 : 1 w/wethylene carbonate/diethyl carbonate (BASF Selectilyte LP40)with 10 vol% fluoroethylene carbonate and 1 vol% vinylenecarbonate (Novolyte Technologies) was added as the electrolyte.The full cell configuration consists of Si@TiO2 clusters as theanode and LCO as the cathode. The mass loading of theSi@TiO2 electrode (11 mm diameter) was 2.1 mg cm�2, givingan stable areal capacity of 2.0 mA h cm�2 at a current densityof 0.7 mA cm�2 (initial discharge capacity: 3.0 mA h cm�2)(Fig. S10, ESI†) when Li metal was used as the counter electrode.The stable areal capacity of the LCO cathode (9 mm diameter)tested with Li metal as the counter electrode was 2.6 mA h cm�2
(initial charge capacity of 3.0 mA h�1) at a current density of0.7 mA cm�2 (Fig. S11, ESI†). The initial CE of LCO was 94.5%.Charge/discharge rates were calculated based on silicon’stheoretical capacity (4200 mA h g�1 Si). All the coin cells wereloaded into a battery test (LAND 2001 CT battery tester) and cycledbetween 0.01 and 1 V (half cells) and 2.8 and 4.2 V (full cells).
Author contributions
J. L. and Y. C. conceived the project. Y. J. and S. L. synthesizedsamples and performed the battery tests. A. K. conducted all thein situ TEM measurements. J. S. and R. F. Z. performed thecharacterization. All authors analyzed the data and contributedto the discussion. Y. J., S. L., Y. C. and J. L. wrote the manuscript.
Acknowledgements
J. L. acknowledges support from NSF ECCS-1610806. Y. C.acknowledges the support from the Assistant Secretary forEnergy Efficiency and Renewable Energy, Office of VehicleTechnologies of the U. S. Department of Energy under the BatteryMaterials Research (BMR) Program. Y. J. acknowledges the supportfrom the Chinese Scholarship Council. S. L. acknowledges supportfrom Tongji University and the National Natural Science Foundationof China (NSFC–No. 51602222 and 51632001).
Notes and references
1 M. Armand and T. J. M. Arascon, Nature, 2008, 451, 652.2 A. S. Arico, P. Bruce, B. Scrosati, J. M. Tarascon and
V. W. Schalkwijk, Nat. Mater., 2005, 4, 366.3 C. K. Chan, H. Peng, G. Liu, K. McIlwrath, X. F. Zhang,
R. A. Huggins and Y. Cui, Nat. Nanotechnol., 2008, 3, 31.
Paper Energy & Environmental Science
Publ
ishe
d on
06
Janu
ary
2017
. Dow
nloa
ded
by S
tanf
ord
Uni
vers
ity o
n 06
/01/
2017
21:
37:3
8.
View Article Online

This journal is©The Royal Society of Chemistry 2017 Energy Environ. Sci.
4 I. H. Son, J. H. Park, S. Kwon, S. Park, M. H. Rummeli,Al. Bachmatiuk, H. J. Song, J. Ku, J. W. Choi, J. Choi,S. G. Doo and H. Chang, Nat. Commun., 2015, 6, 7393.
5 C. M. Wang, X. L. Li, Z. G. Wang, W. Xu, J. Liu, F. Gao,L. Kovarik, J. G. Zhang, J. H. Howe, D. J. Burton, Z. Y. Liu,X. C. Xiao, S. Thevuthasan and D. R. Baer, Nano Lett., 2012,12, 1624.
6 M. N. Obrovac, L. Christensen, D. B. Le and J. R. Dahn,J. Electrochem. Soc., 2007, 154, A849.
7 F. F. Shi, Z. C. Song, P. N. Ross, G. A. Somorjai, R. O. Ritchieand K. Komvopoulos, Nat. Commun., 2016, 7, 11886.
8 M. Y. Nie, D. P. Abraham, Y. J. Chen, A. Bose and B. L. Lucht,J. Phys. Chem. C, 2013, 117, 13403.
9 C. K. Chan, R. Ruffo, S. S. Hong, R. Huggins and Y. Cui,J. Power Sources, 2009, 189, 1132.
10 S. Chen, P. Bao, X. Huang, B. Sun and G. Wang, Nano Res.,2014, 7, 85.
11 X. L. Li, M. Gu, S. Y. Hu, R. Kennard, P. F. Yan, X. L. Chen,C. M. Wang, M. J. Sailor, J. G. Zhang and J. Liu Li, Nat.Commun., 2014, 5, 5105.
12 M. Gu, Y. Li, X. L. Li, S. Y. Hu, X. W. Zhang, W. Xu,S. Thevuthasan, D. R. Baer, J. G. Zhang, J. Liu andC. M. Wang, ACS Nano, 2012, 6, 8439.
13 Y. Li, K. Yan, H. W. Lee, Z. D. Lu, N. Liu and Y. Cui, Nat.Energy, 2016, 1, 15029.
14 Y. M. Sun, N. Liu and Y. Cui, Nat. Energy, 2016, 1, 16071.15 H. Wu, G. Zheng, N. Liu, T. J. Carney, Y. Yang and Y. Cui,
Nano Lett., 2012, 12, 904.16 B. Wang, X. Li, X. Zhang, B. Luo, Y. Zhang and L. Zhi, Adv.
Mater., 2013, 25, 3560.17 X. Zhou, Y. X. Yin, L. J. Wan and Y. G. Guo, Chem. Commun.,
2012, 48, 2198.18 S. Chen, M. L. Gordin, R. Yi, G. Howlett, H. Sohna and
D. H. Wang, Phys. Chem. Chem. Phys., 2012, 14, 12741.19 J. Y. Luo, X. Zhao, J. S. Wu, H. D. Jang, H. H. Kung and
J. X. Huang, J. Phys. Chem. Lett., 2012, 3, 1824.20 L. Y. Beaulieu, K. W. Eberman, R. L. Turner, L. J. Krause and
J. R. Dahn, Electrochem. Solid-State Lett., 2001, 4, A137.21 H. Wu, G. Chan, J. W. Choi, I. Ryu, Y. Yao, M. T. McDowell,
S. W. Lee, A. Jackson, Y. Yang, L. B. Hu and Y. Cui, Nat.Nanotechnol., 2012, 7, 310–315.
22 N. Liu, H. Wu, M. T. McDowell, Y. Yao, C. M. Wang andY. Cui, Nano Lett., 2012, 12, 3315.
23 D. C. Lin, Z. D. Lu, P. C. Hsu, H. R. Lee, N. Liu, J. Zhao,H. T. Wang, C. Liu and Y. Cui, Energy Environ. Sci., 2015, 8, 2371.
24 N. Liu, Z. D. Lu, J. Zhao, M. T. McDowell, H. W. Lee,W. T. Zhao and Y. Cui, Nat. Nanotechnol., 2014, 9, 187.
25 M. J. Mayo, R. W. Siegel, A. Narayanasamy and W. D. Nix,J. Mater. Res., 1990, 5, 1073.
26 H. Ren, R. B. Yu, J. Y. Wang, Q. Jin, M. Yang, D. Mao, D. Kisailus,H. J. Zhao and D. Wang, Nano Lett., 2014, 14, 6679.
27 S. Li, J. J. Niu, Y. C. Zhao, K. P. So, C. Wang, C. A. Wang andJ. Li, Nat. Commun., 2015, 6, 7872.
28 Z. Zhu, A. Kushima, Z. Y. Yin, L. Qi, K. Amine, J. Lu and J. Li,Nat. Energy, 2016, 1, 16111.
29 S. Li, S. O. Halperinb and C. A. Wang, Mater. Chem. Phys.,2015, 149, 1.
30 X. M. Sun and Y. D. Li, Angew. Chem., Int. Ed., 2004, 43, 597.31 Q. Wang, et al., Monodispersed hard carbon spherules with
uniform nanopores, Carbon, 2001, 39, 2211–2214.32 X. M. Sun and Y. D. Li, J. Colloid Interface Sci., 2005, 291, 7.33 V. Privman, Ann. N. Y. Acad. Sci., 2009, 1161, 508.34 V. K. Lamer, Ind. Eng. Chem., 1952, 44, 1270.35 V. K. Lamer and R. H. Dinegar, J. Am. Chem. Soc., 1950,
72, 4847.36 J. Zhao, Z. D. Lu, H. T. Wang, W. Liu, H. W. Lee, K. Yan, D. Zhuo,
D. C. Lin, N. Liu and Y. Cui, J. Am. Chem. Soc., 2015, 137, 8372.37 J. Zhao, H.-W. Lee, J. Sun, K. Yan, Y. Liu, W. Liu, Z. Lu,
D. Lin, G. Zhou and Y. Cui, Proc. Natl. Acad. Sci. U. S. A.,2016, 113, 7408–7413.
38 Y. Sun, H.-W. Lee, Z. W. Seh, N. Liu, J. Sun, Y. Li and Y. Cui,Nat. Energy, 2016, 1, 15008.
39 S. Dalavia, P. Gudurub and B. L. Luchta, J. Electrochem. Soc.,2012, 159, A642–A646.
40 C. Xu, F. Lindgren, B. Philippe, M. Gorgoi, F. Bjorefors, K. Edstromand T. Gustafsson, Chem. Mater., 2015, 27, 2591–2599.
41 L. Chen, K. Wang, X. Xie and J. Xie, Electrochem. Solid-StateLett., 2006, 9, A512–A515.
42 A. Kushima, X. H. Liu, G. Zhu, Z. L. Wang, J. Y. Huang andJ. Li, Nano Lett., 2011, 11, 4535.
43 J. Y. Huang, L. Zhong, C. M. Wang, J. P. Sullivan, W. Xu, L. Q.Zhang, S. X. Mao, N. S. Hudak, X. H. Liu, A. Subramanian,H. Y. Fan, L. Qi, A. Kushima and J. L. Huang, Science, 2010,330, 1515.
44 X. H. Liu, Y. Liu, A. Kushima, S. L. Zhang, T. Zhu, J. Li andJ. Y. Huang, Adv. Energy Mater., 2012, 2, 722.
Energy & Environmental Science Paper
Publ
ishe
d on
06
Janu
ary
2017
. Dow
nloa
ded
by S
tanf
ord
Uni
vers
ity o
n 06
/01/
2017
21:
37:3
8.
View Article Online