energy consumption prediction models for theretail sector · energy consumption prediction models...
TRANSCRIPT
Loughborough UniversityInstitutional Repository
Energy consumptionprediction models for the
retail sector
This item was submitted to Loughborough University's Institutional Repositoryby the/an author.
Citation: SPYROU, M.S. ... et al, 2011. Energy consumption predictionmodels for the retail sector. Presented at: CIBSE Technical Symposium, 6th-7th September 2011, DeMontfort University, Leicester UK
Additional Information:
• This is a conference paper.
Metadata Record: https://dspace.lboro.ac.uk/2134/18438
Version: Published
Publisher: CIBSE
Rights: This work is made available according to the conditions of the Cre-ative Commons Attribution-NonCommercial-NoDerivatives 4.0 International(CC BY-NC-ND 4.0) licence. Full details of this licence are available at:https://creativecommons.org/licenses/by-nc-nd/4.0/
Please cite the published version.
CIBSE Technical Symposium, De Montfort University, Leicester UK – 6th and 7th September 2011
Page 1 of 19
Energy Consumption Prediction Models for the Retail Sector
Maria Spyrou*,a,b, Malcolm J Cooka, Kirk Shanksa, Richard Leeb, James Conlinb
* Corresponding author, [email protected], Tel. 01707 360090. a Department of Civil and Building Engineering, Loughborough University, Loughborough,
Leicestershire, LE11 3TU. b Tesco Stores Ltd, Cirrus B, Shire Park, Welwyn Garden City, Hertfordshire, AL7 1AB.
Abstract The ability to analyse and accurately forecast future events is becoming increasingly important as most management decisions depend on them. This is especially evident for the retail sector, mainly because of the small margins that the sector is working within, alongside the increasing prices of electricity and gas. Tesco, as the market leader, wishes to be at the forefront of research and make a step change in their ability to forecast and reduce the energy consumption of their buildings. This work presents the various benchmarking methods available in the UK, Europe and the US, including CIBSE TM46, ISA, and ASHRAE benchmarks. The mathematical techniques employed to access the predictions obtained using these benchmarking and forecasting methods are discussed as well as the analysis and forecasting methods used by the industry. The research reported throughout this paper uses energy data obtained from the Tesco estate to draw correlations with weather, sales’ floor area, sales and other factors that might affect the energy consumption. Initial results regarding the effect these factors have on the energy consumption of buildings in the Tesco estate are presented. Keywords Energy Consumption, Tesco, Prediction Model, Retail, Benchmarks Acknowledgments The authors would like to thank the Engineering and Physical Sciences Research Council (EPSRC) and Tesco Stores Ltd for funding this project.
1. Introduction Currently in the UK there are approximately 8000 supermarkets and superstores occupying more than 300m2 of sales area. Most of these stores (5400) are operated by the four largest supermarket chains: Tesco, ASDA, Sainsbury’s and Morrisons [i]. At the beginning of 2011 Tesco was reported to be the market leader, with a share of 30.3%, followed by ASDA at 16.9%, Sainsbury’s at 16.5% and Morrisons at 12.3%. The remaining 24% was shared by smaller chains such as Somerfield, Waitrose, Iceland, Co-op and other multiple chains and independents [ii]. Supermarkets are responsible for more than 3% of the total electricity consumption in the UK and around 1% of the total CO2 emissions of the UK [iii]. As stated in [iv]:
CIBSE Technical Symposium, De Montfort University, Leicester UK – 6th and 7th September 2011
Page 2 of 19
“Supermarkets are seeking to improve energy efficiency in order to make cost savings and enhance their image”.
As the market leader, Tesco aims to be at the forefront of research and make a step change in improving the energy efficiency of their buildings. The company is operating more than 2000 stores in the UK. Specifically, on the 1st of November 2010, its estate was composed of 212 Extra storesa, 470 Superstoresb, 186 Metrosc and 1285 Express storesd. In its latest Corporate Responsibility Report, Tesco pledged to become a “zero-carbon business by 2050”. There is no official scientific explanation for zero-carbon, so, it is suggested that Tesco is aiming to become a carbon neutral business. Oxford English Dictionary defines “carbon neutral” as:
“Making or resulting in no net release of carbon dioxide into the atmosphere, especially as a result of carbon offsetting.”
For a company of this size, it is a significant challenge to become carbon neutral as there are many factors affecting their footprint, such as electricity consumption in stores and offices, refrigerants, transportation of products, and even business travel [v]. In 2010 the total electricity consumption of all the UK Tesco stores amounted to 1% of the UK’s energy consumption [vi]. Therefore, it is significant to note that by reducing Tesco’s consumption by 10%, the whole consumption of the UK can be reduced by 0.1% (0.35GWh). Section 2 of this paper presents the various methods reported in the literature for analysing, assessing and forecasting the energy consumption of commercial buildings. It documents benchmarking methods and statistics published internationally and introduces forecasting techniques used within the industry. Methods used for data gathering and quality are included in Section 3; Section 4 includes initial results regarding the factors that affect the energy consumption of stores. Conclusions are drawn in Section 5 along with suggestions for further research.
2. Energy Benchmarks and prediction techniques
2.1. UK Benchmarks
As the British Retail Consortium website [vii] advises, British retailers are impacted by two government regulations: the Display Energy Certificates (DECs) and the Carbon Reduction Commitment (CRC) energy efficiency scheme. The DECs are based on metered energy consumption and should reveal how effectively a building is being operated. They aim to motivate the building operators to become more energy efficient by raising public awareness of energy use. In terms of calculating the Operational Rating for each building, the following are taken into account:
“-Category of the building (as described by TM46, CIBSE) -Location (postcode, building name, address)
a Extra stores have a net floor area over 60 000ft2 ≈ 5 570m2. b Superstores have a net floor area between 20 000 - 50 000ft2 ≈ 1 860 - 4 650 m2. c Metros have a net floor area between 7 000-15 000ft2 ≈ 650 - 1 400 m2. d Express stores have a net floor area under 3 000ft2 ≈ 280 m2.
CIBSE Technical Symposium, De Montfort University, Leicester UK – 6th and 7th September 2011
Page 3 of 19
-Energy consumption (meter readings or suppliers estimates) and measurement period -Building (or site) area and how it has been defined -Separable energy uses- if any -Recorded hours of occupancy”
Looking into the way the building’s area is defined, the Building Regulations Approved Document L2A (2006) [viii] defines the total useful floor area (TUFA) as the:
“Total area of all enclosed spaces measured to the internal face of the external walls, that is to say it is the gross floor area as measured in accordance with the guidance issued to surveyors by the RICS.”
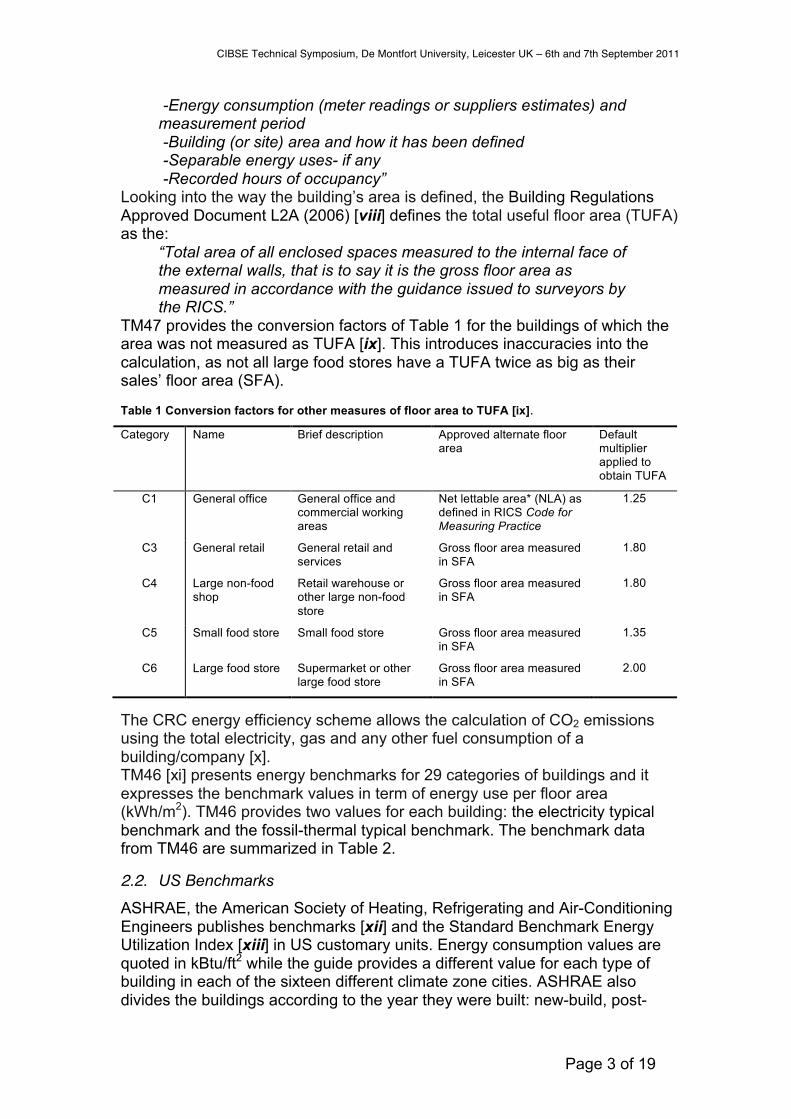
TM47 provides the conversion factors of Table 1 for the buildings of which the area was not measured as TUFA [ix]. This introduces inaccuracies into the calculation, as not all large food stores have a TUFA twice as big as their sales’ floor area (SFA). Table 1 Conversion factors for other measures of floor area to TUFA [ix].
Category Name Brief description Approved alternate floor area
Default multiplier applied to obtain TUFA
C1 General office General office and commercial working areas
Net lettable area* (NLA) as defined in RICS Code for Measuring Practice
1.25
C3 General retail General retail and services
Gross floor area measured in SFA
1.80
C4 Large non-food shop
Retail warehouse or other large non-food store
Gross floor area measured in SFA
1.80
C5 Small food store Small food store Gross floor area measured in SFA
1.35
C6 Large food store Supermarket or other large food store
Gross floor area measured in SFA
2.00
The CRC energy efficiency scheme allows the calculation of CO2 emissions using the total electricity, gas and any other fuel consumption of a building/company [x]. TM46 [xi] presents energy benchmarks for 29 categories of buildings and it expresses the benchmark values in term of energy use per floor area (kWh/m2). TM46 provides two values for each building: the electricity typical benchmark and the fossil-thermal typical benchmark. The benchmark data from TM46 are summarized in Table 2.
2.2. US Benchmarks
ASHRAE, the American Society of Heating, Refrigerating and Air-Conditioning Engineers publishes benchmarks [xii] and the Standard Benchmark Energy Utilization Index [xiii] in US customary units. Energy consumption values are quoted in kBtu/ft2 while the guide provides a different value for each type of building in each of the sixteen different climate zone cities. ASHRAE also divides the buildings according to the year they were built: new-build, post-
CIBSE Technical Symposium, De Montfort University, Leicester UK – 6th and 7th September 2011
Page 4 of 19
1980 and pre-1980; these values are summarized in Table 2. The floor area used for these calculations is defined as the:
“Total interior floor area of a building’s spaces, measured from the inside surface of the exterior walls or from the interior surface of walls in common with adjoining buildings. The area of interior columns and pillars is included in this measurement. This metric is measured on a floor-by-floor basis and consists of all enclosed spaces, including the area of interior walls, basements, mezzanines, penthouses, equipment rooms, vertical penetrations on each floor (such as elevator shafts, and stairwells), and interior parking. It does not include open covered walkways, courtyards with no roof, balconies, and canopies”[xiv]. [xv].
Another benchmarking and rating system, mainly used in the US, is the Leadership in Energy and Environmental Design (LEED) [xvi]. In order to obtain LEED certification a building needs to comply with one of the following: • ASHRAE standard ISO 90.1-2010, use modelling software to simulate energy consumption/savings of the building. • ASHRAE Advanced Energy Design Guide, which is a descriptive guide describing ways to save energy, such as refits. • Advanced Buildings Core Performance Guide in addition to a credit earning system, to grade buildings [xvii].
2.3. EU Benchmarks
The International Sustainability Alliance (ISA) published a report in 2010 [xviii] giving different benchmark values for the energy consumption of buildings in Europe. ISA does not provide the reader with more specifics on how the energy intensity of the buildings is calculated. The benchmark values published by ISA are also summarised in Table 2. The European Commission for energy defines the area of buildings in square meters of useful floor area (UFA) [xix].
“The UFA of a building is measured within its external walls, excluding: -Construction areas (e.g areas of demarcation components, supports, columns, pillars, shafts, chimneys), -functional areas for ancillary use (e.g. areas occupied by heating and air conditioning installations or by power generators), -thoroughfares (e.g. areas of stairwells, lifts, escalators).”
BREEAM (Building Research Establishment Environmental Assessment Method) is an “environmental assessment method” and “rating system” [xx]. It is primarily used in the UK but has also been developed for other European countries, such as the Netherlands and Spain. There are various schemes one can follow, including BREEAM New Construction, BREEAM Refurbishment, and BREEAM In-Use; depending on the construction stage of the building. The Building Research Establishment (BRE) has not developed independent energy consumption benchmarks for the rating system, but uses the ISA benchmark values. The scheme covers ten categories including Management,
CIBSE Technical Symposium, De Montfort University, Leicester UK – 6th and 7th September 2011
Page 5 of 19
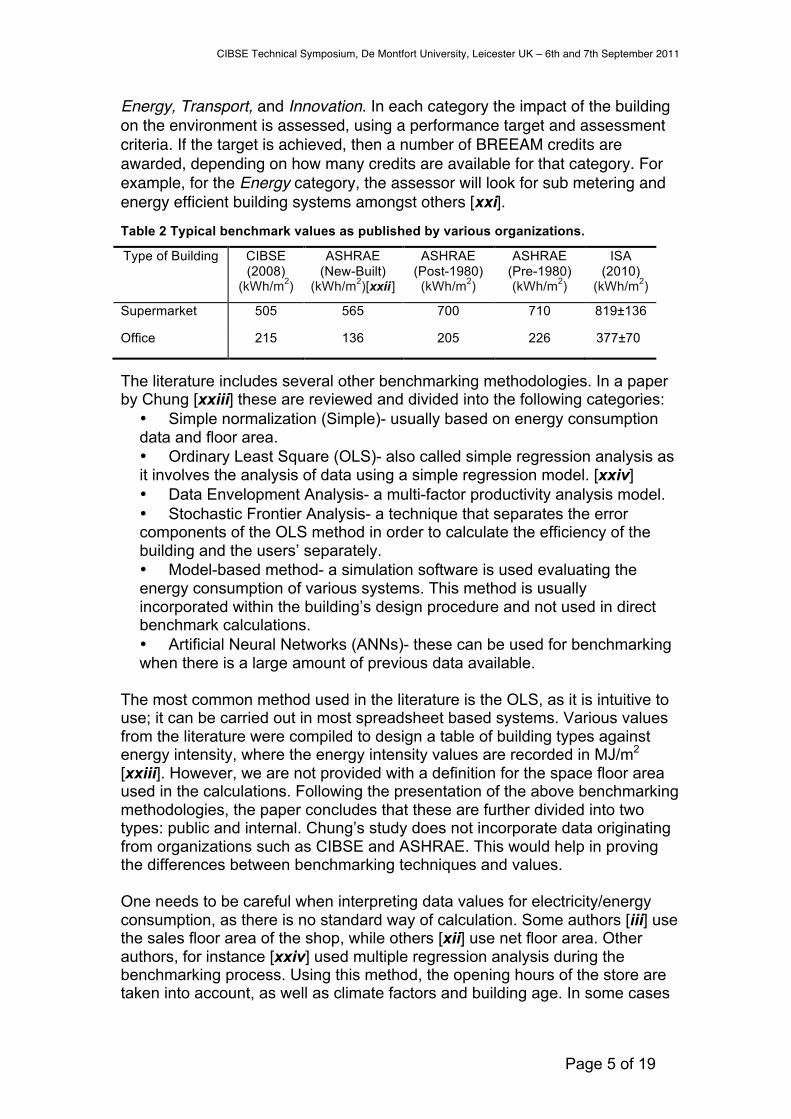
Energy, Transport, and Innovation. In each category the impact of the building on the environment is assessed, using a performance target and assessment criteria. If the target is achieved, then a number of BREEAM credits are awarded, depending on how many credits are available for that category. For example, for the Energy category, the assessor will look for sub metering and energy efficient building systems amongst others [xxi]. Table 2 Typical benchmark values as published by various organizations.
Type of Building CIBSE (2008)
(kWh/m2)
ASHRAE (New-Built)
(kWh/m2)[xxii]
ASHRAE (Post-1980) (kWh/m2)
ASHRAE (Pre-1980) (kWh/m2)
ISA (2010)
(kWh/m2)
Supermarket 505 565 700 710 819±136
Office 215 136 205 226 377±70
The literature includes several other benchmarking methodologies. In a paper by Chung [xxiii] these are reviewed and divided into the following categories: • Simple normalization (Simple)- usually based on energy consumption data and floor area. • Ordinary Least Square (OLS)- also called simple regression analysis as it involves the analysis of data using a simple regression model. [xxiv] • Data Envelopment Analysis- a multi-factor productivity analysis model. • Stochastic Frontier Analysis- a technique that separates the error components of the OLS method in order to calculate the efficiency of the building and the users’ separately. • Model-based method- a simulation software is used evaluating the energy consumption of various systems. This method is usually incorporated within the building’s design procedure and not used in direct benchmark calculations. • Artificial Neural Networks (ANNs)- these can be used for benchmarking when there is a large amount of previous data available.
The most common method used in the literature is the OLS, as it is intuitive to use; it can be carried out in most spreadsheet based systems. Various values from the literature were compiled to design a table of building types against energy intensity, where the energy intensity values are recorded in MJ/m2
[xxiii]. However, we are not provided with a definition for the space floor area used in the calculations. Following the presentation of the above benchmarking methodologies, the paper concludes that these are further divided into two types: public and internal. Chung’s study does not incorporate data originating from organizations such as CIBSE and ASHRAE. This would help in proving the differences between benchmarking techniques and values. One needs to be careful when interpreting data values for electricity/energy consumption, as there is no standard way of calculation. Some authors [iii] use the sales floor area of the shop, while others [xii] use net floor area. Other authors, for instance [xxiv] used multiple regression analysis during the benchmarking process. Using this method, the opening hours of the store are taken into account, as well as climate factors and building age. In some cases
CIBSE Technical Symposium, De Montfort University, Leicester UK – 6th and 7th September 2011
Page 6 of 19
total energy consumption for a year is used; other authors use the average weekly consumption of stores for a year.
2.4. Tesco Benchmarks and energy consumption
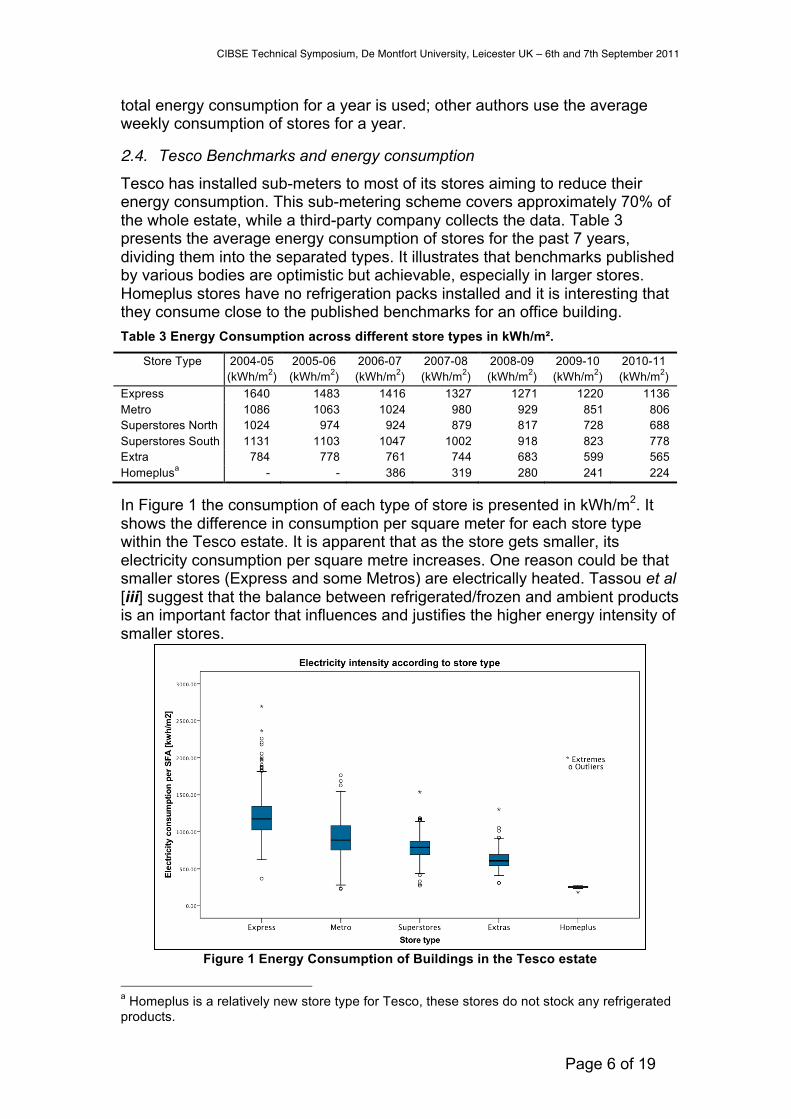
Tesco has installed sub-meters to most of its stores aiming to reduce their energy consumption. This sub-metering scheme covers approximately 70% of the whole estate, while a third-party company collects the data. Table 3 presents the average energy consumption of stores for the past 7 years, dividing them into the separated types. It illustrates that benchmarks published by various bodies are optimistic but achievable, especially in larger stores. Homeplus stores have no refrigeration packs installed and it is interesting that they consume close to the published benchmarks for an office building. Table 3 Energy Consumption across different store types in kWh/m².
Store Type 2004-05 (kWh/m2)
2005-06 (kWh/m2)
2006-07 (kWh/m2)
2007-08 (kWh/m2)
2008-09 (kWh/m2)
2009-10 (kWh/m2)
2010-11 (kWh/m2)
Express 1640 1483 1416 1327 1271 1220 1136 Metro 1086 1063 1024 980 929 851 806 Superstores North 1024 974 924 879 817 728 688 Superstores South 1131 1103 1047 1002 918 823 778 Extra 784 778 761 744 683 599 565 Homeplusa - - 386 319 280 241 224 In Figure 1 the consumption of each type of store is presented in kWh/m2. It shows the difference in consumption per square meter for each store type within the Tesco estate. It is apparent that as the store gets smaller, its electricity consumption per square metre increases. One reason could be that smaller stores (Express and some Metros) are electrically heated. Tassou et al [iii] suggest that the balance between refrigerated/frozen and ambient products is an important factor that influences and justifies the higher energy intensity of smaller stores.
Figure 1 Energy Consumption of Buildings in the Tesco estate
a Homeplus is a relatively new store type for Tesco, these stores do not stock any refrigerated products.
CIBSE Technical Symposium, De Montfort University, Leicester UK – 6th and 7th September 2011
Page 7 of 19
2.5. Analysis and prediction techniques
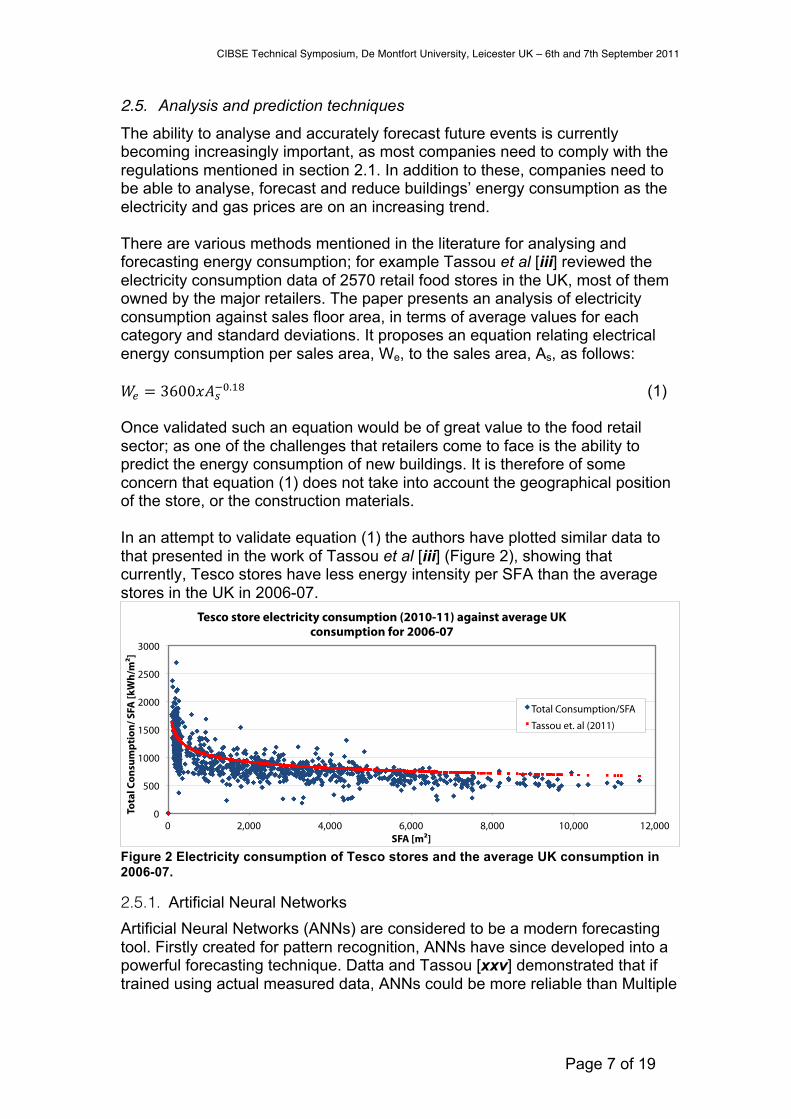
The ability to analyse and accurately forecast future events is currently becoming increasingly important, as most companies need to comply with the regulations mentioned in section 2.1. In addition to these, companies need to be able to analyse, forecast and reduce buildings’ energy consumption as the electricity and gas prices are on an increasing trend. There are various methods mentioned in the literature for analysing and forecasting energy consumption; for example Tassou et al [iii] reviewed the electricity consumption data of 2570 retail food stores in the UK, most of them owned by the major retailers. The paper presents an analysis of electricity consumption against sales floor area, in terms of average values for each category and standard deviations. It proposes an equation relating electrical energy consumption per sales area, We, to the sales area, As, as follows: !! = 3600!!!!!.!" (1) Once validated such an equation would be of great value to the food retail sector; as one of the challenges that retailers come to face is the ability to predict the energy consumption of new buildings. It is therefore of some concern that equation (1) does not take into account the geographical position of the store, or the construction materials. In an attempt to validate equation (1) the authors have plotted similar data to that presented in the work of Tassou et al [iii] (Figure 2), showing that currently, Tesco stores have less energy intensity per SFA than the average stores in the UK in 2006-07.
Figure 2 Electricity consumption of Tesco stores and the average UK consumption in 2006-07.
2.5.1. Artificial Neural Networks Artificial Neural Networks (ANNs) are considered to be a modern forecasting tool. Firstly created for pattern recognition, ANNs have since developed into a powerful forecasting technique. Datta and Tassou [xxv] demonstrated that if trained using actual measured data, ANNs could be more reliable than Multiple
0
500
1000
1500
2000
2500
3000
0 2,000 4,000 6,000 8,000 10,000 12,000
Tota
l Con
sum
ptio
n/ S
FA [k
Wh/
m²]
SFA [m²]
Tesco store electricity consumption (2010-11) against average UK consumption for 2006-07
Total Consumption/SFA Tassou et. al (2011)
CIBSE Technical Symposium, De Montfort University, Leicester UK – 6th and 7th September 2011
Page 8 of 19
Linear Regression (MLR) and Multiple Polynomial Regression (MPR). A monitoring system was installed, which logged the:
“Temperature and relative humidity of the store, External air temperature and humidity, Total electrical power consumption, of the store, Electrical power consumption of refrigeration packs, Gas consumption and underfloor heating flow and return temperatures”.
A simple three-layered feed-forward neural network (NN) was then used. In order to evaluate factors that would affect the final result the most, the networks were trained using seven different configurations, modifying the input parameters and the number of time steps. The work arrived at the conclusion that the most important parameter is the time of day. The number of time steps used is not mentioned making it difficult to assess the accuracy of these results, as the performance of ANNs over longer periods of time is unknown. Kalogirou [xxvi] published a very comprehensive review of ANNs in renewable energy systems applications. This work explains the theory behind ANNs describing the principles that govern them and illustrating the parameter selection; it guides the reader through the whole process of building, training, testing and finally using ANNs for forecasting, warning the reader, where relevant, for common time-wasting mistakes. Various applications of ANNs are also presented, mostly in renewable energy systems. Additionally applications of ANNs in other energy systems are presented, including energy consumption prediction in commercial buildings, energy consumption optimization and forecasting of energy consumption. This work concludes that ANNs should not be underestimated as they do offer an alternative forecasting method.
2.6. Forecasting methodologies in the retail sector
In a private communication with J. Bruneel (R&D Software Team Leader at EnergyICT) it was stated that a combination of ANNs and MLR is used for the forecasting needs of the retail industry in the UK; a rather complex combination compared to the ones presented earlier in this work. Bruneel clarified that the system comprises of three different forecasts, a short term one (ANNs), able to forecast up to eight days in advance, a medium term one (MLR), able to forecast up to four months, and a long term one (MLR) that covers twelve months. Incorporated into those forecasts are eight different models, including every day of the week, plus one extra day for bank holidays. A back-propagation algorithm is used for the ANNs’ training along with an optimization technique, Principle Component Analysis (PCA), in order to compress the 24 inputs for each day to 5. Reverse PCA is applied at the end of each round to retrieve the initial 24 outputs. Weather data from 200 weather stations across the UK are also used - these are monitored half-hourly with parameters including ambient temperature, sunshine, wind speed and humidity.
2.7. Forecasting Techniques within Tesco Tesco has established a forecasting method in order to produce energy budgets for the year ahead. These budgets need to be accurate at store level as they are used by the business for goal setting and motivation.

CIBSE Technical Symposium, De Montfort University, Leicester UK – 6th and 7th September 2011
Page 9 of 19
This budgeting process divides the stores into their store director groups (SD), the store type and region of the country are taken into account, forming the grouping recognised and used by the business as a whole. Seasonality profiles are then created for each SD group. In order to create the seasonality profile for each group, a selection process takes place, which includes five years worth of electricity consumption data for each store, but excludes stores that: • Do not have complete data sets for that specific year. • Are electrically heated (these are not entirely excluded; specific profiles are created for them). • Have a weekly consumption at the beginning of the year, which was more than 10% different to the weekly consumption at the end of the year. This difference is usually because there were projects undertaken on that store that changed its consumption, for which the model does not have the ability to predict. Projects include changing the square footage of the store or ‘refreshing’ the store by installing new, more efficient equipment. This is to provide a flat or as close to business as usual profile, removing the effect of energy initiatives but also operational changes.
Taking into account all of the information, the remaining values are used to calculate how far above or below average the consumption was in each of the 52 weeks of the year; the seasonality profile is then created by calculating the average for each group of stores. Smoothing then takes place, which averages every three weeks, followed by a check to make sure that the Christmas period falls on the right Tesco week. Subsequently, the team selects six weeks as close as possible to the end of the year, removing any weeks with extreme temperatures. The weeks are then divided by the seasonality expected for those weeks to get an absolute average value. The absolute average value is then multiplied by the seasonality profile of each group to create a forecast weekly consumption value. Even though this method cannot be statistically verified, this is the best way of forecasting for Tesco, as the electricity consumption is never very close to an average value, mainly due to the effect of temperature changes.
3. Methods As mentioned in section 2.4, sub-metering was installed into approximately 70% of the buildings in the estate. For the purpose of this work, weekly electricity data for the period of 1/3/2010-1/3/11 were obtained through the data collection contractor. These dates were chosen as they form the latest Tesco year (2010-11). The values were then quality checked and verified. The first action taken was to add the CHP generation values to the MPAN data. Later, the set was checked for missing values. Any stores that did not have valid 52 weeks worth of data were eliminated. This eliminated stores that were built in the year 2010-11, as well as stores with sub-metering issues. Stores that were extended/reduced in SFA within the year were also excluded,
CIBSE Technical Symposium, De Montfort University, Leicester UK – 6th and 7th September 2011
Page 10 of 19
as these would have brought inaccuracies in the calculations. Another quality measure was the availability of SFA data for the store. If the SFA was not present for the 2010-11 period the store was excluded as well. Following these quality control checks, the number of stores included in the study was still significant; data used from 1518 out of a total of 2123 stores. Gas consumption is not as highly sub-metered therefore after the quality checks, 411 stores were included out of approximately 900 stores that are gas-heated.
4. Results
4.1. Impact of weather
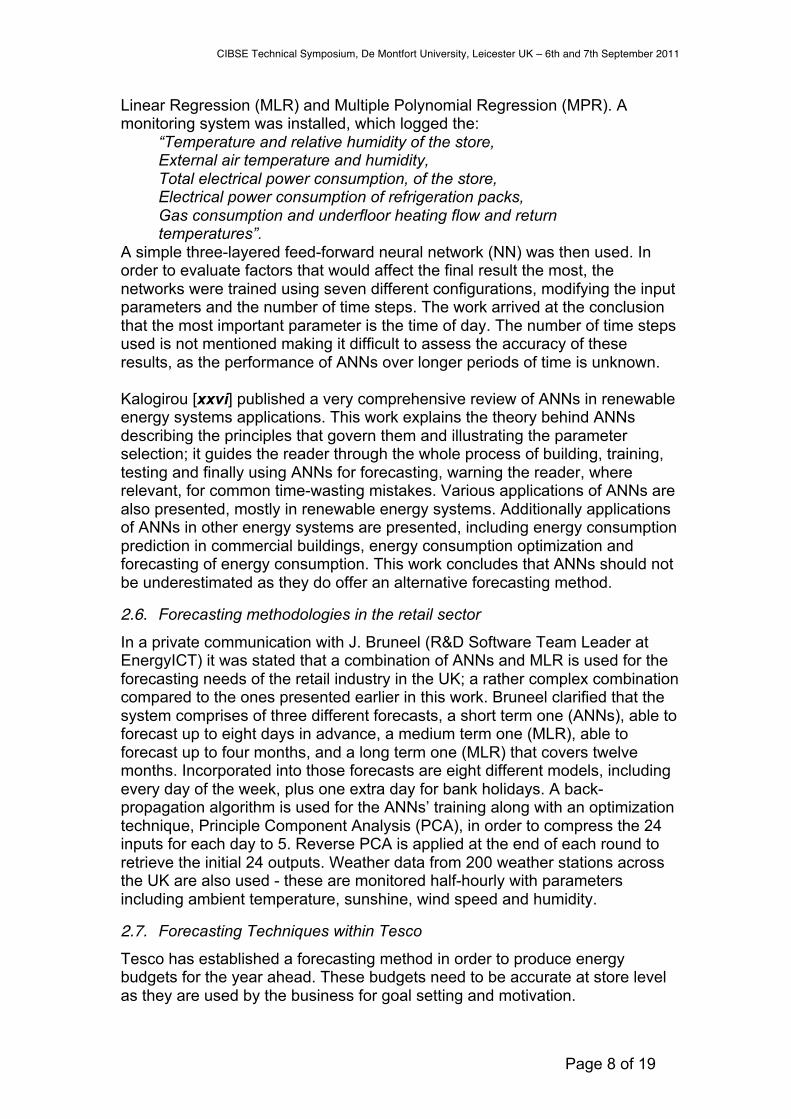
It is widely known that outside air temperature affects the energy consumption of buildings. However, each building is different and may behave differently under distinctive circumstances. It is clear that when temperature deviates from the average, the electricity consumption of stores increases. This increase is due to the heating load during the winter (in electrically heated stores) and due to the heavier cooling load and refrigeration during the summer.
Figure 3 Gas consumption affected by heating degree-days.
The effect of temperature on energy consumption is more obvious when plotting the average weekly energy consumption in kWh against Heating Degree-Days [HDD] for the same period. For Figures 3 and 4 the HDD and Cooling Degree days (CDD) were obtained from [xxvii], for the period between 1/3/2010 and 1/3/2011, using a base temperature of 15°C. Figure 3 shows how the gas consumption is affected by outside air temperature. Undoubtedly it is affected by the weather, as the two profiles follow each other every week.
0
20
40
60
80
100
120
140
0
5,000
10,000
15,000
20,000
25,000
30,000
35,000
40,000
Hea
ting
degr
ee d
ays [
wee
kly]
Aver
age
Wee
kly
cons
umpt
ion
[kW
h]
Date [Tesco year]
Gas consumption of stores against Heating Degree Days
HDD [Base 15] Gas consumption

CIBSE Technical Symposium, De Montfort University, Leicester UK – 6th and 7th September 2011
Page 11 of 19
Figure 4 The electricity consumption against cooling degree-days.
As shown in Figure 4, the heavier electricity consumption during summer can be explained by the cooling load needed. This consists of the electricity needed to keep the stores cold, as well as the electricity needed for refrigeration. During the winter the electricity consumption is still high, as the smaller stores are electrically heated. The significant increase in consumption noted around December can be explained by the increased amount of sales that take place in the stores due to the Christmas period.
4.2. Other factors that affect electricity consumption
As mentioned earlier, weather is not the only factor that affects the energy consumption of retail stores. In an attempt to find other factors that have an effect the authors have investigated, amongst others, the effect of the geographical location of the store that was found to have a minor impact compared to the other factors. Factors that need further investigation include day-of-the-week, Section 4.2.1, sales, Section 4.2.2, opening hours and customer volume.
4.2.1. Day-of-the-week
Figure 5 The effect of the day of the week on electricity consumption
0
5
10
15
20
25
30
35
40
23,500
24,000
24,500
25,000
25,500
26,000
Cool
ing
Deg
ree
Day
s [W
eekl
y]
Aver
age
Wee
kly
cons
umpt
ion
[kW
h]
Date
Electricity consumption of stores depending on weather
CDD
Electricity consumption
4800000
5000000
5200000
5400000
5600000
5800000
6000000
Mon Tue Wed Thu Fri Sat Sun
Elec
tric
ity C
onsu
mpt
ion
[kW
h]
Day of the week
Daily pro"les of electricity consumption
CIBSE Technical Symposium, De Montfort University, Leicester UK – 6th and 7th September 2011
Page 12 of 19
Figure 5 indicates that the day-of-the-week is an important factor affecting the energy consumption. It has been observed that on Friday and Saturday stores always consume more electricity than the rest of the week. Trading hours on a Saturday are less than trading hours on weekdays; the difference in energy consumption is apparent nonetheless. This could possibly be explained by the number of customers entering the stores during the weekend and the number of sales/pounds spent in store (usually linked with refrigeration doors opening and closing more often, with customers taking products off the shelves, and staff refilling the shelves), but more information is needed to confirm this.
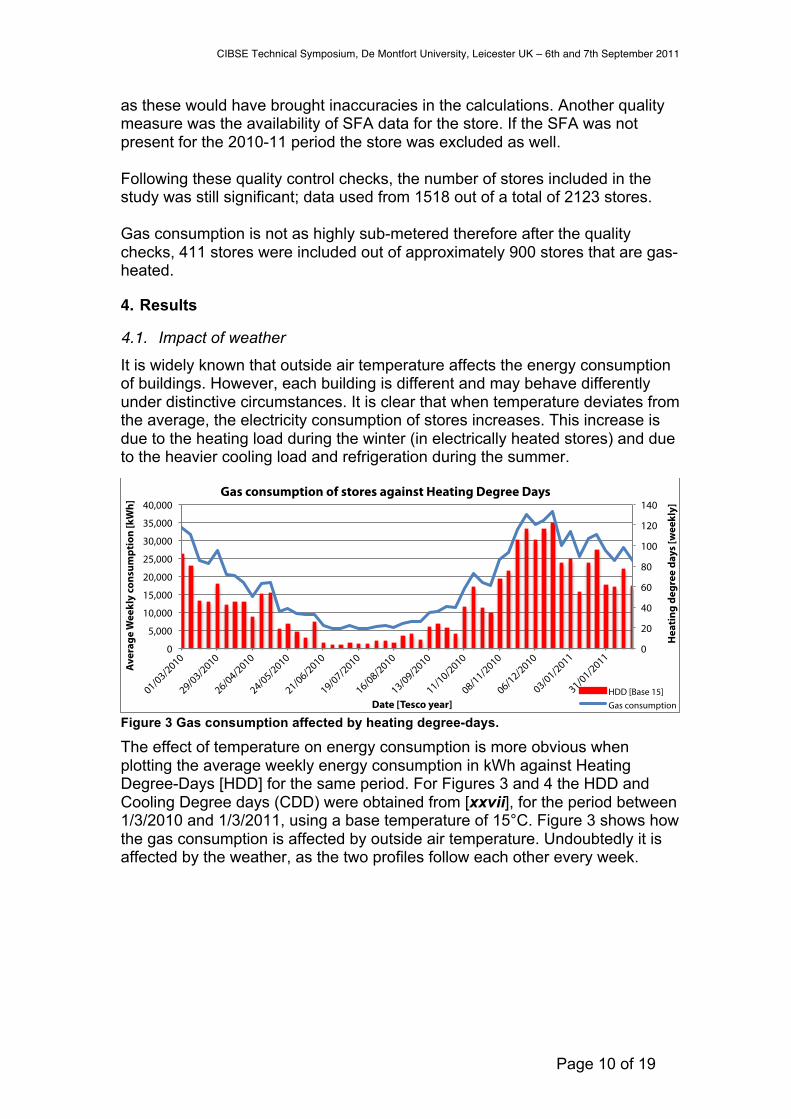
4.2.2. Sales At first glance, Figure 6 shows a good correlation of electricity consumption with sales. However, a closer look at the individual store types reveals less correlation. This is especially apparent in Express stores as their energy intensity breadth is higher than any other store type.
Figure 6 Weekly electricity consumption against sales.
Figure 7 presents the electricity consumption of extra stores. It is interesting that stores of the same type, and same size consume different amounts of electricity when their sales volume is different.

CIBSE Technical Symposium, De Montfort University, Leicester UK – 6th and 7th September 2011
Page 13 of 19
Figure 7 Electricity consumption against sales for Extras.
4.2.3. Store build date. Another factor that is important to consider is the age of the building. Tesco design standards have been changing over the years, altering both the building materials and the equipment used within a store. Building regulations have also changed significantly since the first Tesco store was built in 1929 [xxviii].
Figure 8 Does build date affect the behaviour of the building?
The influence of changes in building regulations can be seen in Figure 8 but this is not clear. The box plot shows how the electricity consumption per square metre varies with built date. There is an apparent dip in the energy
CIBSE Technical Symposium, De Montfort University, Leicester UK – 6th and 7th September 2011
Page 14 of 19
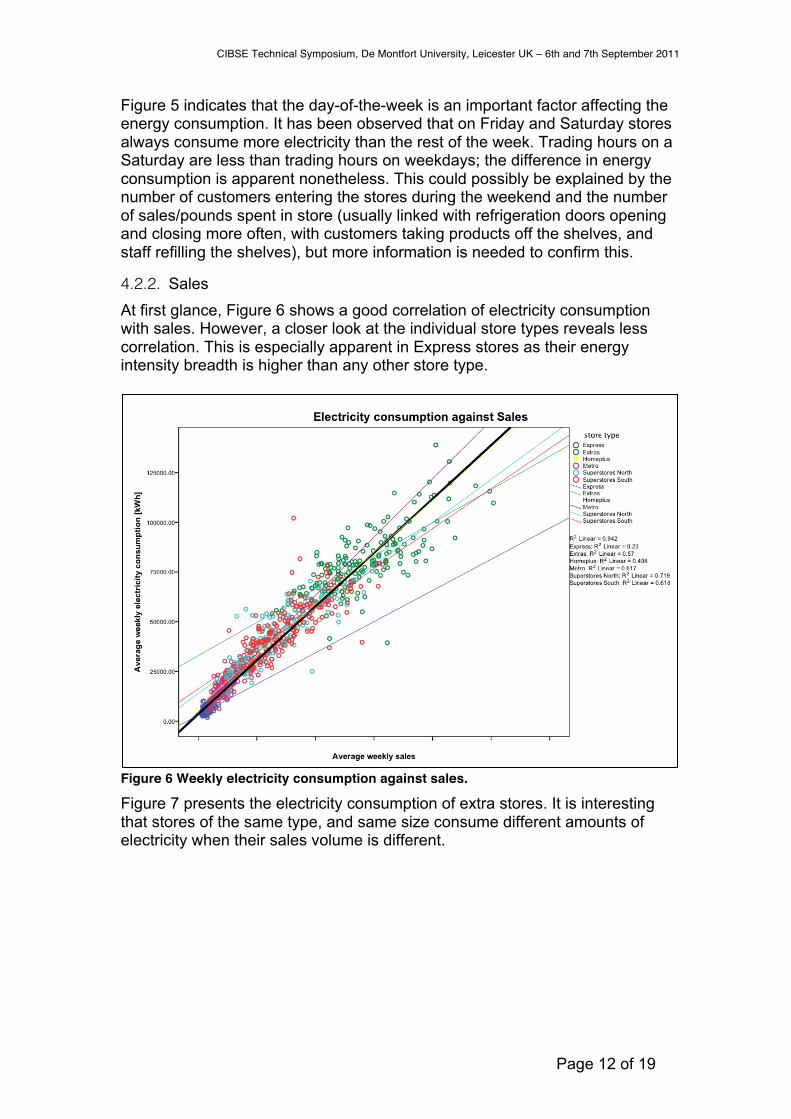
consumption of the buildings built in the 1970s, during the economic/oil crisis, possibly due to the 1972 Conservation of fuel and power provisions for dwellings [xxix]. This is followed by an overall increase in consumption of buildings built around the 80s. Until 1996 the behavior is fairly consistent, and then there is another dip, probably caused by the building regulations in 1996, and again after 2002 and 2005. The increase after the millennium can be explained by the strategic increase in the number of Express stores being built by Tesco in that decade. As shown earlier in figure 1, Express stores have higher electricity consumption per m² than the other store types.
Figure 9 Electricity consumption of Express stores according to their built date.
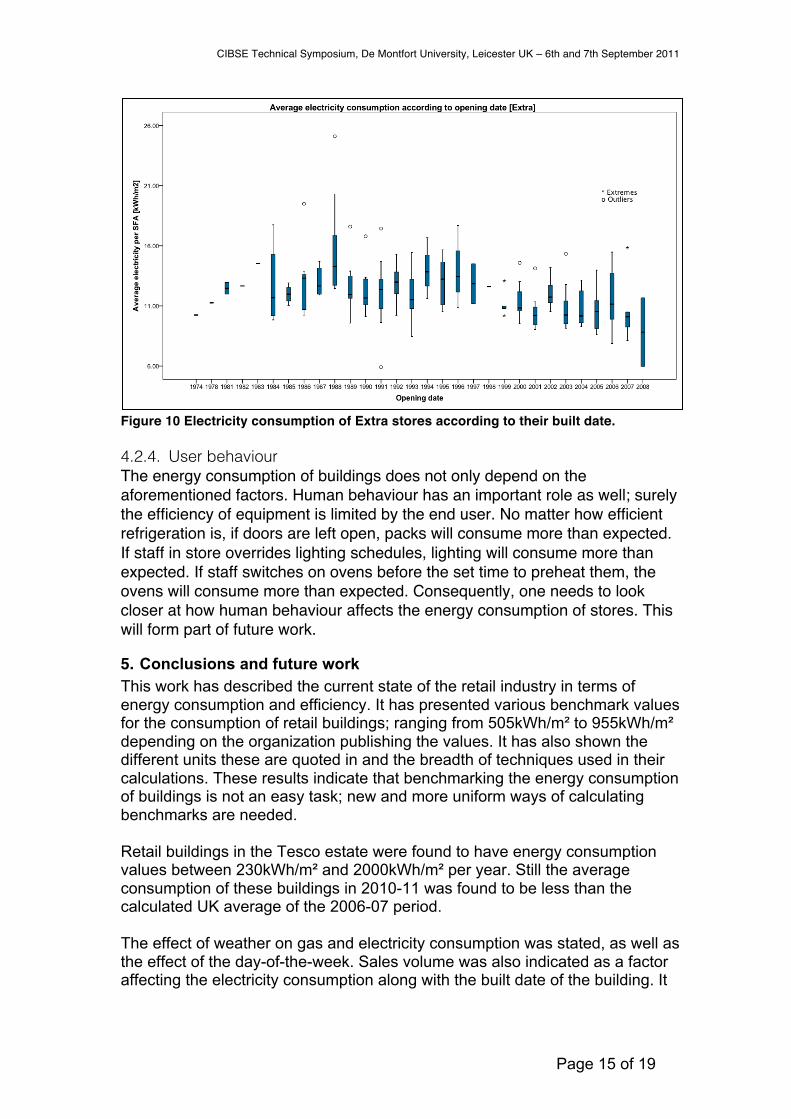
Figure 9 presents the electricity consumption per SFA for the Express stores, according to their built date. One can see the step change (reduction) of electricity consumption between stores built before 2002 and stores built after 2002. The effect of building regulations is more apparent in the behaviour of Express stores due to the electrical heating. It is not expected that the electrical behaviour of the remaining store types will be affected by the building regulations, as these stores are heated by gas. There is, however, still an interesting change in their behaviour illustrated by Figure 10. This can be explained by the changes in design standards within the company, affecting: the number and type of fridge/ freezer cabinets installed in stores, the type and amount of lighting installed, as well as the type and amount of other equipment. Further investigation into the electricity behaviour of the buildings according to their build year is required as this might indicate contractors or equipment types that drive the energy consumption.
CIBSE Technical Symposium, De Montfort University, Leicester UK – 6th and 7th September 2011
Page 15 of 19
Figure 10 Electricity consumption of Extra stores according to their built date.
4.2.4. User behaviour The energy consumption of buildings does not only depend on the aforementioned factors. Human behaviour has an important role as well; surely the efficiency of equipment is limited by the end user. No matter how efficient refrigeration is, if doors are left open, packs will consume more than expected. If staff in store overrides lighting schedules, lighting will consume more than expected. If staff switches on ovens before the set time to preheat them, the ovens will consume more than expected. Consequently, one needs to look closer at how human behaviour affects the energy consumption of stores. This will form part of future work.
5. Conclusions and future work This work has described the current state of the retail industry in terms of energy consumption and efficiency. It has presented various benchmark values for the consumption of retail buildings; ranging from 505kWh/m² to 955kWh/m² depending on the organization publishing the values. It has also shown the different units these are quoted in and the breadth of techniques used in their calculations. These results indicate that benchmarking the energy consumption of buildings is not an easy task; new and more uniform ways of calculating benchmarks are needed. Retail buildings in the Tesco estate were found to have energy consumption values between 230kWh/m² and 2000kWh/m² per year. Still the average consumption of these buildings in 2010-11 was found to be less than the calculated UK average of the 2006-07 period. The effect of weather on gas and electricity consumption was stated, as well as the effect of the day-of-the-week. Sales volume was also indicated as a factor affecting the electricity consumption along with the built date of the building. It
CIBSE Technical Symposium, De Montfort University, Leicester UK – 6th and 7th September 2011
Page 16 of 19
was identified that human behaviour is an important factor and needs to be investigated further. Gaps in the industry were also identified, such as the lack of energy prediction tools available to the energy professionals. Benchmarking and best practise guides can be too optimistic when compared to actual energy consumption figures, CIBSE 505kwh/m², ASHRAE 565-710kwh/m², compared to an average of 806kWh/m2 consumed by a Tesco Metro store. Spreadsheet models used by Tesco are accurate to 5% when averaged for the whole estate, but are not always accurate to store level. Even though the forecasting ability of Artificial Neural Networks cannot be undervalued, these have not been demonstrated to produce accurate results for prolonged periods of time. The above lead to the conclusion that the sector needs to move towards more sophisticated techniques in forecasting the energy consumption of its buildings. These should incorporate the various factors affecting the energy consumption, including but not limited to: HDD and CDD, sales figures, built date and day-of-the-week profiles. Future work will include the investigation of other factors that affect the energy consumption of retail buildings. These factors should contain the building materials used, the type of equipment installed in the building and the operating hours of the store, as well as the operational behaviour of the staff and any other factors that might arise.
CIBSE Technical Symposium, De Montfort University, Leicester UK – 6th and 7th September 2011
Page 17 of 19
6. References i. IGD, UK Grocery Retailing (2010), viewed May 10 2011,
http://www.igd.com/index.asp?id=1&fid=1&sid=7&tid=0&folid=0&cid=94.
ii. Kantar Woldpanel, UK Grocery Market Share Analysis, viewed May 11 2011, http://www.kamcity.com/namnews/mktshare/2011/kantar-
ii. Kantar Woldpanel, UK Grocery Market Share Analysis, viewed May 11 2011, http://www.kamcity.com/namnews/mktshare/2011/kantar-march11.htm.
iii. Tassou SA, Ge Y, Hadawey A and Marriott D, Energy consumption and conservation in food retailing, Applied Thermal Engineering, 31(2-3), pp. 147-156, 2011.
iv. DEFRA, Economic Note on UK Grocery Retailing, Department of Environment, viewed January 14 2011, http://www.defra.gov.uk/evidence/economics/foodfarm/reports/documents/Groceries%20paper%20May%202006.pdf.
v. Tesco PLC, Tesco Corporate Responsibility Report, viewed November 1 2010 http://www.tesco.com/cr2010.
vi. CIA, The World Factbook, 2010, viewed January 19 2011 https://www.cia.gov/library/publications/the-world-factbook/geos/uk.html.
vii. British Retail Consortium, Policies and Issues, viewed January 10 2011 http://www.brc.org.uk/policymaster04.asp?id=639&sPolicy=ENERGY.
viii. Building Regulations, Conservation of fuel and power in new buildings other than dwellings, Approved Document L2A, HM Government, 2010, viewed January 19 2011, http://www.planningportal.gov.uk/uploads/br/BR_PDF_ADL2A_2010.pdf.
ix. CIBSE, TM47: Operational Ratings and Display Energy Certificates, The Chartered Institution of Building Services Engineers, 2009.
x. DEFRA, The CRC energy efficiency scheme, user guide, Department of energy and climate change, viewed May 11 2011, http://www.decc.gov.uk/assets/decc/What%20we%20do/A%20low%20carbon%20UK/crc/1_20100406154137_e_@@_21934CRCPDFAWv9.pdf.
xi. CIBSE, TM46: Energy Benchmarks, The Chartered Institution of Building Services Engineers, 2006.
xii. ASHRAE, The ASHRAE Advanced Energy Design Guides (AEDG), American Society of Heating, Refrigerating and Air-Conditioning Engineers, 2004.
xiii. ASHRAE, Energy standard for buildings except low-rise residential buildings, IESNA Standard 90.1-2010, viewed January 9 2011, http://openpub.realread.com/rrserver/browser?title=/ASHRAE_1/ashrae_90_1_2010_IP_1024.
CIBSE Technical Symposium, De Montfort University, Leicester UK – 6th and 7th September 2011
Page 18 of 19
xiv. Deru M, Torcellini P, Standard Definitions of Building Geometry for Energy
Evaluation Purposes, Technical Report NREL/TP-550-38600. Golden, CO: National Renewable Energy Lab, 2005.
xv. Barley D, Deru M, Pless S, and Torcellini P, Procedure for Measuring and Reporting Commercial Building Energy Performance, Technical Report, NREL/TP-550-38601, Golden, CO: National Renewable Energy Lab, 2005. Viewed January 20 2011, http://www.nrel.gov/docs/fy06osti/38601.pdf.
xvi. U.S. Green Building Council, LEED Rating Systems, 2011, viewed May 13 2011, http://www.usgbc.org/DisplayPage.aspx?CategoryID=19.
xvii. Advanced Buildings Institute, Advanced Buildings Core Performance Guide, 2010, viewed January 15 2011, http://www.newbuildings.org/advanced-design/advanced-buildings.
xviii. International Sustainability Alliance, Preliminary Benchmarking Results, 2010, viewed January 9 2011, http://www.internationalsustainabilityalliance.org/filelibrary/ISA_Benchmarking_Results_October_2010.pdf.
xix. Commission Regulation (EC) No 1503/2006 of 28 September 2006 implementing and amending Council Regulation (EC) No 1165/98 concerning short-term statistics as regards definitions of variables, list of variables and frequency of data compilation.
xx. BRE Global Ltd, BREEAM, viewed July 18 2011, http://www.breeam.org/page.jsp?id=66
xxi. BRE Global Ltd, BREEAM Retail 2008, Scheme document SD 5056, viewed July 1 2011, http://www.breeam.org/filelibrary/Technical%20Manuals/SD5056_4_0_BREEAM_Retail_2008.pdf
xxii. ASHRAE, DOE commercial building benchmarks- New buildings, Standard Benchmark Energy Utilization Index, 2009, viewed January 9 2011 http://cms.ashrae.biz/EUI/.
xxiii. Chung W, Review of building energy-use performance benchmarking methodologies, Applied Energy, Elsevier, 88(5), pp.1470-1479, 2011.
xxiv. Chung W, Hui Y V and Lam Y M, Benchmarking the energy efficiency of commercial buildings, Applied Energy, 83(1), pp. 1-14, 2006.
xxv. Datta D and Tassou SA, Artificial neural network based electrical load prediction for food retail stores, Applied Thermal Engineering, 18, pp. 1121-1128, 1998.
xxvi. Kalogirou S A, Artificial neural networks in renewable energy systems applications: a review, Renewable and Sustainable Energy Reviews, 5(4), pp. 373-401, 2001.
CIBSE Technical Symposium, De Montfort University, Leicester UK – 6th and 7th September 2011
Page 19 of 19
xxvii. Bizee, Degree Days, viewed May 30 2011, http://www.degreedays.net.
xxviii. Gann D M, Wang Y and Hawkins R, Do regulations encourage innovation? - the case of energy efficiency in housing, Building Research & Information, 26(5), 280-296, 1998
xxix. King T, The history of the Building Regulations and where we are now, HBF Technical Conference: The road to zero carbon is paved with Building Regulations, viewed June 1 2011, www.house-builder.co.uk/documents/01TEDKING-CLG.pdf.