energy building retrofitting of a multifamily house: a ... · energy building retrofitting of a...
TRANSCRIPT

Energy building retrofitting of a multifamily house: a case study
Chiara Dipasquale – Eurac research Institute of Renewable Energy – [email protected]
Roberto Fedrizzi – Eurac research Institute of Renewable Energy – [email protected]
Diego Bertesina – Manens-Tifs s.p.a. - [email protected]
Alessandro Bellini – Eurac research Institute of Renewable Energy –[email protected]
Abstract
The residential sector contributes largely to the energy
consumption in Europe: around 40% of the EU energy
use (RHC-ETP, 2011).
For a massive reduction of the energy consumption in the
European residential sector, a common practice is the
retrofitting of existing buildings. In this context,
multifamily houses (MFHs) are considered to be easier
retrofitted, partly because their exteriors are more
uniform than single-family houses’ - which makes
external insulation and glazing replacement easier to
install - and partly because each building contains
multiple dwellings - therefore a single action can affect
more living area.
The purpose of this paper is to report on the design phase
of a multifamily house located in Madrid, Spain. The
refurbishment concerns the installation of both passive
and active solutions. In particular, transmissions through
the envelope are reduced by the addition of an insulation
layer and new windows. DHW production, space heating
and cooling are guaranteed by an air-to-water heat
pump. Heating demand and Domestic Hot Water (DHW)
production are also partially covered by solar thermal
panels installed on the parapet of the building.
The impact of the retrofitting measures on the energy
consumption have been assessed starting from energy
audit data, going through modelling and simulating the
building’s envelope before and after the retrofit , and
finally analysing the building and energy plant together.
The simulation work shows a set of integrated measures
suitable to achieve a primary energy consumption for
heating, cooling and domestic hot water, lower than 50
kWh/m²y.
1. Introduction
The total residential floor area in the 27 European
countries is approximately 17.6 billion m². Of this
15.1 billion m² is estimated to be heated. For the
sake of simplicity, the residential building stock
can be divided in two main typologies: single-
family house (SFH), with a single dwelling unit
within its own building and multi-family house
(MFH) where a dwelling is in a multi-occupancy
building. SFHs and MFHs distribution is different
across the Europe. Denmark, Ireland, Netherlands
and United Kingdom have the highest proportions
of SFHs (all above 70%) whereas Estonia, Italy,
Latvia and Spain have the lowest proportions of
SFHs (all below 40%). The age distribution of the
residential building stock varies from country to
country, but the age of both single and multi-
family houses is broadly similar across Europe
with a growth rate peak between 1950s and 1970s.
The rate of new build has been slowing since the
1970s, with the strong reduction occurring after
2000. Spain has higher than average construction
during 1971-1980 and after 2000.
For a massive reduction of the energy consumption
in the European residential sector, a massive
retrofitting of existing buildings is needed. In this
context, MFHs are often thought to be more cost
effective targets for retrofit, because of the
consistent architecture and economies of scale on a
large block of apartments. Moreover, they are
considered to be easier retrofitted because their
exteriors are more uniform than single-family
houses - which makes external insulation or
replacement glazing easier to install (Birchall S. et
al, 2014).
In this sense, purpose of this work is to present the
Pre-
prin
ts o
f BSA
201
5 - B
uild
ing
Sim
ulat
ion
Appl
icat
ion

Chiara Dipasquale, Roberto Fedrizzi, Diego Bertesina, Alessandro Bellini
renovation process applied to a demo case, which
uses non-invasive technics and aims to reduce the
total amount of energy consumption. The
methodology foresees the use of numerical models
to assess the actual building demands and the
assessed energy savings.
The building presented in the following is a MFH
of the ‘60s located in Madrid. In line with the
above observations, this kind of building can be
considered as representative of a big portion of the
Spanish residential building stock.
The building is located in the suburbs of Madrid
and it is composed of two linear blocks for a total
of twenty dwellings (50 m² living area each) on five
floors. In this study, only one of the two has been
analysed (in the red circle in Fig.1).
Fig. 1 – North façade of the demo case–in the red circle the
analysed building
The refurbishment concerns the installation of both
passive and active solutions. In particular,
transmissions through the envelope are reduced by
the addition of an insulation layer and new low
transmittance windows. DHW production, space
heating and cooling are guaranteed by an air-to-
water heat pump. Heating demand and Domestic
Hot Water (DHW) production are also partially
covered by solar thermal panels installed on the
parapet of the building.
2. Methodology
The impact of the retrofitting measures on the
energy consumption have been assessed through
the following steps:
1) building energy audit for the definition of the
building characteristics and consumptions;
2) modelling of the existing building’s envelope
and calculation of the building demands;
3) modelling of the renovated building’s envelope
and assessment of the building demands;
4) modelling of the thermal plant and simulation of
the whole system (building + energy system +
control strategies);
5) planning of the renovated case by using non-
invasive techniques, allowing the owners to live in
the building while the renovation takes place.
Simulations have been run in the dynamic
environment of TRNSYS Simulation Studio (Klein
S.A., 2009), while the geometry of the building has
been developed in Google SketchUp and set up in
TRNBuild.
2.1 Building energy audit
The energy audit concerns building characteristics,
uses and energy consumption. Information come
from technicians and survey distributed through
the tenants. Daily and yearly profiles have been
defined for the occupation and electric use,
distinguishing between workdays and weekends.
Some examples of these schedules are showed in
Fig. 2 and Fig. 3.
Fig. 2 – Schedule of occupancy during the weekdays
Fig. 3 – Use of electric devices during the weekdays
Pre-
prin
ts o
f BSA
201
5 - B
uild
ing
Sim
ulat
ion
Appl
icat
ion
Energy building retrofitting of a multifamily house: a case study
Thermal characteristics have been calculated for
the envelope elements: external walls, roof, ground
floor, windows, internal partitions, adjacent walls
(towards the second part of the building block).
Thickness and heat transfer coefficient (Uvalue) of
opaque and glazed surfaces are reported in Table 1
and 2.
Table 1 – Thermal characteristics of the envelope
Wall Thickness Heat transfer
coefficient (Uvalue)
[m] [W/m²K]
External wall 1 0.35 1.51
External wall 2 0.32 1.57
Roof 0.68 1.51
Ground floor 0.27 2.19
Adjacent wall 0.25 1.54
Table 2 – Window characteristics
Window Uvalue_glazing Uvalue_frame gvalue_glazing
[W/m²K] [W/m²K] [-]
Window single
glazed 6.11 5.88 0.81
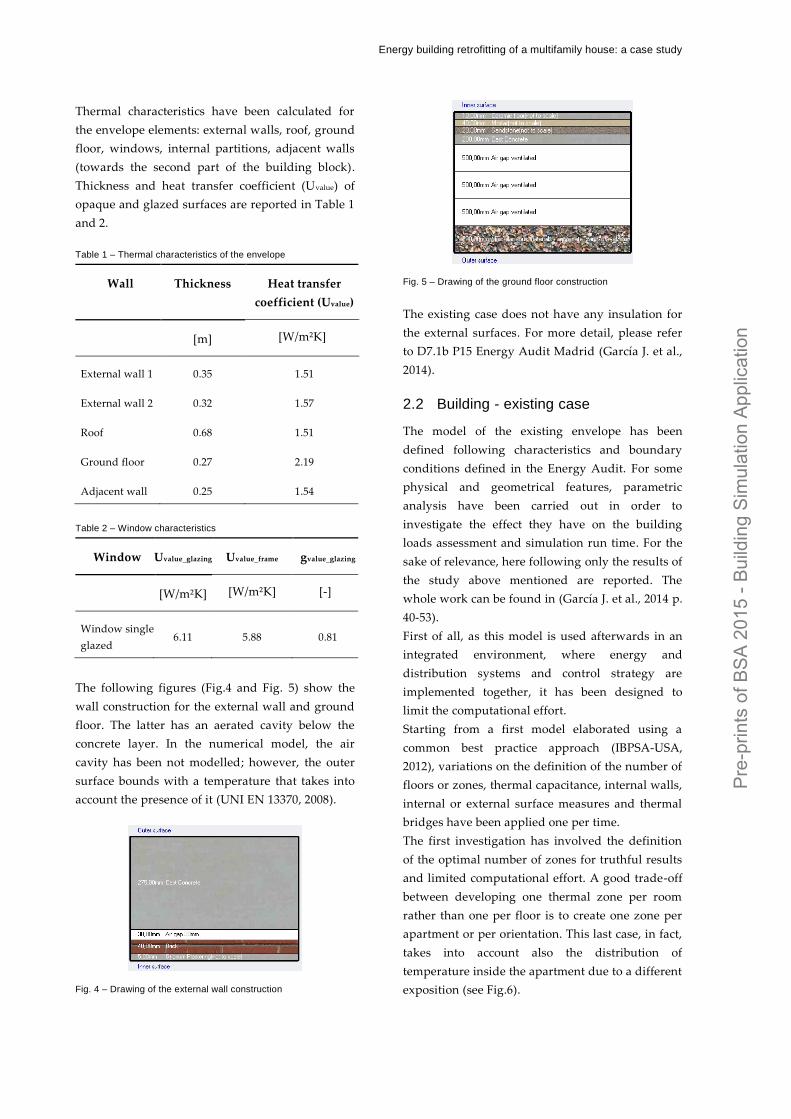
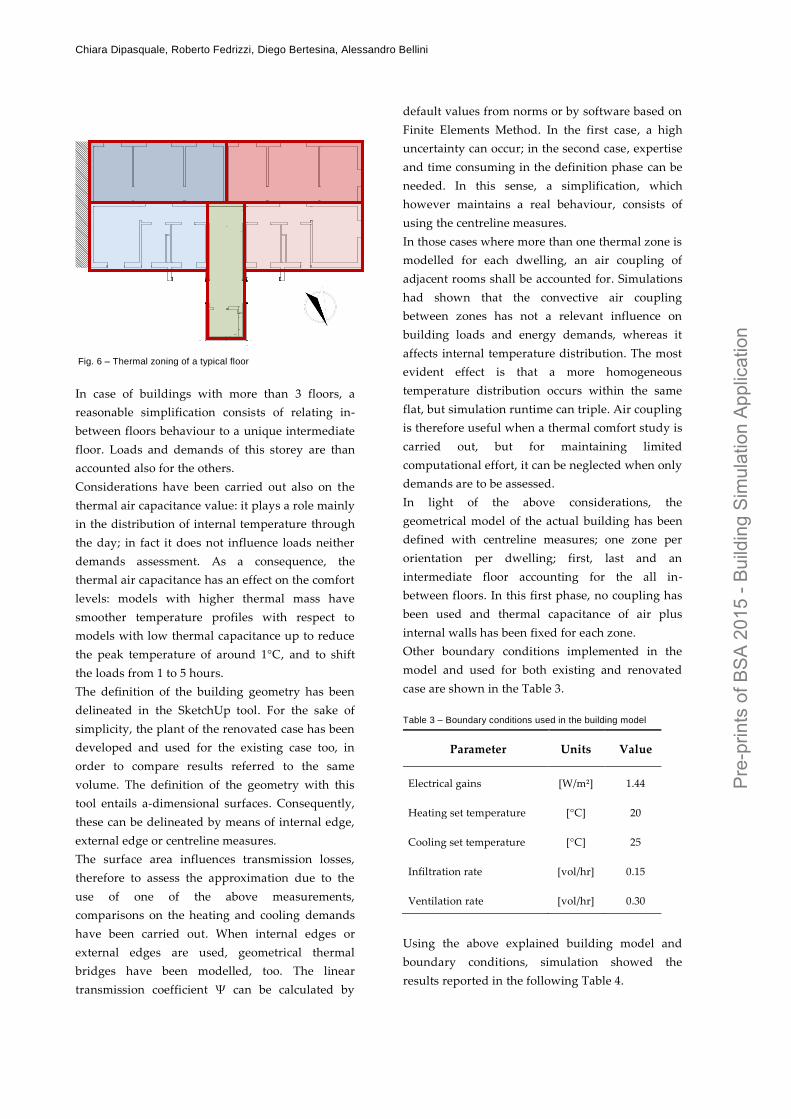
The following figures (Fig.4 and Fig. 5) show the
wall construction for the external wall and ground
floor. The latter has an aerated cavity below the
concrete layer. In the numerical model, the air
cavity has been not modelled; however, the outer
surface bounds with a temperature that takes into
account the presence of it (UNI EN 13370, 2008).
Fig. 4 – Drawing of the external wall construction
Fig. 5 – Drawing of the ground floor construction
The existing case does not have any insulation for
the external surfaces. For more detail, please refer
to D7.1b P15 Energy Audit Madrid (García J. et al.,
2014).
2.2 Building - existing case
The model of the existing envelope has been
defined following characteristics and boundary
conditions defined in the Energy Audit. For some
physical and geometrical features, parametric
analysis have been carried out in order to
investigate the effect they have on the building
loads assessment and simulation run time. For the
sake of relevance, here following only the results of
the study above mentioned are reported. The
whole work can be found in (García J. et al., 2014 p.
40-53).
First of all, as this model is used afterwards in an
integrated environment, where energy and
distribution systems and control strategy are
implemented together, it has been designed to
limit the computational effort.
Starting from a first model elaborated using a
common best practice approach (IBPSA-USA,
2012), variations on the definition of the number of
floors or zones, thermal capacitance, internal walls,
internal or external surface measures and thermal
bridges have been applied one per time.
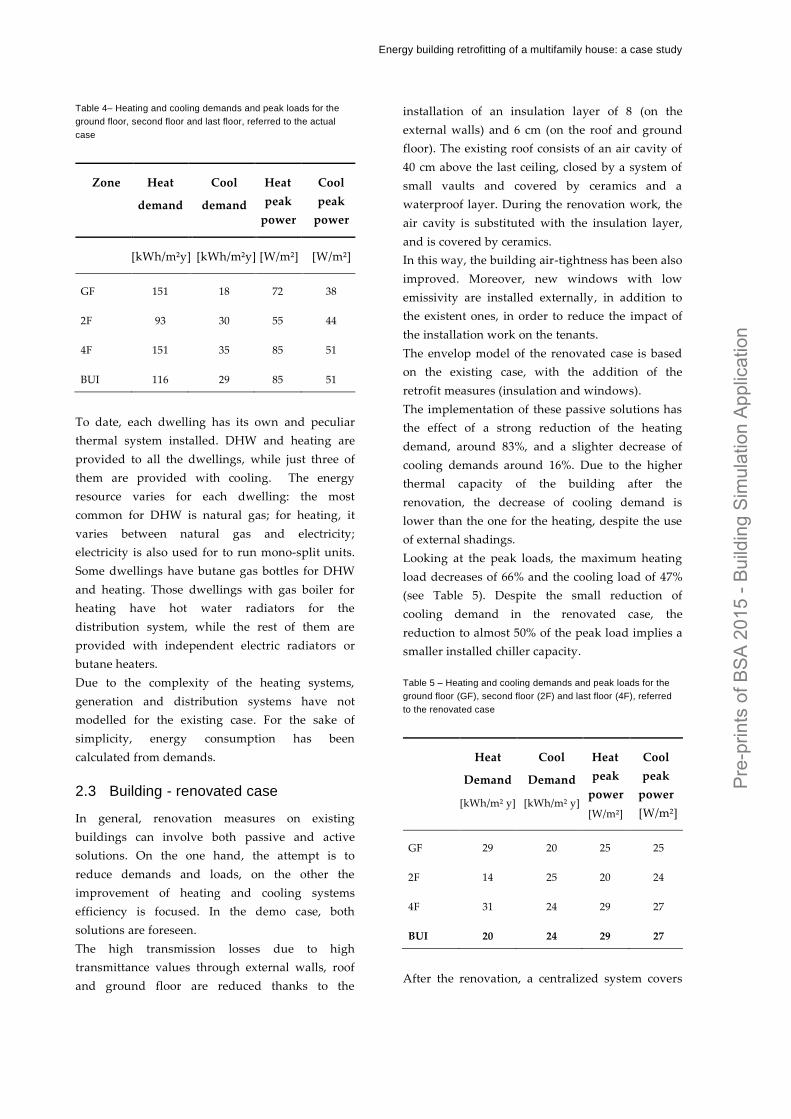
The first investigation has involved the definition
of the optimal number of zones for truthful results
and limited computational effort. A good trade-off
between developing one thermal zone per room
rather than one per floor is to create one zone per
apartment or per orientation. This last case, in fact,
takes into account also the distribution of
temperature inside the apartment due to a different
exposition (see Fig.6).
Pre-
prin
ts o
f BSA
201
5 - B
uild
ing
Sim
ulat
ion
Appl
icat
ion
Chiara Dipasquale, Roberto Fedrizzi, Diego Bertesina, Alessandro Bellini
Fig. 6 – Thermal zoning of a typical floor
In case of buildings with more than 3 floors, a
reasonable simplification consists of relating in-
between floors behaviour to a unique intermediate
floor. Loads and demands of this storey are than
accounted also for the others.
Considerations have been carried out also on the
thermal air capacitance value: it plays a role mainly
in the distribution of internal temperature through
the day; in fact it does not influence loads neither
demands assessment. As a consequence, the
thermal air capacitance has an effect on the comfort
levels: models with higher thermal mass have
smoother temperature profiles with respect to
models with low thermal capacitance up to reduce
the peak temperature of around 1°C, and to shift
the loads from 1 to 5 hours.
The definition of the building geometry has been
delineated in the SketchUp tool. For the sake of
simplicity, the plant of the renovated case has been
developed and used for the existing case too, in
order to compare results referred to the same
volume. The definition of the geometry with this
tool entails a-dimensional surfaces. Consequently,
these can be delineated by means of internal edge,
external edge or centreline measures.
The surface area influences transmission losses,
therefore to assess the approximation due to the
use of one of the above measurements,
comparisons on the heating and cooling demands
have been carried out. When internal edges or
external edges are used, geometrical thermal
bridges have been modelled, too. The linear
transmission coefficient Ψ can be calculated by
default values from norms or by software based on
Finite Elements Method. In the first case, a high
uncertainty can occur; in the second case, expertise
and time consuming in the definition phase can be
needed. In this sense, a simplification, which
however maintains a real behaviour, consists of
using the centreline measures.
In those cases where more than one thermal zone is
modelled for each dwelling, an air coupling of
adjacent rooms shall be accounted for. Simulations
had shown that the convective air coupling
between zones has not a relevant influence on
building loads and energy demands, whereas it
affects internal temperature distribution. The most
evident effect is that a more homogeneous
temperature distribution occurs within the same
flat, but simulation runtime can triple. Air coupling
is therefore useful when a thermal comfort study is
carried out, but for maintaining limited
computational effort, it can be neglected when only
demands are to be assessed.
In light of the above considerations, the
geometrical model of the actual building has been
defined with centreline measures; one zone per
orientation per dwelling; first, last and an
intermediate floor accounting for the all in-
between floors. In this first phase, no coupling has
been used and thermal capacitance of air plus
internal walls has been fixed for each zone.
Other boundary conditions implemented in the
model and used for both existing and renovated
case are shown in the Table 3.
Table 3 – Boundary conditions used in the building model
Parameter Units Value
Electrical gains [W/m²] 1.44
Heating set temperature [°C] 20
Cooling set temperature [°C] 25
Infiltration rate [vol/hr] 0.15
Ventilation rate [vol/hr] 0.30
Using the above explained building model and
boundary conditions, simulation showed the
results reported in the following Table 4.
N
Pre-
prin
ts o
f BSA
201
5 - B
uild
ing
Sim
ulat
ion
Appl
icat
ion
Energy building retrofitting of a multifamily house: a case study
Table 4– Heating and cooling demands and peak loads for the
ground floor, second floor and last floor, referred to the actual
case
Zone Heat
demand
Cool
demand
Heat
peak
power
Cool
peak
power
[kWh/m²y] [kWh/m²y] [W/m²] [W/m²]
GF 151 18 72 38
2F 93 30 55 44
4F 151 35 85 51
BUI 116 29 85 51
To date, each dwelling has its own and peculiar
thermal system installed. DHW and heating are
provided to all the dwellings, while just three of
them are provided with cooling. The energy
resource varies for each dwelling: the most
common for DHW is natural gas; for heating, it
varies between natural gas and electricity;
electricity is also used for to run mono-split units.
Some dwellings have butane gas bottles for DHW
and heating. Those dwellings with gas boiler for
heating have hot water radiators for the
distribution system, while the rest of them are
provided with independent electric radiators or
butane heaters.
Due to the complexity of the heating systems,
generation and distribution systems have not
modelled for the existing case. For the sake of
simplicity, energy consumption has been
calculated from demands.
2.3 Building - renovated case
In general, renovation measures on existing
buildings can involve both passive and active
solutions. On the one hand, the attempt is to
reduce demands and loads, on the other the
improvement of heating and cooling systems
efficiency is focused. In the demo case, both
solutions are foreseen.
The high transmission losses due to high
transmittance values through external walls, roof
and ground floor are reduced thanks to the
installation of an insulation layer of 8 (on the
external walls) and 6 cm (on the roof and ground
floor). The existing roof consists of an air cavity of
40 cm above the last ceiling, closed by a system of
small vaults and covered by ceramics and a
waterproof layer. During the renovation work, the
air cavity is substituted with the insulation layer,
and is covered by ceramics.
In this way, the building air-tightness has been also
improved. Moreover, new windows with low
emissivity are installed externally, in addition to
the existent ones, in order to reduce the impact of
the installation work on the tenants.
The envelop model of the renovated case is based
on the existing case, with the addition of the
retrofit measures (insulation and windows).
The implementation of these passive solutions has
the effect of a strong reduction of the heating
demand, around 83%, and a slighter decrease of
cooling demands around 16%. Due to the higher
thermal capacity of the building after the
renovation, the decrease of cooling demand is
lower than the one for the heating, despite the use
of external shadings.
Looking at the peak loads, the maximum heating
load decreases of 66% and the cooling load of 47%
(see Table 5). Despite the small reduction of
cooling demand in the renovated case, the
reduction to almost 50% of the peak load implies a
smaller installed chiller capacity.
Table 5 – Heating and cooling demands and peak loads for the
ground floor (GF), second floor (2F) and last floor (4F), referred
to the renovated case
Heat
Demand
[kWh/m² y]
Cool
Demand
[kWh/m² y]
Heat
peak
power
[W/m²]
Cool
peak
power
[W/m²]
GF 29 20 25 25
2F 14 25 20 24
4F 31 24 29 27
BUI 20 24 29 27
After the renovation, a centralized system covers
Pre-
prin
ts o
f BSA
201
5 - B
uild
ing
Sim
ulat
ion
Appl
icat
ion
Chiara Dipasquale, Roberto Fedrizzi, Diego Bertesina, Alessandro Bellini
the heating and domestic hot water preparation.
Moreover, the new A/W heat pump of 15 kW
provides cooling to all dwellings. Solar collectors
installed on the parapet, for a total of 28m²,
contribute to the heating and domestic hot water
preparation.
A new low-temperature heating distribution
system is installed and, for this purpose, radiant
ceilings allow for a temperature under 30-35°C.
In addition, shading elements are foreseen to be
installed onto the windows at the south and west
oriented façade, in order to avoid overheating in
summer.
In the renovation, piping is distributed outside the
north façade, embedded in the insulation, in order
to reduce the heat losses.
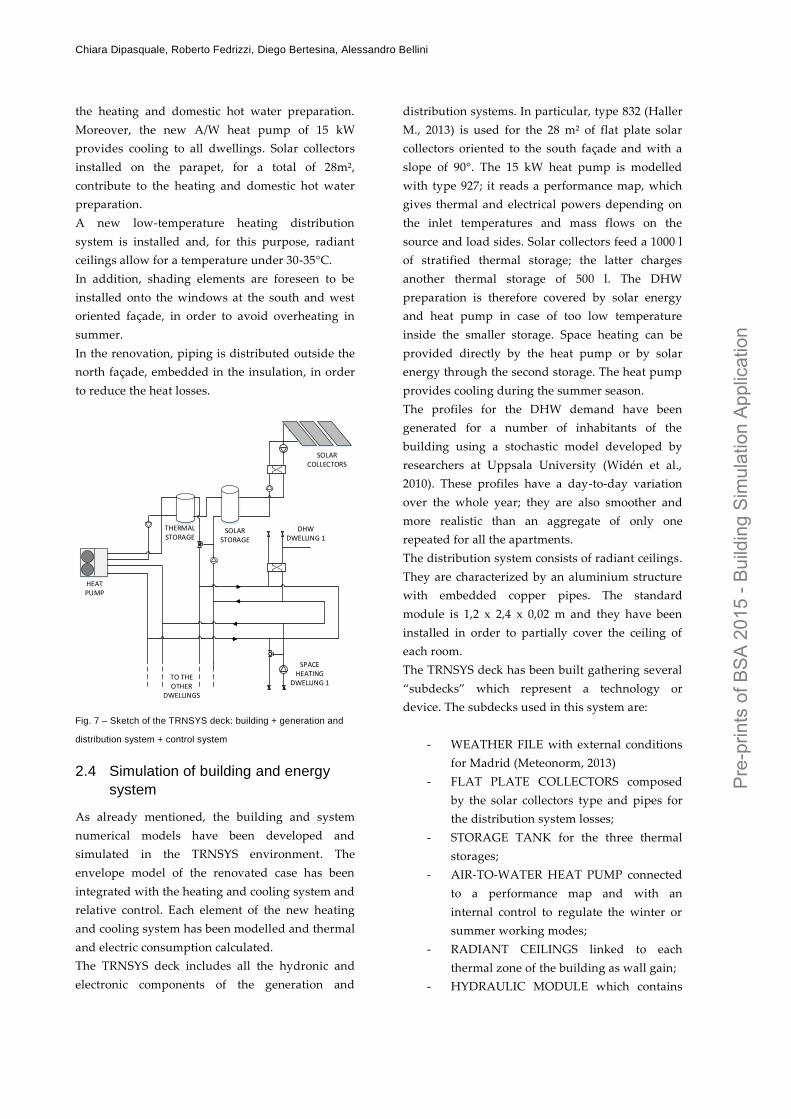
HEAT PUMP
THERMAL STORAGE
SOLAR STORAGE
SOLAR COLLECTORS
DHW DWELLING 1
SPACE HEATING
DWELLING 1TO THE OTHER
DWELLINGS
Fig. 7 – Sketch of the TRNSYS deck: building + generation and
distribution system + control system
2.4 Simulation of building and energy
system
As already mentioned, the building and system
numerical models have been developed and
simulated in the TRNSYS environment. The
envelope model of the renovated case has been
integrated with the heating and cooling system and
relative control. Each element of the new heating
and cooling system has been modelled and thermal
and electric consumption calculated.
The TRNSYS deck includes all the hydronic and
electronic components of the generation and
distribution systems. In particular, type 832 (Haller
M., 2013) is used for the 28 m² of flat plate solar
collectors oriented to the south façade and with a
slope of 90°. The 15 kW heat pump is modelled
with type 927; it reads a performance map, which
gives thermal and electrical powers depending on
the inlet temperatures and mass flows on the
source and load sides. Solar collectors feed a 1000 l
of stratified thermal storage; the latter charges
another thermal storage of 500 l. The DHW
preparation is therefore covered by solar energy
and heat pump in case of too low temperature
inside the smaller storage. Space heating can be
provided directly by the heat pump or by solar
energy through the second storage. The heat pump
provides cooling during the summer season.
The profiles for the DHW demand have been
generated for a number of inhabitants of the
building using a stochastic model developed by
researchers at Uppsala University (Widén et al.,
2010). These profiles have a day-to-day variation
over the whole year; they are also smoother and
more realistic than an aggregate of only one
repeated for all the apartments.
The distribution system consists of radiant ceilings.
They are characterized by an aluminium structure
with embedded copper pipes. The standard
module is 1,2 x 2,4 x 0,02 m and they have been
installed in order to partially cover the ceiling of
each room.
The TRNSYS deck has been built gathering several
“subdecks” which represent a technology or
device. The subdecks used in this system are:
- WEATHER FILE with external conditions
for Madrid (Meteonorm, 2013)
- FLAT PLATE COLLECTORS composed
by the solar collectors type and pipes for
the distribution system losses;
- STORAGE TANK for the three thermal
storages;
- AIR-TO-WATER HEAT PUMP connected
to a performance map and with an
internal control to regulate the winter or
summer working modes;
- RADIANT CEILINGS linked to each
thermal zone of the building as wall gain;
- HYDRAULIC MODULE which contains
Pre-
prin
ts o
f BSA
201
5 - B
uild
ing
Sim
ulat
ion
Appl
icat
ion
Energy building retrofitting of a multifamily house: a case study
pumps, valves and heat exchangers;
- MAIN CONTROL, which regulates the
whole functioning of the system;
- BUILDING MODEL.
The main control regulates all the parts of the
system in order to guarantee the thermal comfort
inside the building and the DHW preparation. It
receives information from all the subdecks and
gives control signals to all the active components.
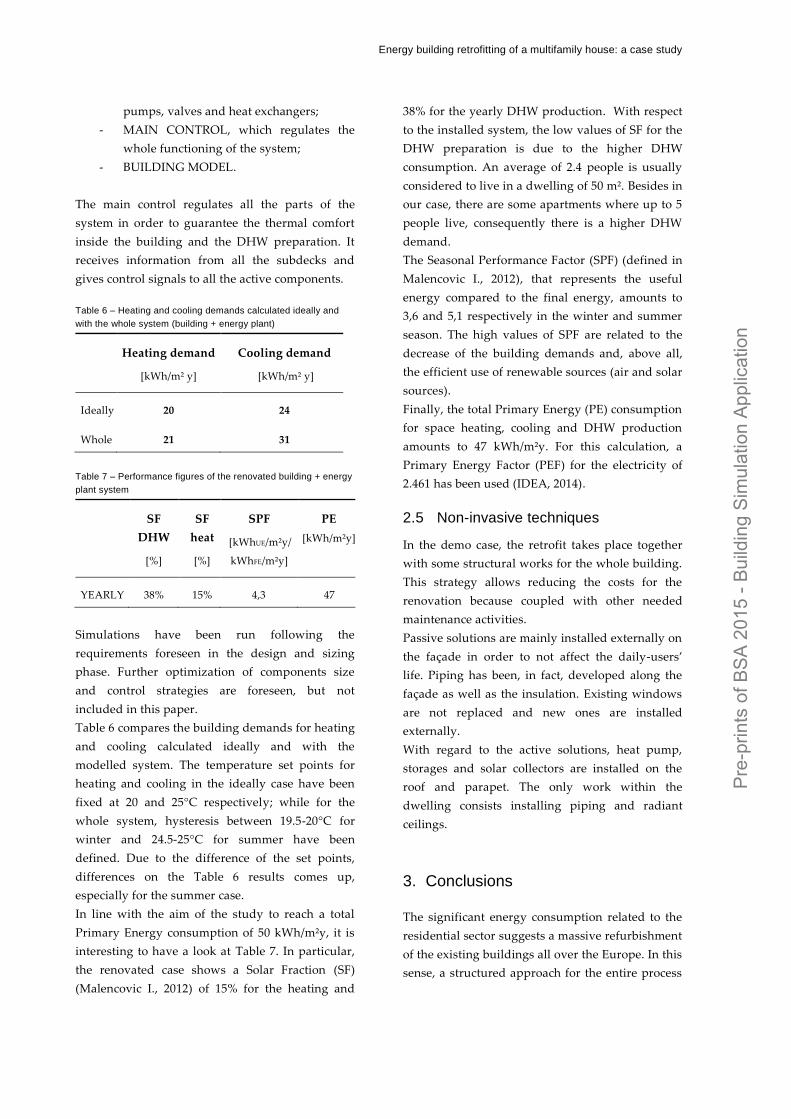
Table 6 – Heating and cooling demands calculated ideally and
with the whole system (building + energy plant)
Heating demand
[kWh/m² y]
Cooling demand
[kWh/m² y]
Ideally 20 24
Whole 21 31
Table 7 – Performance figures of the renovated building + energy
plant system
SF
DHW
[%]
SF
heat
[%]
SPF
[kWhUE/m²y/
kWhFE/m²y]
PE
[kWh/m²y]
YEARLY 38% 15% 4,3 47
Simulations have been run following the
requirements foreseen in the design and sizing
phase. Further optimization of components size
and control strategies are foreseen, but not
included in this paper.
Table 6 compares the building demands for heating
and cooling calculated ideally and with the
modelled system. The temperature set points for
heating and cooling in the ideally case have been
fixed at 20 and 25°C respectively; while for the
whole system, hysteresis between 19.5-20°C for
winter and 24.5-25°C for summer have been
defined. Due to the difference of the set points,
differences on the Table 6 results comes up,
especially for the summer case.
In line with the aim of the study to reach a total
Primary Energy consumption of 50 kWh/m²y, it is
interesting to have a look at Table 7. In particular,
the renovated case shows a Solar Fraction (SF)
(Malencovic I., 2012) of 15% for the heating and
38% for the yearly DHW production. With respect
to the installed system, the low values of SF for the
DHW preparation is due to the higher DHW
consumption. An average of 2.4 people is usually
considered to live in a dwelling of 50 m². Besides in
our case, there are some apartments where up to 5
people live, consequently there is a higher DHW
demand.
The Seasonal Performance Factor (SPF) (defined in
Malencovic I., 2012), that represents the useful
energy compared to the final energy, amounts to
3,6 and 5,1 respectively in the winter and summer
season. The high values of SPF are related to the
decrease of the building demands and, above all,
the efficient use of renewable sources (air and solar
sources).
Finally, the total Primary Energy (PE) consumption
for space heating, cooling and DHW production
amounts to 47 kWh/m²y. For this calculation, a
Primary Energy Factor (PEF) for the electricity of
2.461 has been used (IDEA, 2014).
2.5 Non-invasive techniques
In the demo case, the retrofit takes place together
with some structural works for the whole building.
This strategy allows reducing the costs for the
renovation because coupled with other needed
maintenance activities.
Passive solutions are mainly installed externally on
the façade in order to not affect the daily-users’
life. Piping has been, in fact, developed along the
façade as well as the insulation. Existing windows
are not replaced and new ones are installed
externally.
With regard to the active solutions, heat pump,
storages and solar collectors are installed on the
roof and parapet. The only work within the
dwelling consists installing piping and radiant
ceilings.
3. Conclusions
The significant energy consumption related to the
residential sector suggests a massive refurbishment
of the existing buildings all over the Europe. In this
sense, a structured approach for the entire process
Pre-
prin
ts o
f BSA
201
5 - B
uild
ing
Sim
ulat
ion
Appl
icat
ion
Chiara Dipasquale, Roberto Fedrizzi, Diego Bertesina, Alessandro Bellini
may help to individuate the best retrofitting
solutions, assess the new building consumption
and foresee those interventions with low impact on
the owners’ daily life.
In this paper, a methodology for building
refurbishment is applied on a multifamily house.
An energy audit on the existing building gave all
needed information on walls construction and
internal gains.
The modelling of the existing building individuates
the base case for further improvements on the
building envelope and system performances.
A parametric analysis has been carried out in this
work in order to create a building model which is
reliable, but at the same time, manageable within
the simulation of the whole system. The final
building model therefore contains 3 out of 5 floors,
where the in-between represents all the
intermediate storeys. One zone per orientation
(north-south) per dwelling has been modeled in
order to take into account the different internal
loads.
Renovation measures on the existing building
consist of the addition of an insulation layer on the
external walls, roof and ground floor and of new
windows externally to the existing ones. These
actions help to reduce up of 83% the building
heating demand and of 16% the cooling demand.
The energy system described allows to reach a total
PE consumption of 47 kWh/m²y.
The implementation of these renovation measures
shows as building consumptions can be drastically
reduced with non-invasive techniques.
4. Acknowledgement
The research leading to these results has received
funding from the European Union’s Seventh
Programme for research, technological
development and demonstration under grant
agreement No. 314461.
References
Birchall S., Wallis I., Churcher D., Pezzutto S.,
Fedrizzi R., Causse E., D2.1a Survey on the
energy needs and architectural features of the
EU building stock, iNSPiRe EU FP7 project
2014, www.inspirefp7.eu 2014.
García J., Romera D., Dipasquale C., Fedrizzi R.,
D’Antoni M., D7.1b Energy audit – Case study
Madrid, iNSPiRe EU FP7 project 2014,
www.inspirefp7.eu
Haller M., TRNSYS Type 832 v5.01 “Dynamic
Collector Model by Bengt Perers” Updated
Input-Output Reference. SPF Institut für
Solartechnik and HSR University of Applied
Research Rapperswil 2013
IBPSA-USA. Modeling Best Practice. Building
Energy Modelling. IBPSA-USA, Rocky
Mountain Institute, ASHRAE 2012.
http://bembook.ibpsa.us/,
IDAE, Factores de Emisión de CO2 y Coeficientes
de Paso a Energía Primaria de Diferentes
Fuentes de Energía Final Consumidas en el
Sector Edificios en España, Ministero de
Industria, energía y turismo 2014
Klein S.A. et al.. Trnsys 17. A transient simulation
program. Solar Energy Laboratory, Univeristy
of Wisconsin, Madison 2009
Malenkovic I., Definition of performance figures
for solar and heat pump systems. Technical
report 5.1.3, QAisT, Austrian Institute of
Technology 2012
Meteonorm database, Version 5 and 7, 2013.
http://meteonorm.com/.
RHC-ETP, “Common vision for the Renewable
Heating and Cooling Sector in Europe”, public
report, 2011
UNI EN 13370: Thermal performance of buildings
– Heat transfer via the ground – Calculation
method, 2008
Widén, J., Wäckelgård, E. A high-resolution
stochastic model of domestic activity patterns
and electricity demand. Applied Energy 87
(2010) 1880-1892.
Pre-
prin
ts o
f BSA
201
5 - B
uild
ing
Sim
ulat
ion
Appl
icat
ion