energy audit ppt
TRANSCRIPT
Petroleum Conservation Research Association
WELCOMES
P.BalachandranJoint Director
PCRA-SR-Chennai

Energy Scenario Energy Scenario
and and
Conservation Conservation
TechniquesTechniques
2

VISION THOUGHTS
The energy scene in the 21st century is going to see a major shift.
Very soon, oil and gas will see its finiteness.
It is high time that we realize this factor and work towards the fuel of the future.
- Dr. A P J Abdul Kalam, Former President of India, Address at Energy Technology Conclave “Technology for Sustainability”

Conservation of Energy
P.E K.E. P.E. K.E. … Is energy lost?
No! Energy is converted!

Law of Conservation of Energy
Energy can be neither created nor destroyed.
The total energy in a “closed” system is always the same.
The energy may be in different forms, but the amount will be equal.

Solar Energy was Used For Drying And Heating.
The Discovery Of Fire Led To The Possibility Of Burning Wood
For Cooking And Heating Thereby Using Energy.
For Several Thousand Years Energy Demands Were Met by Renewable Energy Sources—sun, Biomass (Wood, Leaves, Twigs), Hydel (Water) And Wind Power.
As Early As 4000–3500 Bc, Sailing Ships And Windmills Were Developed Harnessing Wind Energy.
With The Use Of Hydropower Through Water Mills Or
Irrigation Systems, Things Began To Move Faster.
Fuelwood And Dung Cakes Are A Major Source Of Energy In Rural India.
ENERGY FOOTPRINTS
ENERGY FOOTPRINTS
With the advent of the industrial revolution, the use of energy in the form of fossil fuels began growing as more and more industries were set up.
This occurred in stages, from the exploitation of coal deposits to the exploitation of oil and natural gas fields.
It has been only half a century since nuclear power began

The consumption of non-renewable sources of energy had caused more environmental damage than any other human activity.
Electricity generated from fossil fuels such as coal and crude oil has led to high concentrations of harmful gases in the atmosphere.
This has in turn led to problems such as ozone depletion and global warming. Vehicular pollution is also a grave problem.
Effect of using Non Renewable Energy
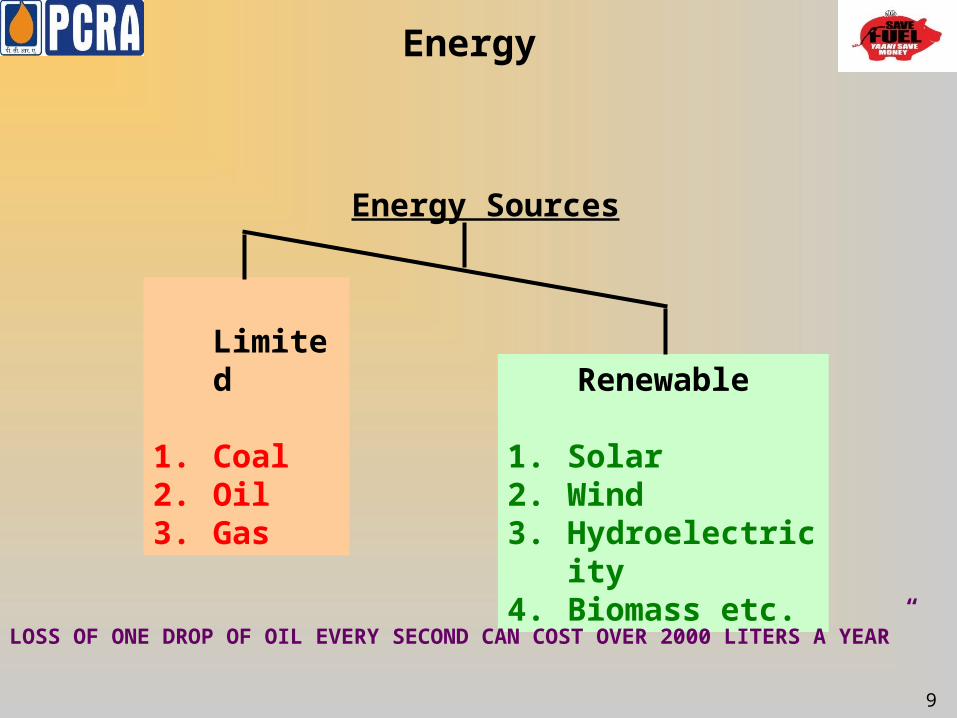
Energy
Energy Sources
Limited
1. Coal2. Oil3. Gas
Renewable
1. Solar2. Wind3. Hydroelectricity4. Biomass etc.
9
LOSS OF ONE DROP OF OIL EVERY SECOND CAN COST OVER 2000 LITERS A YEAR”

Energy
Primary Energy
Renewable (Inexhaustible) 1.Solar2.Wind3.Hydroelectricity4.Biomass etc(No Harmful Pollutants environmental Friendly Fuels)
10
Non Renewable Crude Oil, Coal, NG ( Last for few decades only)
Extracted from Natural resources Generated From primary energy Like Steam and Electricity
Secondary Energy

Fossil Energy’Life
As per the Availability and the Production rate
Crude oil will last for 42 years
Natural Gas will Last for 60 years
Coal will last for 122 years
11

Reserves Status
World Proven Reserves of Crude Oil : 1408.7 Thousand Million Barrels
India’s Proven Reserves of Crude Oil: 5.8 Thousand Million Barrels
4270.9
123.2 125.6 142.2
754.1
0
100
200
300
400
500
600
700
800
Th
ou
san
d M
illi
on
Bar
rel
AsiaPacific
NorthAmerica
S & CentAmerica
Africa Europe &Eurasia
MiddleEast
12

Crude oil Reserves/Production StatusWorld Proven R/P of Crude Oil : 42 yrs
India’s Proven R/P of Crude Oil: 20.7yrs
14.5 14.8
50.3
33.4
22.1
78.6
0
10
20
30
40
50
60
70
80
90
100
R/P
Rat
io
AsiaPacific
NorthAmerica
S & CentAmerica
Africa Europe &Eurasia
MiddleEast
13

Primary Energy Consumption
Country-wise primary energy consumption MMTOE
India:• At 524 MMTOE, 4th largest consumer of primary energy•One of the largest growing market for energy
3.84% of total
14

Japanese primary energy consumption per GDP is the lowest in the world due to various energy conservation measures taken for the respective sectors.
Primary Energy Consumption per GDPPrimary Energy Consumption per GDP
Primary Energy Consumption per GDPPrimary Energy Consumption per GDP
15
Japan EU US Korea Canada Thailand Middle East China India Indonesia Russia
Primary energy consumption (tons in oil equivalent)/GDP(thousand US$) indicated in the ratio when the Japanese figure is set at 1.
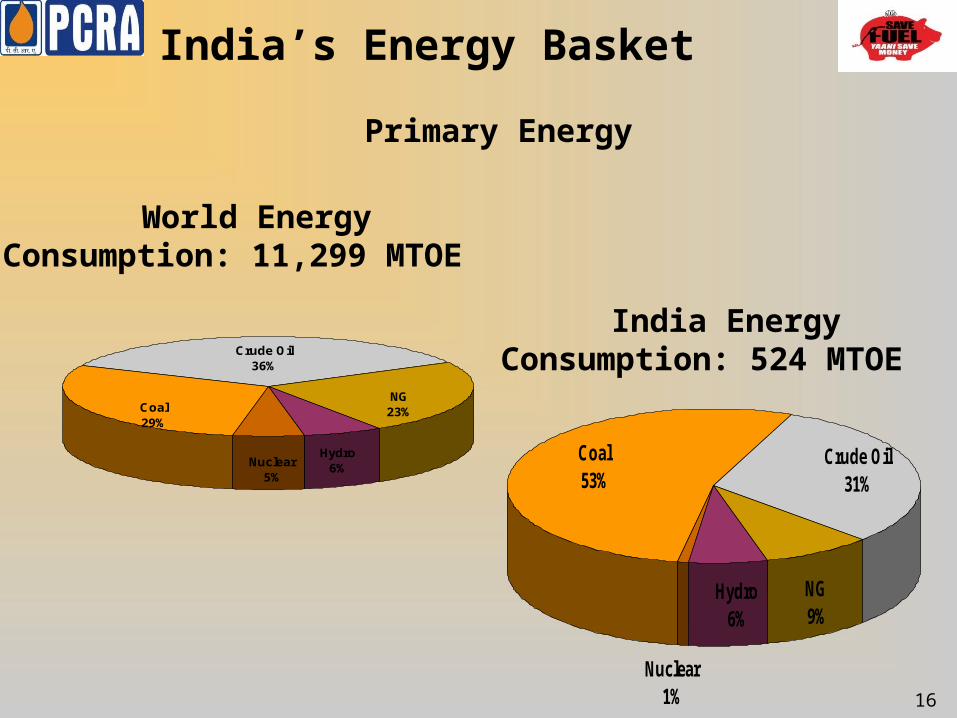
India’s Energy Basket
India Energy Consumption: 524 MTOE
Nuclear1%
Crude Oil31%
NG9%
Hydro6%
Coal53%
Nuclear5%
Hydro6%
NG23%
Crude Oil36%
Coal29%
World Energy Consumption: 11,299 MTOE
Primary Energy
16

Oil Consumption
India 4th largest consumer of oil : 135 MMT(3.4% of total)
India’s Oil consumption increased at 4% (decade after 1998) against the world of 1.4 %.
World oil consumption 3,928 MMT
Country-wise oil consumption MMTOE 17

Energy outlook
For India, sourcing of Energy remains a challenge…..
with 16% of Global Population;
0.5% of world’s Petroleum Reserve;
10% of world’s coal reserves;
8-10% GDP growth target;
18

19
0.4483.473
6.822 8.448
10.507
30.61833.021
35.34932.426 32.19 33.506
05
10152025303540
1960
-61
1965
-66
1970
-71
1975
-76
1980
-81
1985
-86
1990
-91
1995
-96
2000
-01
2005
-06
2008
-09
MM
T
Domestic Crude Oil Production Trend
Source: Planning Commission & TERI Data Book
Indigenous crude
20
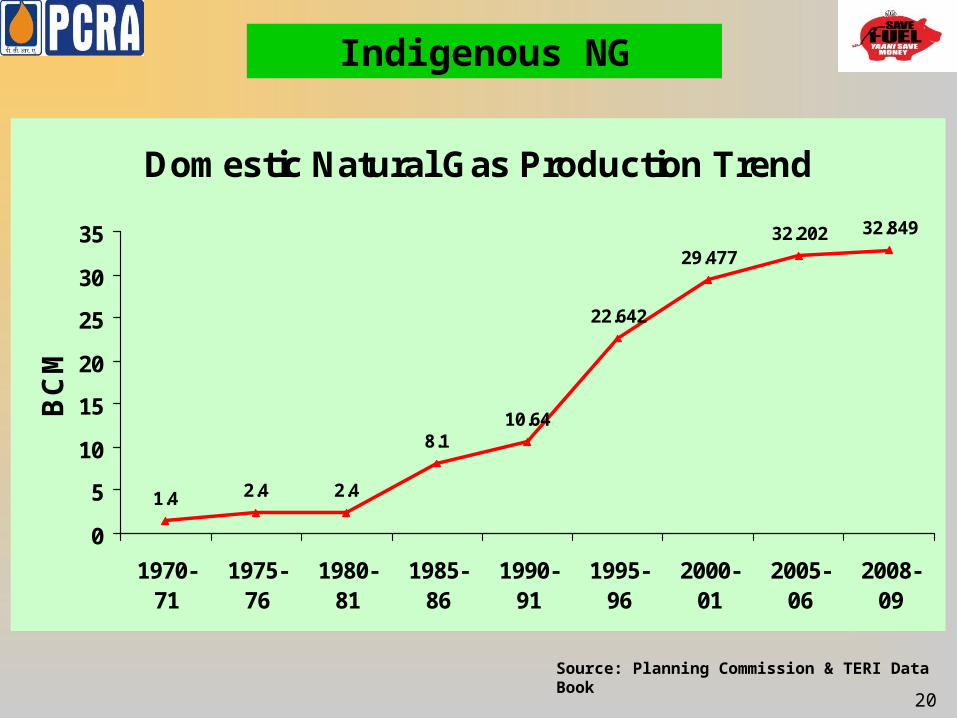
Source: Planning Commission & TERI Data Book
Domestic Natural Gas Production Trend
1.4 2.4 2.4
8.110.64
22.642
29.47732.202 32.849
0
5
10
15
20
25
30
35
1970-71
1975-76
1980-81
1985-86
1990-91
1995-96
2000-01
2005-06
2008-09
BC
MIndigenous NG

Energy Efficiency: The Fifth fuel
• Energy efficiency is generally the cleanest, least expensive, most quickly deployable, least understood, and most neglected way to manage energy.
• Reducing energy intensity is the fastest growing source of energy

ENERGY EFFICIENCY
Comprises of environment friendly industrial programmes, giving competitive advantage to enterprises, through:
Savings in energy consumption, Substitution of materials with no loss of quality or
performance, but less specific energy consumption Avoidance of waste or emissions leading to less handling of
materials. And Optimisation of operating plant processes leading to lower
costs and higher productivity

Country facing power shortages
Peak Shortage – 13% Average Shortage – 8%
Additional power required by 2012, 1 lakh MW Approximately 8,00,000 crores investment
India’s energy Intensity is higher by 3.7 times of Japan, 1.48 times of Asia & 1.5 times of USA
Higher wastage of energy. Very high energy saving potential.
WHY ENERGY EFFICIENCY?
Why energy efficiency? II
India is also highly dependent on imported oil to meet the energy demand, which raises the question of energy security of the nation.
Immense potential exists in this aspect of energy efficiency, particularly in the use of pumps, heating, ventilation, air conditioning and lighting areas

• ENERGY RESOURCES ARE LIMITED
• ENERGY DEMAND KEEP INCREASING
• ENERGY PRICES ARE GOING UP
• DUE TO GLOBAL COMPETITION WITH FALLING PRICES, THE INDUSTRY COMPELLED TO CUT COSTS
• REDUCES GREEN HOUSE GAS EMISSIONS
• INVESTMENTS IN ENERGY CONSERVATION PROVIDE MOST ATTACTIVE RETURNS
• IMPROVES OVERALL BUSINESS PROFITABILITY
SAVE ENERGY!!

26
EMERGENCE OF PCRA
1973 : OIL CRISIS WORLD OVER
STUDY TEAM
: ENGINEERS FROM IOC, NPC, DGTD ESTIMATED HUGE OIL CONSERVATION POTENTIAL IN INDUSTRIES & STUs
STUDY RESULTS
: CONSERVATION POTENTIAL OF 20 - 30%
6th JAN ’76 : PETROLEUM CONSERVATION ACTION GROUP (PCAG) FORMED
10th AUG’78
: PCAG RECONSTITUTED AS“PETROLEUM CONSERVATION RESEARCH ASSOCIATION” (PCRA) AND REGISTERED AS A SOCIETY UNDER MOP&NG

PCRA
INDUSTRY AGRICULTURE
TRANSPORT DOMESTIC
COMMERCIAL
OIL TO GAS
TO SOLAR/WIND
>GAS>TO CNG/H2
SECTROAL APPROACH
PCRA – An integrated Energy Solution Provider
LOSS OF EVEN ONE DROP EVERY SECOND CAN COST OVER 2000 LITERS A YEAR”

PCRA ACTIVITIES
• ENERGY AUDIT OF INSTALLATIONS• DRIVER TRAINING PROGRAM• TRANSPORT WORKSHOPS• FUEL OIL DIAGNOSTIC STUDIES• INSTITUTIONAL/INDUSTRY TRG PROGRAM• SEMINAR/TECH MEET/CONSUMER MEET• YOUTH/DOMESTIC PROGRAMS
LOSS OF EVEN ONE DROP EVERY SECOND CAN COST OVER 2000 LITERS A YEAR”

BEE (Website: http://www.bee-india.nic.in)
• The Government of India set up Bureau of Energy Efficiency (BEE)) on 1st March 2002
• under the provisions of the Energy Conservation Act, 2001.
A)to assist in developing policies and strategies --the Energy Conservation Act, 2001
B)objective of reducing energy intensityC)This active participation of all stakeholders, D) sustained adoption of energy efficiency in all
sectors. LOSS OF EVEN ONE DROP EVERY SECOND CAN COST OVER 2000 LITERS A YEAR”

With the enactment of the Indian Energy Conservation With the enactment of the Indian Energy Conservation Act, 2001, Act, 2001,
an institutional framework is now available for an institutional framework is now available for promoting energy efficiency in all sectors of the promoting energy efficiency in all sectors of the economyeconomy
Efficient use of energy and its conservationEfficient use of energy and its conservation
leaders and captains of industry are taking lead leaders and captains of industry are taking lead in implementing the best practices supporting the in implementing the best practices supporting the conservation programmeconservation programme
LOSS OF EVEN ONE DROP EVERY SECOND CAN COST OVER 2000 LITERS A YEAR”


What is Energy Audit ?
Energy Audit involves• Systematic Acquisition• Analysis of Energy Data• Implementing Energy Conservation
Measures
Need for Energy Audit:• Energy Crisis that the world face.• Depletion of Conventional Fuels• Minimize Energy Consumption• Maximize productivity• Achieve Energy efficiency

TYPES OF ENERGY AUDIT
Walk-Through Audit
Utility Cost Analysis
Standard Energy Audit
Detailed Energy Audit

Walk-Through Audit
Short onsite visits for inspection. Inexpensive and simple actions. Immediate energy savings considered.Operating & Maintenance procedure.
• E.g. Repairing broken windows• E.g. Boiler A\F ratios Adjustment.• E.g. Lowering Cooling Preset Temp

Utility Cost Analysis
Establish Relation between cost & Utility.Analyze Operating cost of the Utility.Obtain data from:
• Energy Bills• Peak Demands.• Weather effects identified
Steps Include:• Verify Energy Bills & Ensure no mistakes made• Determine dominant charges• Peak demand shaving measures• Will Alternative cost effective fuels help

Standard Energy Audit
Comprehensive Analysis of Energy Systems
Development of Baseline• Identification of Energy Uses• Evaluation of Energy Savings• Cost Effectiveness of Selected ECM.
Various Mathematical Tools are used • Degree day methods• Linear regression Methods• Simple Pay Back Analysis

Detailed Energy Audit
Most Comprehensive & Time ConsumingUse of hand held \ stationary instrumentsSophisticated Computer SimulationsFor:
• Evaluating Energy use.• Identifying Potential savings.• Recommending Energy Retrofits• Cost Effectiveness of Energy Retrofits

Energy Auditing Instruments.Electrical Instruments
• Measures Electrical Parameters like kva, kW, PF, Amps and Volts.
• Instant measurements can be taken.
• Hand held devices.
Combustion Analyzer.• Has Built in Chemical
Cells• Measures gases like
O2,CO,Nox,Sox.
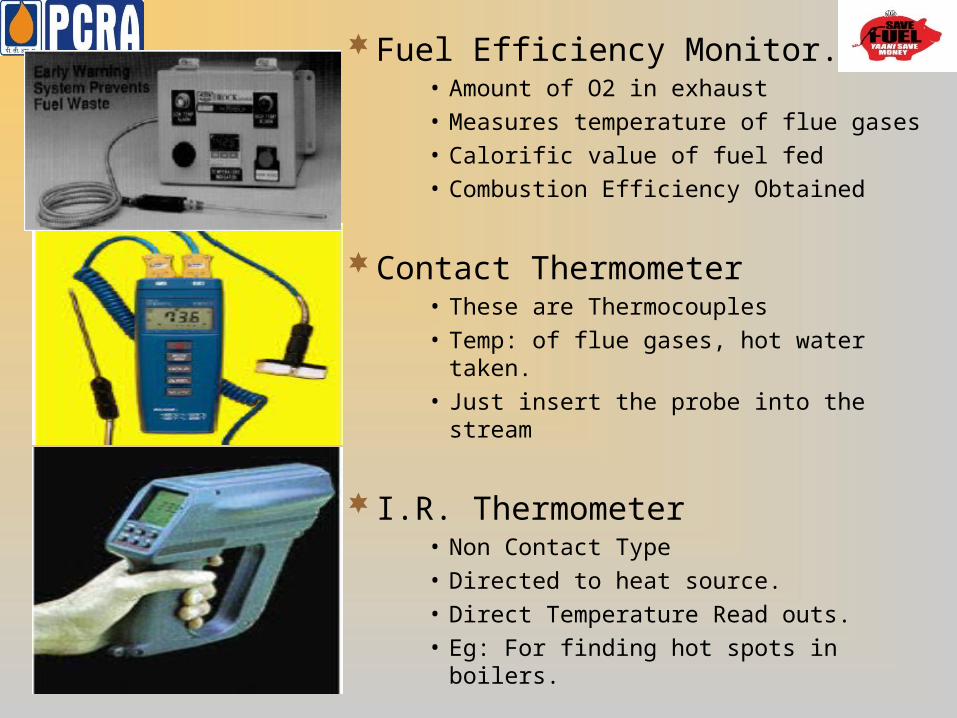
Fuel Efficiency Monitor.• Amount of O2 in exhaust• Measures temperature of flue gases• Calorific value of fuel fed• Combustion Efficiency Obtained
Contact Thermometer• These are Thermocouples• Temp: of flue gases, hot water taken.• Just insert the probe into the stream
I.R. Thermometer• Non Contact Type• Directed to heat source.• Direct Temperature Read outs.• Eg: For finding hot spots in boilers.

Speed Measuring Instruments
Tachometer• Contact Type ones• Direct Access Necessary.
Stroboscope• Sophisticated.• Direct Access Not Necessary.• Safer Ones.

Electrical Instruments• Measures Electrical
Parameters like kva, kW, PF, Amps and Volts.
• Instant measurements can be taken.
• Hand held devices.
Combustion Analyzer.• Has Built in Chemical
Cells• Measures gases like
O2,CO,Nox,Sox.

Leak Detectors• Ultrasonic Instruments• Detects leaks In compressor• Leaks beyond human abilities
Lux Meters• Measures Illumination Levels• Contains a Photocells.• Converts light to Electric
Signal• Calibrated as Lux.

ENERGY CONSERVATION ACT,2001LIST OF ENERGY INTENSIVE INDUSTRIES(schedule)
1. Aluminium 6. Chlor Alkali2. Fertilisers 7. Sugar3. Cement 8. Textile 4. Pulp & Paper 9. Chemicals5. Iron & Steel 10.Railways
11. Port Trust12. Transport Sector(Industries and Services)13. Petrochemical, Gas Crackers and Naptha Crackers & Petroleum Refineries14. Thermal Power Stations, Electricity transmission and distribution companies
and commercial buildings or establishments specified as designated consumer
15. Commercial Buildings of establishments
59
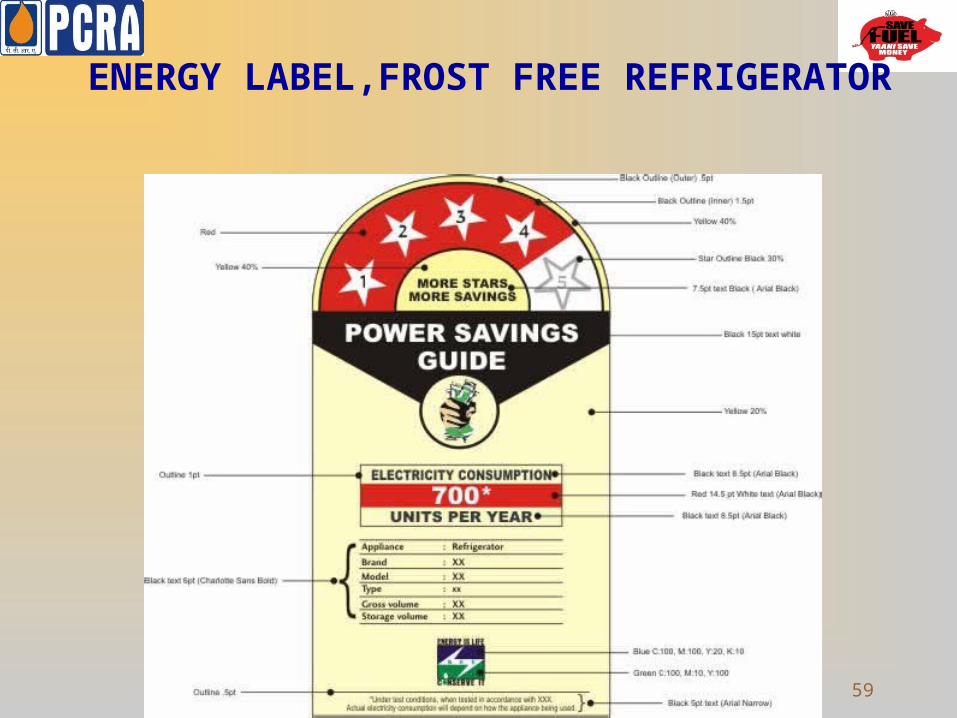
ENERGY LABEL,FROST FREE REFRIGERATOR

60
Enjoy the interest on the principal principal of nature’s bounty.of nature’s bounty. Do not treat it Do not treat it as booty.as booty. Mankind should not be Mankind should not be the worst NPA amongst the life the worst NPA amongst the life forms.forms.
Concepts for Future

THANK YOU.