energy and water conservation in biodiesel purification ... · energy and water conservation in...
TRANSCRIPT

Energy and Water Conservation in Biodiesel Purification Processes
Michele Hastie
Thesis submitted to the Faculty of Graduate and Postdoctoral Studies
In partial fulfillment of the requirements for the degree of
Master of Applied Science in
Chemical Engineering
Department of Chemical and Biological Engineering Faculty of Engineering University of Ottawa
© Michele Hastie, Ottawa, Canada, 2011

ii
Abstract
Biodiesel purification processes generate wastewater streams that require a large amount of
energy when distillation is used as a treatment technology. Process simulation software was
used to show that an alternative water treatment process involving ion exchange would
require only 31% of the energy used by distillation. Experiments showed that multiple
washing stages were required to meet the standard specification for sodium, an impurity
present in crude biodiesel, when washing biodiesel made from used frying oil. A comparison
was made between washing biodiesel in a cross-current washing configuration and a counter-
current configuration. Both configurations met the specification for sodium within three
washing stages; however, the counter-current configuration required less water, making it the
more efficient process. Lastly, the removal of sodium from wastewater samples using an ion
exchange resin was experimentally investigated. The results validated the use of ion
exchange to reduce energy consumption in biodiesel purification.

iii
Résumé
Le procédé de purification du biodiésel génère des eaux usées qui nécessitent une grande
quantité d'énergie lorsqu’elles sont traitées par distillation. Un logiciel de simulation a été
utilisé pour démontrer qu'un processus alternatif de traitement d’eaux impliquant l'échange
d'ions nécessiterait seulement 31% de l'énergie requise en utilisant la distillation. Des
expériences ont montré que du lavage à plusieurs étapes est nécessaire pour atteindre les
spécifications standard pour le sodium, une impureté présente dans le biodiésel brut, lors du
lavage du biodiésel fabriqué à partir d'huile de friture usagée. Une comparaison a été faite
entre le lavage du biodiésel dans une configuration à courant croisé et une configuration
contre-courant. Les deux configurations conforment aux spécifications pour le sodium avec
trois étapes de lavage, cependant la configuration à contre-courant nécessite moins d'eau, ce
qui rend le processus plus efficace. Enfin, l’enlèvement du sodium à partir d'échantillons
d'eaux usées en utilisant une résine d’échange d'ions a été étudiée expérimentalement. Les
résultats ont validé l'utilisation de l'échange d'ions pour réduire la consommation d'énergie
dans la purification du biodiésel.

iv
Statement of Contributions of Collaborators
I hereby declare that I am the sole author of this thesis. I performed all the experiments,
computer simulations, and data analysis. I have written all of the chapters contained in this
thesis.
Dr. Marc. A. Dubé and Dr. André Y. Tremblay supervised this thesis project and provided
continual guidance and support. They also made editorial comments and corrections to the
written work presented.

v
Acknowledgements
I would like to thank my supervisors, Dr. Marc. A. Dubé and Dr. André Y. Tremblay, for
giving me the opportunity to complete this project under their supervision. They gave me
guidance and support throughout the completion of this thesis and I appreciate all that I have
learned from them.
I would like to thank Dr. Nimal De Silva from the Department of Earth Sciences at the
University of Ottawa for the analysis he kindly completed for me.
I would like to thank NSERC for financial support of this project.
I would like to acknowledge the staff of the Chemical Engineering Department: Franco
Ziroldo, Gérard Nina, Louis Tremblay, Francine Pértrin, and Sylvie Saindon.
Last but not least, many thanks to all my friends and family for their continued support and
encouragement.

vi
Table of Contents
Abstract ....................................................................................................................... ii
Résumé ....................................................................................................................... iii
Statement of Contributions of Collaborators ............................................................... iv
Acknowledgements ...................................................................................................... v
List of Tables ................................................................................................................ x
List of Figures ............................................................................................................. xii
Chapter 1
Introduction ................................................................................................................. 1
1.1 Objectives ................................................................................................................... 3
1.2 Thesis Structure .......................................................................................................... 3
1.3 References .................................................................................................................. 4
Chapter 2
Biodiesel Production and Purification ........................................................................... 5
2.1 Introduction ................................................................................................................ 5
2.2 Biodiesel Reaction Chemistry ..................................................................................... 6
2.2.1 Transesterification ............................................................................................... 6
2.2.2 Feedstocks ........................................................................................................... 7
2.2.3 Catalysts ............................................................................................................... 8
2.3 Reaction Products and Impurities ............................................................................ 10
2.4 Biodiesel Production Processes ................................................................................ 12
2.4.1 Low FFA Oil Feedstock ....................................................................................... 12
2.4.2 High FFA Oil Feedstock ...................................................................................... 13
2.5 Biodiesel Purification Processes ............................................................................... 15
2.5.1 Water Washing .................................................................................................. 15
2.5.2 Membrane Technology ...................................................................................... 18
2.5.3 Ion Exchange ...................................................................................................... 19
2.5.4 Adsorption ......................................................................................................... 20
2.6 Wastewater .............................................................................................................. 20
2.7 Summary ................................................................................................................... 21
2.8 References ................................................................................................................ 23

vii
Chapter 3
Experimental Design ................................................................................................... 26
3.1 Biodiesel Preparation ............................................................................................... 26
3.1.1 Canola Oil Feedstock ......................................................................................... 26
3.1.2 Waste Oil Feedstock .......................................................................................... 29
3.2 Water Washing Procedure ....................................................................................... 32
3.3 Analysis for Sodium Concentration .......................................................................... 34
3.3.1 Inductively Coupled Plasma Optical Emission Spectroscopy (ICP-OES) ............ 34
3.3.2 Conductivity ....................................................................................................... 35
3.4 Analysis for FFA/Soap Concentration ....................................................................... 37
3.5 References ................................................................................................................ 39
Chapter 4
Simulation of Biodiesel Wastewater Treatment Processes .......................................... 40
4.1 Introduction .............................................................................................................. 40
4.2 Simulation Conditions ............................................................................................... 41
4.2.1 Thermodynamic Model ..................................................................................... 41
4.2.2 Components ...................................................................................................... 41
4.2.3 Transesterification Reaction Products .............................................................. 41
4.2.4 Manipulated Variable ........................................................................................ 43
4.3 Water Treatment by Distillation ............................................................................... 44
4.3.1 Glycerol Purification Column (T-101) ................................................................ 44
4.3.2 Methanol Recovery Column (T-102) ................................................................. 45
4.3.3 Water Recycle .................................................................................................... 46
4.3.4 Energy Demand ................................................................................................. 47
4.4 Water Treatment by Ion Exchange ........................................................................... 47
4.4.1 Ion Exchange Columns ....................................................................................... 49
4.4.2 Energy Demand ................................................................................................. 51
4.5 Results and Discussion .............................................................................................. 51
4.5.1 Water Treatment by Distillation ........................................................................ 51
4.5.2 Water Treatment by Ion Exchange .................................................................... 52
4.5.3 Comparison of Water Treatment Options ......................................................... 54
4.5.4 Effect of Amount of Water ................................................................................ 55
4.6 Summary ................................................................................................................... 55
4.7 References ................................................................................................................ 56
4.8 Sample Calculations .................................................................................................. 58

viii
Chapter 5
Sodium Distribution between Water and FAME Phases............................................... 60
5.1 Introduction .............................................................................................................. 60
5.2 Experimental Design ................................................................................................. 60
5.2.1 Canola Oil Derived FAME ................................................................................... 60
5.2.2 Waste Oil Derived FAME ................................................................................... 61
5.2.3 Initial Sodium Conductivity ................................................................................ 62
5.2.4 Method .............................................................................................................. 62
5.2.5 Determination of Error ...................................................................................... 63
5.2.6 Initial Concentrations in FAME .......................................................................... 63
5.3 Results and Discussion .............................................................................................. 63
5.3.1 Sodium Extraction .............................................................................................. 63
5.3.2 Distribution Coefficient ..................................................................................... 65
5.4 Free Fatty Acid (FFA) Extraction ............................................................................... 69
5.5 Summary ................................................................................................................... 72
5.6 References ................................................................................................................ 73
Chapter 6
Counter-Current Washing of Waste Oil Derived FAME ................................................ 75
6.1 Introduction .............................................................................................................. 75
6.2 Simulations ............................................................................................................... 76
6.2.1 Cross-Current Washing ...................................................................................... 77
6.2.2 Counter-Current Washing ................................................................................. 78
6.2.3 Simulation Conditions ........................................................................................ 79
6.2.4 Simulation Results ............................................................................................. 79
6.3 Experimental Design ................................................................................................. 80
6.3.1 Determination of Error ...................................................................................... 81
6.3.2 Cross-Current Washing ...................................................................................... 81
6.3.3 Counter-Current Washing ................................................................................. 83
6.4 Results and Discussion .............................................................................................. 86
6.4.1 Conductivity of Extracted Water Phases ........................................................... 86
6.4.2 Sodium Extraction by Cross-Current Washing .................................................. 87
6.4.3 Sodium Extraction by Counter-Current Washing .............................................. 88
6.4.4 Comparison with Simulation Results ................................................................. 89
6.4.5 Comparison of Experimental Results ................................................................ 89
6.5 Summary ................................................................................................................... 90
6.6 References ................................................................................................................ 91

ix
Chapter 7
Ion Exchange of Biodiesel Wastewater ....................................................................... 92
7.1 Introduction .............................................................................................................. 92
7.2 Ion Exchange Theory ................................................................................................. 94
7.3 Experimental Design ................................................................................................. 97
7.3.1 Ion Exchange Resin ............................................................................................ 97
7.3.2 Pure Water-NaCl Solutions ................................................................................ 98
7.3.3 Wastewater Solutions ....................................................................................... 99
7.3.4 Determination of Error .................................................................................... 100
7.3.5 Determination of the Change in Sodium for the Pure Water-NaCl Solutions . 100
7.3.6 Determination of the Change in Sodium for the Wastewater Solutions ........ 101
7.4 Results and Discussion ............................................................................................ 103
7.4.1 Sodium Removal from Water-NaCl Solutions ................................................. 106
7.4.2 Sodium Removal from Wastewater Samples .................................................. 108
7.5 Summary ................................................................................................................. 111
7.6 References .............................................................................................................. 112
Chapter 8
Conclusions and Recommendations .......................................................................... 113
8.1 Conclusions ............................................................................................................. 113
8.1.1 Chapter 4 – Simulation of Biodiesel Wastewater Treatment Processes ......... 113
8.1.2 Chapter 5 – Sodium Distribution between Water and FAME Phases ............. 114
8.1.3 Chapter 6 – Counter-Current Washing of Waste Oil Derived FAME ............... 114
8.1.4 Chapter 7 – Ion Exchange of Biodiesel Wastewater ....................................... 115
8.2 Recommendations .................................................................................................. 115
Appendix A
Raw Data ................................................................................................................. 117
A.1 Wastewater Treatment Process Simulations ......................................................... 117
A.2 Single Stage Washing Experiments ......................................................................... 119
A.3 Counter-Current Washing Experiments ................................................................. 122
A.4 Ion Exchange Experiments ...................................................................................... 123

x
List of Tables
Table 2.1 Advantages and disadvantages of catalysts available for biodiesel production. ..... 8
Table 2.2 Effect of impurities in biodiesel and ASTM concentration limits. .......................... 11
Table 2.3 Average level of impurities in crude biodiesel prior to purification. ...................... 12
Table 2.4 Summary of studies on water washing of biodiesel. .............................................. 16
Table 2.5 Wastewater generated from biodiesel production by source. .............................. 20
Table 2.6 Properties of biodiesel wastewater by source........................................................ 21
Table 3.1 Chemicals used to prepare FAME. .......................................................................... 26
Table 3.2 Mass of reactants used for transesterification of canola oil. ................................. 27
Table 3.3 Mass of reactants used for acid esterification of waste oil. ................................... 30
Table 3.4 Mass of reactants used for transesterification of waste oil. .................................. 31
Table 3.5 Chemicals used in titration of FFA/soap. ................................................................ 38
Table 4.1 Molar flows of reactants and products from transesterification. .......................... 42
Table 4.2 Compositions and mass flows of the two liquid phases formed by the transesterification reaction.................................................................................. 43
Table 4.3 Normal boiling points of the components in the wastewater mixture. ................. 45
Table 4.4 Energy streams for water treatment by distillation process. ................................. 47
Table 4.5 Resin properties used to design the ion exchange operation. ............................... 50
Table 4.6 Energy streams for water treatment by ion exchange process. ............................. 51
Table 5.1 Run conditions for single stage washing of canola oil derived FAME. ................... 61
Table 5.2 Run conditions for single stage washing of waste oil derived FAME. .................... 62
Table 5.3 Initial sodium concentrations in FAME. .................................................................. 63
Table 6.1 Simulation conditions.............................................................................................. 79
Table 6.2 Water use for each series in the counter-current washing experiments. .............. 86

xi
Table 7.1 Typical properties of biodiesel wastewater. ........................................................... 92
Table 7.2 Initial sodium concentrations of wastewater and pure water-NaCl samples. ....... 97
Table 7.3 Properties of strong acid ion exchange resin (GF404) ............................................ 98
Table 7.4 Amounts of resin added to the pure water-NaCl solutions. ................................... 99
Table 7.5 Amounts of resin added to the wastewater solutions. ........................................ 100
Table 7.6 Initial concentrations of FFA in the wastewater solutions. .................................. 102
Table 7.7 Initial pH of samples prior to adding resin. ........................................................... 104
Table 7.8 Percent sodium removal from water-NaCl solutions. .......................................... 108
Table 7.9 Percent sodium removal from wastewater samples. ........................................... 110
Table A.1 Simulation data for design of distillation column T-102 for water treatment by distillation process (Figure 4.1). .................................................................... 117
Table A.2 Energy stream data for water treatment by distillation process (Figure 4.1). ..... 117
Table A.3 Simulation data for design of ion exchange operation for water treatment by ion exchange process (Figure 4.2). .................................................................... 118
Table A.4 Energy stream data for water treatment by ion exchange process (Figure 4.2). .................................................................................................................... 118
Table A.5 Raw data from single stage washing of canola oil derived FAME. ....................... 119
Table A.6 Raw data from single stage washing of waste oil derived FAME. ........................ 120
Table A.7 Titration of FAME and water samples for determination of FFA concentration. 121
Table A.8 Raw data from counter-current washing of waste oil derived FAME. ................. 122
Table A.9 Raw data for ion exchange of deionized water samples. ..................................... 123
Table A.10 Raw data from ion exchange of pure water-NaCl samples. ............................... 124
Table A.11 Raw data from ion exchange of wastewater samples. ....................................... 126

xii
List of Figures
Figure 1.1 Break down by fuel of (a) the world primary energy supply and (b) consumption attributed to transportation in 2008 (IEA, 2010 a). Other includes geothermal, solar, and wind energy. ....................................................... 1
Figure 2.1 Triglyceride molecule. .............................................................................................. 5
Figure 2.2 Transesterification of a triglyceride molecule with methanol to form fatty acid methyl esters (biodiesel) and glycerol. .......................................................... 6
Figure 2.3 Saponification reaction of triglycerides to form soap. ............................................ 9
Figure 2.4 Reaction of FFA with base catalyst to form soap. ................................................... 9
Figure 2.5 Acid esterification of FFA to form FAME. .............................................................. 10
Figure 2.6 Biodiesel production process for low FFA feedstocks. .......................................... 13
Figure 2.7 Acid esterification pre-treatment for high FFA feedstocks. .................................. 14
Figure 3.1 Reactor set up for biodiesel preparation. .............................................................. 27
Figure 3.2 Water washing apparatus. ..................................................................................... 32
Figure 3.3 Conductivity of sodium sulphate and sodium chloride solutions. ........................ 36
Figure 3.4 Conductivity calibration curve for determining sodium concentration of wastewater samples. ........................................................................................... 37
Figure 4.1 Biodiesel purification process with water treatment by distillation. .................... 44
Figure 4.2 Biodiesel purification process with water treatment by ion exchange. ................ 48
Figure 4.3 Steps involved in a typical ion exchange operation. ............................................. 49
Figure 4.4 Energy demand of water treatment of biodiesel wastewater by distillation. ...... 52
Figure 4.5 Energy demand of water treatment of biodiesel wastewater by ion exchange. ............................................................................................................. 53
Figure 4.6 Total energy demand of water treatment of biodiesel wastewater. .................... 54
Figure 5.1 Initial and final sodium concentrations in the water phase for the canola oil derived FAME. ...................................................................................................... 64

xiii
Figure 5.2 Initial and final sodium concentrations in the water phase for the waste oil derived FAME. ...................................................................................................... 65
Figure 5.3 Final sodium concentrations in the canola oil derived FAME and water phases. ................................................................................................................. 66
Figure 5.4 Distribution coefficient of sodium between the water and FAME phases for the canola oil derived FAME as a function of the concentration in the water phase. ................................................................................................................... 67
Figure 5.5 Final sodium concentrations in the waste and canola oil derived FAME and water phases. ....................................................................................................... 68
Figure 5.6 Distribution coefficient of sodium between the water and FAME phases for the waste and canola oil derived FAMEs as a function of the concentration in the water phase. .............................................................................................. 69
Figure 5.7 Final mass of FFA in the water and waste oil derived FAME phases with respect to initial sodium concentration in the water phase. .............................. 70
Figure 5.8 Final FFA concentration in the water and waste oil derived FAME phases with respect to initial sodium concentration in the water phase. ...................... 71
Figure 5.9 Reaction of FFA with sodium to form soap. .......................................................... 72
Figure 6.1 Equilibrium data for sodium distribution between FAME and water phases as determined from single stage washing experiments. ......................................... 76
Figure 6.2 Cross-current multistage extraction process flow diagram. ................................. 77
Figure 6.3 Counter-current multistage extraction process flow diagram. ............................. 78
Figure 6.4 Concentration of sodium remaining in the FAME phase for the cross-current and counter-current simulations. The inset shows a close-up at concentrations close to 5 ppm. ........................................................................... 80
Figure 6.5 Cross-current washing sequence. .......................................................................... 82
Figure 6.6 First two series of washes in the counter-current washing sequence. ................. 84
Figure 6.7 Final three series of washes in the counter-current washing sequence. .............. 85
Figure 6.8 Conductivity of water phase after contacting with FAME for each washing series. ................................................................................................................... 86

xiv
Figure 6.9 Concentration of sodium remaining in the FAME phase for the cross-current washing sequence. The inset shows a close-up at concentrations close to 5 ppm. ..................................................................................................................... 87
Figure 6.10 Concentration of sodium remaining in the FAME phase for the counter-current washing sequence. The inset shows a close-up at concentrations close to 5 ppm. ..................................................................................................... 88
Figure 6.11 Concentration of sodium remaining in FAME phase wash for the counter-current washing sequences. The inset shows a close-up at concentrations close to 5 ppm. ..................................................................................................... 89
Figure 7.1 Treatment of biodiesel wastewater by ion exchange for recycle. ........................ 93
Figure 7.2 Cation exchanger initially in the “A” form (left) in solution with counter ion “B”. The counter ions are redistributed by diffusion until equilibrium is attained (right). Figure adapted from Helfferich (1962). ..................................... 95
Figure 7.3 pH with respect to the ratio of the mass of resin to the mass of sample. .......... 103
Figure 7.4 pH with respect to the log of the ratio of the mass of resin to the mass of sample. ............................................................................................................... 104
Figure 7.5 Change in hydrogen ion concentration of water phase with respect to the ratio of the mass of resin to the mass of sample for deionized water samples and water-NaCl solutions. .................................................................... 105
Figure 7.6 Isotherms for the water-NaCl solutions at ambient temperature. ..................... 106
Figure 7.7 Separation factors for sodium with respect to the ratio of the mass of resin to the mass of sample. ....................................................................................... 107
Figure 7.8 Isotherms for the wastewater samples at ambient temperature. ...................... 109
1
Chapter 1
Introduction
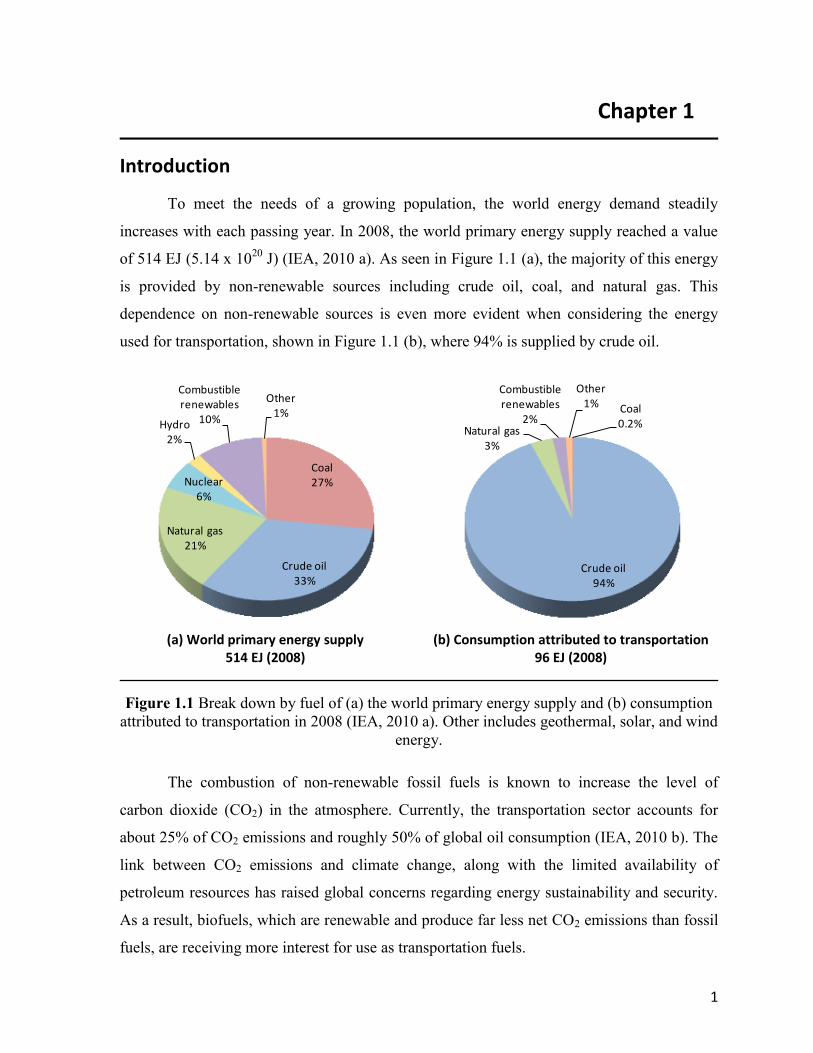
To meet the needs of a growing population, the world energy demand steadily
increases with each passing year. In 2008, the world primary energy supply reached a value
of 514 EJ (5.14 x 10²⁰
J) (IEA, 2010 a). As seen in Figure 1.1 (a), the majority of this energy
is provided by non-renewable sources including crude oil, coal, and natural gas. This
dependence on non-renewable sources is even more evident when considering the energy
used for transportation, shown in Figure 1.1 (b), where 94% is supplied by crude oil.
(a) World primary energy supply 514 EJ (2008)
(b) Consumption attributed to transportation 96 EJ (2008)
Figure 1.1 Break down by fuel of (a) the world primary energy supply and (b) consumption
attributed to transportation in 2008 (IEA, 2010 a). Other includes geothermal, solar, and wind
energy.
The combustion of non-renewable fossil fuels is known to increase the level of
carbon dioxide (CO2) in the atmosphere. Currently, the transportation sector accounts for
about 25% of CO2 emissions and roughly 50% of global oil consumption (IEA, 2010 b). The
link between CO2 emissions and climate change, along with the limited availability of
petroleum resources has raised global concerns regarding energy sustainability and security.
As a result, biofuels, which are renewable and produce far less net CO2 emissions than fossil
fuels, are receiving more interest for use as transportation fuels.
Coal27%
Crude oil33%
Natural gas21%
Nuclear6%
Hydro2%
Combustible renewables
10%
Other1% Coal
0.2%
Crude oil94%
Natural gas3%
Combustible renewables
2%
Other1%

2
Biofuels are renewable energy sources produced from biomass. Liquid biofuels such
as sugar- or starch-based ethanol and biodiesel made from vegetable oils, animal fats, or
waste cooking oil, can replace or be blended with petroleum based fuels. These liquid fuels
are especially convenient since they fit into the currently available fuel distribution
infrastructure and because they can be used in typical internal combustion engines.
Furthermore, due to their closed carbon cycle and renewability, the use of biofuels can
reduce CO2 emissions and contribute toward energy sustainability. As a result, the
Government of Canada has made regulations requiring an average renewable fuel content of
five per cent in gasoline, which came into effect in December 2010 (EC, 2010).
Biodiesel is produced by chemically converting the triglycerides present in vegetable
oils or animal fats. This process forms fatty acid methyl esters (FAME) which have similar
properties to petroleum diesel and are compatible with conventional diesel engines. Biodiesel
has advantages over petroleum diesel including better lubricity, lower toxicity, improved
flash point, biodegradability, negligible sulfur content, and lower overall exhaust emissions
(Moser, 2009).
The main drawback of biodiesel is the high cost of production due to the high cost of
the vegetable oil feedstock. As a result, commercial production is usually not profitable
without government subsidies. The high raw material cost can be circumvented by using
cheaper feedstocks such as used frying oils obtained from households or restaurants. Using
waste oil also has the added benefit of reusing a waste material that would otherwise need to
be disposed of by other means. Unfortunately, used frying oils contain high levels of free
fatty acids (FFA), which complicate biodiesel production by adding processing steps and
interfering with downstream purification.
Another issue facing biodiesel producers is the large amount of water required to
purify crude biodiesel. Typically, per litre of biodiesel produced, between one and three litres
of wastewater is produced. This large wastewater stream requires treatment prior to disposal
or reuse in the process. The suggested method of water recovery is by distillation, which is an
energy intensive process. Therefore, reducing the amount of water required for purification
as well as using alternative water treatment methods will improve the energy efficiency of
the process. This will increase the energy yield of biodiesel and thus improve the economic
viability and sustainability of the fuel.

3
1.1 Objectives
In this thesis project, it was postulated that the energy efficiency of the biodiesel
purification process could be improved by reducing the amount of water used for
purification. As a starting point, the process was simulated to determine if the energy
required for water treatment could be reduced if ion exchange is used in place of distillation.
The simulation would also provide information on the impact that reducing the amount of
water used would have on the energy demand of the processes.
To determine the viability of such a process, various experimental works were
undertaken. Sodium, a component of the catalyst used to produce biodiesel, is a common
impurity found in crude biodiesel that must be removed via water washing. Experiments
were carried out to investigate the partitioning behaviour of sodium. Because there is
currently a push to move toward the use of waste oil feedstocks, the water washing
efficiencies for biodiesel made from refined vegetable (low FFA feedstock) and waste oil
feedstocks (high FFA feedstock) were compared.
In multistage liquid-liquid extraction, counter-current contacting schemes are often
used to conserve water and produce a more concentrated wastewater stream. Experiments
were conducted to compare cross-current and counter-current washing to determine if the
same removal efficiency for sodium can be achieved using the counter-current washing
scheme. If it can achieve the same level of purification, it would be worthwhile to use the
counter-current process since it would result in a more efficient use of water.
Finally, to validate the use of ion exchange for wastewater treatment, the ability of an
ion exchange resin to remove salt impurities from the biodiesel wastewater must be tested.
With a focus on the removal of sodium, the wastewater generated from previous experiments
was treated with ion exchange resins. To determine if the presence of other components in
the wastewater would affect the removal capacity of the resin, the removal efficiency was
compared to that of prepared sodium chloride solutions.
1.2 Thesis Structure
In Chapter 2, an overview of biodiesel chemistry, production, and purification is
presented. The chapter also contains a critical review of current purification techniques, with

4
a focus on water washing. A review of literature pertaining to treatment options for biodiesel
wastewater is also presented.
The experimental methods and analytical techniques used to complete the thesis
project are described in Chapter 3.
In Chapter 4, the purification of biodiesel by water washing was simulated using
Aspen HYSYS simulation software. Simulations were performed to compare water treatment
through distillation to an alternative method using ion exchange. The effect of the amount of
water used in the water washing step was also investigated.
The experiments described in Chapter 5 studied the removal of sodium from FAME
prepared from both canola oil and waste frying oil. The distribution of sodium between the
FAME and water phases in a single water washing step were measured to determine the
distribution coefficient. The effect of FFA on sodium removal was also determined.
Chapter 6 describes experiments that compared sodium removal by water washing in
a cross-current contacting scheme to that of a counter-current configuration.
In Chapter 7, the wastewater samples obtained from the experiments in Chapter 5
were treated with an ion exchange resin. These results were used to validate the process
proposed in Chapter 4 to reduce energy consumption in biodiesel purification.
Lastly, the major conclusions, recommendations, and future work are presented in
Chapter 8.
1.3 References
EC, “Government of Canada Releases Final Regulations for Renewable Fuel Content in
Gasoline,” Environment Canada News Release, Available online:
www.ec.gc.ca/default.asp?lang=En&n=714D9AAE-1&news=2D84D5D6-F152-4F5F-
A4B9-BE973BE6821B (2010).
IEA, “Key World Energy Statistics,” International Energy Agency, Paris, France (2010 a).
IEA, “Sustainable Production of Second-Generation Biofuels,” International Energy Agency,
Paris, France (2010 b).
Moser, B. R., “Biodiesel production, properties, and feedstocks,” In. Vitro Cell. Dev.-Pl. 45,
229-266 (2009).

5
Chapter 2
Biodiesel Production and Purification
2.1 Introduction
The triglyceride molecule, used to produce biodiesel, is the main component of
vegetable oils and animal fats. As shown in Figure 2.1, triglycerides are composed of three
fatty acid groups bound to a glycerol molecule through an ester bond. Fatty acids vary in
carbon chain length and in number of double bonds. For vegetable oils, the most common
fatty acids include oleic (18:11), linoleic (18:2), linolenic (18:3), stearic acid (18:0), and
palmitic acid (16:0) (Srivastava and Prasad, 2000).
Figure 2.1 Triglyceride molecule.
Due to the large molecular mass and chemical structure of triglycerides, vegetable
oils typically have viscosities ten to twenty times higher than that of petroleum diesel
(Mittelbach and Remschmidt, 2004). Although the direct use of vegetable oils as fuels for
diesel engines has been successfully demonstrated, their high viscosities interfere with the
injection process and lead to poor fuel atomization and incomplete combustion (Srivastava
and Prasad, 2000). Furthermore, vegetable oils have a high flash point and a tendency for
thermal or oxidative polymerization, causing additional engine problems. Consequently, the
1 First number indicates number of carbons in fatty acid chain; second number indicates number of double
bonds

6
direct use of vegetable oils as a diesel fuel does not represent a commercially viable
alternative.
Fortunately, the triglyceride molecule can be modified so that it approximates the
properties and performance of petroleum diesel. Transesterification of triglycerides produces
fatty acid alkyl esters (FAAE), which have similar properties to petroleum diesel. FAAE is
the primary constituent of biodiesel and may be used directly in diesel engines.
In this chapter, the basic reaction chemistry required for producing biodiesel is
reviewed along with an overview of the current commercial process for producing biodiesel.
The challenges associated with using lower quality feedstocks such as waste frying oil are
highlighted. Lastly, a review of current purification techniques, specifically focusing on
water washing and treatment of the wastewater, is presented.
2.2 Biodiesel Reaction Chemistry
2.2.1 Transesterification
In the transesterification reaction shown in Figure 2.2, triglycerides are reacted with
an alcohol to form three FAAE molecules and glycerol as a by-product. The alcohols most
commonly used are methanol and ethanol, but methanol is preferred because it is cheaper and
is more easily recovered in downstream operations (Haas et al., 2006). The products formed
when using methanol are therefore referred to as fatty acid methyl esters or FAME.
Figure 2.2 Transesterification of a triglyceride molecule with methanol to form fatty acid
methyl esters (biodiesel) and glycerol.

7
Although it is possible for the reaction in Figure 2.2 to proceed without a catalyst, in
such a case, very high temperatures (235°C) and pressures (62 bars) are required along with
long reaction times (Mittelbach and Remschmidt, 2004). Therefore, to achieve satisfactory
yields under mild reaction conditions, the use of a catalyst is required.
2.2.2 Feedstocks
The triglycerides required for the production of biodiesel can be obtained from
vegetable oils or animal fats. Currently, more than 95% of biodiesel is prepared from
conventionally grown edible oils such as rapeseed, soybean, sunflower, and palm oil (Balat,
2011). However, the cost of biodiesel is higher than that of diesel fuel, and production is
usually not profitable without government support (Demirbas and Balat, 2006). The high
production cost can be attributed to the high cost of refined vegetable oils. Furthermore, the
large scale production of biodiesel from edible fuels raises ethical concerns. These include
the competition for the same land and resources as the food industry and the deforestation of
land to expand crops and increase production (Gui et al., 2008). As a result, there has been
increasing pressure to move towards waste materials and non-edible sources of triglycerides.
One way in which biodiesel production can become more profitable is through the
use of used frying oils (also referred to as waste cooking oils) obtained from households or
restaurants. The use of these feedstocks not only represents a cost saving, but it provides a
viable use for a waste product that would otherwise require treatment before disposal. The
amount of available used frying oil is not sufficient to completely replace diesel fuel;
however, a substantial amount of biodiesel can be prepared from used frying oil (Kulkarni
and Dalai, 2006).
The disadvantage of using waste frying oils is that they contain a large amount of free
fatty acids (FFA) which are formed by hydrolysis reactions during the frying process
(Encinar et al., 2005). The presence of FFA has a negative effect on biodiesel production by
causing an unwanted side reaction and complicating downstream processing. These problems
are discussed in further detail below.
Oils can be classified by their FFA content. Refined vegetable oils will typically have
very low concentrations of FFA. For example, the FFA content in refined canola oil ranges
from 0.4 to 1.2 wt% (Przybylski, 2005). Used oil is classified as yellow grease if its FFA

8
content is below 15 wt%. Any oil with an even greater FFA concentration is classified as
brown grease. The amount of FFA in the waste grease will depend on its previous use.
Typically, used cooking oils will contain 2-7 wt% FFA and animal fats will have 5-30 wt%
FFA. Some low quality feedstocks, such as trap grease, can have FFA contents that approach
100 wt% (Van Gerpen, 2005).
2.2.3 Catalysts
The catalyst systems currently available for producing biodiesel are summarized in
Table 2.1, along with their respective advantages and disadvantages (Lam et al., 2010;
Leung et al., 2010).
Table 2.1 Advantages and disadvantages of catalysts available for biodiesel production.
Catalyst Examples Advantages Disadvantages
Homogeneous
base
NaOH,
KOH,
NaOCH3
Mild reaction conditions,
high conversions, fast
reaction rate
Sensitive to FFA and water
content (soap formation),
difficult catalyst separation
Homogeneous
acid H2SO4, HCl
Insensitive to FFA (no
soap formation)
Slow reaction rate, high
alcohol requirement and
reaction temperature, sensitive
to water content, difficult
catalyst separation
Heterogeneous
base
Zeolites,
CaO
Mild reaction conditions,
easy catalyst separation,
reusable
Sensitive to FFA and water
content (soap formation),
catalyst leaching, high alcohol
requirement, high reaction
temperature and pressure
Heterogeneous
acid
Ion
exchange
resins, ZrO2
Insensitive to FFA (no
soap formation), easy
catalyst separation,
reusable
Slow reaction rate, high
alcohol requirement and high
reaction temperature
Enzymes Lipases
No by-product generation,
mild reaction conditions,
insensitive to FFA
High cost, slow reaction rate,
enzyme deactivation
Non-catalytic Supercritical
methanol
Fast reaction rate, no
catalyst separation required
High temperature and
pressure required

9
Homogeneous base catalysts such as sodium hydroxide (NaOH) or sodium methoxide
(NaOCH3) are currently favoured due to their ability to catalyze the reaction at mild reaction
conditions with a high conversion in minimal time. The main disadvantage of base catalysts
is the undesired side reaction that produces soap. If water is present in the reaction system,
the catalyst will react with the triglyceride to form soap as seen in Figure 2.3. This reaction is
referred to as saponification.
Figure 2.3 Saponification reaction of triglycerides to form soap.
The base catalysts can also form soap by reacting with FFA, as shown in Figure 2.4.
This side reaction is undesired because it consumes the catalyst and reduces overall
conversion. Furthermore, soap is an emulsifier and its presence complicates downstream
purification. As a result, base catalysts are only recommended when using feedstocks with
FFA contents between 0.5 to 2 wt% (Lam et al., 2010).
Figure 2.4 Reaction of FFA with base catalyst to form soap.

10
Homogeneous acid catalysts such as sulphuric acid (H2SO4) have the advantage that
they can simultaneously catalyze the transesterification reaction (Figure 2.2) and convert
FFA to FAME by the esterification reaction shown in Figure 2.5.
Figure 2.5 Acid esterification of FFA to form FAME.
The disadvantages of using acid catalysts include slower reaction rates and the
requirement of a high reaction temperature and a high amount of excess alcohol
(Lam et al., 2010). These factors generally make the use of acid catalysts commercially
unfavourable.
To combine the advantages of both the base and acid catalyzed processes, a two-step
reaction process was suggested by Canakci and Van Gerpen (2001). The high FFA feedstock
is first treated with an acid catalyst to convert FFA to FAME by esterification as shown in
Figure 2.5. Once the FFA level is reduced below 1 wt%, the transesterification reaction is
completed using a base catalyst.
2.3 Reaction Products and Impurities
The mixture of reaction products contains various components, the concentrations of
which must meet strict specifications for the product to be classified as biodiesel by ASTM
International2. The main components of the reaction products mixture are FAME, glycerol,
and unreacted methanol. Since FAME and glycerol are only slightly soluble in each other,
these three components form two immiscible liquid phases: one rich in FAME and one rich
in glycerol. The methanol, which is miscible with both FAME and glycerol, will partition
between the two phases.
2 Formerly known as the American Society for Testing and Materials

11
The mixture will also contain residual catalyst in the form of salts and soap, as well as
water. These polar contaminants tend to partition in the glycerol-rich phase. However, a non-
negligible amount will remain in the FAME-rich phase.
If the reaction does not proceed to completion, the mixture will also contain unreacted
mono-, di-, and triglycerides. Similarly, FFA not converted by the acid esterification reaction
will also be present.
Table 2.2 provides a summary of the negative effects of these components on the
properties of the biodiesel and engine performance, along with the limits required by ASTM
International (ASTM D6751, 2009).
Table 2.2 Effect of impurities in biodiesel and ASTM concentration limits.
Contaminant Effect on biodiesel/engine performance ASTM D6751
limit
Glycerol Causes injector deposits, clogs fuelling systems, builds
up at the bottom of storage and fuelling systems 0.020 % mass
Methanol Lowers flash point 0.2 % mass
Sodium and
potassium
(combined)
Contributes to injector, fuel pump, piston and ring
wear, creates engine deposits, filter plugging 5 ppm (µg/g)
Calcium and
magnesium
(combined)
Contributes to injector, fuel pump, piston and ring
wear, creates engine deposits, filter plugging 5 ppm (µg/g)
Free fatty acids
(FFA) Increases fuelling system deposits, corrosion
0.50 mg KOH/g
(acid value)
Water Hydrolysis (FFA formation), promotes corrosion,
microbiological growth 0.050 % volume
Mono-, di-, and
triglycerides
Causes injector deposits, adversely affects cold weather
operation, plugs filters
0.240 % mass
(includes free
glycerol)
The average levels of impurities in the crude, unwashed biodiesel from various
authors are presented in Table 2.3 (Berrios and Skelton, 2008; Wang et al., 2009; Gonzalo et
al., 2010). It is clear that biodiesel of this grade would not meet the standards required by
ASTM and further purification would be required. Although the amount of soap is not

12
explicitly limited by the ASTM standard, the soap molecule contains both sodium and FFA,
and therefore must be within the limits for these two impurities.
Table 2.3 Average level of impurities in crude biodiesel prior to purification.
Impurity Value Units
Glycerol 0.13 % mass
Methanol 2.8 % mass
Sodium 227 ppm
Soap 1075 ppm
Water 0.089 % volume
Glycerides 2.4 wt%
2.4 Biodiesel Production Processes
2.4.1 Low FFA Oil Feedstock
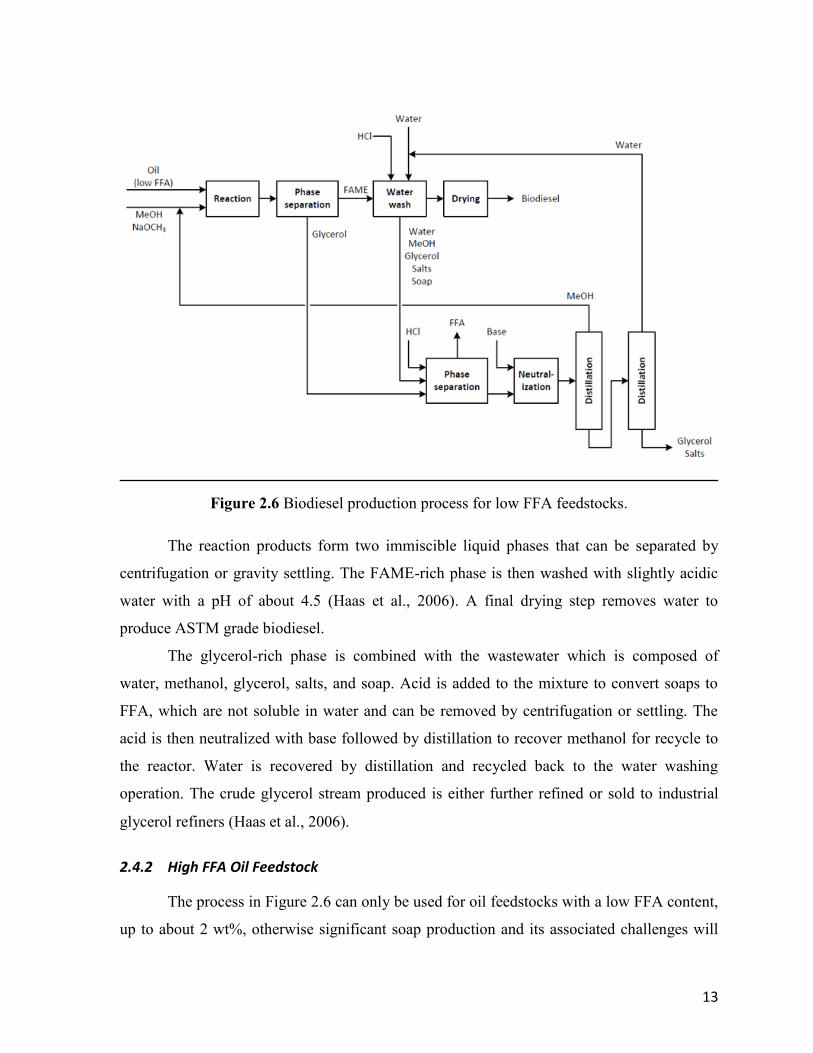
A general process for producing biodiesel from refined oil is presented in Figure 2.6.
This process is based on the model proposed by Haas et al. (2006). The oil is fed to the
reactor along with the methanol and catalyst (sodium methoxide) solution. Methanol is
usually present in excess at a molar ratio of 6 to 1 with respect to oil. Catalyst concentration
will usually be between 0.5 and 1% by weight of the oil, and the reaction takes place at a
temperature of approximately 60°C and close to atmospheric pressure (Meher et al., 2006;
Leung et al., 2010).
13
Figure 2.6 Biodiesel production process for low FFA feedstocks.
The reaction products form two immiscible liquid phases that can be separated by
centrifugation or gravity settling. The FAME-rich phase is then washed with slightly acidic
water with a pH of about 4.5 (Haas et al., 2006). A final drying step removes water to
produce ASTM grade biodiesel.
The glycerol-rich phase is combined with the wastewater which is composed of
water, methanol, glycerol, salts, and soap. Acid is added to the mixture to convert soaps to
FFA, which are not soluble in water and can be removed by centrifugation or settling. The
acid is then neutralized with base followed by distillation to recover methanol for recycle to
the reactor. Water is recovered by distillation and recycled back to the water washing
operation. The crude glycerol stream produced is either further refined or sold to industrial
glycerol refiners (Haas et al., 2006).
2.4.2 High FFA Oil Feedstock
The process in Figure 2.6 can only be used for oil feedstocks with a low FFA content,
up to about 2 wt%, otherwise significant soap production and its associated challenges will
14
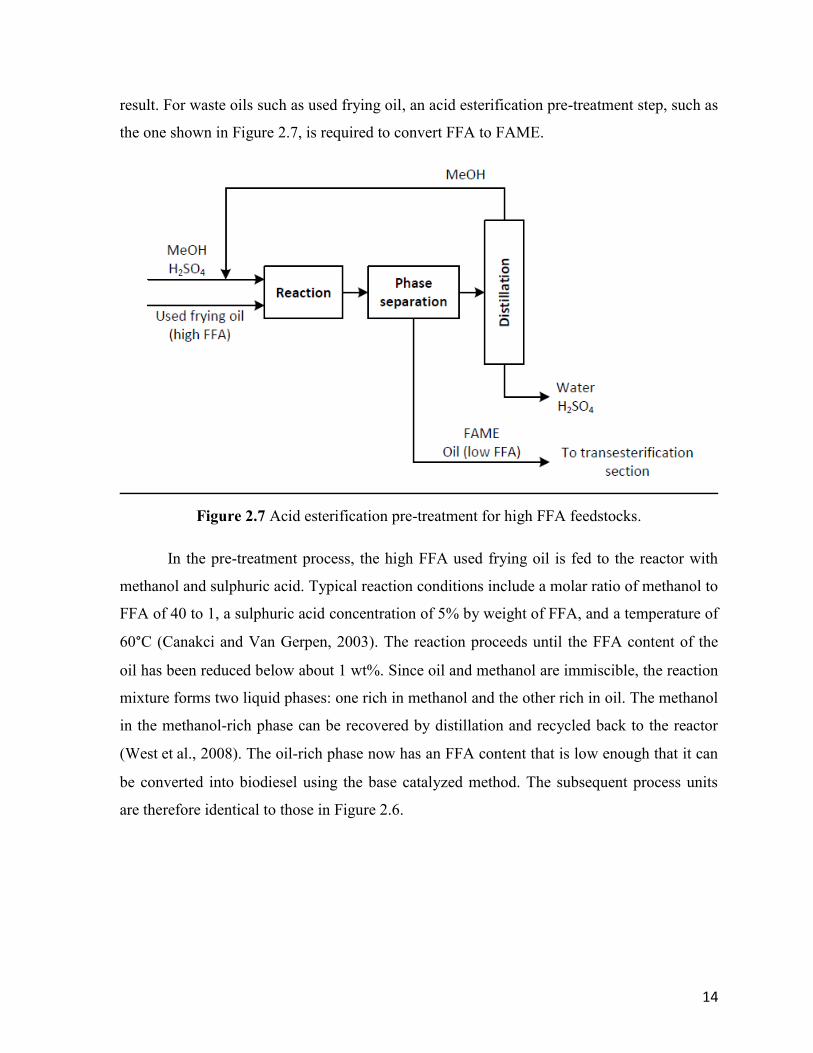
result. For waste oils such as used frying oil, an acid esterification pre-treatment step, such as
the one shown in Figure 2.7, is required to convert FFA to FAME.
Figure 2.7 Acid esterification pre-treatment for high FFA feedstocks.
In the pre-treatment process, the high FFA used frying oil is fed to the reactor with
methanol and sulphuric acid. Typical reaction conditions include a molar ratio of methanol to
FFA of 40 to 1, a sulphuric acid concentration of 5% by weight of FFA, and a temperature of
60°C (Canakci and Van Gerpen, 2003). The reaction proceeds until the FFA content of the
oil has been reduced below about 1 wt%. Since oil and methanol are immiscible, the reaction
mixture forms two liquid phases: one rich in methanol and the other rich in oil. The methanol
in the methanol-rich phase can be recovered by distillation and recycled back to the reactor
(West et al., 2008). The oil-rich phase now has an FFA content that is low enough that it can
be converted into biodiesel using the base catalyzed method. The subsequent process units
are therefore identical to those in Figure 2.6.

15
2.5 Biodiesel Purification Processes
2.5.1 Water Washing
The most common method of purifying the reaction products is to use water washing.
Water is an ideal solvent for this purpose since most of the contaminants are polar and
therefore have a high solubility in water. Water washing can effectively reduce the amounts
of methanol, glycerol, salts, and soap in the crude FAME mixture. A summary of various
studies on water washing of crude biodiesel is shown in Table 2.4.
Gonzalo et al. (2010) investigated the water washing step by studying the effect of
water amount and washing temperature on biodiesel made from both rapeseed oil and used
frying oil. These oils had acid values of 1.1 and 1.3 mg KOH/g, respectively, which
correspond to initial FFA concentrations of 0.55 and 0.65 wt%. Using the two-step reaction
process of acid esterification and base catalyzed transesterification, the FFA content in the
crude FAME product was 0.076 and 0.055 wt%, respectively. They found that the viscosity
of the biodiesel increased after water washing, indicating that methanol, which has a lower
viscosity than biodiesel, was removed in the washing step. For both biodiesels, the polar
compounds (methanol, sodium, and glycerol) were almost completely removed by a single
water washing step in the conditions tested and all three impurities were within ASTM
specifications. The washing step also resulted in an increase in acidity, which was attributed
to the removal of sodium. Prior to washing, the sodium may have neutralized part of the acid
present after the reaction, and its removal resulted in an increase in acidity. The concentration
of glycerides (mono-, di-, and triglycerides) was not changed significantly.
Significant removal of methanol, sodium, and glycerol was achieved at even the
mildest conditions tested using minimum water (30 wt% of biodiesel) and temperature
(30°C). This suggests the possibility of using even less water or a lower contacting
temperature to achieve the same results.
Despite using a biodiesel made from waste oil, the presence of soap was not detected.
This is most likely because the FFA content in the feedstock oil was low. Their work shows
that one washing step is sufficient for washing biodiesels with low FFA concentrations, but
does not give any information about washing biodiesels with higher FFA contents.

16
Table 2.4 Summary of studies on water washing of biodiesel.
Author(s) Oil
feedstock
FFA content
(wt%) Washing conditions
Oil FAME
Water to
biodiesel
volume
ratio
Number
of
washes
Temperature
(°C)
Gonzalo et al.
(2010)
Rapeseed
oil 0.55 0.076 1:3.8
1:1.9
1:1.3
1 40, 50, 60 Used frying
oil 0.65 0.055
Berrios and
Skelton (2008)
Refined
cooking oil np 0.091 1:2
1:1.3
1:1
1 ambient, 60 Used
cooking oil np 0.12
Karaosmanoğlu
et al. (1996)
Rapeseed
oil 0.16 np 1:1 5 50, 65, 80
He et al. (2006) Soybean oil np np 1:1 3 20, 50, 80
Predojević
(2008)
Waste
sunflower
oil
0.936
1.30
1.67
np 1:4.5 up to 10 50
Sabudak and
Yildiz (2010)
Waste
frying oil
2
4.6 <1 1:1 1 50-60
Rahayu and
Mindaryani
(2007)
Castor oil 0.1686 np
1:2
1:1
2:1
3:1
1 ambient, 35,
45, 55
Banerjee et al.
(2009) Jatropha oil np np 1:5 3 ambient
np: not provided
Berrios and Skelton (2008) compared water washing to purification using ion
exchange resins and magnesium silicate. The two biodiesel feedstocks used were made from
refined cooking oil and used cooking oil, with acid values of 0.18 and 0.24 mg KOH/g,
respectively. Water washing was performed using three water sources: deionised water,
town’s water, and acidified water (5% phosphoric acid). Two temperatures (ambient and
60°C) were used and three water/oil ratios and two agitator speeds were investigated. Water

17
washing was the only process that reduced both methanol and free glycerol levels down to
those required by the standard. It did not have any effect on glycerides.
The standard was met with a water to biodiesel ratio of 1:2, which was the minimum
amount of water tested. They saw no advantage to using deionized or acidified water over
town’s water. The recommended operating conditions were ambient temperature, town’s
water, and a water to biodiesel volume ratio of 1:2. There were no measurable differences in
treatment efficiencies between the two feedstocks.
Karaosmanoğlu et al. (1996) compared washing with hot distilled water, dissolving
the mixture in petroleum ether and then washing it with distilled water, and neutralizing the
mixture with sulphuric acid. Of the three temperatures tested, the greatest yield was obtained
at the lowest temperature of 50°C. When considering refining yields, water content, and acid
values, the recommended method was washing with distilled water at 50°C. The biodiesel
was washed in a 1:1 volume ratio of water to biodiesel five times, which represents a
relatively high level of wastewater production compared to other studies.
He et al. (2006) compared washing with distilled water, washing with acid (HCl,
pH of 1), dissolving and extracting in a solvent, and washing with distilled water with the use
of membrane extraction. The properties of the washed biodiesel were similar when washed
with distilled water at the three temperatures tested of 20, 50, and 80°C. The highest yield
was obtained at 50°C. At 20°C, serious emulsification was encountered and at 80°C, more
esters dissolved in the water, resulting in a higher ester loss than at 50°C.
Washing with acid reduced the formation of emulsions and loss of ester than when
washing with distilled water. However, the acid value of the biodiesel was slightly higher due
to the addition of acid. Agitation greatly affected the process. If the speed was too low,
contact between the two phases was insufficient and if the speed was too high, serious
emulsification occurred. When using solvent extraction, serious emulsification occurred at
the interface and the solvent had to be evaporated out after refining. Both of these factors
increased the loss of methyl esters. Although the acid value of the oil feedstock was not
given in their study, it was most likely higher than that of the other studies since it is the only
study to report the occurrence of serious emulsification.
Predojevic (2008) compared three different methods for the purification of biodiesel
made from used frying oils. These methods were washing the mixture with 5% phosphoric

18
acid and hot distilled water, and contacting with silica gel. The silica gel and phosphoric acid
treatments gave the highest yields, while the hot water treatment gave the lowest. This was
attributed to the need for excessive washing with water in multiple steps (up to 10) until
neutral pH was reached, leading to increased product losses. Using acidified water required
up to 7 washes.
Sabudak and Yildiz (2010) compared washing with distilled water, dry wash with
magnesium silicate, and using ion-exchange resin to purify biodiesel made from waste frying
oils. Washing with water resulted in the lowest yield. Based on this conclusion, the
recommended purification method was determined to be ion-exchange. However, a
discussion of contaminant removal efficiency was not provided.
Rahayu and Mindaryani (2007) investigated glycerol removal by water washing.
Glycerol extraction increases with amount of water used and washing temperature, however
glycerol concentration in the biodiesel did not reach standard specifications even at the
highest water to biodiesel volume ratio. To achieve the standard requirement, they
recommended that the washing should be done in a multistage process.
Banjeree et al. (2009) studied the effect of washing time on the purification of
biodiesel made from Jatropha oil. They found that three successive washing steps with
distilled water at a water to biodiesel volume ratio of 1:5 at room temperature was sufficient
for removing the catalyst from the FAME.
2.5.2 Membrane Technology
He et al. (2006) tested two types of hollow fiber membranes for use in a membrane
extraction setup. The membrane materials tested were polysulfone (hydrophilic) and
polyacrylonitrile (hydrophobic). The membranes were immersed in a beaker filled with
distilled water and the crude biodiesel was pumped into the hollow fiber membrane.
In comparison to the conventional water washing conditions tested, membrane
extraction avoided the emulsification problems encountered, thereby decreasing the refining
loss. They concluded that polysulfone was the more suitable membrane material, since the
polyacrylonitrile membrane resulted in refined biodiesel with a high water content. The
purity of the biodiesel refined by polysulfone membrane extraction was the highest (99%)

19
among all the refining methods tested. The results showed that membranes can be used for
water washing in situations that result in a high degree of emulsification.
Wang et al. (2009) compared the use of a ceramic membrane to the traditional water
washing step. The membrane effectively separated FAME as permeate from the crude
reaction mixture. This was due to the presence of soap existing in a reversed micelle form
which bonded to free glycerol, thereby increasing its size so that it did not permeate with the
FAME. However, some of the FAME still remained in the retentate, which would require
further treatment by water washing to improve the overall yield.
Saleh et al. (2010) studied the use of a hydrophilic polyacrylonitrile membrane for the
removal of glycerol from biodiesel. By adding only small quantities of water (0.06 to 0.2
wt%), large particles of a glycerol and water dispersed phase were formed, which were
rejected by the membrane. The amount of water required for the process was found to be
only 2 g of water per L of treated FAME. In comparison to a typical water washing
operation, this represents a significant reduction in wastewater production. Although the
results demonstrate the large effect water has on glycerol removal, the presence of methanol
and soap were found to negatively impact separation. This suggests that the use of
membranes for glycerol removal may not be suitable for the purification of FAME with high
levels of contaminants.
2.5.3 Ion Exchange
Berrios and Skelton (2008) tested ion exchange resins from Rohm & Haas (BD10
Dry) and Purolite (PD206). The resins had little effect on methanol removal and no effect on
glyceride removal. They did observe a reduction in soap content and concluded that this may
indicate a limitation for high soap containing feeds.
Sabudak and Yildiz (2010) purified crude biodiesel using an ion exchange resin from
Purolite (PD206). In comparison to water washing and adsorption with magnesium silicate,
they concluded that ion exchange was the best purification option because it resulted in the
highest yield of biodiesel. The amount of biodiesel purified was only 1.5 times the amount of
resin used. Therefore, it is unclear if this method would be efficient on an industrial scale.

20
2.5.4 Adsorption
Berrios and Skelton (2008) tested the use of magnesium silicate (Magnesol) and
observed no significant effect on glyceride (mono-, di-, and triglyceride) removal. There was
only a small amount of methanol removal. Reduction in soap value was less than that
achieved by the ion exchange resin.
Mazzieri et al. (2008) studied the removal of glycerol from crude biodiesel by
adsorption on silica gel. They found that glycerol has a great affinity for silica gel and that it
was selectively adsorbed from the biodiesel solutions. They concluded that soaps do not
interfere with adsorption. However, adsorption was only tested up to a soap content of 270
ppm. Methanol and monoglycerides produced a decrease of the saturation capacity of the
adsorbent. It is therefore unclear if silica gel would be effective when purifying biodiesel
with high levels of soap, methanol, and monoglycerides.
2.6 Wastewater
Following the discussion presented in the previous sections, it is clear that presently
only water washing has been demonstrated to achieve high purity biodiesel economically.
When using water washing as a means of purification, biodiesel production will produce a
large wastewater stream. The amount of wastewater produced varies by source, as seen in
Table 2.5, ranging from about 0.2 to 4 litres of wastewater for every litre of biodiesel
produced. This is most likely due to variability between individual processes and is likely
dependent on such process factors as the quality of feedstock, reaction conditions, and
method of water contacting. Nonetheless, it is clear that the process produces a relatively
large wastewater stream.
Table 2.5 Wastewater generated from biodiesel production by source.
Source Wastewater generated
(L water/L biodiesel)
Chavalparit and Ongwandee (2009) 0.2-1.2
Van Gerpen et al. (2004) 1
Canakci and Van Gerpen (2003) 3
Liu et al. (2009) 3-4

21
The wastewater will typically contain contaminants including methanol, glycerol,
soap, FFA, dissolved and suspended solids, and residual FAME (Boornazian and Smith,
2008). The properties of the wastewater produced from various references are shown in
Table 2.6. Chavalparit and Ongwandee (2009) also reported glycerol and methanol
concentrations of 1360 and 10,667 mg/L, respectively.
Table 2.6 Properties of biodiesel wastewater by source.
Source pH COD
(mg/L)
BOD
(mg/L)
O&G
(mg/L)
Conductivity
(µS/cm)
Chavalparit and
Ongwandee (2009) 8.9 30,980 np 6020 350
Berrios and Skelton (2008) 6.7 18,362 np np 1119
Jaruwat et al. (2010) 9.3-10.8 312,000 168,000 18,000 np
Banerjee et al. (2009) 9 684-792 np 1433-1640 np
COD: chemical oxygen demand; BOD: biochemical oxygen demand; O&G: oil and grease
np: not provided
The wastewater is basic with high amounts of oil and grease and low amounts of
nitrogen and phosphorus making biological treatment difficult (Chavalparit and Ongwandee,
2009). The water will typically require pre-treatment prior to discharge to a water treatment
facility. Some of the treatment methods that have been studied include biological (Suehara et
al., 2005), electrocoagulation (Chavalparit and Ongwandee, 2009), electrochemical oxidation
(Jaruwat et al., 2010), and adsorption of glycerol (Liu et al., 2009).
The efficient recovery and recycle of this wastewater is an important factor that could
help improve the overall environmental impact and economics of biodiesel production.
Typical methods of wastewater treatment include distillation, as seen in the process presented
in Figure 2.6, or membrane separation (Maliszewski et al., 2008). Distillation is known to be
an energy intensive operation, and the energy requirements to recover the water and its
impact on the biodiesel process have not been yet been studied.
2.7 Summary
There have been numerous studies that show the effectiveness of using water washing
to purify crude biodiesel. In some studies, only one wash was sufficient whereas others

22
required multiple consecutive washes, up to 10 washes. This indicates that the number of
washes required is dependent on the feedstock and may vary from one process to the next.
Gonzalo et al. (2010) and Berrios and Skelton (2008) both concluded that the
minimum amount of water they tested was sufficient to achieve effective removal of
contaminants. For Gonzalo et al. (2010), this was a water to biodiesel volume ratio of 1 to
3.8, indicating that the amount of water could be further reduced to minimize wastewater
generation.
Temperature appears to have opposing effects on purification. Contaminant removal
tends to increase with increasing temperature however, product loss also increases. It may
therefore be beneficial to use mild temperature conditions since effective contaminant
removal can still be achieved while minimizing product loss and process energy
requirements.
With respect to initial FFA content, the studies reviewed also only dealt with either
refined vegetable oils or used frying oils with a relatively low FFA content. The FFA level of
the pre-treated FAME was also very low, always below 1 wt%.
Furthermore, the removal of other contaminants such as methanol and glycerol by
water washing has been studied more extensively than the removal of sodium. Gonzalo et al.
(2010) concluded that sodium could be easily removed in one washing step. However, the
FFA levels in their FAME samples were quite low (0.055 and 0.076 wt%). Sodium is known
to interact with FFA to form soap by the saponification reaction. Therefore, its presence may
have an effect on the removal efficiency of sodium by water washing.
In these studies, the FAME samples were washed repeatedly with water in
consecutive washes ranging up to 10 stages. This represents a cross-current configuration. On
an industrial scale, water washing can be performed in a counter-current process to reduce
the amount of waste generated and result in a more concentrated waste stream. However,
results on such a process have not yet been presented in the literature.
Other purification methods have also been successfully used for biodiesel
purification. The advantages of these methods are that they do not produce wastewater and
that they have reduced refining losses. However, they have their own disadvantages
including interactions with other contaminants or the inability to remove all of the
contaminants as effectively as water washing.

23
The disadvantage of water washing as a means of purification is that it produces a
large wastewater stream ranging from 0.2 to 4 litres per litre of biodiesel. This wastewater is
generally difficult to treat by conventional methods and may require pre-treatment prior to
discharge to a water treatment facility. The water is most commonly recovered by
distillation, which is energy intensive and reduces the energy efficiency of biodiesel
production. A study on the energy used in recovery of wastewater by distillation is not yet
available, and it could prove advantageous to use alternative water treatment methods. For
example, the use of ion exchange could help reduce salt levels in the wastewater, making it
suitable for recycle back to the process. Its use could also potentially reduce the amount of
energy used to treat the wastewater, and result in a more energy efficient process.
2.8 References
ASTM Standard D6751, “Standard specification for biodiesel fuel blend stock (B100) for
middle distillate fuels,” ASTM International, West Conshohocken, PA (2009).
Balat, M., “Potential alternatives to edible oils for biodiesel production – A review of current
work,” Energ. Convers. Manage. 52, 1479-1492 (2011).
Banerjee, T., T. K. Bhattacharya, and R. K. Gupta, “Process optimization of catalyst removal
and characterization of waste water after alkali-catalyzed transesterification of Jatropha oil,”
Int. J. Green Energy, 6, 392-400 (2009).
Berrios, M. and R. L. Skelton, “Comparison of purification methods for biodiesel,” Chem.
Eng. J. 144, 459-465 (2008).
Boornazian, L. Y. and M. T. Smith, “Applicability of Effluent Guidelines and Categorical
Pretreatment Standards to Biodiesel Manufacturing,” United States Environmental Protection
Agency, Office of Water Management, Washington, D.C. (2008).
Canakci, M. and J. Van Gerpen, “Biodiesel production from oils and fats with high free fatty
acids,” Trans. Am. Soc. Agric. Eng. 44 (6), 1429-1436 (2001).
Canakci, M. and J. Van Gerpen, “A pilot plant to produce biodiesel from high free fatty acid
feedstocks,” Trans. Am. Soc. Agric. Eng. 46 (4), 945-954 (2003).
Chavalparit, O. and M. Ongwandee, “Optimizing electrocoagulation process for the
treatment of biodiesel wastewater using response surface methodology,” J. Environ. Sci. 21,
1491-1496 (2009).
Demirbas, M. F. and M. Balat, “Recent advances on the production and utilization trends of
bio-fuels: A global perspective,” Energ. Convers. Manage. 47, 2371-2381 (2006).

24
Encinar, J. M., J. F. González, and A. Rodríguez-Reinares, “Biodiesel from used frying oil.
Variables affecting the yields and characteristics of the biodiesel,” Ind. Eng. Chem. Res. 44
(15), 5491-5499 (2005).
Gonzalo, A., M. García, J. L. Sánchez, J. Arauzo, and J. A. Peña, “Water cleaning of
biodiesel. Effect of catalyst concentration, water amount, and washing temperature on
biodiesel obtained from rapeseed oil and used oil,” Ind. Eng. Chem. Res. 49, 4436-4443
(2010).
Gui, M. M., K. T. Lee, and S. Bhatia, “Feasibility of edible oil vs. non-edible oil vs. waste
edible oil as biodiesel feedstock,” Energy 33, 1646-1653 (2008).
Haas, M. J., A. J. McAloon, W. C. Yee, and T. A. Foglia, “A process model to estimate
biodiesel production costs,” Bioresource Technol. 97, 671-678 (2006).
He, H. Y., X. Guo, and S. L. Zhu, “Comparison of membrane extraction with traditional
extraction methods for biodiesel production,” J. Am. Oil Chem. Soc. 83 (5), 457-460 (2006).
Jaruwat, P., S. Kongjao, and M. Hunsom, “Management of biodiesel wastewater by the
combined processes of chemical recovery and electrochemical treatment,” Energ. Convers.
Manage. 51, 531-537 (2010).
Karaosmanoğlu, F., K. B. Ciğizoğlu, M. Tüter, and S. Ertekin, “Investigation of the refining
step of biodiesel production,” Energy Fuels, 10, 890-895 (1996).
Kulkarni, M. G. and A. K. Dalai, “Waste cooking oil – An economical source for biodiesel:
A review,” Ind. Eng. Chem. Res. 45, 2901-2913 (2006).
Lam, M. K., K. T. Lee, and A. R. Mohamed, “Homogeneous, heterogeneous and enzymatic
catalysis for transesterification of high free fatty acid oil (waste cooking oil) to biodiesel: A
review,” Biotechnol. Adv. 28, 500-518 (2010).
Leung, D. Y. C., X. Wu, and M. K. H. Leung, “A review on biodiesel production using
catalyzed transesterification,” Appl. Energ. 87, 1083-1095 (2010).
Liu S., S. R. Musuku, S. Adhikari, and S. Fernando, “Adsorption of glycerol from biodiesel
washwaters,” Environ. Technol. 30 (5), 505-510 (2009).
Maliszewski, T. A., D. L. Bunning, D. J. Schreck, L. A. Kapicak, and N. L. Balmer,
“Biodiesel production with reduced water emissions,” Patent No. WO 2008/091944 A2
(2008).
Mazzieri, V. A., C. R. Vera, and J. C. Yori, “Adsorptive properties of silica gel for biodiesel
refining,” Energy Fuels, 22, 4281-4284 (2008).
Meher, L. C., D. V. Sagar, and S. N. Naik, “Technical aspects of biodiesel production by
transesterification – a review,” Renew. Sust. Energ. Rev. 10, 248-268 (2006).

25
Mittelbach, M. and C. Remschmidt, “Biodiesel - The Comprehensive Handbook,” Martin
Mittelbach (Publisher), Graz, Austria (2004).
Predojević, Z., “The production of biodiesel from waste frying oils: A comparison of
different purification steps,” Fuel, 87, 3522-3528 (2008).
Przybylski, R., T. Mag, N. A. M. Eskin, and B. E. McDonald, “Canola Oil,” in “Bailey’s
Industrial Oil and Fat Products,” F. Shahidi, Ed., John Wiley & Sons, Inc., Hoboken, NJ
(2005).
Rahayu, S. S. and A. Mindaryani, “Optimization of biodiesel washing by water extraction,”
in “Proc. World Congr. Eng. and Comput. Sci.” San Francisco, CA, October 24-26 (2007),
pp. 103-107.
Sabudak, T. and M. Yildiz, “Biodiesel production from waste frying oils and its quality
control,” Waste Manage. 30, 799-803 (2010).
Srivastava, A. and R. Prasad, “Triglycerides-based diesel fuels,” Renewable Sustainable
Energy Rev. 4, 111-133 (2000).
Saleh, J., A. Y. Tremblay, and M. A. Dubé, “Glycerol removal from biodiesel using
membrane separation technology,” Fuel 89, 2260-2266 (2010).
Suehara, K., Y. Kawamoto, E. Fujii, J. Kohda, Y. Nakano, and T. Yano, “Biological
treatment of wastewater discharged from biodiesel fuel production plant with alkali-catalyzed
transesterification,” J. Biosci. Bioeng. 100 (4), 437-442 (2005).
Van Gerpen, J., “Biodiesel processing and production,” Fuel Process. Technol. 86, 1097-
1107 (2005).
Van Gerpen, J., B. Shanks, R. Pruszko, D. Clements, and G. Knothe, “Biodiesel Production
Technology,” U.S. Department of Energy, National Renewable Energy Laboratory, Golden,
CO (2004).
Wang, Y., X. Wang, Y. Liu, S. Ou, Y. Tan, and S. Tang, “Refining of biodiesel by ceramic
membrane separation,”. Fuel Process. Technol. 90, 422-427 (2009).
West, A. H., D. Posarac, and N. Ellis, “Assessment of four biodiesel production processes
using HYSYS.Plant,” Bioresource Technol. 99, 6587-6601 (2008).

26
Chapter 3
Experimental Design
3.1 Biodiesel Preparation
Crude biodiesel (i.e., fatty acid methyl ester or FAME) was prepared from both
canola oil (a low free fatty acid (FFA) feedstock) and used frying oil (a high FFA feedstock).
The processes for preparing FAME from each feedstock are described in detail below.
Preparation from both feedstocks used the homogenous base catalyzed transesterification
method; however, the waste oil feedstock also required an acid esterification pre-treatment. A
list of the chemicals used along with suppliers and purities is shown in Table 3.1.
Table 3.1 Chemicals used to prepare FAME.
Chemical Supplier Location Purity
(%)
Methanol, Optima Grade Fisher Scientific Fair Lawn, NJ >99.9
Sodium methoxide solution,
25 wt% in methanol Sigma-Aldrich Oakville, ON 23.5-26.5
Sulphuric acid, Certified ACS Grade Fisher Scientific Ottawa, ON 95.0-98.0
Hydrochloric acid, Certified ACS Grade Fisher Scientific Ottawa, ON 36.5-38.0
3.1.1 Canola Oil Feedstock
Spectra Foods brand canola oil (Baie-d'Urfe, QC) was obtained from Tannis Food
Distributors (Ottawa, ON) in a 16 L pail. Twelve batches of FAME were produced using a 1
L three-neck, round bottom flask in the reactor set up shown in Figure 3.1. The flask was
equipped with a condenser to which cooling water was fed to prevent loss of methanol by
evaporation. The flask was suspended in a water bath on a hot plate. The hot plate was
equipped with a temperature probe which was immersed in the flask in order to control the
flask temperature at 60°C. The hot plate was also equipped with a magnetic stirring
mechanism to provide agitation using a magnetic stir bar.

27
Figure 3.1 Reactor set up for biodiesel preparation.
For each batch, approximately 522 g of oil was used. The reaction conditions
included a 6:1 molar ratio of methanol to oil and 0.7 wt% catalyst by weight of oil. The oil
was assumed to have a negligible FFA content; therefore, additional catalyst was not required
to neutralize FFA. Assuming oil has a molar mass of the triglyceride triolein (885 g/mol), the
amounts of methanol and sodium methoxide solution required are shown in Table 3.2. The
reaction was completed in two steps using 90% of the methanol and catalyst solution in the
first step and the remainder in the second.
Table 3.2 Mass of reactants used for transesterification of canola oil.
Reactant Molar mass
(g/mol)
Mass
(g)
Moles
(mol)
Oil 885 522 0.590
Methanol 32 102.3 3.20
Sodium methoxide solution: - 14.6 -
25% NaOCH3 54 3.65 0.068
75% CH3OH 32 11.0 0.343

28
The following procedure was used to prepare the first batch of FAME:
1. 523.09 g of oil was added to the reaction flask and placed in the water bath on the hot
plate. While the oil was being heated, 92.25 g of methanol and 13.32 g of sodium
methoxide solution (0.64 wt% by weight of oil) were combined. Once the oil reached
a temperature of 60°C, the methanol and sodium methoxide mixture was added to the
reaction flask. The mixture was agitated at 800 rpm for 60 min.
2. The mixture was transferred to a 1 L separatory funnel and allowed to settle for 3 h.
Two phases were formed. The bottom, denser phase was rich in glycerol and had a
mass of 73.20 g. The top, less dense, phase was rich in FAME and had a mass of
539.17 g. The two phases were separated and the FAME-rich phase was returned to
the reaction flask.
3. The mixture in the reaction flask was heated to 60°C. 11.17 g of methanol and 1.47 g
of sodium methoxide solution (0.07 wt% by weight of oil) were combined and added
to the reaction flask once the temperature reached 60°C. The mixture was agitated at
800 rpm for 60 min.
4. The mixture was transferred back to the 1 L separatory funnel and allowed to settle
overnight. Again, two phases were formed. The glycerol rich phase had a mass of
5.42 g and the FAME rich phase had a mass of 541.95 g. The phases were separated
and the FAME-rich phase was transferred to a 1 L Erlenmeyer flask.
5. Using pH paper, the pH of the FAME mixture was measured to be between 9 and 10.
6. To neutralize the catalyst, drops of concentrated sulfuric acid (98%) were slowly
added while stirring the mixture at low rpm. After each addition of acid, the mixture
was allowed to stir for 30 min. This step was repeated until the pH of the mixture was
neutral. This required a total of 200 μL of acid.
7. Residual methanol was removed from the neutralized FAME using a rotary
evaporator at ~40°C under vacuum. 170.63 g of the mixture was added to a 250 mL
evaporating flask. The evaporation process took ~30 min. After removing the flask
from the rotary evaporator, the change in mass was found to be 6.55 g.
8. Step 7 was repeated two more times for the remainder of the FAME rich phase. The
total amount of methanol removed was 19.49 g.

29
9. The FAME rich phase was filtered to remove the precipitate formed from the
neutralization of catalyst. The filter paper was Fisherbrand Quantitative Grade Circles
Q8 with pore size of 20-25 µm.
The final mass of crude, unwashed FAME produced was 410.64 g. The same method
described above was used to prepare eleven more batches of FAME. Batches 1 to 7 were
combined to create a total of about 3000 g of FAME (or 3.4 L). Batches 8 to 12 were
prepared at a later time to complete the experiments described in Chapter 5. The total
prepared from Batches 8 to 12 was about 2400 g (or 2.7 L).
3.1.2 Waste Oil Feedstock
Used frying oil was obtained from a cafeteria. The waste oil was dark brown and
contained solid particulates left over from the frying process. It also contained water which,
as mentioned in Chapter 2, will promote the formation of soap when making biodiesel. To
remove water, about 4 L of oil was poured into a deep fryer (Bravetti 4 L deep fryer) and
heated until the temperature of the oil was above 100°C (between 100 and 110°C). It was left
at this temperature for about 30 min to ensure that most of the water had evaporated from the
oil. The oil was then cooled to about 40°C. It was then pumped through two filters to remove
solids and water. The filters were a Donaldson brand hydraulic filter (P551553) with a pore
size of 25 µm and a Pentek brand water filter. The filtered and dehydrated oil was then stored
in a sealed container.
Using the titration method described in Section 3.4, the FFA content was measured to
be approximately 9 wt%. The oil therefore required an acid esterification pre-treatment to
convert FFA to FAME. Using the reaction conditions of Canakci and Van Gerpen (2003), the
molar ratio of methanol to FFA was 40:1 and the catalyst concentration was 6 wt% based on
the weight of FFA. Seven batches were produced and for each batch about 466 g of oil was
used. Assuming the molar mass of FFA to be that of oleic acid (282 g/mol), the amounts of
reactants required are shown in Table 3.3.

30
Table 3.3 Mass of reactants used for acid esterification of waste oil.
Reactant Molar mass
(g/mol)
Mass
(g)
Moles
(mol)
Waste oil: - 466 -
9% FFA 282 41.9 0.149
91% triglycerides 885 424 0.479
Methanol 32 190 5.95
Sulphuric acid 98 2.52 0.0257
Biodiesel production using waste oil was performed in the reaction set up shown in
Figure 3.1. The procedure followed for the first batch was as follows:
1. 466.37 g of the waste oil was added to the reaction flask in the hot water bath.
Meanwhile, 2.56 g of sulphuric acid was slowly added to 189.30 g of methanol. Once
the oil reached a temperature of 60°C, the methanol and acid mixture was added to
the reaction flask. The mixture was agitated at 800 rpm for 3 h.
2. The mixture was transferred to a 1 L separatory funnel and allowed to settle for 30
min. Two phases were formed. The top, less dense phase was rich in methanol
(135.50 g) and the bottom phase was rich in oil (516.90 g). The two phases were
separated. The oil phase was returned to the reaction flask.
3. Using pH paper, the pH was measured to be ~4 due to the presence of sulphuric acid.
4. While gently stirring, 50 μL of 25% sodium methoxide in methanol solution was
added to the mixture to neutralize the catalyst. After stirring for 15 min, the pH was
measured again. This procedure was repeated until the pH was neutral, which
required a total of 300 μL of the sodium methoxide solution.
5. The FFA content in the oil, measured using the titration method described in Section
3.4, was found to be 0.24 wt%.
The mass of reactants required for the transesterification reaction step are shown in
Table 3.4. Their amounts resulted in a methanol to oil molar ratio of 6:1 and a sodium
methoxide concentration of 0.8 wt% based on the weight of oil.

31
Table 3.4 Mass of reactants used for transesterification of waste oil.
Reactant Molar mass
(g/mol)
Mass
(g)
Moles
(mol)
Waste oil: - 466 -
91% triglycerides 885 424 0.479
Methanol 32 81.8 2.56
Sodium methoxide solution: - 13.6 -
25% NaOCH3 54 3.39 0.0628
75% CH3OH 32 10.2 0.318
The procedure for preparing the first batch of FAME continued as follows:
6. The neutralized oil mixture from Step 4 was heated to 60°C in the water bath.
Meanwhile, 13.7 g of sodium methoxide solution was added to 81.96 g of methanol.
7. Once the temperature of the oil mixture reached 60°C, the catalyst and methanol
solution was added to the reaction flask and the mixture was stirred at 800 rpm for
60 min.
8. The mixture was transferred to the separatory funnel and allowed to phase separate
overnight. The bottom glycerol-rich phase (112.74 g) was removed and the top
FAME-rich phase (490.94 g) was transferred to a 1 L Erlenmeyer flask.
9. The pH of the FAME-rich phase was ~10.
10. 400 µL of concentrated hydrochloric acid (36%) was added to neutralize the basic
catalyst. The mixture was left stirring at low rpm for about 15 min and the pH was
~6. To bring the pH to neutral, 100 µL of sodium methoxide was added. After 15 min
of stirring at low rpm, the pH was found to be 7.
Seven batches were produced using the above method. The first three batches were
combined for a total of 1500 g (about 1.7 L) and were used for the single stage washing
experiments described in Chapter 5. The final four batches were also combined for a total of
2000 g (about 2.2 L) and were used for the counter-current washing experiments described in
Chapter 6. The final soap concentration in the FAME was measured to be, on average,
0.36 wt%.

32
3.2 Water Washing Procedure
For each washing experiment, the apparatus shown in Figure 3.2 was used. 200 mL of
FAME was washed with 40 mL of water (i.e., a FAME to water volume ratio of 5:1). Contact
between the two phases was accomplished by bubbling air through a fritted glass gas
dispersion tube (Pyrex brand, porosity of 40 to 60 µm) suspended in the water phase. This
gentle washing method minimized the formation of emulsions while maintaining contact
between the phases. Air flow was provided by an aquarium pump (Elite brand, model 802)
and was controlled by a clamp.
Figure 3.2 Water washing apparatus.
When washing the canola oil derived FAME, the bubble washing lasted 3 h. For the
waste oil derived FAME, serious emulsification occurred if the bubbling was left this long.
As a result, bubbling was stopped at 2 h.
For the single stage washing experiments of the canola oil derived FAME, the two
phases were transferred to a 250 mL centrifuge bottle and centrifuged at 3500 rpm for 10
min. The water phase was then removed by pipette and stored separately from the FAME
phase. Unfortunately, the length of centrifugation used was later determined to be much

33
higher than what would be used in an industrial setting. Acceleration due to centrifugation,
G, is measured in multiples of earth gravity, g, and is determined as follows:
(3.1)
where Ω is the speed of the centrifuge in rpm and D is the diameter of the centrifuge bowl in
m (Genck, 2008). For a typical commercial centrifuge3 with an operating speed of 4300 rpm
and bowl diameter of 1.1 m, the acceleration experienced by a particle in the centrifuge is
11,370 g. For an operating flowrate of 40 m3/h (75% of capacity) and bowl volume of 66 L,
the particle will experience this gravitational acceleration for about 5.9 s:
(3.2)
According to Stokes’ law, the settling velocity of a particle is proportional to the
gravitational acceleration (Geankoplis, 2003), and thus, the time required to settle is
inversely proportional to acceleration. Therefore, to be equivalent to an industrial centrifuge,
the time required for the phases to settle under earth gravity, g, is:
(3.3)
where t is the time required for settling under earth gravity, g, gc is the gravitational
acceleration experienced in the centrifuge, and tc is the time a particle would spend in the
centrifuge. Therefore, leaving the phases to settle overnight should be equivalent to an
industrial centrifuge operation. Selected runs from the single stage washes of the canola oil
derived FAME were repeated and the original centrifugation conditions were not found to
have an effect on the results.
For all experiments involving the waste oil derived FAME, after washing was
complete, the phases were left to settle overnight. The phases were then separated and stored
for analysis.
3 Alfa Laval, BD 95 High-capacity disc stack centrifuge for biodiesel production

34
3.3 Analysis for Sodium Concentration
3.3.1 Inductively Coupled Plasma Optical Emission Spectroscopy (ICP-OES)
For the single stage water washing experiments (Chapter 5), the sodium concentration
in both the water and FAME phases was determined by Inductively Coupled Plasma Optical
Emission Spectroscopy (ICP-OES). The principle behind ICP-OES is that metal atoms, when
introduced to a plasma flame, will become excited and emit light at elementally characteristic
wavelengths. The analysis was completed in the Department of Earth Sciences at the
University of Ottawa (Ottawa, ON) by Dr. Nimal De Silva. Sample preparation was
completed by the author.
Sample preparation for the water samples was as follows:
1. 1 mL of the water phase was added to a sample tube. The sample mass was recorded.
2. 1 mL of 10% nitric acid was added to the sample tube.
3. 8 mL of deionized water was added and the final mass was recorded. This sample was
submitted for ICP-OES analysis.
Sample preparation for the FAME samples was as follows:
1. 5 mL of the FAME phase was added to a sample tube. The sample mass was
recorded.
2. 1 mL of 10% nitric acid was added and the sample was shaken well for ~2 min.
3. The sample was left to settle for 1 h.
4. The sample was centrifuged at 3500 rpm for 30 min.
5. The aqueous phase was then removed by pipette and transferred to a new sample
tube. The mass of sample transferred was recorded.
6. Steps 2 to 5 were repeated.
7. 4 mL of deionized water was added to each of the extracted aqueous phases and the
mass of each diluted sample was recorded. These samples were submitted for ICP-
OES analysis.

35
The ICP-OES analysis measured the sodium concentration in the diluted aqueous
samples. To determine the concentration in the original sample, the following conversion was
used:
(3.4)
where C is the sodium concentration in the original water sample in ppm, CICP is the
concentration determined by ICP-OES in the diluted sample in ppm, mdiluted is the mass of the
diluted sample in g, and msample is the mass of the original water sample.
For the FAME samples that required two acid extractions, the mass of sodium in each
diluted sample were combined before dividing by the original FAME sample mass:
(3.5)
where 1 and 2 represent the first and second extractions, respectively, and msample is the mass
of the original FAME sample.
3.3.2 Conductivity
The conductivity of an electrolyte solution is measured using a conductivity meter
and probe. The probe contains two electrodes and, when placed in contact with the solution, a
voltage is applied to the electrodes. The measured current is then converted to conductivity,
with units of conductance (Siemens (S)) per unit length of conductor (cm). The conductivity
meter used was YSI Model 3200 and the probe had a cell constant of 1.0/cm (model number
3253).
Because the ability of a solution to conduct electric current is dependent on the ions
in solution, it can be used as a measure of ionic concentration. For dilute electrolyte
solutions, the conductivity is proportional to the concentrations of ions. This trend was
observed when the conductivity of prepared sodium sulphate and sodium chloride solutions
were measured, as seen in Figure 3.3.

36
Figure 3.3 Conductivity of sodium sulphate and sodium chloride solutions.
For the counter-current washing experiments described in Chapter 6, conductivity
was used to determine the concentration of sodium in the extracted water phases. The
calibration curve used is shown in Figure 3.4. It was determined using the ICP-OES results
from the single stage washing of waste oil derived FAME, described in Chapter 5. The use of
the conductivity meter allowed for quick, real time measurements which made the
experiments described in Chapter 6 possible.
y = 1.356x
R² = 0.9975
y = 1.5466x
R² = 0.9995
0
500
1000
1500
2000
2500
3000
3500
4000
4500
0 500 1000 1500 2000 2500 3000 3500
Co
nd
uct
ivit
y, κ
(µS/
cm)
Sodium salt concentration (ppm)
Sodium sulfate
Sodium chloride
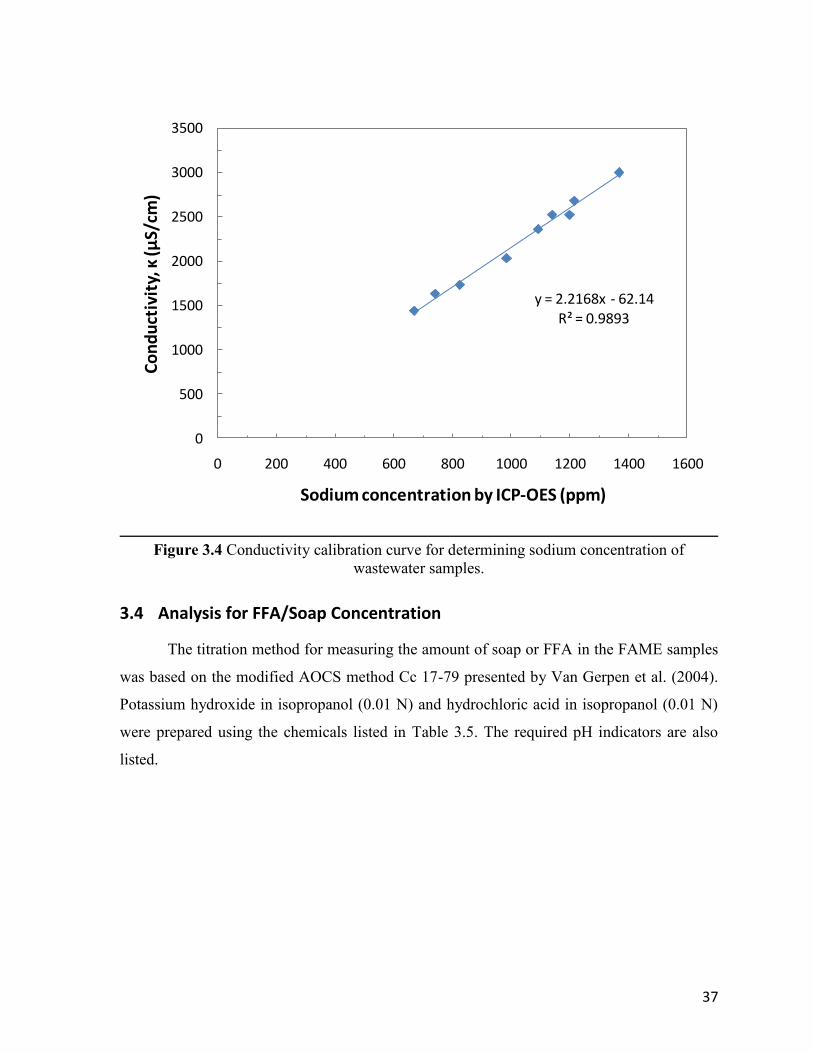
37
Figure 3.4 Conductivity calibration curve for determining sodium concentration of
wastewater samples.
3.4 Analysis for FFA/Soap Concentration
The titration method for measuring the amount of soap or FFA in the FAME samples
was based on the modified AOCS method Cc 17-79 presented by Van Gerpen et al. (2004).
Potassium hydroxide in isopropanol (0.01 N) and hydrochloric acid in isopropanol (0.01 N)
were prepared using the chemicals listed in Table 3.5. The required pH indicators are also
listed.
y = 2.2168x - 62.14R² = 0.9893
0
500
1000
1500
2000
2500
3000
3500
0 200 400 600 800 1000 1200 1400 1600
Co
nd
uct
ivit
y, κ
(µS/
cm)
Sodium concentration by ICP-OES (ppm)

38
Table 3.5 Chemicals used in titration of FFA/soap.
Chemical Supplier Location Purity (%)
Isopropanol Fisher Scientific Fair Lawn, NJ >95
Potassium hydroxide solution
(0.1 N in isopropanol) Fisher Scientific Fair Lawn, NJ 0.56
Hydrochloric acid solution
(0.1 N in isopropanol) Fisher Scientific Fair Lawn, NJ 0.4
Phenolphthalein, Certified ACS Grade Fisher Scientific Fair Lawn, NJ 100
Bromophenol blue solution
(0.04 wt% in water) Sigma-Aldrich Oakville, ON 0.04
The measurement was based on the equilibrium between FFA and soap, shown in
Figure 2.4. Under acidic conditions, the FFA is in the protonated FFA form (left side of the
equation) whereas under basic conditions, the FFA is in the soap form (right side of the
equation).
The concentrations of FFA in the washed FAME and water phases from the single
stage washing experiments (Chapter 5) were measured. To determine the distribution of FFA
between the phases, measurements were made at the FAME phase, the water phase, and the
interface. The procedure used was as follows:
1. 2-3 mL of sample was added to a sample tube. The mass of sample was recorded.
2. About 10 mL of isopropanol was added to the sample tube. The mixture was shaken
for ~1 min then left for ~20 min to allow time for the FFA to dissolve in the
isopropanol.
3. About 100 µL of 1% phenolphthalein indicator in isopropanol solution was added to
the sample. The colour of the sample did not change, indicating that the pH was
below the phenolphthalein endpoint of 8.2.
4. The sample was then transferred to a clear, 20 mL, flat bottom vial.
5. A few drops of 0.01 N potassium hydroxide in isopropanol solution was added with a
burette. These drops would appear pink once they contacted the sample. The sample
was then gently mixed by hand such that any FFA present would react with the
potassium hydroxide and the pink colour would disappear.

39
6. Step 5 was repeated until the colour of the sample remained pink. This indicated that
the equilibrium was such that all FFA present was in the soap form. The volume of
base added was recorded in mL.
7. About 100 µL of bromophenol blue solution was added to the sample. The solution
would turn blue, indicating the pH was above the bromophenol blue endpoint of 4.6.
8. A few drops of 0.01 N hydrochloric acid in isopropanol solution was added to the
sample with a burette. The sample was then gently mixed by hand to ensure the soap
would react with the acid to form protonated FFA molecules.
9. Step 8 was repeated until the colour of the sample changed from blue to yellow. This
indicated that the equilibrium was such that all FFA present was in the protonated
FFA form. The volume of acid added was recorded in mL.
The concentration of FFA was then calculated using the following equation:
(3.6)
where CFFA is the concentration of FFA in parts per million (ppm), Vacid is the volume of acid
added in Steps 8 and 9 in mL, MWFFA is the molecular weight of oleic acid (282.5 g/mol),
and msample is the mass of sample measured in Step 1 in g.
3.5 References
Canakci, M. and J. Van Gerpen, “A pilot plant to produce biodiesel from high free fatty acid
feedstocks,” Trans. Am. Soc. Agric. Eng. 46 (4), 945-954 (2003).
Geankoplis, C. J., “Transport Processes and Separation Process Principles,” Pearson
Education, Inc., Upper Saddle River, NJ (2003).
Genck, W. J., D. S. Dickey, F. A. Baczek, D. C. Bedell, K. Brown, W. Chen, D. E. Ellis, P.
Harriott, T. J. Laros, W. Li, J. K. McGillicuddy, T. P. McNulty, J. Y. Oldshue, F.
Schoenbrunn, J. C. Smith, D. C. Taylor, D. R. Wells, and T. W. Wisdom, “Liquid-Solid
Operations and Equipment,” in “Perry’s Chemical Engineers’ Handbook,” D. W. Green and
R. H. Perry, Eds., McGraw-Hill Companies, Inc., New York, NY (2008).
Van Gerpen, J., B. Shanks, R. Pruszko, D. Clements, and G. Knothe, “Biodiesel Analytical
Methods,” U.S. Department of Energy, National Renewable Energy Laboratory, Golden, CO
(2004).

40
Chapter 4
Simulation of Biodiesel Wastewater Treatment Processes
4.1 Introduction
Because energy production requires large amounts of water and water treatment
requires energy, the two can be considered to be closely linked (Elcock, 2010). With the
increasing world production of biodiesel, the consumption of water must be considered to
ensure efficient use of this valuable resource. Reducing the amount of water used will also
reduce the amount of energy used for water treatment, thereby improving the overall energy
efficiency of biodiesel fuel.
The purification of crude fatty acid methyl esters (FAME) will typically consume one
litre of water per litre of FAME washed (Van Gerpen et al., 2004). Some processes using
high free fatty acid (FFA) feedstocks can require up to three litres of water per litre of FAME
(Canakci and Van Gerpen, 2003). Depending on municipal disposal requirements, this
wastewater will most likely require treatment. Recycling the water will result in cost savings
and minimize the environmental impact of the process. Therefore, the best process is one that
not only minimizes water use and waste production, but also minimizes the amount of energy
required to treat the resulting wastewater.
In this chapter, the purification of biodiesel was modelled using a process simulation
software (Aspen HYSYS, 2011) to determine the energy required by the water washing
process. The simulated biodiesel was produced from used frying oil by the homogenous
alkali-catalyzed reaction with an acid-catalyzed pre-treatment step. Similar simulations have
been previously performed to compare different catalyst systems (Zhang et al., 2003; West et
al., 2008). However, to our knowledge, simulations have not yet been used to compare
wastewater treatment options. A comparison was made between water treatment by
distillation as well as by ion exchange, including an evaluation of the effect of reducing the
amount of water used for each of the processes.

41
4.2 Simulation Conditions
4.2.1 Thermodynamic Model
Due to the presence of polar compounds (such as methanol and glycerol), the Non-
Random Two Liquid (NRTL) thermodynamic model is most commonly used for biodiesel
related simulations (Zhang et al., 2003; West et al., 2008; Gonzalo et al., 2010).
Unfortunately, this model is not applicable for electrolytes, such as the catalysts sodium
hydroxide and sulphuric acid. Therefore, these components were not included in the
simulation. In practice, these components would most likely partition almost completely into
the aqueous phase and their presence would not have a large effect on the distillation
operations.
4.2.2 Components
For most vegetable oils, including canola oil, the most common fatty acid is oleic acid
(Srivastava and Prasad, 2000). Therefore, when simulating the biodiesel process, both Zhang
et al. (2003) and West et al. (2008) used triolein as the initial oil feedstock. Further, they
modelled FFA as oleic acid and FAME as methyl oleate. The properties of these three
components are all present in the Aspen HYSYS component library. Other components used
in the process include methanol, glycerol, and water, which are also available in the
component library.
4.2.3 Transesterification Reaction Products
Both Zhang et al. (2003) and West et al. (2008) simulated the production of biodiesel
from a used frying oil feedstock with 5% FFA (i.e., 95% triolein and 5% oleic acid). Plant
production was specified at 8000 metric tonnes of biodiesel per year, which translates to an
oil feed of approximately 1000 kg/h. Although both authors modelled various catalyst
systems, the simulations presented in this chapter are mainly based on the process presented
by West et al. (2008). This process involved an acid esterification pre-treatment (using
sulphuric acid as the catalyst) to completely convert oleic acid to methyl oleate followed by
transesterification (using sodium hydroxide as catalyst) to convert triolein to methyl oleate.
In order to model the downstream purification operations, only the reaction products
from the transesterification step were required, so modelling the reaction itself was not

42
necessary. West et al. (2008) did not explicitly provide the composition of the reaction
product stream, but did give the composition and flows of the oil and methanol feed streams.
They also provided the following reaction conditions: a methanol to oil molar ratio of 6 and a
reaction conversion of 95%. Using this information, the reaction products were determined
and are presented in Table 4.1.
Table 4.1 Molar flows of reactants and products from transesterification.
Component Molar flows (kmol/h)
Oil and FAME Methanol Products
Triolein 1.111 - 0.056
Methyl oleate 0.222 - 3.390
Methanol - 6.668 3.501
Glycerol - - 1.056
These reaction products form two immiscible phases – one rich in FAME and one
rich in glycerol. As shown in the process model presented by Haas et al. (2006), these phases
are typically separated prior to purification. The liquid-liquid equilibrium of this phase
separation was calculated using Aspen HYSYS with the NRTL thermodynamic package.
Unknown binary interaction parameters were estimated with the Aspen PLUS Properties
V7.2 software, as described by Gonzalo et al. (2010), using the Universal Functional Activity
Coefficient (UNIFAC) method. The phase separation was modelled at 25°C and the resulting
mass fractions and flows are shown in Table 4.2. The water washing step was then simulated
using the streams presented in Table 4.2 along with the subsequent wastewater treatment
operations.

43
Table 4.2 Compositions and mass flows of the two liquid phases formed by the
transesterification reaction.
Property FAME-rich phase Glycerol-rich phase
Mass flow (kg/h) 1076 188.2
Mass fractions:
Triolein 0.0461 0.0000
Methyl oleate 0.9341 0.0004
Methanol 0.0197 0.4835
Glycerol 0.0001 0.5161
4.2.4 Manipulated Variable
After phase separation of the reaction products, the FAME-rich phase is contacted
with water in a water washing step to remove polar contaminants including methanol,
glycerol, and catalyst. This operation was simulated using a counter-current liquid-liquid
extraction column.
Typically, the crude FAME is washed with an equal volume of water (Van Gerpen et
al., 2004). In this simulation, the mass flow of methyl oleate after phase separation was
approximately 1005 kg/h, which corresponds to a volume flow of about 1155 L/h. Therefore
a water flow of 1153 kg/h (1155 L/h) was used to simulate the 1 to 1 volume ratio condition
as a base case scenario. By changing the amount of inlet fresh water, the volume ratio was
varied to determine the effect of the water load on the downstream water treatment
operations.
It is important to note that, for all the simulations presented in this chapter, the
washed biodiesel met the purity specifications for methanol and glycerol. It would therefore
seem obvious that the lowest possible wash water flowrate should be selected. However, as is
demonstrated in later chapters, biodiesel with high initial FFA content leads to soap
formation and increased salt partitioning. As a result, more wash water is required to meet
the specifications for residual salts in the biodiesel. The simulations presented in this chapter
are intended to show the increased energy load associated with using larger amounts of wash
water.

44
4.3 Water Treatment by Distillation
The process flow diagram (PFD) for treating the wastewater by distillation is shown
in Figure 4.1. The simulated process was based on the model presented by Haas et al. (2006).
Figure 4.1 Biodiesel purification process with water treatment by distillation.
The “FAME-rich phase” is first contacted with the “Wash water” stream in a liquid-
liquid extraction column (T-100). This produces the “Washed FAME” and “Contaminated
water” streams. The “Contaminated water” is combined with the “Glycerol-rich phase”.
After removing the small oil phase in a two phase separator (V-101), this combined stream is
then treated by distillation to recover the methanol and water to be recycled back to the
process.
4.3.1 Glycerol Purification Column (T-101)
For a three-component mixture, two columns are required to separate the three
components (Geankoplis, 2003). Referring to the different boiling points of methanol, water,
and glycerol shown in Table 4.3, the first separation is to separate the most volatile
components (methanol and water) from the least volatile (glycerol). This is accomplished in
the first distillation column (T-101 in Figure 4.1).
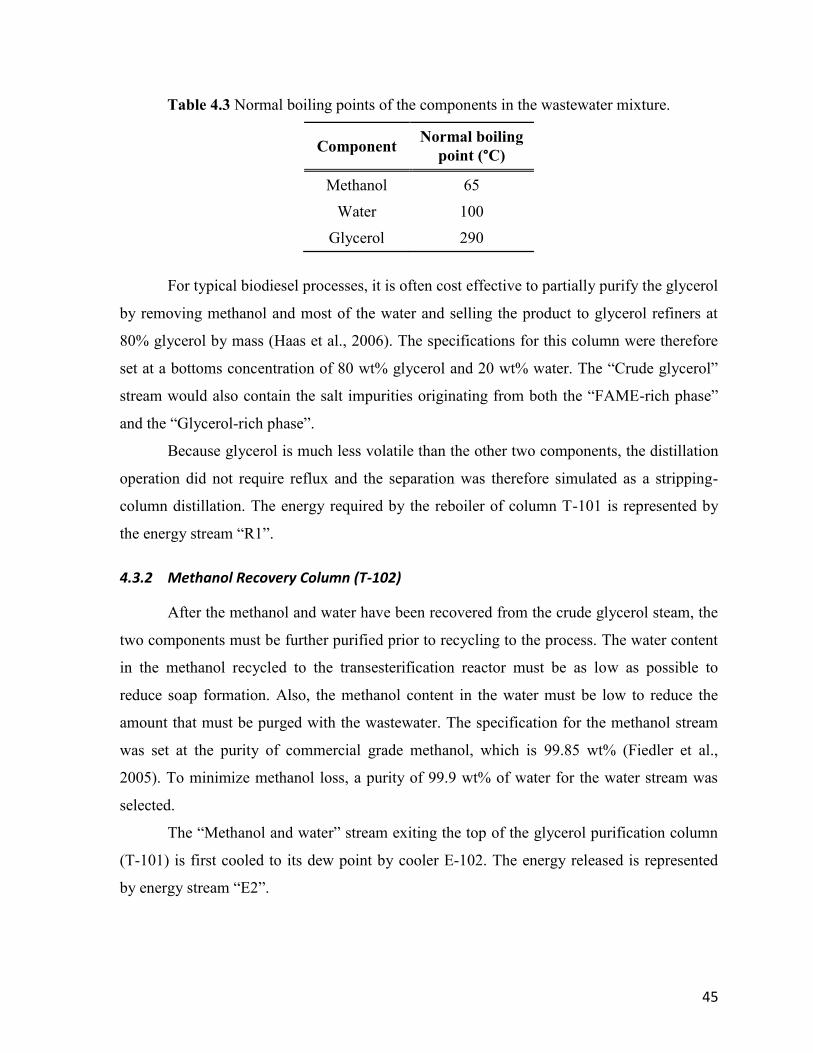
45
Table 4.3 Normal boiling points of the components in the wastewater mixture.
Component Normal boiling
point (°C)
Methanol 65
Water 100
Glycerol 290
For typical biodiesel processes, it is often cost effective to partially purify the glycerol
by removing methanol and most of the water and selling the product to glycerol refiners at
80% glycerol by mass (Haas et al., 2006). The specifications for this column were therefore
set at a bottoms concentration of 80 wt% glycerol and 20 wt% water. The “Crude glycerol”
stream would also contain the salt impurities originating from both the “FAME-rich phase”
and the “Glycerol-rich phase”.
Because glycerol is much less volatile than the other two components, the distillation
operation did not require reflux and the separation was therefore simulated as a stripping-
column distillation. The energy required by the reboiler of column T-101 is represented by
the energy stream “R1”.
4.3.2 Methanol Recovery Column (T-102)
After the methanol and water have been recovered from the crude glycerol steam, the
two components must be further purified prior to recycling to the process. The water content
in the methanol recycled to the transesterification reactor must be as low as possible to
reduce soap formation. Also, the methanol content in the water must be low to reduce the
amount that must be purged with the wastewater. The specification for the methanol stream
was set at the purity of commercial grade methanol, which is 99.85 wt% (Fiedler et al.,
2005). To minimize methanol loss, a purity of 99.9 wt% of water for the water stream was
selected.
The “Methanol and water” stream exiting the top of the glycerol purification column
(T-101) is first cooled to its dew point by cooler E-102. The energy released is represented
by energy stream “E2”.

46
The design of column T-102 was accomplished by optimizing the conditions in
Aspen HYSYS. However, as a starting point, the minimum number of stages was estimated
using the Fenske equation (Geankoplis, 2003):
(4.1)
where Nmin is the minimum number of theoretical plates required at total reflux, xD is the
mole fraction of the more volatile component in the distillate, xB is the mole fraction of the
more volatile component in the bottoms, and αavg is the average relative volatility of the more
volatile component to the less volatile. The average relative volatility can be estimated as:
(4.2)
where
(4.3)
where αD is the relative volatility of the distillate, αB is the relative volatility of the bottoms,
αF is the relative volatility of the feed, i is the more volatile component (i.e., methanol), j is
the less volatile component (i.e., water), K is the vapour-liquid distribution coefficient, y is
the mole fraction in the vapour, and x is the mole fraction in the liquid. The actual number of
trays (N) was then estimated by multiplying Nmin by 2. Multiplying Nmin by 2 is
approximately equivalent to using a reflux ratio that is 1.3 times Rmin, which usually
represents a nearly optimal column configuration (Seader et al., 2010). This value was used
for the number of stages of the simulated distillation column. The feed stage was then
selected so that it minimized the reflux ratio required to meet the purity specifications. The
energy demand of the reboiler is represented by energy stream “R2” and “C2” represents the
energy released by the condenser.
4.3.3 Water Recycle
The “Water” stream exiting the bottom of column T-101 has a purity of 99.9 wt%. A
small portion (5%) is purged by TEE-100, and the remainder is recycled to the water washing
process. It is first cooled to 25°C by cooler E-101 and the energy released is represented by

47
stream “E1”. The stream is then combined with “Fresh water” in MIX-101 to form the
“Wash water” stream used to wash the crude FAME.
4.3.4 Energy Demand
The overall energy demand of the water treatment by distillation process was
determined by summing up all the energy input streams to the column reboilers in Figure 4.1.
Cooling streams were not included in this analysis since cooling is usually accomplished
using cooling water, which has a minimal impact on overall process energy demand and
economics. These column energy streams are summarized in Table 4.4.
Table 4.4 Energy streams for water treatment by distillation process.
Stream Description
Heating R1 Reboiler energy for glycerol purification column
R2 Reboiler energy for methanol recovery column
Cooling
E1 Decreases temperature of recycled water stream to 25°C
E2 Decreases temperature of methanol/water stream to its dew point
C2 Condenser energy for methanol recovery column
4.4 Water Treatment by Ion Exchange
An alternative process, shown in Figure 4.2, regenerates the water by ion exchange.
As in the distillation process, the “FAME-rich phase” is contacted with the “Wash water”
stream in a liquid-liquid extraction column (T-100). Instead of combining the resulting
wastewater stream with the “Glycerol-rich phase”, the two streams are kept separate.
Methanol is recovered to the same level of purity (99.85%) from the “Contaminated water”
stream by distillation in column T-102.

48
Figure 4.2 Biodiesel purification process with water treatment by ion exchange.
In order for the ion exchange process to be comparable to the distillation process
presented in Section 4.3, the “Glycerol-rich phase” requires the same level of purification.
First, methanol is recovered by stripping-column distillation (T-101). Some of the “Water”
stream leaving the bottom of the methanol recovery column (T-102) was then used to
produce crude glycerol at 80 wt% purity.
Although the “Water” stream is now free of methanol, it will still contain the salts
washed out of the “FAME-rich phase”. The type of salts present in the wastewater will
depend on the catalyst and acid used for neutralization. If sodium hydroxide is used as the
catalyst followed by neutralization by hydrochloric acid, the majority of the salts present will
be sodium chloride. To remove these salts, the remaining water exiting TEE-101 is first
cooled to 25°C by cooler E-101 and then contacted with ion exchange resins to remove salts.
Ion exchange operations, which would take place at the “Ion exchange” stream in
Figure 4.2, cannot be simulated with Aspen HYSYS. The operation was therefore simulated
using the shortcut design calculations described below.

49
4.4.1 Ion Exchange Columns
The ion exchange operation requires the use of two types of resins: a cation
exchanger to exchange sodium (Na+) ions for hydrogen (H
+) ions and an anion exchanger to
exchange chlorine ions (Cl-) for hydroxide ions (OH
-). Similar to other adsorption processes,
ion exchangers are typically used in cyclic operations involving both sorption and desorption
steps (LeVan and Carta, 2008). The steps, shown in Figure 4.3, include loading the resin by
passing the wastewater through the bed until breakthrough occurs, regeneration to restore the
original ionic form of the exchanger, and rinsing to remove regenerant from the void volume
and resin pores.
Figure 4.3 Steps involved in a typical ion exchange operation.
For the removal of sodium and chlorine ions from an aqueous solution, strong acid
and strong base resins are used. Pertinent properties of two ion exchangers produced by Dow
Chemicals are shown in Table 4.5. These values were used in the approximate design of an
ion exchange system for the process shown in Figure 4.2.

50
Table 4.5 Resin properties used to design the ion exchange operation.
Resin property Strong acid cation exchanger
Dowex Marathon C
Strong base anion exchanger
Dowex Marathon A
Total exchange capacity 1.8 eq/L 1.0 eq/L
Regenerant 4-5% HCl 2-5% NaOH
Efficiency of
regeneration 120-150% 140-220%
Rinse requirement 2-5 bed volumes 3-6 bed volumes
Referring to Table 2.3 in Chapter 2, the average level of sodium in crude, unwashed
FAME is about 227 ppm. Assuming hydrochloric acid is used to neutralize the catalyst, this
represents a sodium chloride (NaCl) concentration of 577 ppm. It was therefore assumed that
when washing FAME in a 1:1 water to FAME volume ratio, the resulting wastewater would
have a concentration of 508 ppm NaCl. Note that for lower water amounts, this concentration
will increase.
Dow Chemicals recommends using an operational capacity efficiency of 65-90% of
the total exchange capacity. Therefore an efficiency of 75% was assumed.
The chemical efficiency of regeneration for an ion exchange resin is defined as:
(4.4)
The resin usage of the regenerant chemical is non-ideal, therefore the chemical efficiency is
always greater than 100% and becomes worse as the value increases (Dow Water and
Process Solutions, 2011). This efficiency takes into account the amount of regenerant
required in excess in order to achieve sufficient conversion of the resin back to its original
form.
Using the above information and the resin properties in Table 4.5, the amount of
wastewater that can be treated by each resin and the regeneration and rinsing requirements
were calculated for each level of wastewater produced. Sample calculations are shown in
Section 4.8.
The regenerant solutions and rinse water streams represent a waste that would require
treatment. Therefore, in order for the ion exchange process to be comparable to the

51
distillation process, the energy required to evaporate the water from these waste streams was
also determined. Another option to recover water from the regenerant and rinse solutions
would be reverse osmosis. However, evaporation is the most widely used separation method
and was therefore used in this study.
4.4.2 Energy Demand
The total energy demand of the process in Figure 4.2 included the reboiler energies
required by the two distillation columns as well as the energy required to treat the waste
effluent from the ion exchange operations (regeneration and rinsing). The energy streams are
summarized in Table 4.6. Note that the energy required for treating the ion exchange waste is
not part of the process in Figure 4.2, due to the cyclic nature of ion exchange operations.
Table 4.6 Energy streams for water treatment by ion exchange process.
Stream Description
Heating
R1 Reboiler energy for glycerol purification column
R2 Reboiler energy for methanol recovery column
- Evaporation of ion exchange waste effluents
Cooling E1 Decreases temperature of water stream to 25°C
C2 Condenser energy for methanol recovery column
4.5 Results and Discussion
4.5.1 Water Treatment by Distillation
The energy demand of the water treatment by distillation process per litre of biodiesel
produced with respect to the volume ratio in the water washing step is shown in Figure 4.4.
Decreasing the amount of water used in the washing step results in a decrease in the amount
of energy required to treat the produced wastewater. This is simply because there is less
water in the system thereby reducing the load on the distillation columns.

52
Figure 4.4 Energy demand of water treatment of biodiesel wastewater by distillation.
The separation of methanol and water from glycerol was found to require more
energy than the methanol recovery step. This is because a large amount of water must be
evaporated from the glycerol, requiring a large amount of energy.
4.5.2 Water Treatment by Ion Exchange
The energy demand of the ion exchange process with respect to the volume of water
used is shown in Figure 4.5. As expected, decreasing the amount of water decreases the
amount of energy required for water treatment linearly. The energy required for glycerol
separation remains constant because it is independent of the water washing steps. The energy
demand for treating the ion exchange effluent (from regeneration and rinsing) also remains
constant because the volume of effluent generated is constant. Although less wastewater is
produced when using lower amounts of water to wash the FAME, it is more concentrated in
sodium chloride. These opposing effects cancel each other out and result in a constant
volume of ion exchange effluent produced, regardless of the amount of water used to wash
the FAME.
0.0
0.5
1.0
1.5
2.0
2.5
3.0
3.5
0.0 0.2 0.4 0.6 0.8 1.0 1.2
Ene
rgy
de
man
d (M
J/L
bio
die
sel)
Volume of Wash water stream (L/L biodiesel)
Glycerol purification
Methanol recovery
Total

53
Figure 4.5 Energy demand of water treatment of biodiesel wastewater by ion exchange.
One potential limitation of the ion exchange process is the accumulation of glycerol.
Glycerol will be present in the wastewater in small amounts and will not be removed by ion
exchange. It would therefore accumulate in the recycled water stream and be fed to the water
washing column. The amount of glycerol in the wastewater will typically be in the range of
about 0.1 to 0.2 wt%4. The presence of small amounts of glycerol in the washing steam is not
expected to affect the efficiency of the washing operation. In fact, glycerol has been
suggested to be used as the extraction solvent (Bam et al., 1995). However, it could lower the
efficiency of phase separation by increasing the viscosity of the washing phase. Therefore, if
the accumulation of glycerol does become problematic, it may need to be removed from the
recycled wash water periodically by distillation or an alternative method such as adsorption
(Liu et al., 2009). Alternatively, a higher purge ratio could be used on the water recycle
stream, but this would again increase the fresh water demand.
4 Chavalparit and Ongwandee (2009) reported a concentration of 0.136 wt% of glycerol
0.0
0.2
0.4
0.6
0.8
1.0
1.2
0.0 0.2 0.4 0.6 0.8 1.0 1.2
Ene
rgy
de
man
d (M
J/L
bio
die
sel)
Volume of Wash water stream (L/L biodiesel)
Glycerol purification
Methanol recovery
Ion exchange effluent
Total

54
4.5.3 Comparison of Water Treatment Options
A comparison between the total energy required for both the distillation and ion
exchange water treatment options is shown in Figure 4.6. The results show that using ion
exchange to treat the wastewater results in a decrease in energy requirements of about 69% at
a wash water volume ratio of 1:1. The difference between the two treatment options
decreases with decreasing water volume. The ion exchange process is more favourable
except at water wash volumes less than about 0.15 L per L of biodiesel. This is most likely
because the ion exchange resins become less efficient at very high concentrations of sodium
chloride.
Figure 4.6 Total energy demand of water treatment of biodiesel wastewater.
Biodiesel has a heat of combustion of about 35.2 MJ/L (Mittelbach and Remschmidt,
2004). According to this simulation, at the typical water washing volume ratio of 1:1, the
distillation process requires 3.12 MJ of energy for water treatment per litre of biodiesel
produced. This is 8.9% of the heat of combustion which represents a reduction in the overall
y = 2.995x + 0.1312R² = 1
y = 0.4865x + 0.4924R² = 0.9996
0.0
0.5
1.0
1.5
2.0
2.5
3.0
3.5
0.0 0.2 0.4 0.6 0.8 1.0 1.2
Ene
rgy
de
man
d (M
J/L
bio
die
sel)
Volume of Wash water stream (L/L biodiesel)
Distillation
Ion exchange

55
energy efficiency of the fuel. At the same volume ratio, 0.978 MJ of energy is required to
treat each litre of wastewater using the ion exchange process. This represents only 2.8% of
the heat of combustion of biodiesel, thereby improving the energy efficiency in comparison
to the distillation process.
4.5.4 Effect of Amount of Water
In both processes, reducing the amount of water had a clear impact on the overall
energy efficiency of the biodiesel purification process. Both treatment options show a
decreasing linear trend with decreasing amounts of wash water. It is clear that the water
washing process should be optimized to minimize water and energy requirements. Washing
in a counter-current washing configuration as opposed to a cross-current one can reduce the
amount of water used in the washing step. The amount of water used in each washing stage
must also be chosen such that it optimizes the removal efficiency of the contaminants, while
minimizing the amount of wastewater generated.
To optimize the water washing process, the determination of the distribution of
impurities between the water and biodiesel phases for all feedstock qualities is important.
Such information on the distribution of salts is lacking in the literature and would clearly be
useful for process optimization.
4.6 Summary
The treatment and recycle of the wastewater generated by biodiesel production was
simulated using Aspen HYSYS process simulation software. By changing the amount of
fresh water fed to the process, the effect of the amount of water in the process on the energy
requirements of the process was quantified. Furthermore, a comparison between conventional
wastewater treatment by distillation and the use of ion exchange resins was made.
Biodiesel production will typically generate about 1 litre of wastewater per litre of
biodiesel produced. Under these conditions and using conventional water treatment by
distillation, 3.12 MJ of energy are required to purify the wastewater per litre of biodiesel.
This represents 8.9% of the heat of combustion of biodiesel, resulting in a reduction in the
fuel’s overall energy efficiency. The simulations showed that reducing the amount of water

56
used in the purification process would improve the energy efficiency of the process linearly
by reducing the load on the distillation operations.
An alternative process using ion exchange resins was shown to improve the energy
efficiency of biodiesel production. This process reduces the amount of purification performed
using distillation. After recovering methanol by distillation and removing salt impurities by
ion exchange, the wastewater can be directly reused to purify incoming FAME. At the typical
water washing ratio of 1:1, the ion exchange process required 0.978 MJ of energy per litre of
biodiesel, representing only 2.8% of the heat of combustion of biodiesel. In comparison, to
distillation, the ion exchange method reduced the amount of energy by approximately 69%.
The simulation results show the importance of reducing the amount of water used in
the purification process. Reducing the amount of energy required for wastewater treatment
can represent a cost saving, since it improves the overall energy efficiency of the biodiesel
fuel. Also, smaller wastewater streams reduce the size of the required distillation columns,
which decreases the capital cost of the plant. If the same degree of purification can be
accomplished in a counter-current washing configuration, this would be an ideal way of
reducing the amount of wastewater produced.
These results also provide validation for the use of ion exchange for treating the
wastewater from a biodiesel process. Further investigation would be required to verify that
the resin can effectively and efficiently remove the salt impurities from the wastewater even
when other impurities are present. Furthermore, the fate of non-ionic components such as
glycerol must also be determined. If the glycerol is not removed prior to recycle, it will
accumulate in the recycled wash water stream. Therefore, the limit to which glycerol can be
allowed to accumulate would need to be determined. Once these issues have been addressed,
the use of ion exchange for wastewater treatment could prove to be a viable, less energy
intensive alternative to distillation.
4.7 References
Aspen HYSYS V7.2, Aspen Technology Inc., Cambridge, MA (2011).
Bam, N., D. C. Drown, R. Korus, D. S. Hoffman, T. G. Johnson, and J. M. Washam,
“Method for purifying alcohol esters,” U. S. Pat. 5,424,467 (1995).

57
Canakci, M. and J. Van Gerpen, “A pilot plant to produce biodiesel from high free fatty acid
feedstocks,” Trans. Am. Soc. Agric. Eng. 46 (4), 945-954 (2003).
Chavalparit, O. and M. Ongwandee, “Optimizing electrocoagulation process for the
treatment of biodiesel wastewater using response surface methodology,” J. Environ. Sci. 21,
1491-1496 (2009).
Dow Water and Process Solutions, “How to Design an Ion Exchange System,” Technical
information on ion exchange, Accessed in April 2011, Available online:
http://www.dowwaterandprocess.com/support_training/literature_manuals/ix_techinfo/design
stps_eff.htm.
Elcock, D., “Future U.S. water consumption: The role of energy production,” J. Am. Water
Resour. Assoc. 46 (3), 447-460 (2010).
Fiedler, E., G. Grossmann, D. B. Kersebohm, G. Weiss, and C. Witte, “Methanol,” in
“Ullmann’s Encyclopedia of Industrial Chemistry,” Wiley-VCH, Weinheim, Germany
(2005).
Geankoplis, C. J., “Transport Processes and Separation Process Principles,” Pearson
Education, Inc., Upper Saddle River, NJ (2003).
Gonzalo, A., M. García, J. L. Sánchez, J. Arauzo, and J. A. Peña, “Water cleaning of
biodiesel. Effect of catalyst concentration, water amount, and washing temperature on
biodiesel obtained from rapeseed oil and used oil,” Ind. Eng. Chem. Res. 49, 4436-4443
(2010).
Haas, M. J., A. J. McAloon, W. C. Yee, and T. A. Foglia, “A process model to estimate
biodiesel production costs,” Bioresource Technol. 97, 671-678 (2006).
LeVan, M. D., G. Carta, “Adsorption and Ion Exchange,” in “Perry’s Chemical Engineers’
Handbook,” D. W. Green and R. H. Perry, Eds., McGraw-Hill Companies, Inc., New York,
NY (2008).
Liu S., S. R. Musuku, S. Adhikari, and S. Fernando, “Adsorption of glycerol from biodiesel
washwaters,” Environ. Technol. 30 (5), 505-510 (2009).
Mittelbach, M. and C. Remschmidt, “Biodiesel - The Comprehensive Handbook,” Martin
Mittelbach (Publisher), Graz, Austria (2004).
Seader, J. D., E. J. Henley, and D. K. Roper, “Separation Process Principles,” John Wiley
and Sons (2010).
Srivastava, A. and R. Prasad, “Triglycerides-based diesel fuels,” Renewable Sustainable
Energy Rev. 4, 111-133 (2000).

58
Van Gerpen, J., B. Shanks, R. Pruszko, D. Clements, and G. Knothe, “Biodiesel Production
Technology,” U.S. Department of Energy, National Renewable Energy Laboratory, Golden,
CO (2004).
West, A. H., D. Posarac, and N. Ellis, “Assessment of four biodiesel production processes
using HYSYS.Plant,” Bioresource Technol. 99, 6587-6601 (2008).
Zhang, Y., M. A. Dubé, D. D. McLean, and M. Kates, “Biodiesel production from waste
cooking oil: 1. Process design and technological assessment,” Bioresour. Technol. 89, 1-16
(2003).
4.8 Sample Calculations
Volume of wastewater treated per volume of strong acid cation exchange resin:
(4.5)
Volume of wastewater treated per volume of strong base anion exchange resin:
(4.6)
Volume of 4.5% HCl regenerant solution per volume of strong acid cation exchange
resin:
(4.7)

59
Volume of 3.5% NaOH regenerant solution per volume of strong base anion exchange
resin:
(4.8)
Volume flow of regenerant and rinse water for strong acid cation exchange resin:
(4.9)
Volume flow of regenerant and rinse water for strong base anion exchange resin:
(4.10)
Total volume flow of regenerant and rinse water:
(4.11)

60
Chapter 5
Sodium Distribution between Water and FAME Phases
5.1 Introduction
Water washing is used to remove unwanted polar components from the crude
biodiesel (i.e., fatty acid methyl ester or FAME) including the catalyst which is, depending
on the catalyst used, in the form of a sodium salt. The separation is based on the component’s
relative solubility between the two immiscible phases, i.e., the water phase and the FAME
phase. Due to the partition that is formed, multiple wash stages are often required to reduce
the component’s concentration to an acceptable level. Investigation of the distribution in a
single stage is important because it can help predict the behaviour in a multistage operation.
The objective of these experiments was to investigate the removal of sodium from
FAME in a single water washing step. Specifically, the distribution of sodium between the
two liquid phases was measured to determine the distribution coefficient for both FAME
derived from refined canola oil (low free fatty acid (FFA) feedstock) and waste frying oil
(high FFA feedstock). For the waste oil derived FAME, the amount of FFA in each phase
was also measured to determine its effect on sodium partitioning.
5.2 Experimental Design
5.2.1 Canola Oil Derived FAME
Canola oil was used to produce FAME, as described in Chapter 3 (Section 3.1.1).
Samples of FAME were then washed with water containing varying amounts of sodium. The
conditions for these washing experiments are shown in Table 5.1. The sodium sulfate
concentration of the water phase ranged from 0 to 3000 ppm which corresponded to sodium
concentrations up to about 1000 ppm.

61
Table 5.1 Run conditions for single stage washing of canola oil derived FAME.
Run
Sodium sulfate
(Na2SO4)
concentration
(ppm)
Sodium
(Na)
concentration
(ppm)
1 0 0
10 0 0
2 50.0 16.2
6 50.5 16.3
3 99.1 32.1
5 200 64.7
4 402 130
7 1002 324
8 1980 641
11 1984 642
9 2976 963
The order in which the runs were conducted was randomized. Replicate runs were
performed at sodium concentrations of 0, 16, and 640 ppm (Runs 1 and 10, 2 and 6, and 8
and 11).
5.2.2 Waste Oil Derived FAME
The run conditions for the waste oil derived FAME are shown in Table 5.2. The range
of conditions investigated was the same as for the canola oil derived FAME, however the
sodium salt was sodium chloride instead of sodium sulfate. This was to remain consistent
with the acid used to neutralize the catalyst, which was sulfuric acid for the canola oil FAME
and hydrochloric acid for the waste oil FAME (see Chapter 3, Section 3.1.2).
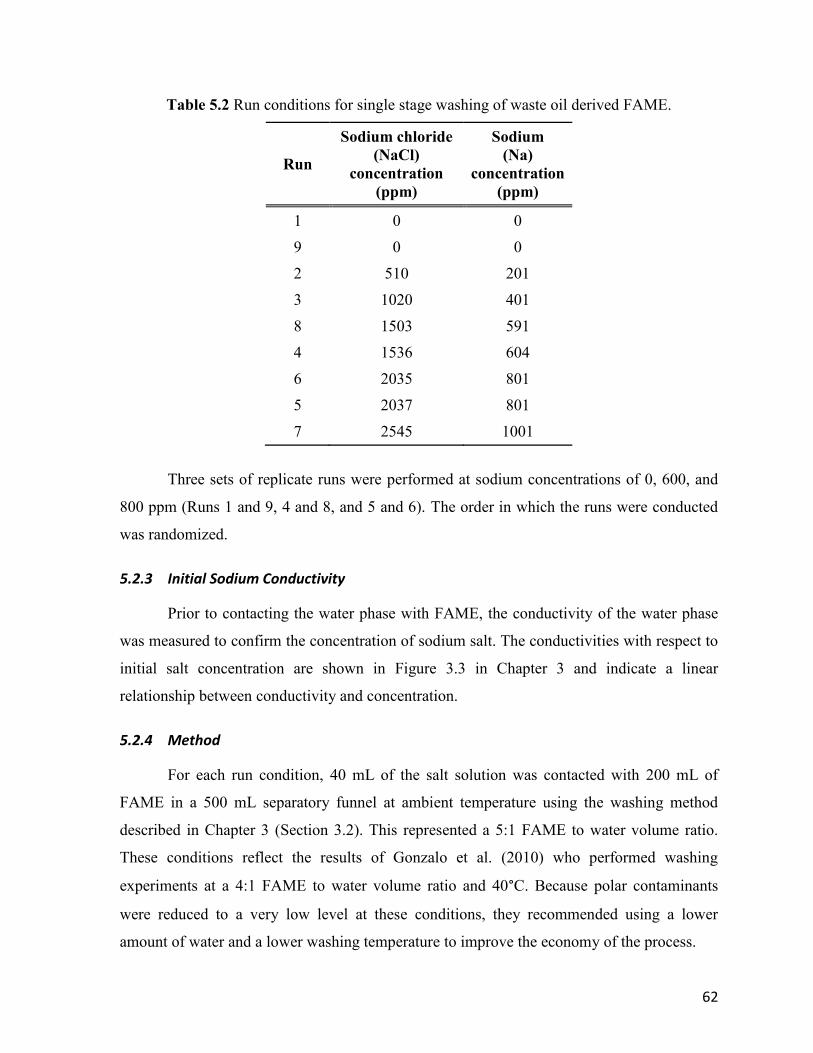
62
Table 5.2 Run conditions for single stage washing of waste oil derived FAME.
Run
Sodium chloride
(NaCl)
concentration
(ppm)
Sodium
(Na)
concentration
(ppm)
1 0 0
9 0 0
2 510 201
3 1020 401
8 1503 591
4 1536 604
6 2035 801
5 2037 801
7 2545 1001
Three sets of replicate runs were performed at sodium concentrations of 0, 600, and
800 ppm (Runs 1 and 9, 4 and 8, and 5 and 6). The order in which the runs were conducted
was randomized.
5.2.3 Initial Sodium Conductivity
Prior to contacting the water phase with FAME, the conductivity of the water phase
was measured to confirm the concentration of sodium salt. The conductivities with respect to
initial salt concentration are shown in Figure 3.3 in Chapter 3 and indicate a linear
relationship between conductivity and concentration.
5.2.4 Method
For each run condition, 40 mL of the salt solution was contacted with 200 mL of
FAME in a 500 mL separatory funnel at ambient temperature using the washing method
described in Chapter 3 (Section 3.2). This represented a 5:1 FAME to water volume ratio.
These conditions reflect the results of Gonzalo et al. (2010) who performed washing
experiments at a 4:1 FAME to water volume ratio and 40°C. Because polar contaminants
were reduced to a very low level at these conditions, they recommended using a lower
amount of water and a lower washing temperature to improve the economy of the process.

63
For the waste oil derived FAME runs, slightly acidic water (pH of 4.5) was used by
adding hydrochloric acid to the salt solutions. Using acidic water is recommended to help
reduce foaming and the formation of emulsions caused by the presence of FFA (Haas et al.,
2006).
After the phases were separated, the concentration of sodium was measured in both
phases by Inductively Coupled Plasma Optical Emission Spectroscopy (ICP-OES).
5.2.5 Determination of Error
The error bars shown in the figures below represent two standard deviations (95%
confidence interval) which were determined using the replicate data.
5.2.6 Initial Concentrations in FAME
The initial concentrations of sodium (Na) were measured by ICP-OES in both
unwashed FAME sources and are presented in Table 5.3.
Table 5.3 Initial sodium concentrations in FAME.
Sample
Sodium (Na)
concentration
(ppm)
Canola oil derived FAME (Batches 1-7) 58.7
Canola oil derived FAME (Batches 8-12) 89.7
Waste oil derived FAME (Batches 3-5) 130.6
The waste oil derived FAME had a higher initial sodium concentration. Both FAME
sources used similar catalyst (sodium methoxide) concentrations for the transesterification
reaction (see Chapter 3, Section 3.1). However, the waste oil batches required additional
sodium methoxide to neutralize the acid catalyst from the esterification pre-treatment. It is
therefore reasonable that the waste oil FAME would have a higher initial sodium content.
5.3 Results and Discussion
5.3.1 Sodium Extraction
Figure 5.1 shows the final sodium concentration in the water phase after contacting

64
with the canola oil derived FAME with respect to the initial sodium concentration. The
vertical distance between each data point and the 45° line represents the change in sodium
concentration of the water phase which is equal to the quantity removed from the FAME. A
linear trend is observed and the slope of the trendline is approximately equal to that of the
parity line. This indicates that the quantity of sodium extracted from the FAME in each wash
is nearly constant over the range tested.
Figure 5.1 Initial and final sodium concentrations in the water phase for the canola oil
derived FAME.
The same data for the waste oil derived FAME are shown in Figure 5.2. The data
form a linear trend with a slope of approximately 0.69. The slope has a value less than 1,
therefore there is a reduction in the amount of sodium extracted at high initial sodium
concentrations compared to that at lower initial concentrations.
y = 0.953x + 349.63
R² = 0.9957
0
200
400
600
800
1000
1200
1400
1600
0 200 400 600 800 1000 1200 1400 1600
Fin
al s
od
ium
(Na)
co
nce
ntr
atio
n in
wat
er
ph
ase
(pp
m)
Initial sodium (Na) concentration in water phase (ppm)

65
Figure 5.2 Initial and final sodium concentrations in the water phase for the waste oil derived
FAME.
5.3.2 Distribution Coefficient
Figure 5.3 shows the final sodium concentrations in the canola oil derived FAME
phase with respect to the final concentration in the water phase. The final sodium
concentration in the FAME phase remains relatively constant. This indicates that the final
concentration achieved by the washing is independent of the initial amount of sodium in the
water phase over the range of concentrations studied.
y = 0.6867x + 686.05R² = 0.9951
0
200
400
600
800
1000
1200
1400
1600
0 200 400 600 800 1000 1200 1400 1600
Fin
al s
od
ium
(Na)
co
nce
ntr
atio
n in
wat
er
ph
ase
(pp
m)
Initial sodium (Na) concentration in water phase (ppm)

66
Figure 5.3 Final sodium concentrations in the canola oil derived FAME and water phases.
It should be noted that the ASTM limit for sodium (combined with potassium) is 5
ppm (ASTM D6751, 2009). This specification was therefore achieved, for the canola oil
derived FAME, in a single washing step for the full range of concentrations tested. Similar
results were also obtained by Gonzalo et al. (2010).
The data in Figure 5.3 can be used to determine the distribution coefficient (K) of
sodium between the water and FAME phases. K can be defined as the ratio of the
concentration of sodium in the water phase to the concentration in the FAME phase:
(5.1)
The values of the distribution coefficient as a function of concentration in the water
phase are shown in Figure 5.4.
0
1
2
3
4
5
6
7
8
9
10
0 200 400 600 800 1000 1200 1400 1600
Fin
al s
od
ium
(Na)
co
nce
ntr
atio
n in
FA
ME
ph
ase
(pp
m)
Final sodium (Na) concentration in water phase (ppm)
ASTM D 6751-09 Limit

67
Figure 5.4 Distribution coefficient of sodium between the water and FAME phases for the
canola oil derived FAME as a function of the concentration in the water phase.
The distribution coefficient was found to be very high, ranging from 238 to 1363.
This is because the concentration of sodium in the FAME phase, as seen in Figure 5.3, was
very low, with an average value of 1.4 ppm. Regardless of the total quantity of sodium in the
system, almost all will partition into the water phase. Furthermore, because the concentration
in the FAME phase is relatively constant, the trend in Figure 5.4 is approximately linear; this
is because it depends primarily on the concentration in the water phase.
The high removal efficiency of sodium from FAME by water is due to the difference
in relative permittivities of the two solvents. The relative permittivity of a solvent (εr), also
referred to as the dielectric constant, is a relative measure of a solvent’s polarity and
influences the dissolution and dissociation of electrolytes (Izutsu, 2002). At 20°C, water has
a relative permittivity of 80.20 (Dean, 1999) whereas methyl oleate, a common fatty acid
methyl ester found in biodiesel, has a relative permittivity of only 3.211 (Gouw and Vlugter,
1964). For solvents with εr<10, the fraction of electrolytes dissociated into ions is small.
y = 1.143x - 233.46
R² = 0.9234
0
200
400
600
800
1000
1200
1400
1600
0 200 400 600 800 1000 1200 1400 1600
Dis
trib
uti
on
co
eff
icie
nt,
K
Sodium (Na) concentration in water phase (ppm)

68
Conversely, in high-permittivity solvents with εr>40, electrolytes dissociate almost
completely into ions (Izutsu, 2002). As a result, the sodium will transfer from the FAME
phase to the water phase in the form of dissolved sodium sulfate salts.
Figure 5.5 shows the final sodium concentrations in the waste oil derived FAME
phase with respect to the final concentration in the water phase. For comparison, the data for
the canola oil derived FAME are also shown.
Figure 5.5 Final sodium concentrations in the waste and canola oil derived FAME and water
phases.
The reduction in sodium extraction observed in Figure 5.2 is reflected in Figure 5.5.
At higher initial sodium concentrations, less sodium is extracted to the water phase, resulting
in a higher concentration in the FAME phase. As a consequence, it is not possible to extract
all the sodium from the FAME phase in a single washing step. It was also observed that the
specification for sodium (5 ppm) was not met for any of the runs for the waste oil derived
0
2
4
6
8
10
12
14
16
18
20
0 200 400 600 800 1000 1200 1400 1600
Fin
al s
od
ium
(Na)
co
nce
ntr
atio
n in
FA
ME
ph
ase
(pp
m)
Final sodium (Na) concentration in water phase (ppm)
Canola oil FAME
Waste oil FAME
ASTM D 6751-09 Limit

69
FAME. Therefore, multiple washes would be necessary to achieve the required level of
purification.
The distribution coefficient (K) for the waste oil derived FAME is shown in Figure
5.6 along with the canola oil FAME data for comparison. The vales of K are found to range
between approximately 72 to 93, much less than the values for the canola oil derived FAME.
Figure 5.6 Distribution coefficient of sodium between the water and FAME phases for the
waste and canola oil derived FAMEs as a function of the concentration in the water phase.
5.4 Free Fatty Acid (FFA) Extraction
Because the distribution coefficient for the waste oil derived FAME was found to be
much lower than that of the canola oil derived FAME, it can be reasoned that there is an
added factor affecting the removal of sodium. The difference in sodium removal can be
attributed to the presence of FFA in the waste oil derived FAME, as described below.
For the waste oil derived FAME runs, the initial and final FFA concentrations were
measured by titration (see Chapter 3, Section 3.4) to determine the amount of soap extracted
y = 1.143x - 233.46
R² = 0.9234
y = 0.0325x + 49.706
R² = 0.9029
0
200
400
600
800
1000
1200
1400
1600
0 200 400 600 800 1000 1200 1400 1600
Dis
trib
uti
on
co
eff
icie
nt,
K
Sodium (Na) concentration in water phase (ppm)
Canola oil FAME
Waste oil FAME

70
at each run condition. The initial FFA concentration in the FAME was measured to be
(3552 ± 64) ppm which corresponds to a mass of (612 ± 11) mg. The final masses of FFA in
both phases after washing are shown in Figure 5.7.
Figure 5.7 Final mass of FFA in the water and waste oil derived FAME phases with respect
to initial sodium concentration in the water phase.
Figure 5.7 shows that FFA removal from the FAME phase was not significant. In
fact, only 7% was removed, on average. The low quantity of FFA removed results from the
use of acidic water, which is often recommended because it reduces foaming and the
formation of emulsions. However, the acidic water shifts the equilibrium between FFA and
soap toward the formation of FFA, which is not soluble in water. As a result, FFA removal
was minimal over the full range of concentrations tested.
There is an apparent inconsistency in the mass balance of the system. The final
amount of FFA measured in the water phase plus that in the FAME phase is greater than the
initial measured mass, on average, by about 16%. Therefore, either the water measurements
0
200
400
600
800
1000
1200
0 200 400 600 800 1000 1200
Fin
al F
FA m
ass
(mg)
Initial sodium (Na) concentration in water phase (ppm)
Water phase
FAME phase
Initial mass

71
are too high or the FAME measurements are too low. Since the titration method for
measuring FFA is intended for biodiesel samples, it is possible that it is less accurate for
water samples. Thus, it is possible that the measured FFA concentrations in the water phase
are too high.
The concentrations of FFA in both phases are presented in Figure 5.8, along with the
concentration measured at the interface between the two phases. Although the concentrations
in the bulk phases remain relatively constant, there is an increase of FFA concentration at the
interface for high initial sodium concentrations.
Figure 5.8 Final FFA concentration in the water and waste oil derived FAME phases with
respect to initial sodium concentration in the water phase.
This accumulation of FFA at the interface explains the partitioning of sodium that
was observed for the waste oil FAME washing runs (refer to Figure 5.5). The presence of
FFA interacts with sodium removal by forming soap, as seen in Figure 5.9. Due to the
0
1000
2000
3000
4000
5000
6000
7000
8000
9000
10000
0 200 400 600 800 1000 1200
Fin
al F
FA c
on
cen
trat
ion
(pp
m)
Initial sodium (Na) concentration in water phase (ppm)
Water phase FAME phase Interface Initial concentration
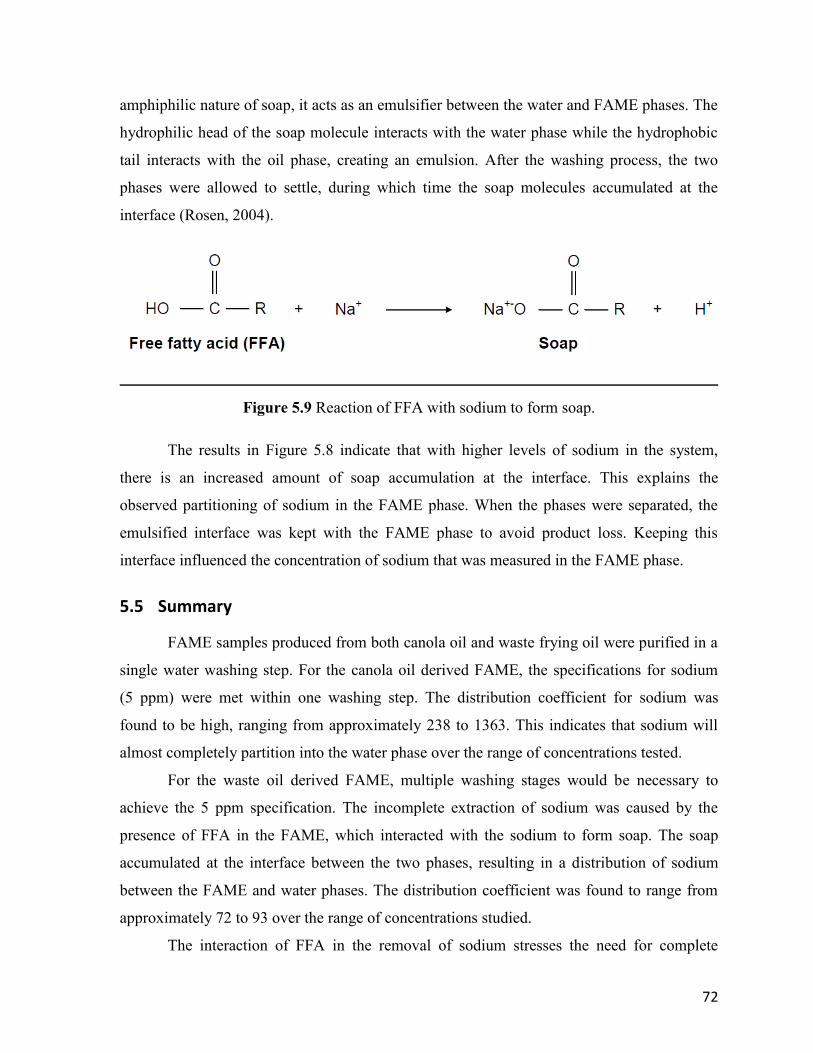
72
amphiphilic nature of soap, it acts as an emulsifier between the water and FAME phases. The
hydrophilic head of the soap molecule interacts with the water phase while the hydrophobic
tail interacts with the oil phase, creating an emulsion. After the washing process, the two
phases were allowed to settle, during which time the soap molecules accumulated at the
interface (Rosen, 2004).
Figure 5.9 Reaction of FFA with sodium to form soap.
The results in Figure 5.8 indicate that with higher levels of sodium in the system,
there is an increased amount of soap accumulation at the interface. This explains the
observed partitioning of sodium in the FAME phase. When the phases were separated, the
emulsified interface was kept with the FAME phase to avoid product loss. Keeping this
interface influenced the concentration of sodium that was measured in the FAME phase.
5.5 Summary
FAME samples produced from both canola oil and waste frying oil were purified in a
single water washing step. For the canola oil derived FAME, the specifications for sodium
(5 ppm) were met within one washing step. The distribution coefficient for sodium was
found to be high, ranging from approximately 238 to 1363. This indicates that sodium will
almost completely partition into the water phase over the range of concentrations tested.
For the waste oil derived FAME, multiple washing stages would be necessary to
achieve the 5 ppm specification. The incomplete extraction of sodium was caused by the
presence of FFA in the FAME, which interacted with the sodium to form soap. The soap
accumulated at the interface between the two phases, resulting in a distribution of sodium
between the FAME and water phases. The distribution coefficient was found to range from
approximately 72 to 93 over the range of concentrations studied.
The interaction of FFA in the removal of sodium stresses the need for complete

73
conversion of FFA in the acid esterification pre-treatment, and also the need for low
concentrations of water in the transesterification mixture to reduce formation of FFA by
saponification. The waste oil derived FAME used in these experiments was produced using
an acid esterification pre-treatment followed by base transesterification. The initial level of
FFA was approximately 3600 ppm (or 0.36 wt%). A lower FFA level would reduce the
concentration of soap prior to the washing step. This would improve sodium extraction to the
water phase because less would accumulate at the interface as soap.
The results show that sodium removal can still be accomplished in the presence of
0.36 wt% FFA, since a reduction in concentration was observed. However, in that case,
multiple washes are required, resulting in high water use. Ensuring the FFA level is as low as
possible will therefore help to reduce the amount of water required when purifying FAME
produced with high FFA feedstocks such as waste frying oil.
FFA removal by water washing was not found to be significant when using acidic
water. The alternative is to use basic or neutral water, which promotes the formation of
emulsions leading to operational difficulties. Another option for FFA removal is to first
remove any interface layer formed; however, this will represent a loss of product. This
further highlights the complications that arise from the presence of FFA, and illustrates the
need for reduced FFA levels when purifying FAME by water washing.
5.6 References
ASTM Standard D6751, “Standard specification for biodiesel fuel blend stock (B100) for
middle distillate fuels,” ASTM International, West Conshohocken, PA (2009).
Dean, J. A., “Section 5 - Physical Properties,” in “Lange's Handbook of Chemistry ,” J. A.
Dean, Ed., McGraw-Hill, Inc., New York, NY (1999).
Gonzalo, A., M. García, J. L. Sánchez, J. Arauzo, and J. A. Peña, “Water cleaning of
biodiesel. Effect of catalyst concentration, water amount, and washing temperature on
biodiesel obtained from rapeseed oil and used oil,” Ind. Eng. Chem. Res. 49, 4436-4443
(2010).
Gouw, T. H. and J. C. Vlugter, “Physical properties of fatty acid methyl esters. V. Dielectic
constant,” J. Am. Oil Chem. Soc. 41, 675-678 (1964).
Haas, M. J., A. J. McAloon, W. C. Yee, and T. A. Foglia, “A process model to estimate
biodiesel production costs,” Bioresource Technol. 97, 671-678 (2006).

74
Izutsu, K. “Electrochemistry in Nonaqueous Solutions,” Wiley-VCH, Weinheim, Germany
(2002).
Rosen, M. J., “Surfactants and Interfacial Phenomena,” John Wiley & Sons, Inc., Hoboken,
NJ (2004).

75
Chapter 6
Counter-Current Washing of Waste Oil Derived FAME
6.1 Introduction
As seen in Chapter 5, fatty acid methyl ester (FAME) produced from low free fatty
acid (FFA) feedstock such as refined canola oil requires only one water washing step to
reduce the concentration of sodium below the required limit of 5 ppm (ASTM D6751, 2009).
Conversely, FAME produced from high FFA feedstocks such as waste frying oil will require
multiple washing stages due to the interaction of FFA with sodium to form soap. In
multistage liquid-liquid extraction, two common solvent contacting options, in this case
water, are cross-current or counter-current, using either batch-wise or continuous operation
(Frank et al., 2008).
In the current literature concerning water washing of biodiesel, samples are typically
washed repeatedly with water, sometimes up to ten times (Predojević, 2008). This represents
a cross-current contacting scheme and, on an industrial level, is not an efficient use of water.
To conserve water and produce a more concentrated wastewater stream, a counter-current
multiple-stage process should be used. As a result, less wastewater is produced, and less
energy is required for downstream wastewater treatment. This will improve the overall
energy efficiency and environmental impact of the biodiesel production process.
To reduce water use, Maliszewski et al. (2008) recommended recycling the spent
wash water from biodiesel production and using a counter-current contacting scheme.
However, experimental data from such a process have not yet been presented in the literature.
In this chapter, cross- and counter-current washing processes were simulated by
solving the material balances for each process stage in conjunction with the equilibrium
relationship obtained in Chapter 5. Experiments were also performed to compare sodium
removal in a cross-current water washing scheme to that of a counter-current scheme and to
evaluate the potential water reduction. The experiments were performed in a laboratory scale
approximation of a counter-current contacting scheme, which employed repeated cross-
current batch washing experiments. Finally, the simulation results were compared to the
experimental data.

76
6.2 Simulations
To simulate the removal of sodium from FAME by multistage water extraction,
equilibrium data for the distribution of sodium between the FAME and water phases are
required. These data were previously obtained from the single stage experiments for the
waste oil derived FAME (see Figure 5.5 in Chapter 5), and are shown again in Figure 6.1.
Figure 6.1 Equilibrium data for sodium distribution between FAME and water phases as
determined from single stage washing experiments.
Unfortunately, there are no experimental data points in Figure 6.1 at very low
concentrations in the FAME phase. The equilibrium was therefore estimated by extrapolating
the curve to the origin. A second order polynomial was assumed for the extrapolation, due to
lack of better information and because a linear equation would not cross the origin.
It is observed that there is a large difference in the scale of the two axes in Figure 6.1.
Because sodium salts are more soluble in water in comparison to FAME, the partitioning of
sodium will favour the water phase. As a result, a large quantity of sodium can be removed
0
200
400
600
800
1000
1200
1400
1600
0 2 4 6 8 10 12 14 16
Sod
ium
co
nce
ntr
atio
n in
wat
er
ph
ase
(p
pm
)
Sodium concentration in FAME phase (ppm)
Equilibrium data
Extrapolated curve
y = 3.7605x2 + 37.291x

77
from the FAME in one washing step. However, as concluded in Chapter 5, one water
washing step was not sufficient to meet the ASTM limit of 5 ppm.
6.2.1 Cross-Current Washing
In a cross-current contacting scheme, shown in Figure 6.2, the crude FAME
containing a high level of contaminants (F0) is washed sequentially in multiple stages, each
time using fresh water (W0).
Figure 6.2 Cross-current multistage extraction process flow diagram.
Assuming that the water and FAME phases are immiscible, a mass balance on sodium
around each stage can be used to determine the amount of sodium exchanged between the
two phases:
(6.1)
where Fn is the mass of FAME at stage n, Wn is the mass of water at stage n, xn is the
concentration of sodium in the FAME phase at stage n, and yn is the concentration of sodium
in the water phase at stage n. The units of mass for Fn and Wn represent batch-wise operation
whereas units of flow (i.e., mass per unit time) would be required for continuous operation.
The concentration of sodium in the fresh water streams (y0) is always equal to zero.
Furthermore, the equilibrium relationship from Figure 6.1 can be used to replace one of the
concentrations at stage n. Therefore, Equation (6.1) becomes:

78
(6.2)
where (6.3)
Note that all concentrations must be kept in units of ppm (µg/g) in order to use
Equation (6.3).
Knowing the initial concentration of sodium in the feed FAME (x0), Equation (6.2)
was solved starting from the first stage and continuing until the concentration in the exiting
FAME (xN) was below the required limit of 5 ppm.
6.2.2 Counter-Current Washing
The counter-current process is depicted in Figure 6.3 with N number of stages
(Geankoplis, 2003). The crude FAME containing a high level of contaminants (F0) is
contacted with fresh water (WN+1) to produce FAME with a low level of contaminants (FN).
Figure 6.3 Counter-current multistage extraction process flow diagram.
Mass balances around each stage produce the following system of equations:
(6.4)
Substituting the equilibrium relationship, Equation (6.3), yields:
(6.5)

79
This leaves a system of nonlinear coupled equations. For small systems such as the
one presented here, the system can be solved by minimizing the global sum of squares of the
errors of the equations. This was done using the solver feature in Microsoft Excel.
6.2.3 Simulation Conditions
The conditions used for the simulations were the same as those used for the
experimental work (discussed in Section 6.3) and are shown in Table 6.1. The initial sodium
concentration of FAME Batches 6-9 (used for the experimental work) was determined by
Inductively Coupled Plasma Optical Emission Spectroscopy (ICP-OES) to be 260 ppm.
Table 6.1 Simulation conditions.
Parameter Value
Mass of FAME, F0 172 g
Mass of water, W0 40 g
Initial sodium concentration in FAME, x0 260 ppm
It should be noted that the mass of the FAME and water phases did not remain
constant for all the contacting stages for the experimental work. It was found in the first stage
that on average there was a 7% reduction in mass due to methanol removal, and each
subsequent stage experienced, on average, a 4% reduction in mass due to product loss to the
water phase. This reduction in phase mass was taken into account when solving Equations
(6.2) and (6.5). That is, the mass was not held constant in the simulations.
6.2.4 Simulation Results
For both cross-current and counter-current extraction schemes, the simulations
required two washing stages to reach the ASTM limit for sodium of 5 ppm. These results are
shown in Figure 6.4.

80
Figure 6.4 Concentration of sodium remaining in the FAME phase for the cross-current and
counter-current simulations. The inset shows a close-up at concentrations close to 5 ppm.
Because sodium has a relatively high affinity for water in comparison to FAME, a
large fraction of the sodium is removed in the first washing stage, reducing the concentration
to about 10 ppm. However, a second stage is required to bring the concentration below 5
ppm. The final concentration reached is approximately 0.8 ppm.
The performance of both washing schemes is very similar. The cross-current scheme
used a total of 80 mL of water, whereas the counter-current scheme used only 40 mL. This
represents a 50% reduction of water use, thereby making the counter-current scheme the
more efficient process.
6.3 Experimental Design
The following experiments used FAME produced from waste frying oil (Batches 6-9
combined) as described in Chapter 3, Section 3.1.2. The washing method was the same used
0
50
100
150
200
250
300
0 1 2 3Sod
ium
co
nce
ntr
atio
n in
FA
ME
ph
ase
(pp
m)
Number of stages
Cross-current Counter-current ASTM D 6751-09 Limit
0
2
4
6
8
10
12
0 1 2 3

81
in the single stage water washing experiments (described in Chapter 3, Section 3.2) in a 5:1
FAME to water volume ratio (200 mL of FAME and 40 mL of water). After each wash, the
phases were allowed to settle overnight before being separated. The conductivity of the water
phase was then measured. The degree of sodium extraction was determined using a
conductivity calibration curve determined from the single stage washing experiments (see
Chapter 3, Section 3.3.2 for calibration curve).
6.3.1 Determination of Error
The error in the conductivity measurements was determined by repeating the
measurements on separate occasions and was found to be approximately 25 μS/cm (two
standard deviations). The errors in all subsequent calculations were determined using error
propagation formulas. The error bars in all figures below represent two standard deviations,
or a confidence interval of 95%.
6.3.2 Cross-Current Washing
The cross-current washing sequence is shown in Figure 6.5. The first step involved
washing a single sample of FAME (200 mL) with fresh, deionized water (40 mL) in a
separatory funnel. After the phases were separated, the conductivity of the water phase
(W1A) was measured. The FAME was repeatedly washed each time using fresh water until
the conductivity of the used water phase was low. This indicated that the majority of the
salts, mainly sodium salts, had been removed. As seen in the results shown in Figure 6.8, five
stages were required to reduce the conductivity below 10 μS/cm.

82
Figure 6.5 Cross-current washing sequence.
The measured conductivities (κ) were used to estimate the concentration of sodium in
each of the water phases. The calibration curve, Equation (6.6), was determined using the
results from the single stage washing experiments, where κ is the conductivity (µS/cm) and
CNa in water is the concentration of sodium in the water phase (ppm).
(6.6)
The mass of sodium extracted (mNa extracted) is then equal to the change in
concentration of the water phase multiplied by the mass of the water phase (mwater):
(6.7)
For the cross-current sequence, the initial concentration was always equal to zero, therefore
the change in concentration was equal to the final concentration.
It is assumed that essentially all of the sodium was extracted from the FAME over the
five washing steps. Therefore the sum of the sodium extracted can be used to estimate the
initial mass of sodium in the FAME:

83
(6.8)
The mass of sodium remaining in the FAME phase can then be calculated at each washing
step by subtracting the amount extracted to the water phase:
(6.9)
The concentration of sodium remaining in the FAME phase can then be calculated by
dividing the mass of sodium by the mass of the FAME phase:
(6.10)
The error in each of the above calculations was determined by calculating the error
propagation using the error from the conductivity and mass measurements.
6.3.3 Counter-Current Washing
It is difficult to perform a true counter-current washing sequence on a batch-wise
laboratory scale since it requires continuous operation in order to reach steady-state.
Therefore, a laboratory scale approximation to a counter-current extraction process was
conceived. Similar experimental setups have been used before in order to test the feasibility
of a counter-current extraction process (Haque et al., 1987; Masscheleyn et al., 1996).
Referring to Figure 6.6, the counter-current washing sequence started with a cross-
current sequence. In the second series of washes, a second sample of FAME (FAME2) was
contacted with water phase W1B from the previous series. Note that the letter in the water
phase label represents the particular water phase and the number represents how many times
the water has been used. Therefore, after the first wash in Series 2, the water phase is now
labelled W2B and its new conductivity was measured. Following this wash, each of the
remaining water phases from Series 1 was re-used (W1C, W1D, and W1E) to wash FAME2
and fresh water (W1F) was used in the final fifth stage.

84
Figure 6.6 First two series of washes in the counter-current washing sequence.
This process was continued for Series 3, 4, and 5, as shown in Figure 6.7. The water
phase that was used for the first stage of Series 5 had been used 5 times. At the second stage,
the water had been used 4 times, and so on. This fifth series of experiments is assumed to
approach a counter-current washing configuration.

85
Figure 6.7 Final three series of washes in the counter-current washing sequence.
Although the process described only approximates a counter-current extraction
scheme, the reduction in water use can still be evaluated by taking into account the amount of
fresh water used for each series of washes. The water uses are shown in Table 6.2 along with
the overall water to FAME ratio. In comparison to the cross-current sequence, the counter-
current sequence reduced the water to FAME ratio from 1 to 0.36.

86
Table 6.2 Water use for each series in the counter-current washing experiments.
Series
Water
used
(mL)
Cumulative
water
used
(mL)
Cumulative
washed
FAME
(mL)
Water
to
FAME
ratio
(1) Cross-current 200 200 200 1
(2) 40 240 400 0.60
(3) 40 280 600 0.47
(4) 40 320 800 0.40
(5) Counter-current 40 360 1000 0.36
6.4 Results and Discussion
6.4.1 Conductivity of Extracted Water Phases
The measured conductivities of the extracted water phases for each series of washes
are shown in Figure 6.8.
Figure 6.8 Conductivity of water phase after contacting with FAME for each washing series.
0
200
400
600
800
1000
1200
1400
1600
1800
0 1 2 3 4 5 6
Co
nd
uct
ivit
y o
f wat
er
ph
ase
(µS/
cm)
Number of stages
(1) Cross-current
(2)
(3)
(4)
(5) Counter-current

87
For each series, the largest amount of salt impurities was removed in the first stage.
After a total of five stages, the conductivities of all the extracted water phases were below 10
μS/cm. This indicated that the concentration of salt remaining in the FAME phase was very
low, and the washing process was complete.
The five series all behaved relatively the same, except for variations in the
conductivity at the second stage. However, it is difficult to conclude with certainty whether
these variations can be attributed to the difference in washing configuration or if it is due to
experimental error. Since each series required the same number of stages to reduce the
conductivity below 10 μS/cm, the variations between the series were most likely minimal.
6.4.2 Sodium Extraction by Cross-Current Washing
The concentration of sodium remaining in the FAME phase after each washing stage
for the cross-current washing sequence is shown in Figure 6.9, along with the simulation data
from Section 6.2.
Figure 6.9 Concentration of sodium remaining in the FAME phase for the cross-current
washing sequence. The inset shows a close-up at concentrations close to 5 ppm.
0
50
100
150
200
250
300
0 1 2 3 4 5 6Sod
ium
co
nce
ntr
atio
n in
FA
ME
ph
ase
(pp
m)
Number of stages
(1) Cross-current experiment Cross-current simulation ASTM D 6751-09 Limit
0
5
10
15
20
25
30
35
40
45
0 1 2 3 4 5 6

88
The ASTM limit for sodium (combined with potassium) is 5 ppm. The data in Figure
6.9 indicates that the ASTM limit for sodium is met after three washing steps, suggesting that
the remaining two were not necessary. The error bars in Figure 6.9 are relatively large,
indicating that the data at very low concentrations were beyond the limit that could be
detected by conductivity. A sample of the FAME after the fifth wash was analyzed by ICP-
OES and found to have a sodium concentration of 1.5 ppm. This suggests that although the
absolute value of the concentration cannot be stated with absolute certainty, it is safe to
assume that almost all of the sodium was extracted after five stages.
6.4.3 Sodium Extraction by Counter-Current Washing
Figure 6.10 shows the sodium concentration remaining in the FAME phase after each
washing stage for the counter-current sequence. The simulation results are also included for
comparison.
Figure 6.10 Concentration of sodium remaining in the FAME phase for the counter-current
washing sequence. The inset shows a close-up at concentrations close to 5 ppm.
0
50
100
150
200
250
300
0 1 2 3 4 5 6Sod
ium
co
nce
ntr
atio
n in
FA
ME
ph
ase
(pp
m)
Number of stages
(5) Counter-current experiment Counter-current simulation ASTM D 6751-09 Limit
0
5
10
15
20
25
30
35
40
45
0 1 2 3 4 5 6

89
The counter-current experimental results follow the simulation results more closely
than the cross-current experiments. However, a third stage was still required to meet the
ASTM limit of 5 ppm.
6.4.4 Comparison with Simulation Results
There is a discrepancy between the number of stages predicted by the simulation and
the experimental results. The simulation predicted that the sodium would be reduced below 5
ppm after 2 stages whereas the experiments required 3 stages. A source of error could be the
extrapolation of the equilibrium curve. It is unknown how the presence of free fatty acids
(FFA) observed in Chapter 5 may affect the distribution of sodium at lower concentrations.
6.4.5 Comparison of Experimental Results
Figure 6.11 shows a comparison between the experimental results for the cross-
current (data from Figure 6.9) and counter-current washing sequences (data from Figure
6.10).
Figure 6.11 Concentration of sodium remaining in FAME phase wash for the counter-
current washing sequences. The inset shows a close-up at concentrations close to 5 ppm.
0
50
100
150
200
250
300
0 1 2 3 4 5 6Sod
ium
co
nce
ntr
atio
n in
FA
ME
ph
ase
(pp
m)
Number of stages
(1) Cross-current experiment (5) Counter-current experiment ASTM D 6751-09 Limit
0
5
10
15
20
25
30
35
40
45
0 1 2 3 4 5 6

90
The performance of the counter-current sequence is comparable to that of the cross-
current sequence while only using a fraction of the water. The overall water to FAME ratio
was reduced from 1 (200 mL of water to wash 200 mL of FAME) to 0.36 (360 mL of water
to wash 1000 mL of FAME) while still maintaining the same level of purification. This
represents a 64% reduction in water use.
6.5 Summary
FAME produced from refined vegetable oils such as canola oil does not typically
require extensive washing to reach required purification levels. In particular, the removal of
sodium can be achieved in one washing step using a FAME to water volume ratio of 5:1.
Conversely, FAME made from high FFA feedstock such as waste frying oil will require
multiple washes. FFA in the FAME will interact with sodium removal such that it cannot be
reduced to the required limit in one washing step. Therefore, the use of two multistage
extraction processes, cross- and counter-current, were investigated for the removal of sodium
from FAME made from waste oil.
The removal of sodium by cross- and counter-current water washing was simulated
using an extrapolated model from equilibrium data obtained from previous experiments. The
simulation results suggest that the sodium level can be reduced below the ASTM limit in two
cross- or counter-current washing stages. Both washing configurations performed similarly,
with the exception that the counter-current sequence used 50% less water.
The two washing configurations were also compared experimentally. The first
involved washing a 200 mL sample of FAME in a five-stage cross-current washing sequence,
using 40 mL of fresh water at each stage for an overall water to FAME volume ratio of 1.
The second configuration was an approximated counter-current washing sequence which
used 360 mL of water to wash 1000 mL of FAME, for an overall water to FAME ratio of
0.36. The results indicated that sodium was reduced to the ASTM limit after three washing
stages. The two washing sequences performed similarly, however the counter-current
sequence used only a fraction of the water. It represented a 64% reduction in the amount of
water used.
The results indicate that when purifying FAME, the use of a counter-current water
contacting scheme results in a more efficient use of water while achieving the same level of

91
purification for sodium compared to cross-current contacting. This would result in a more
concentrated wastewater stream, thereby reducing the energy load of downstream waste
treatment operations and improving the overall energy efficiency of the biodiesel production
process.
In addition, both washing schemes required the same number of stages to accomplish
the required level of purification for sodium. This indicates that the same number of
extraction units would be required and both washing schemes would have the same capital
cost.
6.6 References
ASTM Standard D6751, “Standard specification for biodiesel fuel blend stock (B100) for
middle distillate fuels,” ASTM International, West Conshohocken, PA (2009).
Frank, T. C., L. Dahuron, B. S. Holden, W. D. Prince, A. F. Selbert, and L. C. Wilson,
“Liquid-Liquid Extraction and Other Liquid-Liquid Operations and Equipment,” in “Perry's
Chemical Engineers' Handbook,” D. W. Green and R. H. Perry, Eds., McGraw-Hill
Companies, Inc., New York, NY (2008).
Geankoplis, C. J., “Transport Processes and Separation Process Principles,” Pearson
Education, Inc., Upper Saddle River, NJ (2003).
Haque, K. E., J. J. Laliberté, and J. Pruneau, “Batch and counter-current acid leaching of
uranium ore,” Hydrometallurgy 17, 229-238 (1987).
Maliszewski, T. A., D. L. Bunning, D. J. Schreck, L. A. Kapicak, and N. L. Balmer,
“Biodiesel production with reduced water emissions,” Patent No. WO 2008/091944 A2
(2008).
Masscheleyn, P. H., F. M. Tack, and M. G. Verloo, “Feasibility of a counter-current
extraction procedure for the removal of heavy metals from contaminated soils,” Water, Air,
Soil Pollut. 89, 317-335 (1996).
Predojević, Z., “The production of biodiesel from waste frying oils: A comparison of
different purification steps,” Fuel, 87, 3522-3528 (2008).

92
Chapter 7
Ion Exchange of Biodiesel Wastewater
7.1 Introduction
The wastewater from a biodiesel production plant typically contains various
components including methanol, glycerol, soap, dissolved and suspended solids, free fatty
acids (FFA), and fatty acid methyl ester (FAME or biodiesel) (Boornazian and Smith, 2008).
As seen in Table 7.1, the specific properties of the wastewater will vary from process to
process, but it will generally contain high amounts of oil and grease and a high COD
(chemical oxygen demand). It therefore may require treatment prior to discharge to a water
treatment facility. To improve the overall efficiency and reduce the negative environmental
impact, this water should be recovered and recycled back to the process.
Table 7.1 Typical properties of biodiesel wastewater.
Source pH COD
(mg/L)
BOD
(mg/L)
O&G
(mg/L)
Conductivity
(µS/cm)
Chavalparit and
Ongwandee (2009) 8.9 30,980 np 6020 350
Berrios and Skelton (2008) 6.7 18,362 np np 1119
Jaruwat et al. (2010) 9.3-10.8 312,000 168,000 18,000 np
Banerjee et al. (2009) 9 684-792 np 1433-1640 np
COD: chemical oxygen demand; BOD: biochemical oxygen demand; O&G: oil and grease
np: not provided
The recovery processes recommended in the literature include distillation and
membrane separation (Haas et al., 2006; Maliszewski et al., 2008). However, distillation
operations are energy intensive, and the complexity and variability of the wastewater could
make membrane systems difficult to use. Another option for removing ionic components
from the wastewater prior to reuse is ion exchange.
Ion exchangers are solid materials that carry exchangable cations or anions. When in
contact with an electrolyte solution, the ions on the exchanger can be exchanged with an
equivalent amount of other ions of the same charge from the solution (Helfferich, 1962). This

93
property makes ion exchange useful in wastewater treatment operations such as
demineralization, dealkalization, and water softening (Hardland, 1994).
Figure 7.1 shows the water treatment process first introduced in Chapter 4. After the
water washing step, ion exchange is used to reduce the salt content of the wastewater so that
it can be recycled back to the process. After methanol removal by distillation, the ion
exchange operation would involve the use of both cation and anion exchange resins to
remove cations and anions, respectively. The use of the two resins can either be performed
simultaneously in a mixed bed or by passing the wastewater sequentially through two
separate columns (LeVan and Carta, 2008). The cleaned water can then be recycled directly
back to the washing process. Furthermore, since ion exchange is an inherently dynamic
process, both resins would need to be regenerated periodically in an industrial operation.
Figure 7.1 Treatment of biodiesel wastewater by ion exchange for recycle.
The potential use of ion exchangers for biodiesel wastewater recovery was evaluated
in the following experiments. Biodiesel wastewater samples with known sodium
concentrations obtained from previous water washing experiments (see Chapter 5) were
contacted with a cation exchange resin in batch equilibrium experiments. The amount of
sodium removed was calculated and used to plot isotherms to characterize the performance
of the resin. The results were also compared to data obtained using prepared pure

94
water/sodium salt solutions of the same initial concentrations to determine the potential effect
of other components in the wastewater.
7.2 Ion Exchange Theory
Ion exchange resins are insoluble materials that contain exchangeable ions attached to
permanently bound functional groups of opposite charge. Most ion exchangers for
commercial applications consist of a bed of synthetic polymer beads, with particle diameters
most commonly ranging from 0.15 to 1.2 mm (Crittenden et al., 2005). In general, cation
exchange resins contain bound sulfonic acid groups and anion exchange resins contain
quaternary ammonium groups or other amino groups. The polymeric beads are usually
polystyrene cross-linked with divinylbenzene.
Figure 7.2 shows a schematic of a cation exchanger initially in the “A” form that is
placed in an electrolyte solution of ions of the “B” form, where “A” and “B” represent ions
of the same charge. Because there is a difference in concentration between the resin phase
and the solution phase, an ion exchange reaction takes place in which the ions are
redistributed by diffusion. The ion exchange resin releases replacement ions, “A”, into the
solution. To maintain electroneutrality within both the resin and solution, the “B” ions
diffuse into the resin to replace the “A” ions. This reaction is reversible and is completed
when a state of equilibrium is attained (Zagorodni, 2007).

95
Figure 7.2 Cation exchanger initially in the “A” form (left) in solution with counter ion “B”.
The counter ions are redistributed by diffusion until equilibrium is attained (right). Figure
adapted from Helfferich (1962).
The equilibrium reaction between an ion exchange resin initially in the “A” form that
is placed in an electrolyte solution with counter ion “B” is given by the following equation:
(7.1)
where and are the ions in the solution, and are the ions in the resin, and and
are the charges of ions “A” and “B”, respectively.
The concentration ratio of the two competing counter ions in the ion exchanger is
usually different from that in the solution due to the preference of the ion exchanger for one
species over the other. This concentration ratio can be expressed as the distribution
coefficient (λ) for each species:
(7.2)

96
where and are the concentrations of species i in the resin and solution, respectively.
The preference of the ion exchanger for ion “B” over ion “A” can be expressed as the
ratio of the two distribution coefficients:
(7.3)
The value in Equation (7.3) is called the separation factor. If ion “B” is preferred, ,
and if ion “A” is preferred, . The separation factor is usually not constant, but
depends on the total concentration of the solution, the temperature, and the equivalent
fraction of one of the components (Zagorodni, 2007).
The equilibrium concentrations in an ion exchange system can be represented by an
equilibrium isotherm. For adsorption or ion exchange processes5, the isotherm is a graphical
representation of the distribution of the adsorbed material between the adsorbed phase and
the solution phase at equilibrium. The basic difference between adsorption and ion exchange
is that while there is only one isotherm at a specified temperature for adsorption, more than
one isotherm can exist at a specified temperature for different normalities of the solution. The
influence of normality on the isotherm is more pronounced for the exchange of ions with
different valences (i.e., ) but is still observed for systems where the valences are
equal (i.e., ) (Barrer and Klinowski, 1974). This dependence on normality is due to
the change in preference by the ion exchanger for one species over the other. The
concentrations of ions in the external solution will affect the equilibrium in Equation (7.1).
This occurs because the two counter ions are effectively competing for binding sites on the
ion exchange resin (Rood, 1995).
Because the ion exchange reaction is reversible, the resin can be regenerated and
reused. After the resin has been exhausted such that essentially all of the useable exchange
sites are in the “B” form, the resin is contacted with a solution with a high concentration of
the “A” ion. This shifts the equilibrium in Equation (7.1) to the left side, returning the resin
to its original form. As a result, the regeneration solution will be highly concentrated with the
“B” ion.
5 Adsorption and ion exchange share many common features in regard to application as they both involve the
transfer and resulting distribution of one or more solutes between a fluid phase and particles.
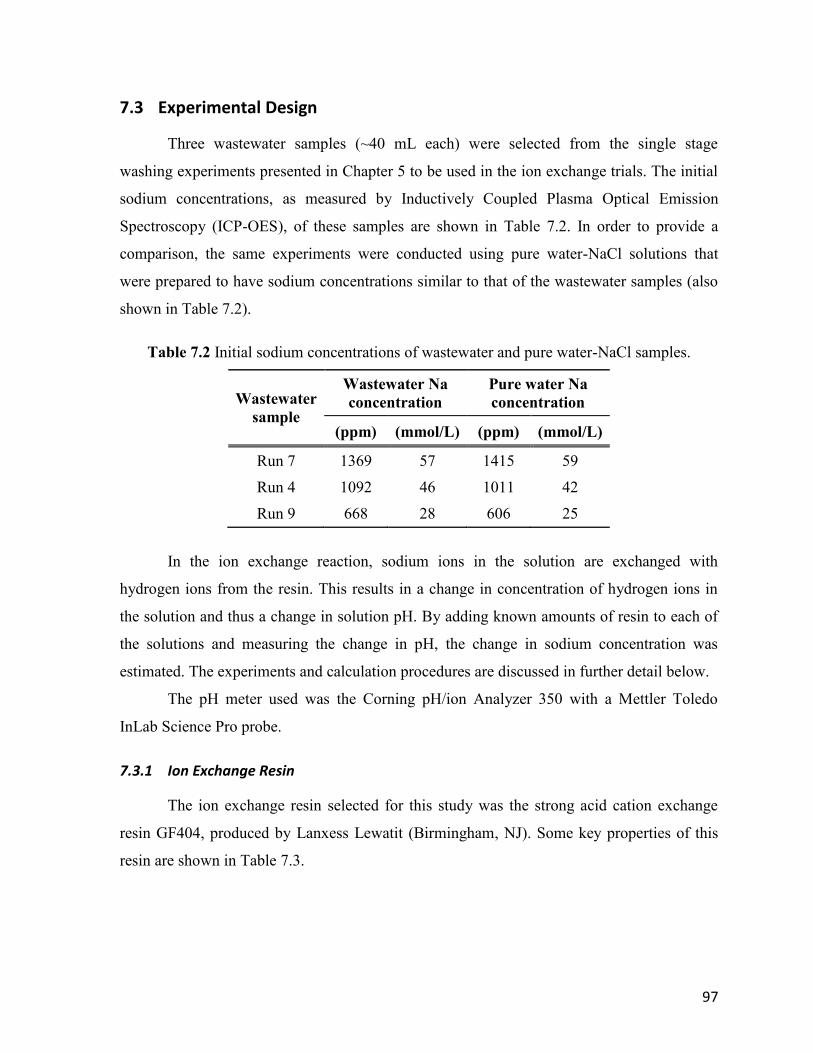
97
7.3 Experimental Design
Three wastewater samples (~40 mL each) were selected from the single stage
washing experiments presented in Chapter 5 to be used in the ion exchange trials. The initial
sodium concentrations, as measured by Inductively Coupled Plasma Optical Emission
Spectroscopy (ICP-OES), of these samples are shown in Table 7.2. In order to provide a
comparison, the same experiments were conducted using pure water-NaCl solutions that
were prepared to have sodium concentrations similar to that of the wastewater samples (also
shown in Table 7.2).
Table 7.2 Initial sodium concentrations of wastewater and pure water-NaCl samples.
Wastewater
sample
Wastewater Na
concentration
Pure water Na
concentration
(ppm) (mmol/L) (ppm) (mmol/L)
Run 7 1369 57 1415 59
Run 4 1092 46 1011 42
Run 9 668 28 606 25
In the ion exchange reaction, sodium ions in the solution are exchanged with
hydrogen ions from the resin. This results in a change in concentration of hydrogen ions in
the solution and thus a change in solution pH. By adding known amounts of resin to each of
the solutions and measuring the change in pH, the change in sodium concentration was
estimated. The experiments and calculation procedures are discussed in further detail below.
The pH meter used was the Corning pH/ion Analyzer 350 with a Mettler Toledo
InLab Science Pro probe.
7.3.1 Ion Exchange Resin
The ion exchange resin selected for this study was the strong acid cation exchange
resin GF404, produced by Lanxess Lewatit (Birmingham, NJ). Some key properties of this
resin are shown in Table 7.3.

98
Table 7.3 Properties of strong acid ion exchange resin (GF404)
Property Units Value
Ionic form as shipped - Neutral (H+)
Functional group - Sulfonic acid
Structure - Macroporous
Total capacity eq/L 1.6
mmol/g 2.16
Mean bead diameter mm 0.67
Bulk density g/L 740
Density g/mL 1.24
Although the resin was already shipped in the appropriate neutral form (i.e., in the
form of exchangeable hydrogen ions), materials as shipped by manufacturer can give
irreproducible results and it is recommended that resins be conditioned prior to testing. A
batch of resin (~100 g) was treated according to recommended regeneration procedures. This
involved washing the resin with about 250 mL of a strong acid solution (4% hydrochloric
acid) to ensure that the resin was in the neutral form (H+). The mixture was stirred for 30 min
and repeated with another 250 mL of acid. The resin was then rinsed with 250 mL of
deionized water to remove any remaining acid. The rinsing was repeated (about five times)
until the pH of the water was neutral, indicating that all of the acid had been removed.
7.3.2 Pure Water-NaCl Solutions
A known amount of resin (shown in Table 7.4) was added to approximately 20 g of
each of the three solutions of normalities 25, 42, and 59 mmol/L, as well to 20 g of deionized
water. The samples were shaken for about 10 seconds and left overnight to achieve
equilibrium. The following day, the samples were shaken again for about 10 seconds and the
pH of the water was measured.

99
Table 7.4 Amounts of resin added to the pure water-NaCl solutions.
Amount
of resin
(g)
Amount of resin
per mass of
sample (g/g)
0 0
0.1 0.005
0.25 0.0125
0.5 0.025
0.65 0.0325
0.8 0.04
1 0.05
7.3.3 Wastewater Solutions
A procedure similar to that used for the pure water-NaCl solutions was followed for
the three wastewater samples. Two samples of approximately 20 g were used for each
solution with normalities of 28, 46, and 57 mmol/L for a total of six samples.
After the initial pH of each solution was measured, approximately 0.01 g resin was
added to each of the six samples. The samples were shaken for about 10 seconds and given at
least three hours to equilibrate, shaking occasionally. After the pH was measured again,
another known amount of resin was added. The process was repeated for resin additions
ranging from 0.01 to 5 g, shown in Table 7.5. The final amount of resin added was increased
to 5 g since it was noticed from the pure water-NaCl results that 1 g was not sufficient to
completely remove the sodium. The change in mass after each pH measurement was also
recorded.

100
Table 7.5 Amounts of resin added to the wastewater solutions.
Amount
of resin
(g)
Amount of resin
per mass of
sample (g/g)
0 0
0.01 0.0005
0.1 0.005
0.25 0.0125
0.5 0.025
1 0.05
5 0.25
7.3.4 Determination of Error
The error in the pH measurement was estimated to be ±0.09 (two standard deviations)
as determined from repeated measurements. The error bars displayed in the figures in this
chapter all represent two standard deviations as calculated from error propagation equations.
7.3.5 Determination of the Change in Sodium for the Pure Water-NaCl Solutions
For the pure water-NaCl solutions, the change in sodium concentration in the water
phase was equated to the change in hydrogen ion concentration, as measured by pH:
(7.4)
where (7.5)
therefore,
(7.6)
The final sodium concentration in the water was therefore equal to the initial concentration
minus the change in concentration:
(7.7)

101
A mass balance was then used to determine the concentration in the resin phase, since
the mass of sodium lost by the water phase must equal the mass gained by the resin phase:
(7.8)
where is the mass of the sample (~20 g), is the density of water (1000 g/L),
and is the amount of resin added. represents the concentration of
sodium ions in the resin phase and has units of mmol/g.
The isotherm for each sample was then plotted using the values calculated by
Equations (7.7) and (7.8).
7.3.6 Determination of the Change in Sodium for the Wastewater Solutions
It was noticed that the wastewater samples behaved as a buffered system at low
additions of resin. This was due to the presence of FFA in the wastewater, which are weak
acids. Although the samples contained a mixture of different FFAs, oleic acid is usually
present in the highest quantity. The equilibrium relation for oleic acid is:
(7.9)
Upon addition of resin, sodium ions were exchanged with hydrogen ions, which were
released into the solution. The buffered system resisted a change in pH by shifting the
equilibrium in Equation (7.9) toward the left (i.e., toward the formation of non-ionized oleic
acid molecules). Because these hydrogen ions were bound to the FFA, they did not influence
the pH of the solution. Therefore, Equation (7.6) used to model the pure water-NaCl system
was not appropriate for the wastewater solution.
To model the wastewater system, the equilibrium of oleic acid in water was taken into
consideration. The acid dissociation constant, Ka, for the equilibrium in Equation (7.9) is
defined as:
(7.10)
Ka is often represented as:

102
(7.11)
or (7.12)
The pKa for oleic acid is 9.85 (Kanicky and Shah, 2002). It was noted that this value is larger
than that of short-chain fatty acids which have pKa values of about 4.8. As described by
Kanicky and Shah (2002), with increasing chain length, there is an increase in van der Waals
interactions between the chains of adjacent molecules. This packs the carboxylic acid groups
closer together, shielding the hydrogen atom and resulting in a higher pKa value.
The total amount of FFA in each sample was measured using the titration method
described in Chapter 3, and are shown in Table 7.6.
Table 7.6 Initial concentrations of FFA in the wastewater solutions.
Wastewater
sample
Initial Na
concentration
(mmol/L)
FFA
concentration,
C0 (mmol/L)
Run 7 57 10
Run 4 46 9.2
Run 9 28 8.2
The total concentration of FFA (C0) is equal to the sum of the ionized and non-
ionized species in the solution:
(7.13)
Substituting Equations (7.12), (7.13), along with the definition for hydrogen ion
concentration in terms of pH, Equation (7.5), into Equation (7.10) and rearranging for the
concentration of non-ionized oleic acid species gives the following expression:
(7.14)

103
When calculating the change in sodium concentration, the change in the concentration
of non-ionized oleic acid must also be taken into account since it contains bound hydrogen
ions that have been exchanged with sodium ions:
(7.15)
The concentrations of sodium in the resin and water phases were calculated using
Equations (7.7) and (7.8) for determination of the isotherms.
7.4 Results and Discussion
The pH with respect to the mass of resin per mass of sample for deionized water,
water-NaCl solutions, and wastewater solutions is shown in Figure 7.3. The initial pH
measurements for each solution are shown in Table 7.7. To distinguish the differences
between the sets of data, the same data are shown on a log scale in Figure 7.4.
Figure 7.3 pH with respect to the ratio of the mass of resin to the mass of sample.
0
1
2
3
4
5
6
7
8
9
10
0.00 0.05 0.10 0.15 0.20 0.25 0.30 0.35
pH
Mass of resin per mass of sample (g/g)
62 mmol/L 57 mmol/L (wastewater)
44 mmol/L 46 mmol/L (wastewater)
26 mmol/L 28 mmol/L (wastewater)
0 mmol/L

104
Table 7.7 Initial pH of samples prior to adding resin.
Sample
Initial Na
concentration
(mmol/L)
Initial
pH
Water-NaCl 62 8.353
Water-NaCl 44 8.538
Water-NaCl 26 8.603
Deionized water 0 5.009
Wastewater 57 8.450
Wastewater 46 8.452
Wastewater 28 8.818
Figure 7.4 pH with respect to the log of the ratio of the mass of resin to the mass of sample.
0
1
2
3
4
5
6
7
8
9
10
-4.0 -3.5 -3.0 -2.5 -2.0 -1.5 -1.0 -0.5 0.0
pH
log(mass of resin/mass of sample)
62 mmol/L 44 mmol/L 26 mmol/L
57 mmol/L (wastewater) 46 mmol/L (wastewater) 28 mmol/L (wastewater)
0 mmol/L Wastewater trend Water-NaCl trend
Deionized water trend

105
The deionized water samples showed a decrease in pH with added resin. It is possible
some hydrochloric acid remained within the pores of the resin from the regeneration process
described in Section 7.3.1. This implies that for each addition of resin, there was a
proportional amount of hydrogen ions released into the water solution that did not participate
in the exchange with sodium ions. This could have affected the results since the change in
sodium concentration was calculated using the change in pH. To determine the magnitude of
this effect, the change in hydrogen ion concentration in the water phase was calculated by
Equation (7.6) (note that the change in sodium ion concentration is equal to the change in
hydrogen ion concentration). The values for the deionized water samples along with those of
the water-NaCl solutions are shown in Figure 7.5.
Figure 7.5 Change in hydrogen ion concentration of water phase with respect to the ratio of
the mass of resin to the mass of sample for deionized water samples and water-NaCl
solutions.
Although the change in pH for the deionized water seems relatively large in Figure
7.4, the change in hydrogen ion concentration in the water phase is less significant than for
the water-NaCl solutions. This suggests that any hydrochloric acid released by the resin from
the regeneration process did not significantly impact the calculation for change in sodium.
0
5
10
15
20
25
30
35
40
45
50
0 0.01 0.02 0.03 0.04 0.05 0.06
Ch
ange
in H
+co
nce
ntr
atio
n in
wat
er
ph
ase
(mm
ol/
L)
Mass of resin per mass of sample (g/g)
62 mmol/L
44 mmol/L
26 mmol/L
0 mmol/L

106
Referring to Figure 7.4, there was a larger initial decrease in pH for the water-NaCl
solutions in comparison to the deionized water samples (see Table 7.7 for initial pH values).
This is due to the presence of sodium ions, which were exchanged with the hydrogen ions on
the resin. This exchange thus decreased the pH of the solution.
For the wastewater solutions, the initial drop in pH at low amounts of resin was not as
significant in comparison to the water-NaCl solutions (see Table 7.7 for initial pH values).
This is caused by the presence of FFA in the wastewater. Because FFA is a weak acid, it
formed a buffered system which resisted changes to pH. However, with increasing resin
additions, the buffer equilibrium reached a point where it was completely shifted toward the
formation of non-ionized FFA. After this point, the pH of the wastewater changed similarly
to that of the water-NaCl samples.
7.4.1 Sodium Removal from Water-NaCl Solutions
The equilibrium isotherms at ambient temperature for the water-NaCl solutions as
calculated by Equations (7.7) and (7.8) are shown in Figure 7.6.
Figure 7.6 Isotherms for the water-NaCl solutions at ambient temperature.
0.0
0.2
0.4
0.6
0.8
1.0
1.2
1.4
1.6
1.8
2.0
0 10 20 30 40 50 60
Na+
con
cen
trat
ion
in r
esi
n p
has
e
(mm
ol/
g)
Na+ concentration in water phase (mmol/L)
62 mmol/L
44 mmol/L
26 mmol/L

107
The variability in the concentrations was found to be larger at low concentrations of
sodium in the water phase and at high sodium concentrations in the resin phase. This is due
to the error propagation from the pH measurement, which was used to calculate the change in
sodium ion concentration with Equation (7.6). As a result, it may be more appropriate to use
other analytical techniques under these conditions. Nonetheless, the trends observed are
consistent with what is expected in ion exchange; that is, the solutions of different
normalities produced three different isotherms. This was due to the varying quantities of
hydrogen ions competing with sodium for the binding sites on the resin. With each resin
addition, more hydrogen ions were present in the solutions with higher total normalities.
Thus, there was more competition for the binding sites and the selectivity for sodium
decreased. To verify this observation, the separation factors for each data point in the
isotherm were calculated using Equation (7.3). The results are shown in Figure 7.7 with
respect to the amount of resin per sample.
Figure 7.7 Separation factors for sodium with respect to the ratio of the mass of resin to the
mass of sample.
0.0
0.1
0.2
0.3
0.4
0.5
0.6
0.7
0.8
0.9
1.0
0 0.01 0.02 0.03 0.04 0.05 0.06
Sep
arat
ion
fact
or
(αN
a+/H
+)
Mass of resin per mass of sample (g/g)
62 mmol/L
44 mmol/L
26 mmol/L

108
The general trend in Figure 7.7 shows that the preference by the resin for sodium
decreases with increasing solution normality. This supports the result in Figure 7.6 that
isotherms depended on solution normality.
The initial and final sodium concentrations along with the percent sodium removal
are shown for each solution in Table 7.8 using the data from Figure 7.6. For a resin addition
of approximately 0.05 grams per gram of solution, the percent removal of sodium ranged
from 48.4 to 66.3%. Therefore, in order to approach a lower level of sodium closer to that of
deionized water, a greater quantity of resin would be required.
Table 7.8 Percent sodium removal from water-NaCl solutions.
Initial Na
concentration
(mmol/L)
Average amount
of resin added per
gram of sample
(g/g)
Average final Na
concentration
(mmol/L)
Percent
removal
(%)
62 0.051 32 48.4
44 0.050 19 56.0
26 0.053 8.9 66.3
7.4.2 Sodium Removal from Wastewater Samples
The equilibrium isotherms at ambient temperature for the wastewater solutions as
calculated using Equations (7.15), (7.7), and (7.8) are shown in Figure 7.8. The trends for the
pure water-NaCl data from Figure 7.6 are also included for comparison.
Unfortunately, the data in Figure 7.8 are quite scattered, especially at either end of the
x-axis. Similar to the pure water-NaCl results, the error arises from using the pH
measurements to calculate the sodium removal. Additionally, the calculations for the
wastewater samples had an extra source of error from the concentration of FFA in Equation
(7.14). From the results in Chapter 5, the titration method for determination FFA
concentration was found to have a relatively high degree of error. However, these
measurements provided the best estimate of FFA concentration.

109
Figure 7.8 Isotherms for the wastewater samples at ambient temperature.
At low resin additions (i.e., at high sodium concentrations for each isotherm), the
system was in the buffered region of FFA. Therefore, the data points here are highly
dependent on the value for the pKa used in Equation (7.14). The pKa of oleic acid is 5.02
(Riddick et al., 1986), and this value was used since it is the fatty acid present in the highest
quantity. However, in reality there is a mixture of different FFAs. Due to this variability and
uncertainty of the exact value of the pKa for the wastewater, the data in the buffered region is
less reliable.
The wastewater samples had the added potential error that the resin was consecutively
added to the same sample, whereas for the pure water-NaCl solutions a new sample was used
for each amount of resin added. After each pH measurement, some sample was lost due to
wetting of the probe. Although this change in mass was measured before adding more resin,
the change may have had an effect on the equilibrium of the system, thereby providing
another source of error to the results.
0.0
0.5
1.0
1.5
2.0
2.5
3.0
3.5
-60 -40 -20 0 20 40 60 80
Na+
con
cen
trat
ion
in r
esi
n p
has
e (m
mo
l/g)
Na+ concentration in water phase (mmol/L)
57 mmol/L (wastewater)
46 mmol/L (wastewater)
28 mmol/L (wastewater)

110
Because a resin addition of about 5 g for the 20 g sample was added, the data for the
wastewater solutions extends relatively close to the origin in Figure 7.8. However, due to the
large degree of error, the exact amount of sodium removed cannot be determined from the
data. Instead, the initial and final conductivities were measured. Assuming conductivity is
proportional to concentration, the percent removal was determined, and these results are
shown in Table 7.9. Note that prior to measuring the final conductivity, an anion exchange
resin was added to each sample until the pH was neutral. This removed the excess chlorine
ions since they would also contribute to the conductivity.
Table 7.9 Percent sodium removal from wastewater samples.
Sample
Initial Na
concentration
(mmol/L)
Initial
Conductivity
(μS/cm)
Resin added
per gram of
sample (g/g)
Final
Conductivity
(μS/cm)
Percent
removal
(%)
1 57 3000 0.19 863 71.2
2 57 3000 0.22 340 88.7
4 46 2360 0.29 192 91.9
5 28 1440 0.29 171 88.1
6 28 1440 0.23 128 91.1
Results for sample 3 were not possible due to a spill.
In comparison to the pure water-NaCl solutions, the wastewater contained other
components such as oil compounds, methanol, and glycerol. The presence of these
compounds did not seem to have a pronounced effect on the sodium removal efficiency by
ion exchange since the results are similar to that of the pure water-NaCl solutions. In fact,
because the solution became more acidic with each addition of resin, the equilibrium of FFA
in Equation (7.9) was shifted to the left side, or to the formation of non-ionized FFA which is
not soluble in water. This created a more distinct interface between the oil and water in the
wastewater, which may make separation of the two phases easier in an industrial operation.
The percent sodium removal ranged from 71.2 to 91.9% for the wastewater solutions.
This indicates that the majority of sodium can be removed from solutions in this range of
initial concentrations by adding between approximately 0.2 and 0.3 grams of resin per gram
of solution.

111
7.5 Summary
The ability of a cation exchange resin to remove sodium ions from biodiesel
wastewater was evaluated by adding known amounts of resin to samples and measuring the
change in pH. The results were compared to pure water-NaCl solutions of similar sodium
concentrations.
For the pure-water NaCl solutions, three separate isotherms were determined for three
solutions with normalities of 26, 44, and 62 mmol/L. The results suggested that selectivity by
the resin for the sodium ion over the hydrogen ion decreased with increasing normality. By
adding approximately 0.05 grams of resin per gram of solution, the percent of sodium
removed was 66.3, 56.0, and 48.4% from the 26, 44, and 62 mmol/L solutions, respectively.
For the wastewater solutions, the data calculated from pH measurements were found
to be less reliable at low amounts of resin (or high concentrations in the water phase) due to
the creation of a buffered system by the presence of FFA. Outside the buffering capability of
FFA, the data was found to follow that of the pure water-NaCl solutions more closely. This
indicates that ion exchange resins can be effectively used to remove sodium ions from the
wastewater, and the behaviour of the system tends to follow that of a purely aqueous system.
For the wastewater solutions, the percent of sodium removed ranged between 71.2 to 91.9%
by adding between 0.2 and 0.3 grams of resin per gram of solution.
The results verify that an ion exchange resin can effectively remove sodium ions from
wastewater solutions in a batch contacting process. In an industrial setting, the contacting
would be performed in a column containing a bed of cation exchange resin followed by a
column containing anion exchange resin, or the two resins can be combined in a mixed bed
operation. Therefore, the next step for investigation would be to conduct experiments in a
column operation and also include the removal of anion contaminants such as chloride and
sulphate ions.
Another area of investigation would involve the effect of other components in the
wastewater. It is promising that the wastewater and pure water systems were found to behave
similarly on a small scale batch process. However, on a larger scale operation, non-ionic
components, such as FFA, methanol, and glycerol, could potentially interact with the ion
exchange process by blocking the resin pores and thereby reducing performance.

112
Determining the effect of these non-ionic components on the long term operability of the
resin is therefore an important next step.
Once these issues have been addressed and long term column operability has been
demonstrated, the process presented in Figure 7.1 could prove to be an effective and energy
efficient way to recover biodiesel wastewater for reuse.
7.6 References
Barrer, R. M. and J. Klinowski, “Ion-exchange selectivity and electrolyte concentration,” J.
Chem. Soc. Farad. T. 1, 70, 2080-2091 (1974).
Boornazian, L. Y. and M. T. Smith, “Applicability of Effluent Guidelines and Categorical
Pretreatment Standards to Biodiesel Manufacturing,” United States Environmental Protection
Agency, Office of Water Management, Washington, D.C. (2008).
Crittenden, J. C., R. R. Trussell, D. W. Hand, K. J. Howe, and G. Tchobanoglous, “Water
Treatment: Principles and Design,” John Wiley & Sons, Inc., Hoboken, NJ (2005).
Haas, M. J., A. J. McAloon, W. C. Yee, and T. A. Foglia, “A process model to estimate
biodiesel production costs,” Bioresource Technol. 97, 671-678 (2006).
Harland, C. E., “Ion Exchange: Theory and Practice,” The Royal Society of Chemistry,
Cambridge, UK (1994).
Helfferich, F., “Ion Exchange,” McGraw-Hill Book Company Inc., New York, NY (1962).
LeVan, M. D., G. Carta, “Adsorption and Ion Exchange,” in “Perry’s Chemical Engineers’
Handbook,” D. W. Green and R. H. Perry, Eds., McGraw-Hill Companies, Inc., New York,
NY (2008).
Maliszewski, T. A., D. L. Bunning, D. J. Schreck, L. A. Kapicak, and N. L. Balmer,
“Biodiesel production with reduced water emissions,” Patent No. WO 2008/091944 A2
(2008).
Riddick, J. A., W. B. Bunger, T. K. Sakano, and A. Weissberger, “Organic Solvents:
Physical Properties and Methods of Purification,” Wiley, New York, NY (1986).
Rood, D., “The Use of Solid Phase Extraction for Environmental Samples,” in “Quality
Assurance in Environmental Monitoring: Instrumental Methods,” G. Subramanian, Ed., VCH
Publishers, New York, NY (1995).
Zagorodni, A. A., “Ion Exchange Materials: Properties and Applications,” Elsevier,
Amsterdam, The Netherlands (2007).

113
Chapter 8
Conclusions and Recommendations
There is increasing global concern surrounding the depletion of fossil fuel resources
and the impact that their combustion has on the environment. Renewable fuels, such as
biodiesel, are therefore receiving increased attention as potential alternatives. Unfortunately,
biodiesel production requires the use of large amounts of water for purification, especially
when the biodiesel is produced from waste feedstocks such as used frying oils. This reduces
the overall energy efficiency of biodiesel since wastewater treatment is typically achieved
through distillation, which requires large amounts of energy.
In this thesis, the effect of the amount of water and the choice of water treatment
options in biodiesel production was investigated. In addition, the removal of sodium from
crude biodiesel (i.e., fatty acid methyl ester or FAME) was studied in both single stage and
multistage washing configurations. Preliminary results for an alternative water treatment
process involving the use of ion exchange resins were also presented. The main conclusions
from these studies are stated below. Recommendations for future work are also discussed.
8.1 Conclusions
8.1.1 Chapter 4 – Simulation of Biodiesel Wastewater Treatment Processes
The purification of biodiesel by water washing was simulated using Aspen HYSYS
simulation software. A comparison was made between conventional wastewater treatment by
distillation and the use of ion exchange resins. Typically, about one litre of wastewater is
generated per litre of biodiesel produced. Under these conditions, 3.12 MJ of energy are
required to purify the wastewater per litre of biodiesel using distillation. An alternative
process using ion exchange resins to treat the wastewater was estimated to require only
0.978 MJ of energy per litre of biodiesel. This represented an energy reduction of 69% in
comparison to distillation. These results indicate that ion exchange has the potential to be
used to improve the efficiency of the wastewater treatment process.
The effect of the amount of water used on the energy requirements was also
evaluated. In both processes, the energy required was shown to decrease linearly with

114
decreasing amount of water used in the washing step. This showed that reducing the amount
of water can result in capital cost savings and also improve the overall energy efficiency of
the process.
8.1.2 Chapter 5 – Sodium Distribution between Water and FAME Phases
The removal of sodium from crude FAME was investigated. FAME derived from
both refined canola oil (low free fatty acid (FFA) feedstock) and used frying oil (high FFA
feedstock) were washed in a single water washing step in a 5:1 FAME to water volume ratio.
For the canola oil derived FAME, the required specification for sodium content of <5 ppm
was met with one washing step. The distribution coefficient was found to be high and ranged
from approximately 238 to 1363.
On the contrary, multiple washing stages would be necessary for the waste oil derived
FAME to meet the 5 ppm specification. The FAME contained 0.36 wt% FFA which was
found to interfere with sodium removal. Soap was found to accumulate at the interface
between the FAME and water phases. This lowered the distribution coefficient in comparison
to the canola oil derived FAME, and was found to range between approximately 72 and 93.
Because FFA was shown to interfere with sodium removal, it is important to ensure
the concentration of FFA is as low as possible. This requires that the acid esterification pre-
treatment reaction proceeds as close to completion as possible and that water is removed
prior to the transesterification reaction. Another option is to remove the interface layer that is
formed between the two phases. Unfortunately, this would result in product loss.
8.1.3 Chapter 6 – Counter-Current Washing of Waste Oil Derived FAME
It was found that multiple washing steps would be required to reduce the sodium
concentration in waste oil derived FAME within required specifications. Therefore, two
multi-stage contacting schemes were compared: cross- and counter-current. The required
limit of sodium was achieved within three water washing steps. The two washing
configurations behaved similarly, however the counter-current sequence required only a
fraction of the water. This represented a 64% reduction in the amount of water used.
The results suggest that using a counter-current contacting scheme can still achieve
the same level of purification for sodium while using the water more efficiently. As a result,

115
a more concentrated wastewater stream is produced which reduces the load on downstream
waste treatment operations. Therefore, if multiple washing stages are required, it should be
completed in a counter-current washing configuration to reduce the amount of wastewater
produced. Reducing the amount of water was seen to have a strong positive impact on the
energy required by downstream treatment operations.
8.1.4 Chapter 7 – Ion Exchange of Biodiesel Wastewater
The removal of sodium from biodiesel wastewater samples by ion exchange was
evaluated for three different initial sodium concentrations. Percent removal ranged between
71 and 92% for the three solutions when adding between 0.2 and 0.3 grams of resin per gram
of solution. Preliminary results indicated that the purification was not affected by the
presence of other compounds in the wastewater.
8.2 Recommendations
Because distillation is an energy intensive process, other water treatment options
should be further investigated to help improve the energy efficiency of the biodiesel
purification process. The preliminary work presented in this thesis shows that ion exchange is
a viable alternative to distillation. Further work would be required to verify that the ion
exchange resin can effectively and efficiently remove salt impurities in a conventional
column operation and in the presence of other impurities. Also, the limit to which glycerol
can be allowed to accumulate in the recycle stream, since it is not removed by the ion
exchange resin, must also be determined.
When reviewing the literature on water washing, it can be seen that there is a large
variability in the water washing conditions used to purify various qualities of FAME. In this
work, a FAME to water volume ratio of 5:1 was chosen based on the results of previous
studies. For the waste oil derived FAME, it was found that three washing stages were
required to purify the FAME using this water to FAME ratio. However, it is unknown if the
amount of water used could be further reduced using other washing conditions. This presents
an opportunity to optimize the washing process based on the level of contaminants (i.e., FFA,
methanol, glycerol, sodium, etc.) present in the crude FAME. Knowing the best washing

116
ratio and number of washes required could help biodiesel producers achieve the required
standards, while minimizing the amount of wastewater produced.

117
Appendix A
Raw Data
A.1 Wastewater Treatment Process Simulations
Table A.1 Simulation data for design of distillation column T-102 for water treatment by
distillation process (Figure 4.1).
Water to FAME volume ratio (m
3/m
3)
1.0 0.8 0.6 0.4 0.2 0.1
Mass flow of Water wash stream (kg/h) 1154 914 694 454 234 114
Mole fraction of methanol in feed to T-102 0.0534 0.0668 0.0867 0.1287 0.2323 0.4158
Vapour-liquid distribution coefficient, Kwater 0.965 0.957 0.945 0.921 0.865 0.763
Vapour-liquid distribution coefficient,
Kmethanol 6.65 6.40 6.04 5.37 4.16 3.02
Relative volatility of feed stream, αF 6.89 6.69 6.40 5.83 4.81 3.96
Relative volatility of distillate, αD 2.48 2.48 2.48 2.48 2.48 2.48
Relative volatility of bottoms, αB 7.75 7.75 7.75 7.75 7.75 7.75
Average relative volatility, αaverage 5.10 5.04 4.97 4.82 4.52 4.24
Minimum number of stages, Nmin 8 8 8 9 9 9
Number of stages, N 16 17 17 17 18 19
Reflux ratio, R 24.6 19.5 14.9 9.67 4.95 2.32
Table A.2 Energy stream data for water treatment by distillation process (Figure 4.1).
Water to FAME volume ratio (m
3/m
3)
1.0 0.8 0.6 0.4 0.2 0.1
Heating streams
T-101 Reboiler energy stream, R1 (kW) 852.9 681.7 524.6 353.1 196.3 110.7
T-102 Reboiler energy stream, R2 (kW) 137.2 114.5 92.46 62.98 38.36 23.39
Cooling streams
Cooling stream, E1 (kW) 91.14 71.78 54.03 34.63 16.91 7.166
Cooling stream, E2 (kW) 13.49 10.62 7.994 5.109 2.43 0.9004
T-102 Condenser energy stream, C2 (kW) 879.7 706.9 547.1 367.2 204.7 114.3

118
Table A.3 Simulation data for design of ion exchange operation for water treatment by ion
exchange process (Figure 4.2).
Water to FAME volume ratio (m
3/m
3)
1.0 0.8 0.6 0.4 0.2 0.1
Volume flow of wastewater fed to
ion exchange operation (L/h) 1138 897.8 657.4 437.1 216.7 96.4
Water treated by SAC
(L water/L resin) 155.4 122.6 89.8 59.7 29.6 13.2
Water treated by SBA
(L water/L resin) 86.32 68.10 49.87 33.16 16.44 7.31
Regenerant solution for SAC
(L regenerant/L resin) 1.477 1.477 1.477 1.477 1.477 1.477
Regenerant solution for SBA
(L regenerant/L resin) 1.543 1.543 1.543 1.543 1.543 1.543
Wastewater effluent for SAC (L/h) 36.45 36.45 36.45 36.45 36.45 36.45
Wastewater effluent for SBA (L/h) 79.63 79.63 79.63 79.63 79.63 79.63
Total wastewater effluent (L/h) 116.1 116.1 116.1 116.1 116.1 116.1
Table A.4 Energy stream data for water treatment by ion exchange process (Figure 4.2).
Water to FAME volume ratio (m
3/m
3)
1.0 0.8 0.6 0.4 0.2 0.1
Heating streams
T-101 Reboiler energy stream, R1 (kW) 51.13 51.13 51.13 51.13 51.13 51.13
T-102 Reboiler energy stream, R2 (kW) 176.4 176.4 176.4 176.4 176.4 176.4
Ion exchange effluent (kW) 82.73 82.73 82.73 82.73 82.73 82.73
Cooling streams
Cooling stream, E1 (kW) 96.55 96.55 96.55 96.55 96.55 96.55
T-102 Condenser energy stream, C2 (kW) 75.33 75.33 75.33 75.33 75.33 75.33

119
A.2 Single Stage Washing Experiments
Table A.5 Raw data from single stage washing of canola oil derived FAME.
Run FAME
Batches
Initial mass
of FAME
phase (g)
Initial mass
of water
phase (g)
Initial concentration
of Na2SO4 in water
phase (ppm)
Initial concentration
of Na in water phase
(ppm)
1 1-7 175.73 39.64 0 0
10 8-12 175.37 40.09 0 0
2 1-7 174.72 40.09 50 16.2
6 1-7 175.77 39.83 50 16.3
3 1-7 174.85 40.36 99 32.1
5 1-7 175.21 40.01 200 64.7
4 1-7 174.54 39.79 402 130
7 1-7 175.38 40.04 1001 324
8 1-7 175.03 40.49 1980 641
11 8-12 174.33 40.52 1984 642
9 1-7 174.05 40.51 2975 963
Table A.5 Raw data from single stage washing of canola oil derived FAME (continued).
Run
Conductivity
before washing
(µS/cm)
Conductivity
after washing
(µS/cm)
Final concentration
of Na in water phase
by ICP-OES (ppm)
Final concentration of
Na in FAME phase by
ICP-OES (ppm)
1 0 1070 396 1.54
10 0 1057 308 1.41
2 83.9 1187 595 1.32
6 85.7 1295 396 1.79
3 159 1208 475 1.19
5 321 1299 515 1.28
4 624 1636 458 1.62
7 1491 2392 645 1.91
8 2752 3316 927 2.36
11 2714 3323 935 0.320
9 3945 4332 1293 0.949

120
Table A.6 Raw data from single stage washing of waste oil derived FAME.
Run
Initial
mass of
FAME
phase (g)
Initial
mass of
water
phase (g)
Initial
concentration of
NaCl in water
phase (ppm)
Initial
concentration
of Na in water
phase (ppm)
Mass of
FAME
phase after
washing (g)
Mass of
water phase
after
washing (g)
1 173.56 40.05 0 0 156.52 54.83
9 171.60 40.63 0 0 161.97 47.83
2 171.71 40.04 510 201 164.38 44.83
3 172.31 40.06 1020 401 160.60 49.53
8 172.71 40.12 1503 591 157.79 53.03
4 172.54 40.11 1536 604 159.08 51.20
6 171.63 40.07 2035 801 160.87 48.79
5 172.86 40.07 2037 802 159.90 50.62
7 172.12 40.07 2545 1001 157.20 53.34
Table A.6 Raw data from single stage washing of waste oil derived FAME (continued).
Run
Conductivity
before
washing
(µS/cm)
Conductivity
after
washing
(µS/cm)
Final
concentration of
Na in water phase
by ICP-OES (ppm)
Final
concentration of
Na in FAME phase
by ICP-OES (ppm)
1 10.1 2520 1199 12.5
9 11.2 1440 668 nm
2 832 1730 825 10.7
3 1630 2030 984 12.2
8 2290 2520 1140 24.1
4 2410 2360 1092 16.2
6 3130 1630 740 10.2
5 3160 2680 1216 13.4
7 3910 3000 1369 15.0
nm: not measured
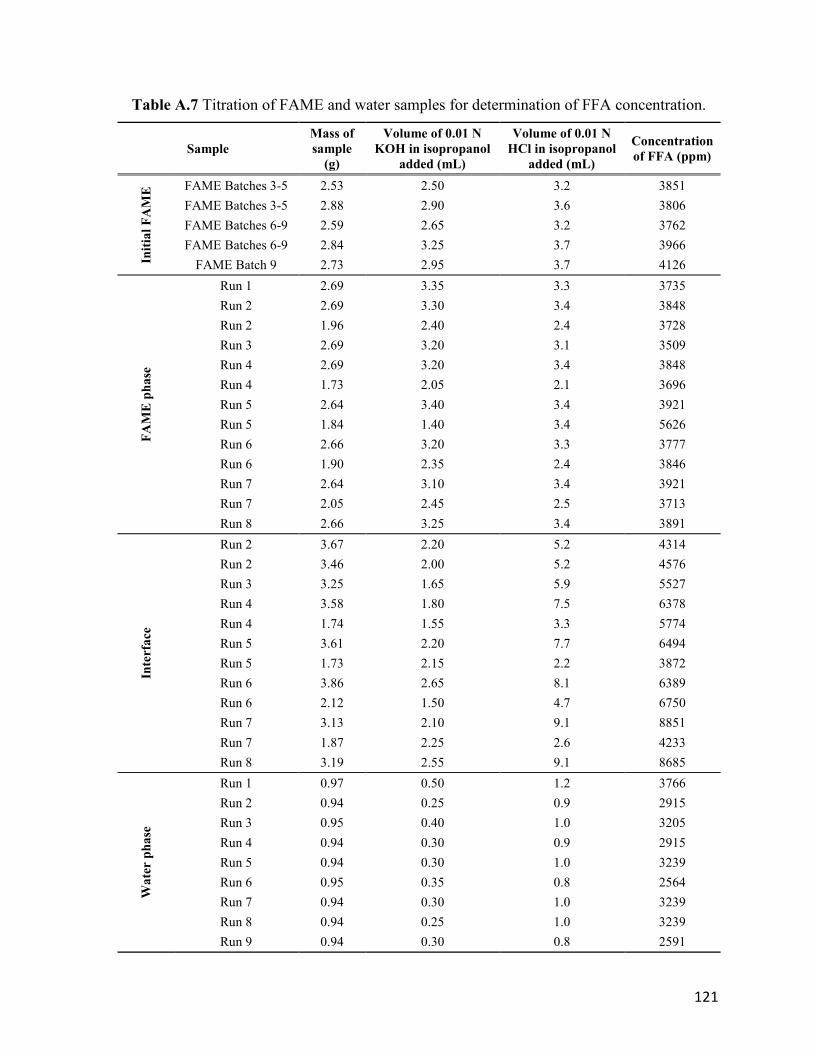
121
Table A.7 Titration of FAME and water samples for determination of FFA concentration.
Sample
Mass of
sample
(g)
Volume of 0.01 N
KOH in isopropanol
added (mL)
Volume of 0.01 N
HCl in isopropanol
added (mL)
Concentration
of FFA (ppm) In
itia
l F
AM
E FAME Batches 3-5 2.53 2.50 3.2 3851
FAME Batches 3-5 2.88 2.90 3.6 3806
FAME Batches 6-9 2.59 2.65 3.2 3762
FAME Batches 6-9 2.84 3.25 3.7 3966
FAME Batch 9 2.73 2.95 3.7 4126
FA
ME
ph
ase
Run 1 2.69 3.35 3.3 3735
Run 2 2.69 3.30 3.4 3848
Run 2 1.96 2.40 2.4 3728
Run 3 2.69 3.20 3.1 3509
Run 4 2.69 3.20 3.4 3848
Run 4 1.73 2.05 2.1 3696
Run 5 2.64 3.40 3.4 3921
Run 5 1.84 1.40 3.4 5626
Run 6 2.66 3.20 3.3 3777
Run 6 1.90 2.35 2.4 3846
Run 7 2.64 3.10 3.4 3921
Run 7 2.05 2.45 2.5 3713
Run 8 2.66 3.25 3.4 3891
Inte
rfa
ce
Run 2 3.67 2.20 5.2 4314
Run 2 3.46 2.00 5.2 4576
Run 3 3.25 1.65 5.9 5527
Run 4 3.58 1.80 7.5 6378
Run 4 1.74 1.55 3.3 5774
Run 5 3.61 2.20 7.7 6494
Run 5 1.73 2.15 2.2 3872
Run 6 3.86 2.65 8.1 6389
Run 6 2.12 1.50 4.7 6750
Run 7 3.13 2.10 9.1 8851
Run 7 1.87 2.25 2.6 4233
Run 8 3.19 2.55 9.1 8685
Wa
ter p
ha
se
Run 1 0.97 0.50 1.2 3766
Run 2 0.94 0.25 0.9 2915
Run 3 0.95 0.40 1.0 3205
Run 4 0.94 0.30 0.9 2915
Run 5 0.94 0.30 1.0 3239
Run 6 0.95 0.35 0.8 2564
Run 7 0.94 0.30 1.0 3239
Run 8 0.94 0.25 1.0 3239
Run 9 0.94 0.30 0.8 2591

122
A.3 Counter-Current Washing Experiments
Table A.8 Raw data from counter-current washing of waste oil derived FAME.
Series
FAME
sample
name
Water
sample
name
Initial
mass of
FAME
phase
(g)
Initial
mass of
water
phase
(g)
Conductivity
of water
phase before
washing
(µS/cm)
Mass of
water phase
after
washing (g)
Conductivity
of water
phase after
washing
(µS/cm)
Final
mass of
FAME
phase
(g)
1 FAME1 W1A 171.6 39.9 11.2 47.8 1440
W1B
40.7 9.50 41.3 553
W1C
39.8 1.62 44.6 149
W1D
40.5 nm 39.4 14.2
W1E
40.7 2.38 39.7 7.42 145.6
2 FAME2 W2B 170.8 42.4 562 52.4 1660
W2C
42.4 202 44.4 434
W2D
36.7 nm 35.4 43.2
W2E
38.2 nm 38.0 13.9
W1F
41.6 0.930 39.3 6.01
na
6
42.1 1.06 40.5 8.31 133.4
3 FAME3 W3C 173.1 41.2 nm 43.4 1620
W3D
33.5 100 34.4 341
W3E
36.3 nm 35.5 44.3
W2F
40.1 9.78 40.3 25.9
W1G
37.9 1.50 37.8 8.85 127.5
4 FAME4 W4D 174.3 40.7 404 45.9 1560
W4E
40.0 37.2 41.8 221
W3F
40.1 23.3 38.8 81.2
W2G
38.2 nm 37.7 23.8
W1H
40.6 1.24 39.2 8.41 118.0
5 FAME5 W5E 178.7 39.7 nm 54.8 1650
W4F
40.1 75.4 41.4 238
W3G
38.4 21.5 37.8 68.4
W2H
40.1 8.10 38.9 37.2
W1I 41.2 2.04 40.4 8.24 154.3
nm: not measured
na: not applicable
6 A sixth wash of FAME2 was conducted to verify that the conductivity of the extracted phase was at a
minimum.

123
A.4 Ion Exchange Experiments
Table A.9 Raw data for ion exchange of deionized water samples.
Sample Sample
mass (g)
Mass of added
resin (g)
Resin per
sample (g/g)
Initial
pH
Final
pH
1 14.404 0.000 0 5.009 5.009
2 20.743 0.008 0.0004 5.009 4.783
8 20.645 0.010 0.0005 5.009 5.087
14 21.161 0.050 0.0024 5.009 4.225
15 20.821 0.063 0.0030 5.009 4.316
3 21.762 0.128 0.0059 5.009 4.096
9 20.348 0.147 0.0072 5.009 4.019
16 20.741 0.204 0.0098 5.009 3.624
10 20.445 0.299 0.0146 5.009 3.617
4 20.766 0.312 0.0150 5.009 3.701
17 21.254 0.399 0.0188 5.009 3.295
5 20.294 0.443 0.0218 5.009 3.509
11 21.330 0.482 0.0226 5.009 3.593
18 20.336 0.771 0.0379 5.009 3.026
6 20.261 0.974 0.0481 5.009 3.177
12 21.767 1.087 0.0499 5.009 2.918
13 21.215 3.063 0.1444 5.009 2.510
7 21.259 3.283 0.1544 5.009 2.676

124
Table A.10 Raw data from ion exchange of pure water-NaCl samples.
Sample Initial Na concentration
(mmol/L)
Sample
mass (g)
Mass of added
resin (g)
Resin per
sample (g/g)
Initial
pH
Final
pH
58 26.3 19.579 0 0 8.603 8.603
1 26.4 22.083 0 0 8.603 8.603
60 26.3 19.846 0.008 0.0004 8.603 3.324
59 26.3 19.754 0.010 0.0005 5.664 3.868
61 26.3 19.785 0.024 0.0012 8.603 2.867
40 26.4 19.677 0.107 0.0054 8.603 2.211
2 26.4 20.723 0.123 0.0059 8.603 2.147
63 26.3 19.823 0.120 0.0061 5.664 3.323
22 26.4 19.764 0.127 0.0064 8.603 2.166
64 26.3 19.814 0.145 0.0073 5.664 2.342
62 26.3 19.704 0.187 0.0095 5.664 2.170
23 26.4 19.716 0.253 0.0128 8.603 1.959
41 26.4 18.980 0.255 0.0134 8.603 1.959
3 26.4 19.579 0.317 0.0162 8.603 1.880
42 26.4 19.673 0.517 0.0263 8.603 1.837
24 26.4 19.484 0.518 0.0266 8.603 1.828
4 26.4 19.621 0.549 0.0280 8.603 1.791
5 26.4 19.851 0.667 0.0336 8.603 1.772
25 26.4 19.344 0.659 0.0341 8.603 1.791
43 26.4 19.932 0.680 0.0341 8.603 1.806
44 26.4 20.027 0.793 0.0396 8.603 1.795
6 26.4 19.857 0.791 0.0398 8.603 1.752
26 26.4 19.859 0.801 0.0403 8.603 1.778
27 26.4 20.003 1.020 0.0510 8.603 1.761
7 26.4 19.809 1.029 0.0519 8.603 1.742
45 26.4 19.740 1.098 0.0556 8.603 1.769
8 44.0 19.703 0 0 8.538 8.538
28 44.0 19.736 0.094 0.0048 8.538 2.224
46 44.0 19.839 0.116 0.0058 8.538 2.165
9 44.0 19.748 0.132 0.0067 8.538 2.101
29 44.0 19.110 0.226 0.0118 8.538 1.919
10 44.0 19.736 0.235 0.0119 8.538 1.888
47 44.0 19.814 0.261 0.0132 8.538 1.910
48 44.0 19.783 0.505 0.0255 8.538 1.739

125
Table A.10 Raw data from ion exchange of pure water-NaCl samples (continued).
Sample Initial Na concentration
(mmol/L)
Sample
mass (g)
Mass of added
resin (g)
Resin per
sample (g/g)
Initial
pH
Final
pH
30 44.0 19.738 0.540 0.0274 8.538 1.700
11 44.0 19.217 0.549 0.0286 8.538 1.669
49 44.0 19.761 0.660 0.0334 8.538 1.685
31 44.0 19.829 0.683 0.0344 8.538 1.659
12 44.0 19.664 0.682 0.0347 8.538 1.646
32 44.0 19.783 0.808 0.0408 8.538 1.637
50 44.0 19.847 0.811 0.0409 8.538 1.654
13 44.0 19.745 0.816 0.0413 8.538 1.610
51 44.0 19.818 0.929 0.0469 8.538 1.636
14 44.0 19.600 0.983 0.0502 8.538 1.590
33 44.0 19.573 1.021 0.0522 8.538 1.601
15 61.6 19.696 0 0 8.353 8.353
65 61.6 6.350 0 0 8.353 8.353
66 61.6 19.872 0.008 0.0004 8.353 3.382
67 61.6 19.924 0.020 0.0010 8.353 3.460
34 61.6 20.147 0.115 0.0057 8.353 2.133
16 61.6 19.885 0.114 0.0057 8.353 2.133
52 61.6 19.932 0.139 0.0070 8.353 2.102
68 61.6 19.936 0.186 0.0093 8.353 2.159
53 61.6 19.956 0.240 0.0120 8.353 1.928
35 61.6 20.085 0.245 0.0122 8.353 1.887
17 61.6 20.056 0.266 0.0133 8.353 1.846
36 61.6 20.102 0.462 0.0230 8.353 1.693
54 61.6 20.141 0.504 0.0250 8.353 1.715
18 61.6 20.065 0.538 0.0268 8.353 1.640
37 61.6 20.096 0.653 0.0325 8.353 1.608
55 61.6 20.004 0.654 0.0327 8.353 1.630
19 61.6 19.977 0.694 0.0347 8.353 1.567
20 61.6 20.134 0.785 0.0390 8.353 1.557
56 61.6 19.957 0.796 0.0399 8.353 1.588
38 61.6 20.090 0.863 0.0430 8.353 1.557
57 61.6 19.954 1.003 0.0503 8.353 1.547
21 61.6 20.072 1.035 0.0516 8.353 1.504
39 61.6 20.180 1.047 0.0519 8.353 1.528

126
Table A.11 Raw data from ion exchange of wastewater samples.
Sample
Initial Na
concentration
(mmol/L)
Sample
mass
(g)
Mass of
added
resin (g)
Resin per
sample
(g/g)
Initial
pH
Final
pH
1 57.2 20.000 0 0 8.450 8.450
1 57.2 20.376 0.009 0.0004 8.450 8.168
1 57.2 20.350 0.130 0.0064 8.450 2.461
1 57.2 20.279 0.251 0.0124 8.450 2.099
1 57.2 20.730 0.490 0.0236 8.450 1.713
1 57.2 20.664 1.013 0.0490 8.450 1.375
1 57.2 20.567 3.886 0.1889 8.450 1.186
2 57.2 20.215 0.008 0.0004 8.450 8.179
2 57.2 20.185 0.122 0.0060 8.450 2.559
2 57.2 20.151 0.251 0.0125 8.450 2.031
2 57.2 20.068 0.502 0.0250 8.450 1.721
2 57.2 19.983 1.019 0.0510 8.450 1.574
2 57.2 19.853 4.445 0.2239 8.450 1.377
3 45.6 20.000 0 0 8.452 8.452
3 45.6 18.533 0.016 0.0009 8.452 7.442
3 45.6 18.479 0.103 0.0056 8.452 2.610
3 45.6 18.454 0.248 0.0134 8.452 2.046
3 45.6 18.387 0.486 0.0264 8.452 1.748
4 45.6 18.175 0.020 0.0011 8.452 7.108
4 45.6 18.151 0.098 0.0054 8.452 2.692
4 45.6 18.113 0.261 0.0144 8.452 2.025
4 45.6 18.030 0.501 0.0278 8.452 1.766
4 45.6 17.935 0.998 0.0556 8.452 1.535
4 45.6 17.815 5.250 0.2947 8.452 1.479

127
Table A.11 Raw data from ion exchange of wastewater samples (continued).
Sample
Initial Na
concentration
(mmol/L)
Sample
mass
(g)
Mass of
added
resin (g)
Resin per
sample
(g/g)
Initial
pH
Final
pH
5 27.9 20.000 0 0 8.818 8.818
5 27.9 18.973 0.020 0.0011 8.818 6.875
5 27.9 18.922 0.131 0.0069 8.818 2.348
5 27.9 19.056 0.275 0.0144 8.818 1.922
5 27.9 18.973 0.514 0.0271 8.818 1.738
5 27.9 18.891 1.013 0.0536 8.818 1.600
5 27.9 18.791 5.366 0.2856 8.818 1.501
6 27.9 19.675 0.008 0.0004 8.818 8.109
6 27.9 19.630 0.107 0.0055 8.818 2.477
6 27.9 19.585 0.242 0.0124 8.818 2.039
6 27.9 19.499 0.495 0.0254 8.818 1.856
6 27.9 19.433 1.073 0.0552 8.818 1.722
6 27.9 19.348 4.430 0.2290 8.818 1.698