energy and the new reality, volume 2: c-free energy supply chapter 6: hydro-electric power l. d....
TRANSCRIPT

Energy and the New Reality, Volume 2:
C-Free Energy Supply
Chapter 6: Hydro-electric power
L. D. Danny [email protected]
This material is intended for use in lectures, presentations and as handouts to students, and is provided in Powerpoint format so as to allow customization for the individual needs of course instructors. Permission of the author and publisher is required for any other usage. Please see www.earthscan.co.uk for contact details.
Publisher: Earthscan, UKHomepage: www.earthscan.co.uk/?tabid=101808

Kinds of hydro-power
• Run-of-the-river (no reservoirs)
• Reservoir-based
Power production:
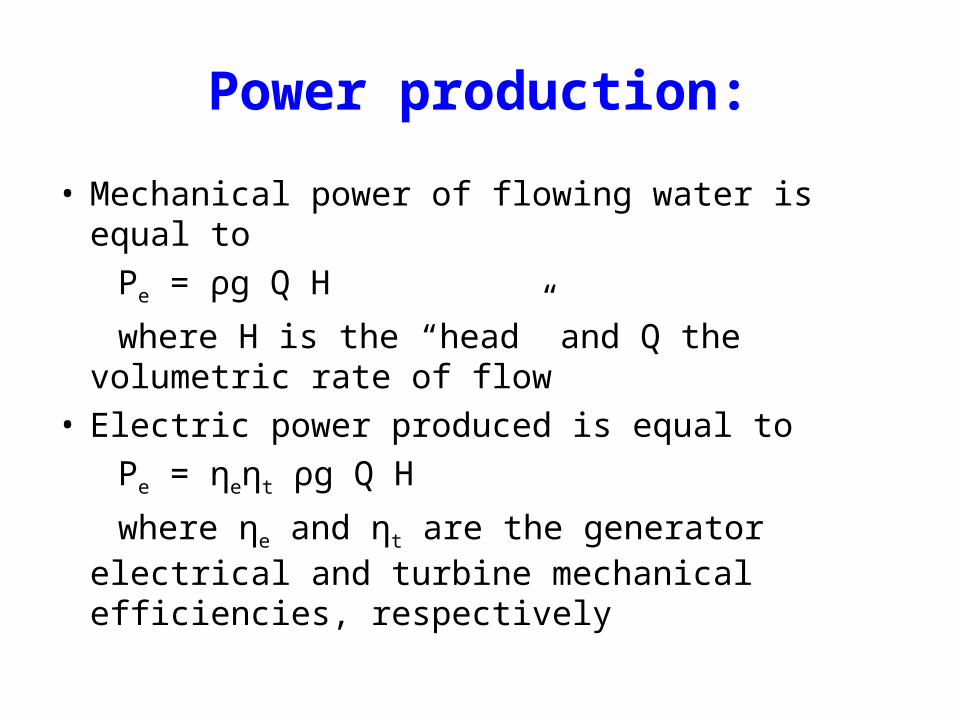
• Mechanical power of flowing water is equal to
Pe = ρg Q H
where H is the “head” and Q the volumetric rate of flow
• Electric power produced is equal to
Pe = ηeηt ρg Q H
where ηe and ηt are the generator electrical and turbine mechanical efficiencies, respectively
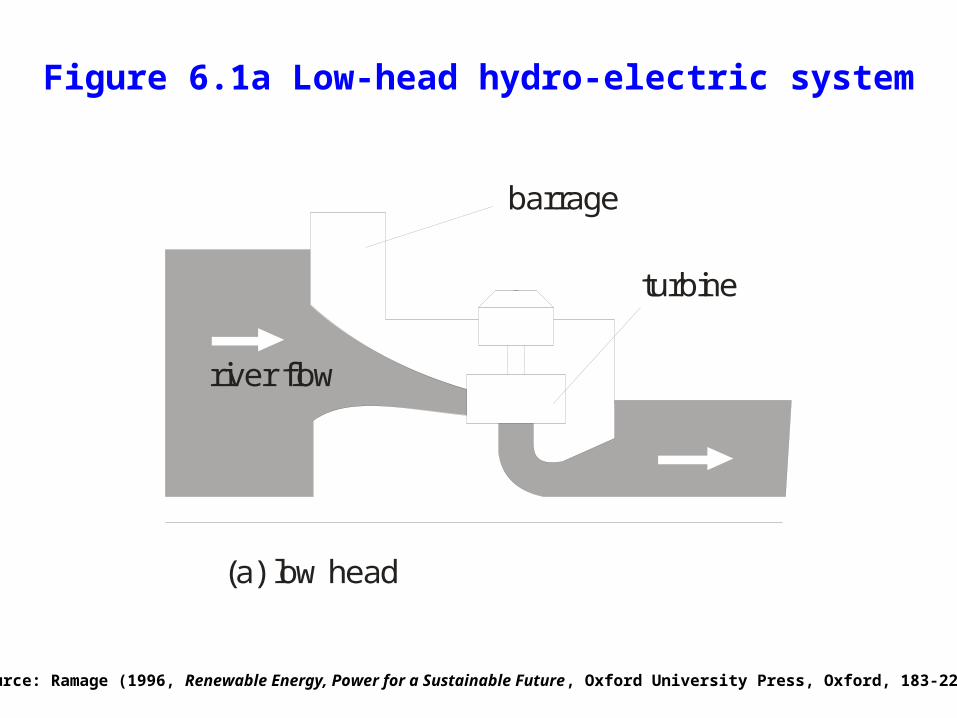
Figure 6.1a Low-head hydro-electric system
river flow
barrage
turbine
(a) low head
Source: Ramage (1996, Renewable Energy, Power for a Sustainable Future, Oxford University Press, Oxford, 183-226 )

Figure 6.1b Medium-heat hydro-electric system
reservoir
dam
turbine
penstock
(b) medium head
Source: Ramage (1996, Renewable Energy, Power for a Sustainable Future, Oxford University Press, Oxford, 183-226 )
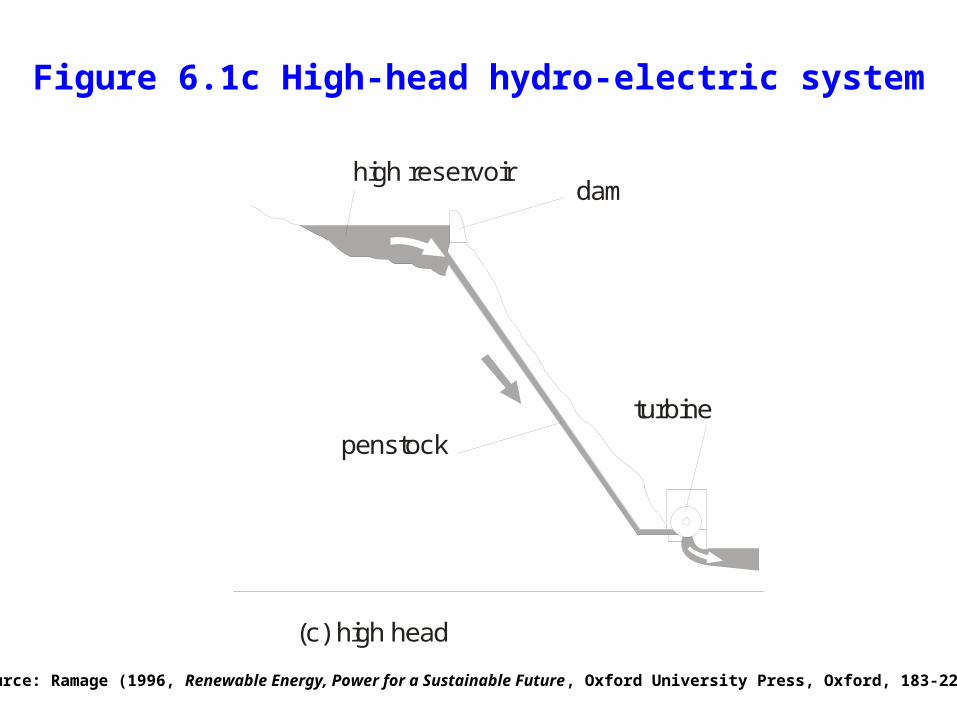
Figure 6.1c High-head hydro-electric system
penstockturbine
high reservoirdam
(c) high head
Source: Ramage (1996, Renewable Energy, Power for a Sustainable Future, Oxford University Press, Oxford, 183-226 )

Figure 6.2 Impellors
Fixed blades
Adjustable blades (Kaplan)
a) b) c)
d)
Source: Ramage (1996, Renewable Energy, Power for a Sustainable Future, Oxford University Press, Oxford, 183-226 )

Figure 6.3 Impellor Space
100 kWCross-flow
20 kW
1 MWFrancis
Propeller
10 MW
100 MW
Pelton500 MW
0.2 1.0Volumetric Flow Rate (m /s)3
10 100 5003
10
100
1000
Hea
d (m
)
Source: Ramage (1996, Renewable Energy, Power for a Sustainable Future, Oxford University Press, Oxford, 183-226 )

Figure 6.4 Hydro Efficiency
Pelton
PropellerF rancis
Crossflow
F low as a Proportion of Design Flow
Effi
c ie
n cy
(%)
100
80
60
40
20
00 0.2 0.4 0.6 0.8 1.0
Source: Paish (2002, Renewable and Sustainable Energy Reviews 6, 537–556, http://www.sciencedirect.com/science/journal/13640321)

Figure 6.5 Hydro-electricity generation
0
500
1000
1500
2000
2500
3000
3500
1965 1970 1975 1980 1985 1990 1995 2000 2005
Year
TW
h/y
r E
lect
rici
ty G
ener
atio
nAsia Pacific
Middle East & Africa
FSU
Europe
S & C America
North America
Current hydro-electricity
• About 19% of global electrical generating capacity in 2005 (778 GW out of 4100 GW)
• About 16% of global electricity generation in 2005 (2838 TWh out of 18000 TWh)

Figure 6.6 Top 10 countries and rest-of-world in terms of hydro-electric power capacity in 2005. Total = 778 GW
China, 100
USA, 77.4
Brazil, 71.1
Russia, 45.7
India, 32Norway, 27.7
France, 25.5
Italy , 17.3
ROW, 293.2
Sweden, 16.1
Canada, 72.0

Figure 6.7 Top 10 countries and rest-of-world in terms of hydro-electric generation in 2005. Total = 2838 TWh.
Canada, 359.0
Brazil, 338.0
China, 337.0
USA, 270.0
Russia, 165.0
Norway, 136.0
India, 97.0
Venezuela, 77.0
Sweden, 72.0
ROW, 931.0
France, 56.0
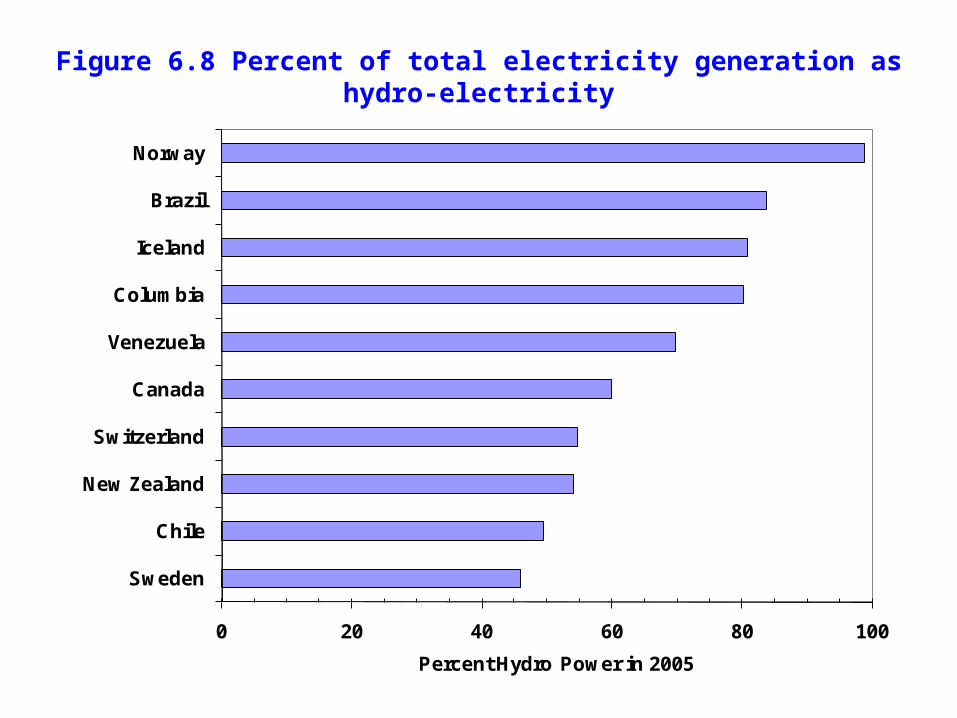
Figure 6.8 Percent of total electricity generation as hydro-electricity
0 20 40 60 80 100
Norway
Brazil
Iceland
Columbia
Venezuela
Canada
Switzerland
New Zealand
Chile
Sweden
Percent Hydro Power in 2005

Total small-hydro (< 10 MW)
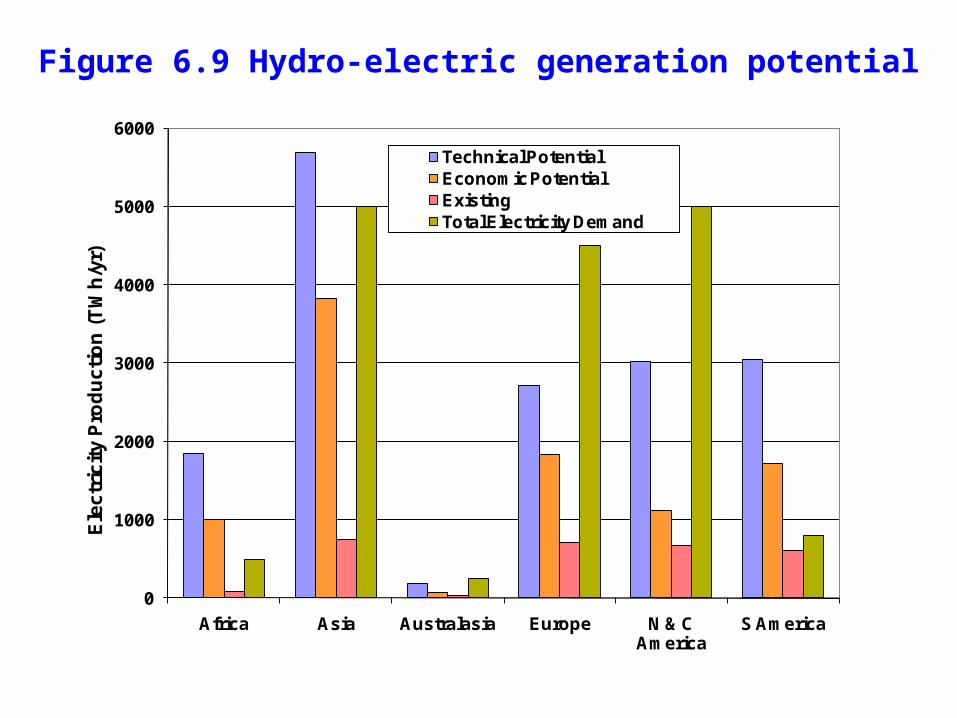
Figure 6.9 Hydro-electric generation potential
0
1000
2000
3000
4000
5000
6000
Africa Asia Australasia Europe N & C America
S America
Ele
ctr
icit
y P
rod
uc
tio
n (
TW
h/y
r)
Technical PotentialEconomic PotentialExistingTotal Electricity Demand

Hydro-electric generation potentials
Table 6.1 Potential energy generation (TWh/yr), existing (2005) of future generation (TWh/yr), total electricity demand (TWh) in 2005, and percent of total electricity demand met by hydro power in various continents and selected countries (listed for each continent in order of decreasing technical potential). UC=under construction. Source: WEC (2007) for hydro generation, UN (2007) for total generation.
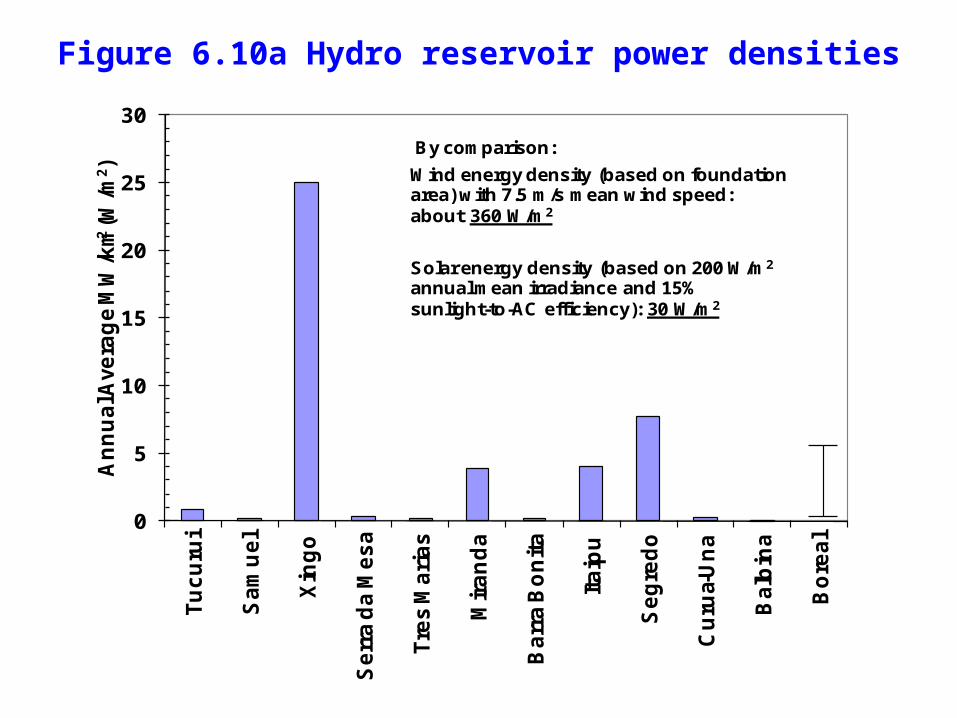
Figure 6.10a Hydro reservoir power densities
0
5
10
15
20
25
30
Tu
cu
rui
Sa
mu
el
Xin
go
Se
rra
da
Me
sa
Tre
s M
ari
as
Mir
an
da
Ba
rra
Bo
nit
a
Ita
ipu
Se
gre
do
Cu
rua-
Un
a
Ba
lbin
a
Bo
rea
l
An
nu
al A
vera
ge
MW
/km2
(W/m
2)
Wind energy density (based on foundation area) with 7.5 m/s mean wind speed:about 360 W/m2
Solar energy density (based on 200 W/m2
annual mean irradiance and 15% sunlight-to-AC efficiency): 30 W/m2
By comparison:
Greenhouse gas emissions
• Methane is produced from the decomposition of organic matter already on the land when it is flooded to produce a reservoir (this emission decreases over time)
• Methane is also produced from decomposition of organic matter that washes into the reservoir and decays anaerobically
• For some projects, the GHG emission per kWh, averaged over the lifetime of the projected, is greater than that from a coal-fired powerplant!
• Accurate assessment of the GHG emissions is, however, very difficult
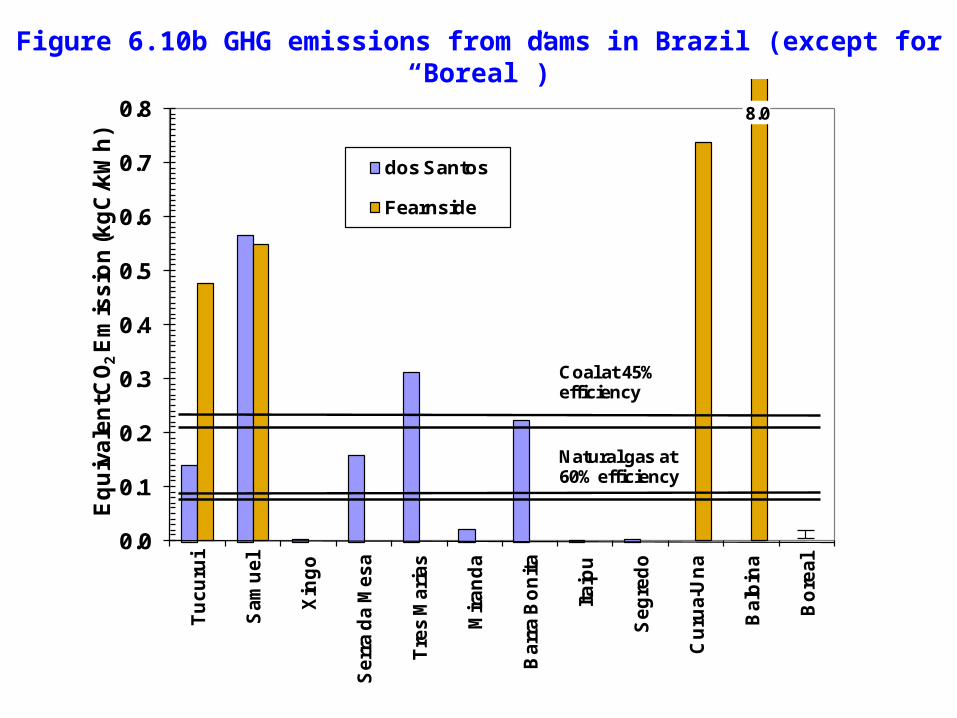
Figure 6.10b GHG emissions from dams in Brazil (except for “Boreal”)
0.0
0.1
0.2
0.3
0.4
0.5
0.6
0.7
0.8
Tu
cu
rui
Sa
mu
el
Xin
go
Se
rra
da
Me
sa
Tre
s M
ari
as
Mir
an
da
Ba
rra
Bo
nit
a
Ita
ipu
Se
gre
do
Cu
rua-
Un
a
Ba
lbin
a
Bo
rea
l
Eq
uiv
ale
nt C
O2E
mis
sio
n (k
gC
/kW
h)
dos Santos
Fearnside
Natural gas at 60% efficiency
Coal at 45% efficiency
8.0

Figure 6.11a GHG emissions vs power density for reservoirs in Brazil
0
100
200
300
400
500
600
0 2 4 6 8
Annual Average Power Density (W/m2)
CO
2-eq
Em
issi
on
s (g
C/k
Wh
)
Samuel
Tres Marias
Barra Bonita
Serra da Mesa
Tucurui
Miranda
Itaipu Segredo
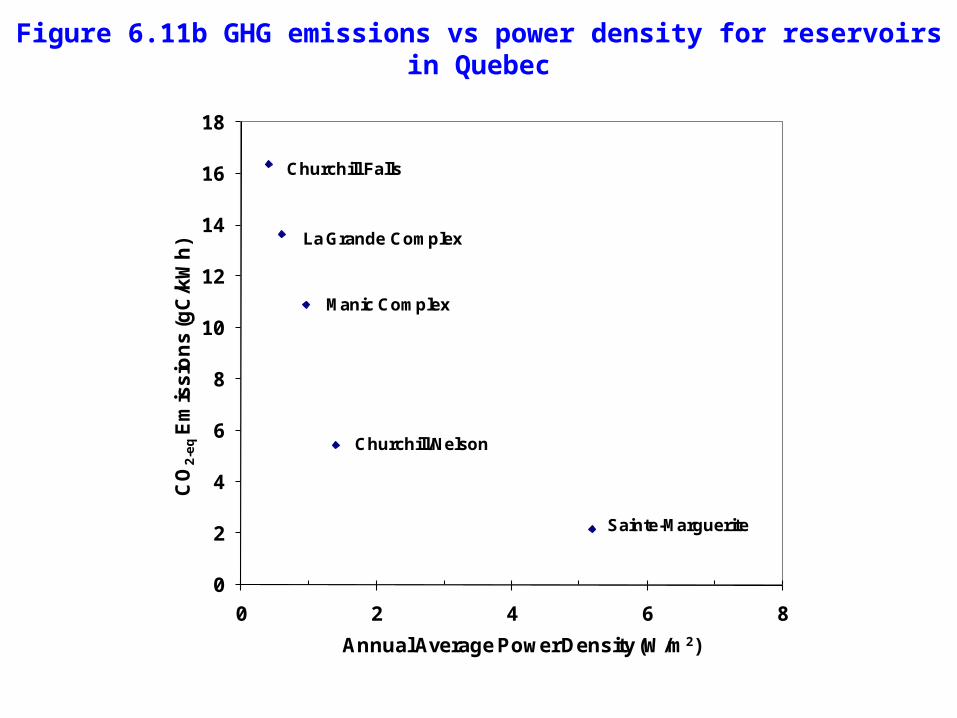
Figure 6.11b GHG emissions vs power density for reservoirs in Quebec
0
2
4
6
8
10
12
14
16
18
0 2 4 6 8
CO
2-e
qE
mis
sio
ns
(gC
/kW
h)
Annual Average Power Density (W/m2)
Sainte-Marguerite
Churchill/Nelson
Manic Complex
La Grande Complex
Churchill Falls

Capital cost of hydro powerplants
• Small hydro, $1000-3000/kW, developing countries
• Small hydro, $2000-9000/kW, developed countries
• Large hydro (involving dams and reservoirs), $2000-8000/kW (including access roads for high estimates)

Figure 6.12 Small-hydro capital cost
0
1000
2000
3000
4000
5000
6000
7000
8000
9000
10000
0 500 1000 1500 2000
kW Installed
US
$/kW
Developing country
International data
Source: Paish (2002, Renewable and Sustainable Energy Reviews 6, 537–556, http://www.sciencedirect.com/science/journal/13640321)

Cost of hydro-electricity (cents/kWh)
Table 6.4 Cost of hydro-electric energy (cents/kWh) for various capital costs, interest rates, and capacity factors, assuming amortization of the initial investment over a 50-year period. Operation and maintenance, insurance, water rent, transmission, and administrative costs are not included.