encyclopedia of inland waters || vadose water
TRANSCRIPT
Vadose WaterJ R Nimmo, U.S. Geological Survey, Menlo Park, CA, USA
Published by Elsevier Inc.
Introduction
The term vadose is derived from the Latin vadosus,meaning ‘shallow.’ In this sense, however, it refers toshallow depths beneath the land surface, not shallowportions of surface water bodies. The vadose zone isfrequently called the unsaturated zone, and some-times the zone of aeration, as its pore space usuallycontains air as well as water. The vadose zone extendsfrom the land surface to the water table (the lowestwater table if there is more than one).Prediction of the transport rates of water and other
substances within the vadose zone is critical to infil-tration, runoff, erosion, plant growth, microbiota,contaminant transport, aquifer recharge, and dis-charge to surface water. Vadose-zone flow is funda-mentally complicated by nonlinearity and hysteresisof unsaturated hydraulic properties, and extreme sen-sitivity to materials and hydraulic conditions. Thereis much variety in its natural constituents: soils, rocks,water, air, plants, animals, and microorganisms. Mod-ern hydrology must consider interactions not onlyamong these constituents themselves, but also witha wide variety of contaminants, including pesti-cides, fertilizers, irrigation wastewater, manure, sew-age, toxic chemicals, radioactive substances, bacteria,mine wastes, and organic liquids.The porous medium of the vadose zone is typically
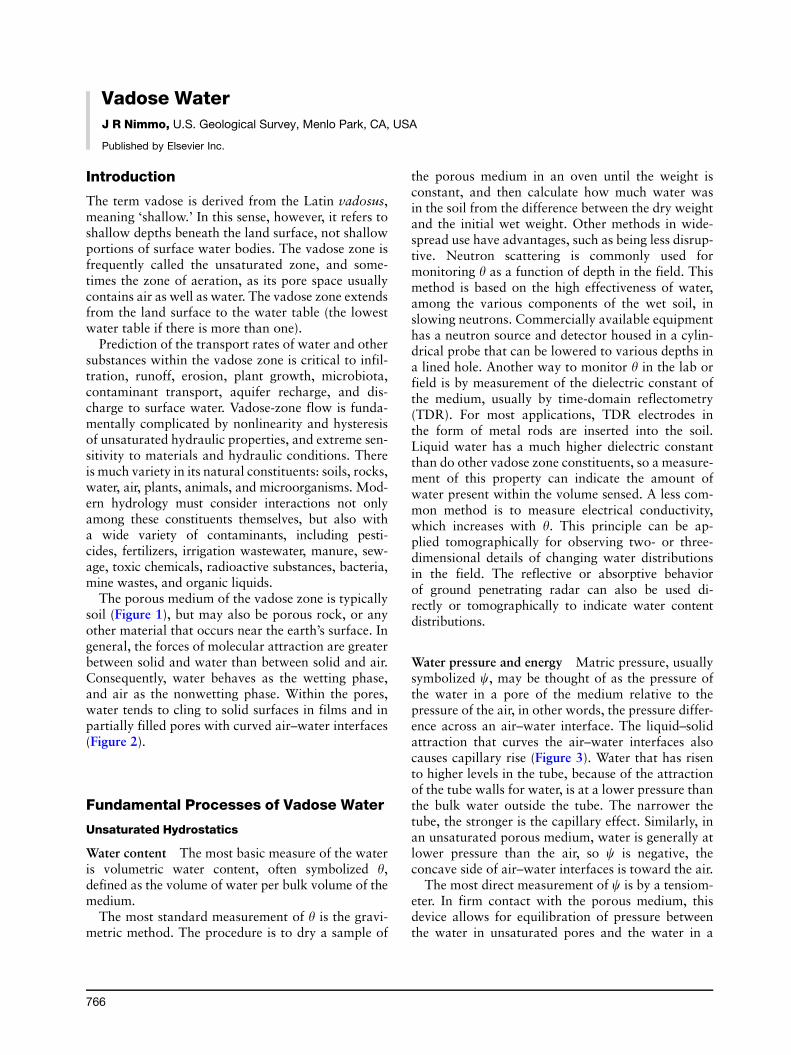
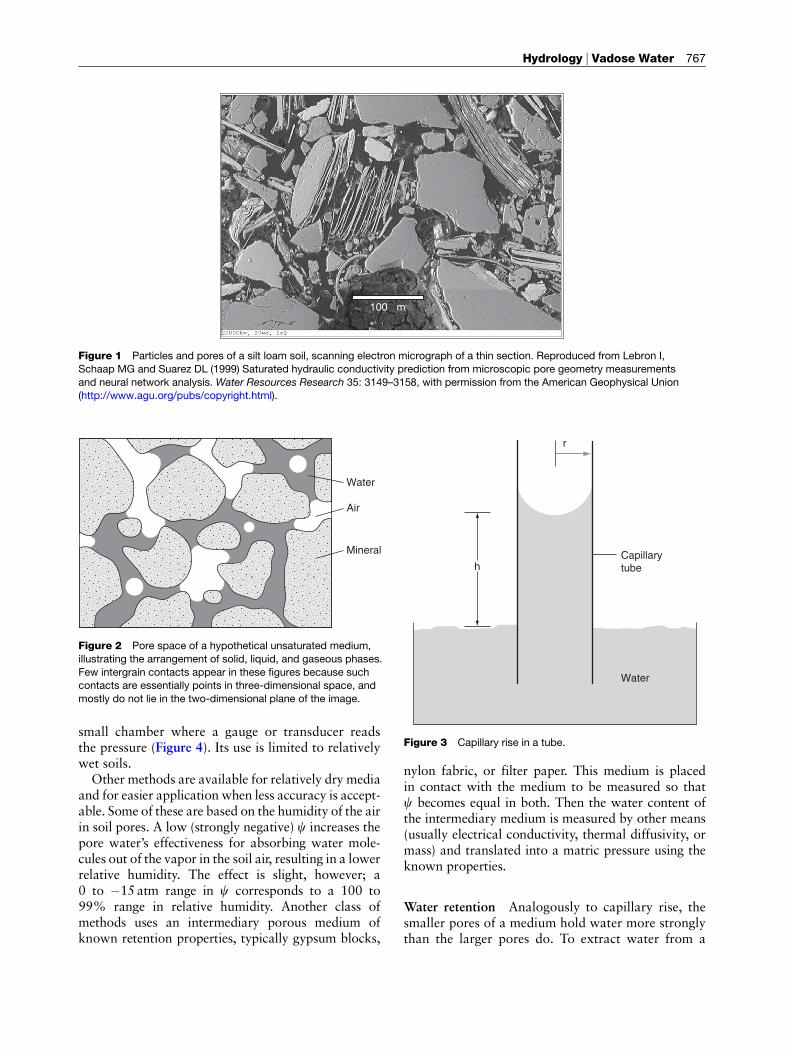
soil (Figure 1), but may also be porous rock, or anyother material that occurs near the earth’s surface. Ingeneral, the forces of molecular attraction are greaterbetween solid and water than between solid and air.Consequently, water behaves as the wetting phase,and air as the nonwetting phase. Within the pores,water tends to cling to solid surfaces in films and inpartially filled pores with curved air–water interfaces(Figure 2).
Fundamental Processes of Vadose Water
Unsaturated Hydrostatics
Water content The most basic measure of the wateris volumetric water content, often symbolized y,defined as the volume of water per bulk volume of themedium.The most standard measurement of y is the gravi-
metric method. The procedure is to dry a sample of
766
the porous medium in an oven until the weight isconstant, and then calculate how much water wasin the soil from the difference between the dry weightand the initial wet weight. Other methods in wide-spread use have advantages, such as being less disrup-tive. Neutron scattering is commonly used formonitoring y as a function of depth in the field. Thismethod is based on the high effectiveness of water,among the various components of the wet soil, inslowing neutrons. Commercially available equipmenthas a neutron source and detector housed in a cylin-drical probe that can be lowered to various depths ina lined hole. Another way to monitor y in the lab orfield is by measurement of the dielectric constant ofthe medium, usually by time-domain reflectometry(TDR). For most applications, TDR electrodes inthe form of metal rods are inserted into the soil.Liquid water has a much higher dielectric constantthan do other vadose zone constituents, so a measure-ment of this property can indicate the amount ofwater present within the volume sensed. A less com-mon method is to measure electrical conductivity,which increases with y. This principle can be ap-plied tomographically for observing two- or three-dimensional details of changing water distributionsin the field. The reflective or absorptive behaviorof ground penetrating radar can also be used di-rectly or tomographically to indicate water contentdistributions.
Water pressure and energy Matric pressure, usuallysymbolized c, may be thought of as the pressure ofthe water in a pore of the medium relative to thepressure of the air, in other words, the pressure differ-ence across an air–water interface. The liquid–solidattraction that curves the air–water interfaces alsocauses capillary rise (Figure 3). Water that has risento higher levels in the tube, because of the attractionof the tube walls for water, is at a lower pressure thanthe bulk water outside the tube. The narrower thetube, the stronger is the capillary effect. Similarly, inan unsaturated porous medium, water is generally atlower pressure than the air, so c is negative, theconcave side of air–water interfaces is toward the air.
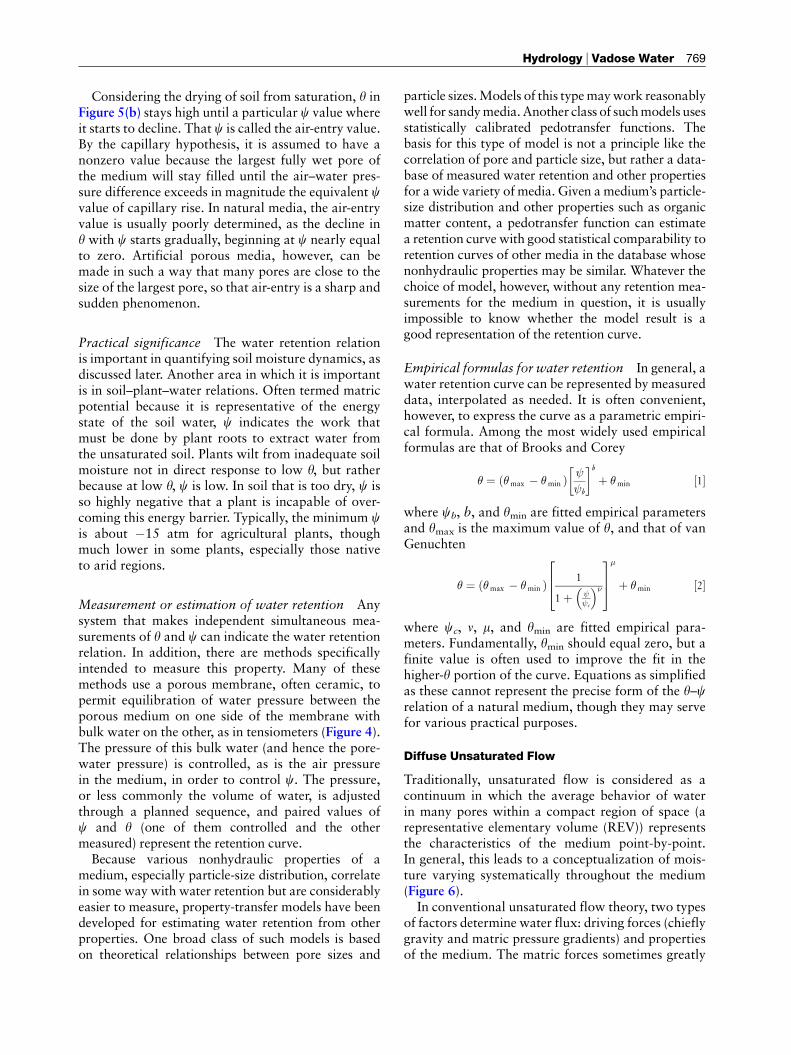
The most direct measurement of c is by a tensiom-eter. In firm contact with the porous medium, thisdevice allows for equilibration of pressure betweenthe water in unsaturated pores and the water in a
h
r
Capillarytube
Water
Figure 3 Capillary rise in a tube.
100 µm
Figure 1 Particles and pores of a silt loam soil, scanning electron micrograph of a thin section. Reproduced from Lebron I,
Schaap MG and Suarez DL (1999) Saturated hydraulic conductivity prediction from microscopic pore geometry measurements
and neural network analysis. Water Resources Research 35: 3149–3158, with permission from the American Geophysical Union(http://www.agu.org/pubs/copyright.html).
Water
Air
Mineral
Figure 2 Pore space of a hypothetical unsaturated medium,
illustrating the arrangement of solid, liquid, and gaseous phases.
Few intergrain contacts appear in these figures because suchcontacts are essentially points in three-dimensional space, and
mostly do not lie in the two-dimensional plane of the image.
Hydrology _ Vadose Water 767
small chamber where a gauge or transducer readsthe pressure (Figure 4). Its use is limited to relativelywet soils.Other methods are available for relatively dry media
and for easier application when less accuracy is accept-able. Some of these are based on the humidity of the airin soil pores. A low (strongly negative) c increases thepore water’s effectiveness for absorbing water mole-cules out of the vapor in the soil air, resulting in a lowerrelative humidity. The effect is slight, however; a0 to �15 atm range in c corresponds to a 100 to99% range in relative humidity. Another class ofmethods uses an intermediary porous medium ofknown retention properties, typically gypsum blocks,
nylon fabric, or filter paper. This medium is placedin contact with the medium to be measured so thatc becomes equal in both. Then the water content ofthe intermediary medium is measured by other means(usually electrical conductivity, thermal diffusivity, ormass) and translated into a matric pressure using theknown properties.
Water retention Analogously to capillary rise, thesmaller pores of a medium hold water more stronglythan the larger pores do. To extract water from a
0.45
0.40
0.35
(a)
(b)
0.30
0.25
0.20
0.15
0.10
0.05
0.0−106 −104 −102 −100
−40 −20Matric pressure (kPa)
Water retention for sandy soil
Matric pressure (kPa)
Vol
umet
ric w
ater
con
tent
Plano silt loam core sample
Wat
er c
onte
nt (
vol/v
ol)
0
Pressure plateWater-activity meter
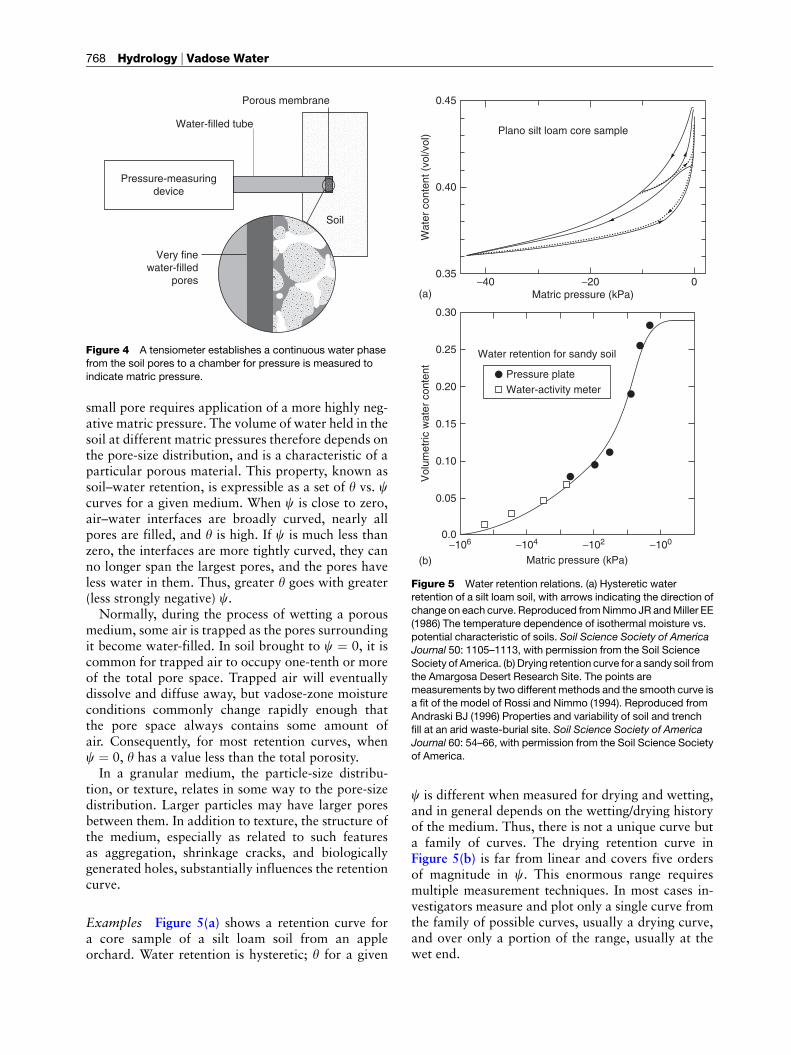
Figure 5 Water retention relations. (a) Hysteretic waterretention of a silt loam soil, with arrows indicating the direction of
change on each curve. Reproduced fromNimmoJR andMiller EE
(1986) The temperature dependence of isothermal moisture vs.
potential characteristic of soils. Soil Science Society of AmericaJournal 50: 1105–1113, with permission from the Soil Science
Society of America. (b) Drying retention curve for a sandy soil from
the Amargosa Desert Research Site. The points aremeasurements by two different methods and the smooth curve is
a fit of the model of Rossi and Nimmo (1994). Reproduced from
Andraski BJ (1996) Properties and variability of soil and trench
fill at an arid waste-burial site. Soil Science Society of AmericaJournal 60: 54–66, with permission from the Soil Science Society
of America.
Pressure-measuringdevice
Water-filled tube
Soil
Porous membrane
Very finewater-filled
pores
Figure 4 A tensiometer establishes a continuous water phase
from the soil pores to a chamber for pressure is measured to
indicate matric pressure.
768 Hydrology _ Vadose Water
small pore requires application of a more highly neg-ative matric pressure. The volume of water held in thesoil at different matric pressures therefore depends onthe pore-size distribution, and is a characteristic of aparticular porous material. This property, known assoil–water retention, is expressible as a set of y vs. ccurves for a given medium. When c is close to zero,air–water interfaces are broadly curved, nearly allpores are filled, and y is high. If c is much less thanzero, the interfaces are more tightly curved, they canno longer span the largest pores, and the pores haveless water in them. Thus, greater y goes with greater(less strongly negative) c.Normally, during the process of wetting a porous
medium, some air is trapped as the pores surroundingit become water-filled. In soil brought to c ¼ 0, it iscommon for trapped air to occupy one-tenth or moreof the total pore space. Trapped air will eventuallydissolve and diffuse away, but vadose-zone moistureconditions commonly change rapidly enough thatthe pore space always contains some amount ofair. Consequently, for most retention curves, whenc ¼ 0, y has a value less than the total porosity.In a granular medium, the particle-size distribu-
tion, or texture, relates in some way to the pore-sizedistribution. Larger particles may have larger poresbetween them. In addition to texture, the structure ofthe medium, especially as related to such featuresas aggregation, shrinkage cracks, and biologicallygenerated holes, substantially influences the retentioncurve.
Examples Figure 5(a) shows a retention curve fora core sample of a silt loam soil from an appleorchard. Water retention is hysteretic; y for a given
c is different when measured for drying and wetting,and in general depends on the wetting/drying historyof the medium. Thus, there is not a unique curve buta family of curves. The drying retention curve inFigure 5(b) is far from linear and covers five ordersof magnitude in c. This enormous range requiresmultiple measurement techniques. In most cases in-vestigators measure and plot only a single curve fromthe family of possible curves, usually a drying curve,and over only a portion of the range, usually at thewet end.
Hydrology _ Vadose Water 769
Considering the drying of soil from saturation, y inFigure 5(b) stays high until a particular c value whereit starts to decline. That c is called the air-entry value.By the capillary hypothesis, it is assumed to have anonzero value because the largest fully wet pore ofthe medium will stay filled until the air–water pres-sure difference exceeds in magnitude the equivalent cvalue of capillary rise. In natural media, the air-entryvalue is usually poorly determined, as the decline iny with c starts gradually, beginning at c nearly equalto zero. Artificial porous media, however, can bemade in such a way that many pores are close to thesize of the largest pore, so that air-entry is a sharp andsudden phenomenon.
Practical significance The water retention relationis important in quantifying soil moisture dynamics, asdiscussed later. Another area in which it is importantis in soil–plant–water relations. Often termed matricpotential because it is representative of the energystate of the soil water, c indicates the work thatmust be done by plant roots to extract water fromthe unsaturated soil. Plants wilt from inadequate soilmoisture not in direct response to low y, but ratherbecause at low y, c is low. In soil that is too dry, c isso highly negative that a plant is incapable of over-coming this energy barrier. Typically, the minimum cis about �15 atm for agricultural plants, thoughmuch lower in some plants, especially those nativeto arid regions.
Measurement or estimation of water retention Anysystem that makes independent simultaneous mea-surements of y and c can indicate the water retentionrelation. In addition, there are methods specificallyintended to measure this property. Many of thesemethods use a porous membrane, often ceramic, topermit equilibration of water pressure between theporous medium on one side of the membrane withbulk water on the other, as in tensiometers (Figure 4).The pressure of this bulk water (and hence the pore-water pressure) is controlled, as is the air pressurein the medium, in order to control c. The pressure,or less commonly the volume of water, is adjustedthrough a planned sequence, and paired values ofc and y (one of them controlled and the othermeasured) represent the retention curve.Because various nonhydraulic properties of a
medium, especially particle-size distribution, correlatein some way with water retention but are considerablyeasier to measure, property-transfer models have beendeveloped for estimating water retention from otherproperties. One broad class of such models is basedon theoretical relationships between pore sizes and
particle sizes.Models of this typemaywork reasonablywell for sandymedia.Another class of suchmodels usesstatistically calibrated pedotransfer functions. Thebasis for this type of model is not a principle like thecorrelation of pore and particle size, but rather a data-base of measured water retention and other propertiesfor a wide variety of media. Given a medium’s particle-size distribution and other properties such as organicmatter content, a pedotransfer function can estimatea retention curve with good statistical comparability toretention curves of other media in the database whosenonhydraulic properties may be similar. Whatever thechoice of model, however, without any retention mea-surements for the medium in question, it is usuallyimpossible to know whether the model result is agood representation of the retention curve.
Empirical formulas for water retention In general, awater retention curve can be represented by measureddata, interpolated as needed. It is often convenient,however, to express the curve as a parametric empiri-cal formula. Among the most widely used empiricalformulas are that of Brooks and Corey
� ¼ ð�max � �min Þ
b
� �bþ �min ½1�
where cb, b, and ymin are fitted empirical parametersand ymax is the maximum value of y, and that of vanGenuchten
� ¼ ð�max � �min Þ 1
1þ c
� ��264
375�
þ �min ½2�
where cc, n, m, and ymin are fitted empirical para-meters. Fundamentally, ymin should equal zero, but afinite value is often used to improve the fit in thehigher-y portion of the curve. Equations as simplifiedas these cannot represent the precise form of the y–crelation of a natural medium, though they may servefor various practical purposes.
Diffuse Unsaturated Flow
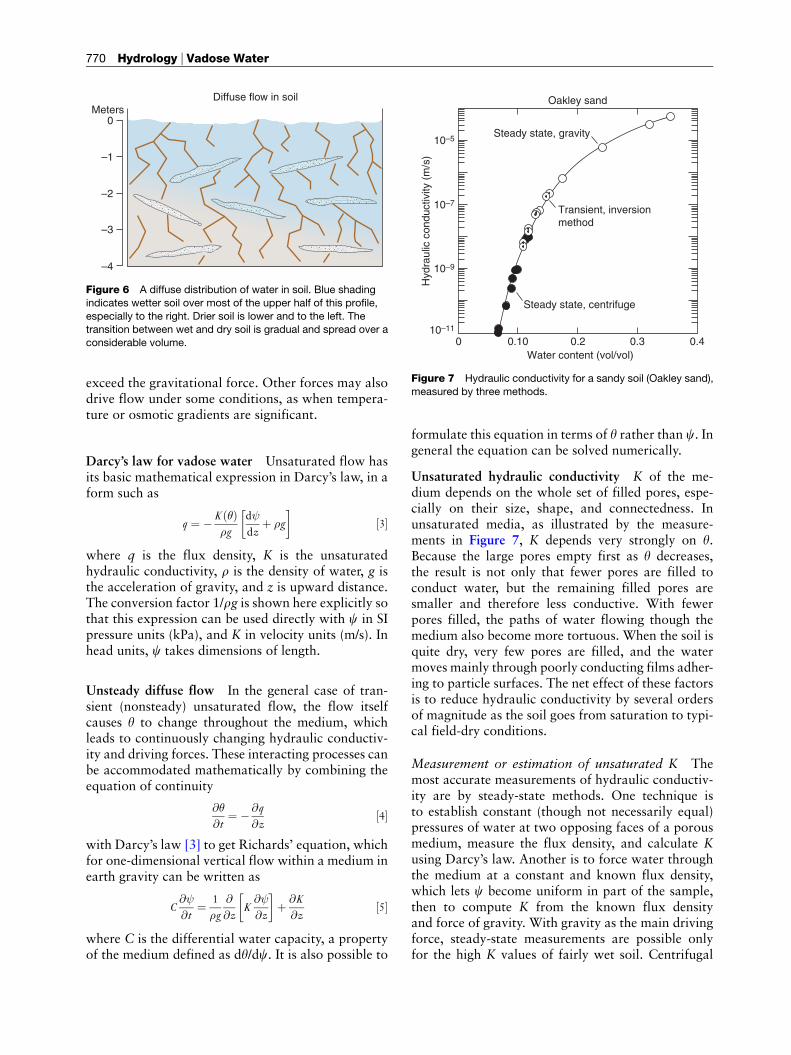
Traditionally, unsaturated flow is considered as acontinuum in which the average behavior of waterin many pores within a compact region of space (arepresentative elementary volume (REV)) representsthe characteristics of the medium point-by-point.In general, this leads to a conceptualization of mois-ture varying systematically throughout the medium(Figure 6).
In conventional unsaturated flow theory, two typesof factors determine water flux: driving forces (chieflygravity and matric pressure gradients) and propertiesof the medium. The matric forces sometimes greatly
Steady state, centrifuge
Water content (vol/vol)
Transient, inversionmethod
Steady state, gravity
Oakley sand
Hyd
raul
ic c
ondu
ctiv
ity (
m/s
)
010–11
10–9
10–7
10–5
0.10 0.2 0.3 0.4
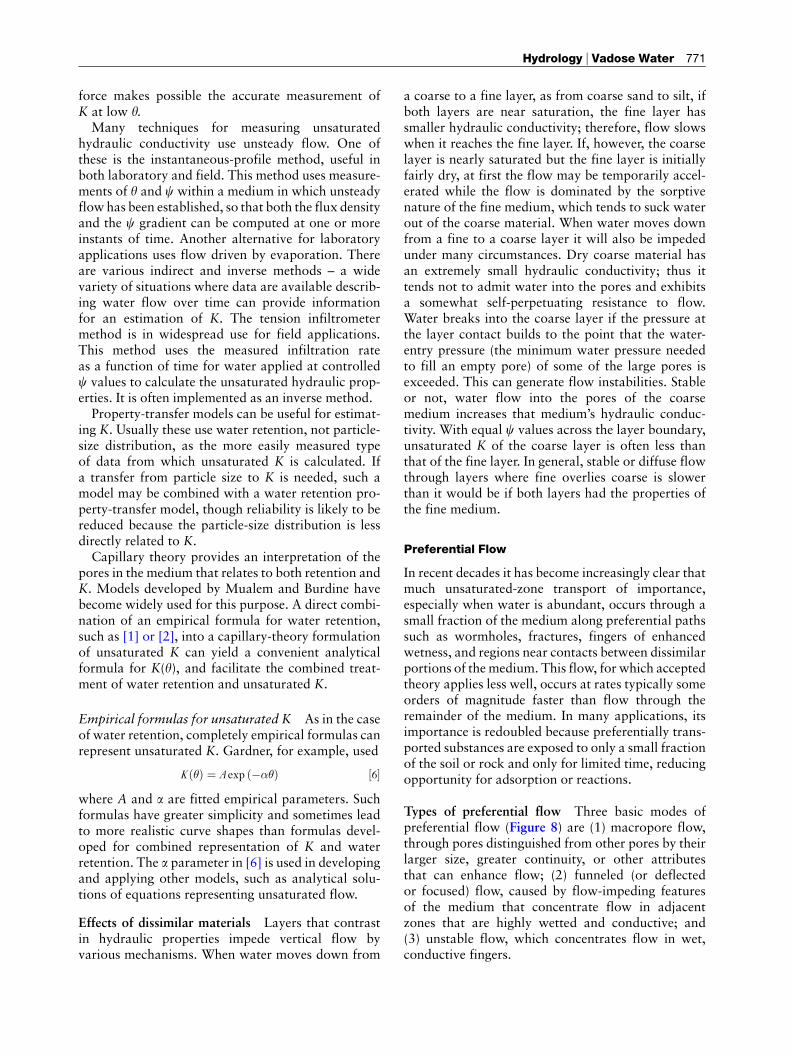
Figure 7 Hydraulic conductivity for a sandy soil (Oakley sand),
measured by three methods.
Diffuse flow in soilMeters
0
–1
–2
–3
–4
Figure 6 A diffuse distribution of water in soil. Blue shading
indicates wetter soil over most of the upper half of this profile,
especially to the right. Drier soil is lower and to the left. Thetransition between wet and dry soil is gradual and spread over a
considerable volume.
770 Hydrology _ Vadose Water
exceed the gravitational force. Other forces may alsodrive flow under some conditions, as when tempera-ture or osmotic gradients are significant.
Darcy’s law for vadose water Unsaturated flow hasits basic mathematical expression in Darcy’s law, in aform such as
q ¼ �K ð�Þ� g
d
d zþ � g
� �½ 3�
where q is the flux density, K is the unsaturatedhydraulic conductivity, r is the density of water, g isthe acceleration of gravity, and z is upward distance.The conversion factor 1/ rg is shown here explicitly sothat this expression can be used directly with c in SIpressure units (kPa), and K in velocity units (m/s). Inhead units, c takes dimensions of length.
Unsteady diffu se flow In the general case of tran-sient (nonsteady) unsaturated flow, the flow itselfcauses y to change throughout the medium, whichleads to continuously changing hydraulic conductiv-ity and driving forces. These interacting processes canbe accommodated mathematically by combining theequation of continuity
@�
@t¼ � @q
@z½4�
with Darcy’s law [3] to get Richards’ equation, whichfor one-dimensional vertical flow within a medium inearth gravity can be written as
C@
@t¼ 1
�g
@
@zK@
@z
� �þ @K
@z½5�
where C is the differential water capacity, a propertyof the medium defined as dy/dc. It is also possible to
formulate this equation in terms of y rather than c. Ingeneral the equation can be solved numerically.
Unsaturated hydraulic conductivity K of the me-dium depends on the whole set of filled pores, espe-cially on their size, shape, and connectedness. Inunsaturated media, as illustrated by the measure-ments in Figure 7, K depends very strongly on y.Because the large pores empty first as y decreases,the result is not only that fewer pores are filled toconduct water, but the remaining filled pores aresmaller and therefore less conductive. With fewerpores filled, the paths of water flowing though themedium also become more tortuous. When the soil isquite dry, very few pores are filled, and the watermoves mainly through poorly conducting films adher-ing to particle surfaces. The net effect of these factorsis to reduce hydraulic conductivity by several ordersof magnitude as the soil goes from saturation to typi-cal field-dry conditions.
Measurement or estimation of unsaturated K Themost accurate measurements of hydraulic conductiv-ity are by steady-state methods. One technique isto establish constant (though not necessarily equal)pressures of water at two opposing faces of a porousmedium, measure the flux density, and calculate Kusing Darcy’s law. Another is to force water throughthe medium at a constant and known flux density,which lets c become uniform in part of the sample,then to compute K from the known flux densityand force of gravity. With gravity as the main drivingforce, steady-state measurements are possible onlyfor the high K values of fairly wet soil. Centrifugal
Hydrology _ Vadose Water 771
force makes possible the accurate measurement ofK at low y.Many techniques for measuring unsaturated
hydraulic conductivity use unsteady flow. One ofthese is the instantaneous-profile method, useful inboth laboratory and field. This method uses measure-ments of y and c within a medium in which unsteadyflow has been established, so that both the flux densityand the c gradient can be computed at one or moreinstants of time. Another alternative for laboratoryapplications uses flow driven by evaporation. Thereare various indirect and inverse methods – a widevariety of situations where data are available describ-ing water flow over time can provide informationfor an estimation of K . The tension infiltrometermethod is in widespread use for field applications.This method uses the measured infiltration rateas a function of time for water applied at controlledc values to calculate the unsaturated hydraulic prop-erties. It is often implemented as an inverse method.Property-transfer models can be useful for estimat-
ing K . Usually these use water retention, not particle-size distribution, as the more easily measured typeof data from which unsaturated K is calculated. Ifa transfer from particle size to K is needed, such amodel may be combined with a water retention pro-perty-transfer model, though reliability is likely to bereduced because the particle-size distribution is lessdirectly related to K .Capillary theory provides an interpretation of the
pores in the medium that relates to both retention andK . Models developed by Mualem and Burdine havebecome widely used for this purpose. A direct combi-nation of an empirical formula for water retention,such as [1] or [2], into a capillary-theory formulationof unsaturated K can yield a convenient analyticalformula for K( y), and facilitate the combined treat-ment of water retention and unsaturated K .
Empiric al form ulas for unsatur ated K As in the caseof water retention, completely empirical formulas canrepresent unsaturated K. Gardner, for example, used
K ð�Þ ¼ A exp ð���Þ ½6�where A and a are fitted empirical parameters. Suchformulas have greater simplicity and sometimes leadto more realistic curve shapes than formulas devel-oped for combined representation of K and waterretention. The a parameter in [6] is used in developingand applying other models, such as analytical solu-tions of equations representing unsaturated flow.
Effects of dissimilar materials Layers that contrastin hydraulic properties impede vertical flow byvarious mechanisms. When water moves down from
a coarse to a fine layer, as from coarse sand to silt, ifboth layers are near saturation, the fine layer hassmaller hydraulic conductivity; therefore, flow slowswhen it reaches the fine layer. If, however, the coarselayer is nearly saturated but the fine layer is initiallyfairly dry, at first the flow may be temporarily accel-erated while the flow is dominated by the sorptivenature of the fine medium, which tends to suck waterout of the coarse material. When water moves downfrom a fine to a coarse layer it will also be impededunder many circumstances. Dry coarse material hasan extremely small hydraulic conductivity; thus ittends not to admit water into the pores and exhibitsa somewhat self-perpetuating resistance to flow.Water breaks into the coarse layer if the pressure atthe layer contact builds to the point that the water-entry pressure (the minimum water pressure neededto fill an empty pore) of some of the large pores isexceeded. This can generate flow instabilities. Stableor not, water flow into the pores of the coarsemedium increases that medium’s hydraulic conduc-tivity. With equal c values across the layer boundary,unsaturated K of the coarse layer is often less thanthat of the fine layer. In general, stable or diffuse flowthrough layers where fine overlies coarse is slowerthan it would be if both layers had the properties ofthe fine medium.
Preferential Flow
In recent decades it has become increasingly clear thatmuch unsaturated-zone transport of importance,especially when water is abundant, occurs through asmall fraction of the medium along preferential pathssuch as wormholes, fractures, fingers of enhancedwetness, and regions near contacts between dissimilarportions of themedium. This flow, for which acceptedtheory applies less well, occurs at rates typically someorders of magnitude faster than flow through theremainder of the medium. In many applications, itsimportance is redoubled because preferentially trans-ported substances are exposed to only a small fractionof the soil or rock and only for limited time, reducingopportunity for adsorption or reactions.
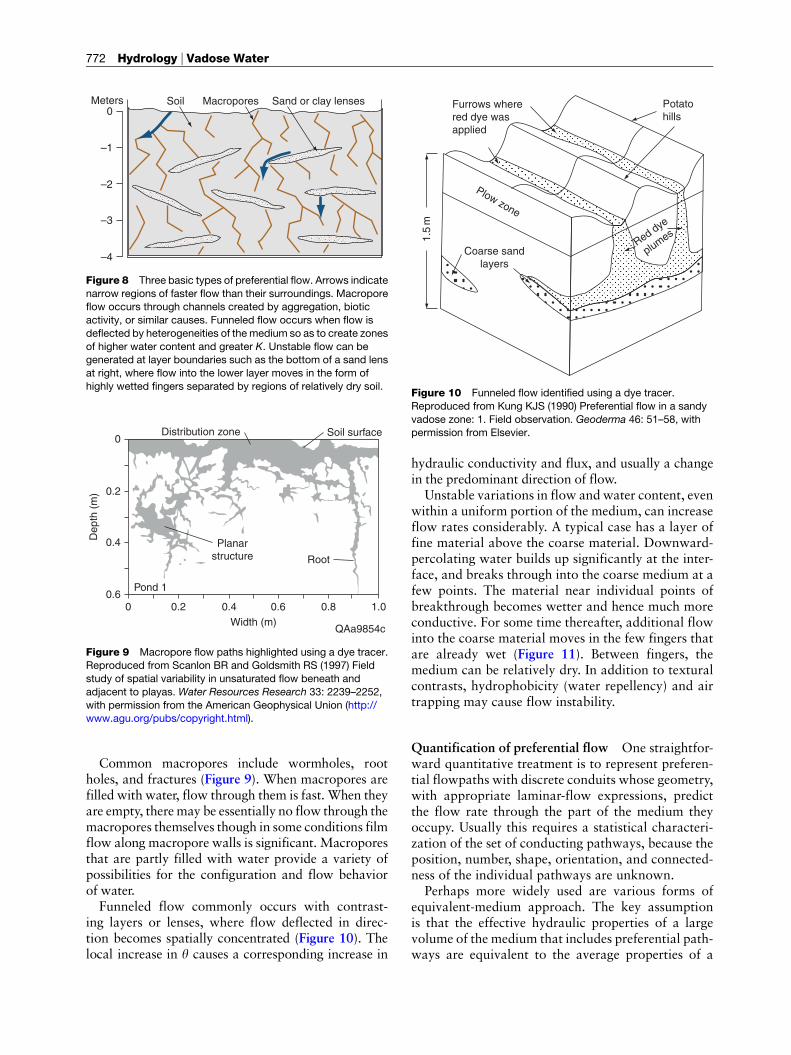
Types of preferential flow Three basic modes ofpreferential flow (Figure 8) are (1) macropore flow,through pores distinguished from other pores by theirlarger size, greater continuity, or other attributesthat can enhance flow; (2) funneled (or deflectedor focused) flow, caused by flow-impeding featuresof the medium that concentrate flow in adjacentzones that are highly wetted and conductive; and(3) unstable flow, which concentrates flow in wet,conductive fingers.
Planarstructure Root
Pond 1
0
0.2
0.4
0.60 0.2 0.4 0.6 0.8 1.0
QAa9854cWidth (m)
Dep
th (
m)
Distribution zone Soil surface
Figure 9 Macropore flow paths highlighted using a dye tracer.Reproduced from Scanlon BR and Goldsmith RS (1997) Field
study of spatial variability in unsaturated flow beneath and
adjacent to playas. Water Resources Research 33: 2239–2252,
with permission from the American Geophysical Union (http://www.agu.org/pubs/copyright.html).
Coarse sandlayers
Red dye
plumes
Plow zone
1.5
m
Furrows wherered dye wasapplied
Potatohills
Figure 10 Funneled flow identified using a dye tracer.
Reproduced from Kung KJS (1990) Preferential flow in a sandy
vadose zone: 1. Field observation. Geoderma 46: 51–58, withpermission from Elsevier.
Meters Soil Macropores Sand or clay lenses0
–1
–2
–3
–4
Figure 8 Three basic types of preferential flow. Arrows indicate
narrow regions of faster flow than their surroundings. Macroporeflow occurs through channels created by aggregation, biotic
activity, or similar causes. Funneled flow occurs when flow is
deflected by heterogeneities of the medium so as to create zones
of higher water content and greater K. Unstable flow can begenerated at layer boundaries such as the bottom of a sand lens
at right, where flow into the lower layer moves in the form of
highly wetted fingers separated by regions of relatively dry soil.
772 Hydrology _ Vadose Water
Common macropores include wormholes, rootholes, and fractures (Figure 9). When macropores arefilled with water, flow through them is fast. When theyare empty, there may be essentially no flow through themacropores themselves though in some conditions filmflow along macropore walls is significant. Macroporesthat are partly filled with water provide a variety ofpossibilities for the configuration and flow behaviorof water.Funneled flow commonly occurs with contrast-
ing layers or lenses, where flow deflected in direc-tion becomes spatially concentrated (Figure 10). Thelocal increase in y causes a corresponding increase in
hydraulic conductivity and flux, and usually a changein the predominant direction of flow.
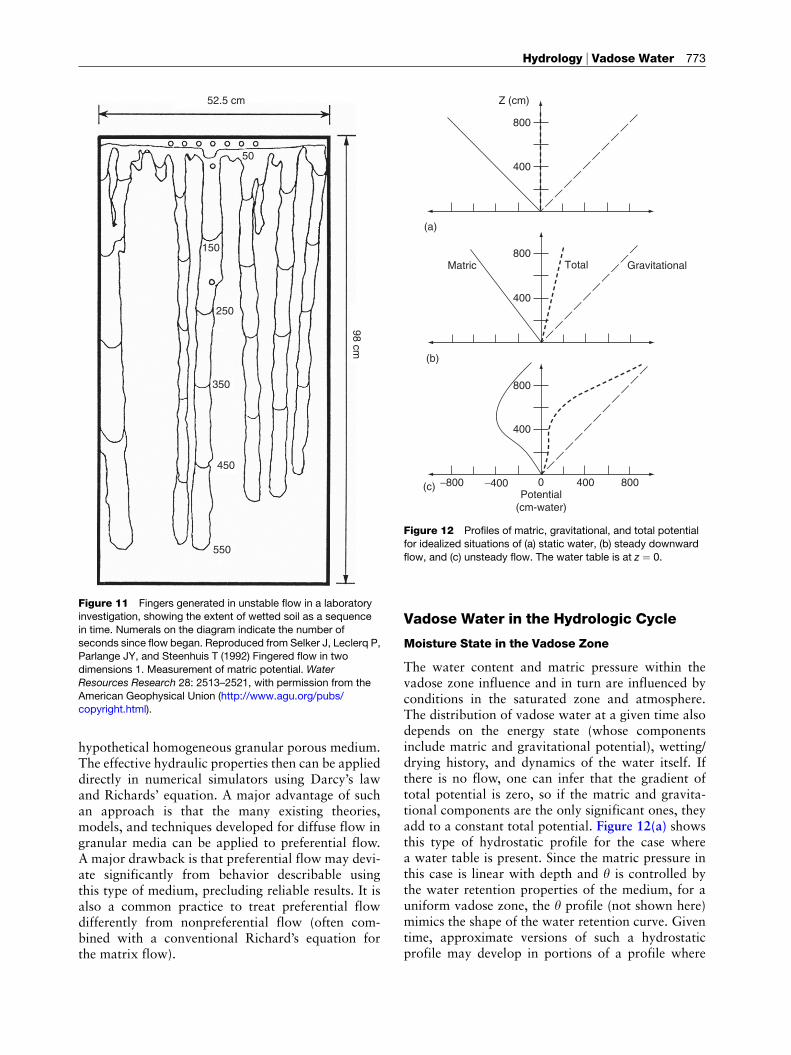
Unstable variations in flow and water content, evenwithin a uniform portion of the medium, can increaseflow rates considerably. A typical case has a layer offine material above the coarse material. Downward-percolating water builds up significantly at the inter-face, and breaks through into the coarse medium at afew points. The material near individual points ofbreakthrough becomes wetter and hence much moreconductive. For some time thereafter, additional flowinto the coarse material moves in the few fingers thatare already wet (Figure 11). Between fingers, themedium can be relatively dry. In addition to texturalcontrasts, hydrophobicity (water repellency) and airtrapping may cause flow instability.
Quantification of preferential flow One straightfor-ward quantitative treatment is to represent preferen-tial flowpaths with discrete conduits whose geometry,with appropriate laminar-flow expressions, predictthe flow rate through the part of the medium theyoccupy. Usually this requires a statistical characteri-zation of the set of conducting pathways, because theposition, number, shape, orientation, and connected-ness of the individual pathways are unknown.
Perhaps more widely used are various forms ofequivalent-medium approach. The key assumptionis that the effective hydraulic properties of a largevolume of the medium that includes preferential path-ways are equivalent to the average properties of a
52.5 cm
98 cm
150
50
250
350
450
550
Figure 11 Fingers generated in unstable flow in a laboratoryinvestigation, showing the extent of wetted soil as a sequence
in time. Numerals on the diagram indicate the number of
seconds since flow began. Reproduced from Selker J, Leclerq P,Parlange JY, and Steenhuis T (1992) Fingered flow in two
dimensions 1. Measurement of matric potential. Water
Resources Research 28: 2513–2521, with permission from the
American Geophysical Union (http://www.agu.org/pubs/copyright.html).
Z (cm)
800
400
(a)
800
400
Total GravitationalMatric
(b)
800
(c) −800 −400 0 400
400
800Potential
(cm-water)
Figure 12 Profiles of matric, gravitational, and total potential
for idealized situations of (a) static water, (b) steady downward
flow, and (c) unsteady flow. The water table is at z ¼ 0.
Hydrology _ Vadose Water 773
hypothetical homogeneous granular porous medium.The effective hydraulic properties then can be applieddirectly in numerical simulators using Darcy’s lawand Richards’ equation. A major advantage of suchan approach is that the many existing theories,models, and techniques developed for diffuse flow ingranular media can be applied to preferential flow.A major drawback is that preferential flow may devi-ate significantly from behavior describable usingthis type of medium, precluding reliable results. It isalso a common practice to treat preferential flowdifferently from nonpreferential flow (often com-bined with a conventional Richard’s equation forthe matrix flow).
Vadose Water in the Hydrologic Cycle
Moisture State in the Vadose Zone
The water content and matric pressure within thevadose zone influence and in turn are influenced byconditions in the saturated zone and atmosphere.The distribution of vadose water at a given time alsodepends on the energy state (whose componentsinclude matric and gravitational potential), wetting/drying history, and dynamics of the water itself. Ifthere is no flow, one can infer that the gradient oftotal potential is zero, so if the matric and gravita-tional components are the only significant ones, theyadd to a constant total potential. Figure 12(a) showsthis type of hydrostatic profile for the case wherea water table is present. Since the matric pressure inthis case is linear with depth and y is controlled bythe water retention properties of the medium, for auniform vadose zone, the y profile (not shown here)mimics the shape of the water retention curve. Giventime, approximate versions of such a hydrostaticprofile may develop in portions of a profile where
774 Hydrology _ Vadose Water
water movement is negligible. If water flows verti-cally downward at a steady rate in a homogeneousmedium, the total gradient must be constant, but thematric pressure does not cancel out the gravitationalpotential, as illustrated in Figure 12(b). In the generalcase of unsteady flow, the matric pressure profilecannot be determined so simply, and may take on anirregular form as in Figure 12(c).The uppermost part of the water distribution pro-
file is sometimes described in relation to field capac-ity, defined as the water content of a soil profilewhen the rate of downward flow has become negligi-ble 2 or 3 days after a major infiltration. This conceptis used in agriculture to indicate the wettest soilconditions to be considered for plant growth, andsometimes is mentioned in hydrologic investigationsrelated to soil moisture storage. The definition offield capacity requires some subjective judgment, forexample, in deciding what flow is negligible. Fieldcapacity is implicitly associated with the entire soilprofile through the root zone, including preferential-flow characteristics and, especially, flow-retardinglayers that enable layers above them to retain a highwater content.In a portion of the vadose zone immediately above
the water table, it may happen that all pores are filledwith water, held by capillary forces. The depth inter-val that is saturated but above the water table is calleda capillary fringe. In a hydrostatic profile, this cor-responds to a flat portion of the retention curvebetween saturation and an air-entry pressure. Somemedia do not have a significant capillary fringe be-cause their retention characteristics have the air-entrypressure at essentially zero. Where the water tablefluctuates, the hydrostatic equilibrium needed for a
0
20
15
10
5
0
High in
Infil
trat
ion
rate
, cm
hr−
1
Moderate in
Low in
Time
5 10
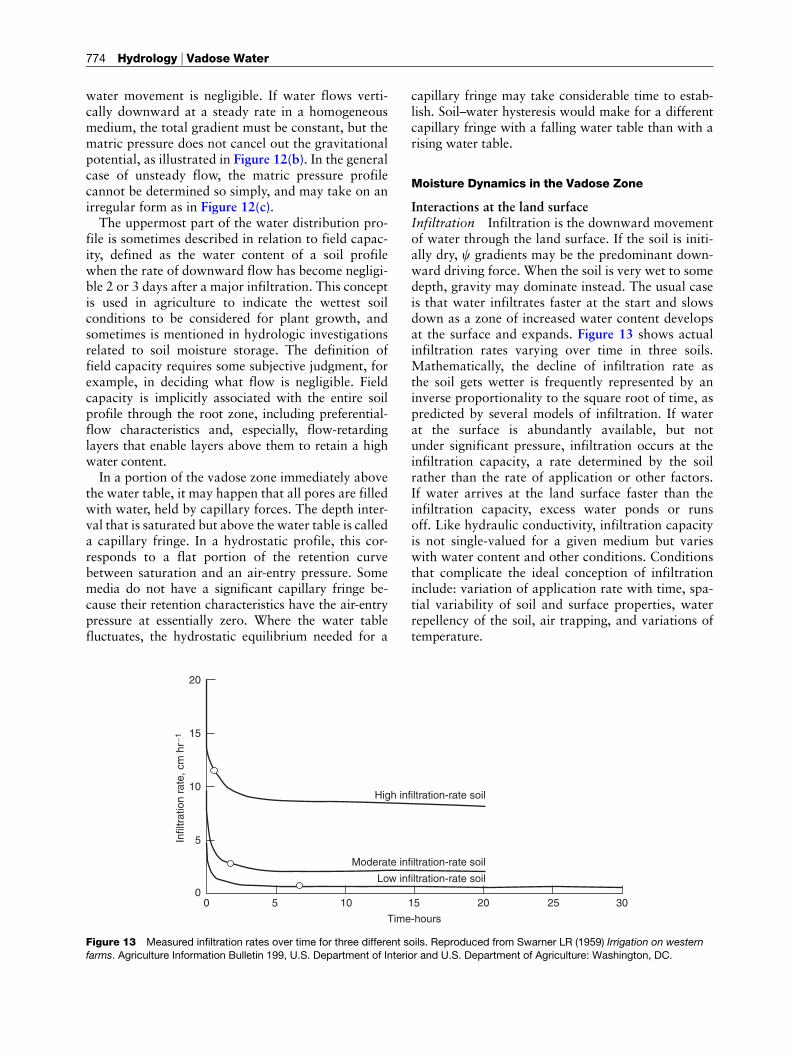
Figure 13 Measured infiltration rates over time for three different sfarms. Agriculture Information Bulletin 199, U.S. Department of Interi
capillary fringe may take considerable time to estab-lish. Soil–water hysteresis would make for a differentcapillary fringe with a falling water table than with arising water table.
Moisture Dynamics in the Vadose Zone
Interactions at the land surfaceInfiltration Infiltration is the downward movementof water through the land surface. If the soil is initi-ally dry, c gradients may be the predominant down-ward driving force. When the soil is very wet to somedepth, gravity may dominate instead. The usual caseis that water infiltrates faster at the start and slowsdown as a zone of increased water content developsat the surface and expands. Figure 13 shows actualinfiltration rates varying over time in three soils.Mathematically, the decline of infiltration rate asthe soil gets wetter is frequently represented by aninverse proportionality to the square root of time, aspredicted by several models of infiltration. If waterat the surface is abundantly available, but notunder significant pressure, infiltration occurs at theinfiltration capacity, a rate determined by the soilrather than the rate of application or other factors.If water arrives at the land surface faster than theinfiltration capacity, excess water ponds or runsoff. Like hydraulic conductivity, infiltration capacityis not single-valued for a given medium but varieswith water content and other conditions. Conditionsthat complicate the ideal conception of infiltrationinclude: variation of application rate with time, spa-tial variability of soil and surface properties, waterrepellency of the soil, air trapping, and variations oftemperature.
filtration-rate soil
filtration-rate soil
filtration-rate soil
-hours
15 20 25 30
oils. Reproduced from Swarner LR (1959) Irrigation on westernor and U.S. Department of Agriculture: Washington, DC.
Hydrology _ Vadose Water 775
Evapotranspiration The transport of water fromsoil through plants to the atmosphere (known astranspiration) and the direct transport from soil toatmosphere (known as evaporation) together con-stitute evapotranspiration. When the soil is wetenough, atmospheric conditions control the evapora-tion rate. When the soil is too dry to supply water atthe maximum rate the atmosphere can absorb, thesoil properties will control the evaporation rate.Thus there are at least two cases to consider: the
0
0
100
200
300
400
500Undisturbedhole 3
Disturbedhole 19
600(a)
(c)
100
Dep
th (
cm)
200Initial6 hr12 hr18 hr24 hr
300
400
500
6000.1 0.2 0.3 0.4
Water co
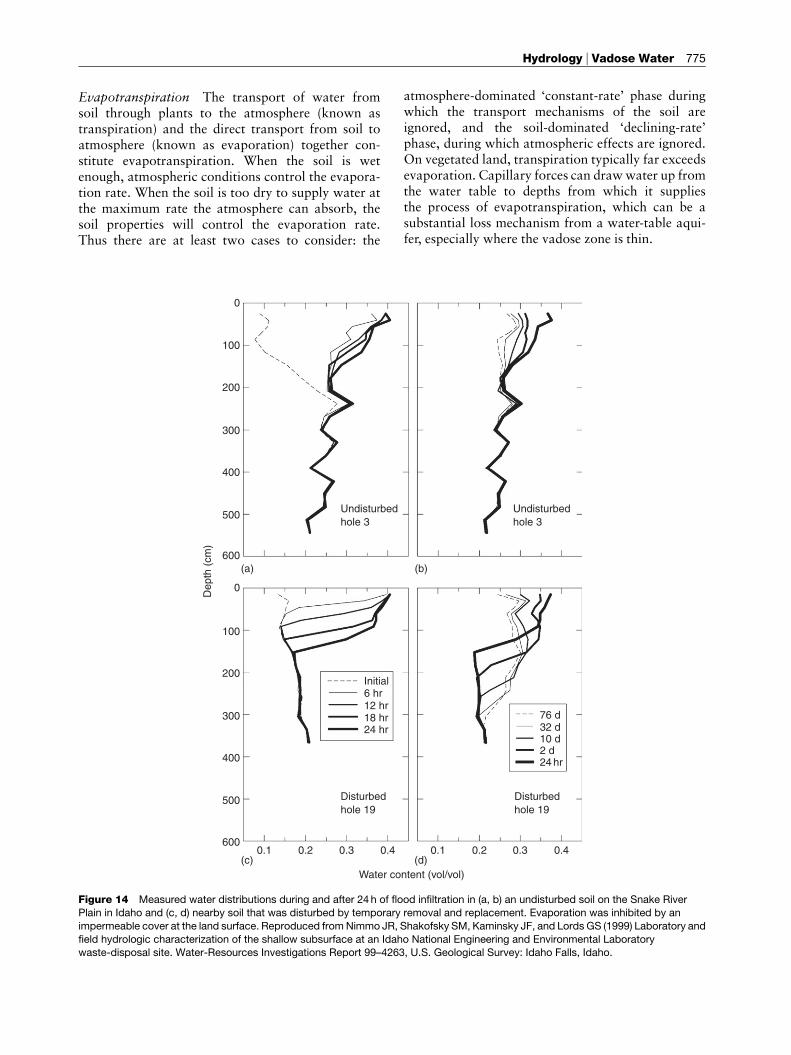
Figure 14 Measured water distributions during and after 24 h of flo
Plain in Idaho and (c, d) nearby soil that was disturbed by temporary
impermeable cover at the land surface. Reproduced fromNimmo JR, S
field hydrologic characterization of the shallow subsurface at an Idahwaste-disposal site. Water-Resources Investigations Report 99–4263
atmosphere-dominated ‘constant-rate’ phase duringwhich the transport mechanisms of the soil areignored, and the soil-dominated ‘declining-rate’phase, during which atmospheric effects are ignored.On vegetated land, transpiration typically far exceedsevaporation. Capillary forces can drawwater up fromthe water table to depths from which it suppliesthe process of evapotranspiration, which can be asubstantial loss mechanism from a water-table aqui-fer, especially where the vadose zone is thin.
Disturbedhole 19
Undisturbedhole 3
(d)
(b)
76 d32 d10 d2 d24 hr
0.1
ntent (vol/vol)
0.2 0.3 0.4
od infiltration in (a, b) an undisturbed soil on the Snake River
removal and replacement. Evaporation was inhibited by an
hakofsky SM, Kaminsky JF, and Lords GS (1999) Laboratory and
o National Engineering and Environmental Laboratory, U.S. Geological Survey: Idaho Falls, Idaho.
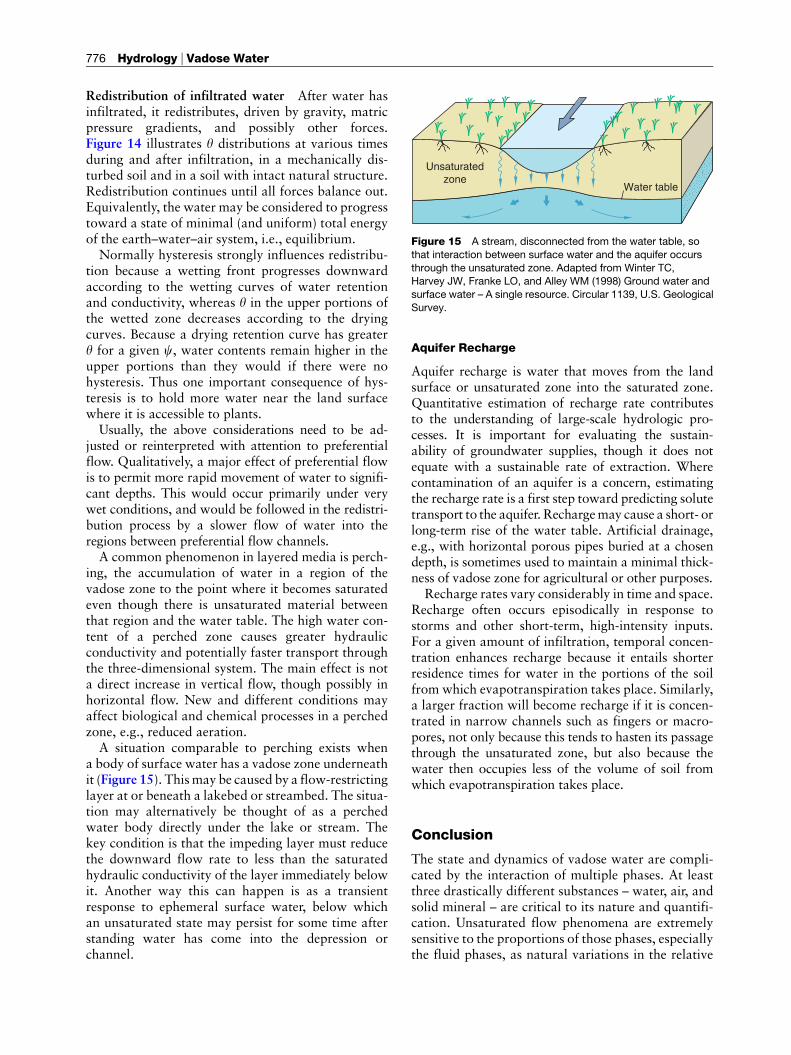
Unsaturatedzone
Water table
Figure 15 A stream, disconnected from the water table, so
that interaction between surface water and the aquifer occurs
through the unsaturated zone. Adapted from Winter TC,Harvey JW, Franke LO, and Alley WM (1998) Ground water and
surface water – A single resource. Circular 1139, U.S. Geological
Survey.
776 Hydrology _ Vadose Water
Redistribution of infiltrated water After water hasinfiltrated, it redistributes, driven by gravity, matricpressure gradients, and possibly other forces.Figure 14 illustrates y distributions at various timesduring and after infiltration, in a mechanically dis-turbed soil and in a soil with intact natural structure.Redistribution continues until all forces balance out.Equivalently, the water may be considered to progresstoward a state of minimal (and uniform) total energyof the earth–water–air system, i.e., equilibrium.Normally hysteresis strongly influences redistribu-
tion because a wetting front progresses downwardaccording to the wetting curves of water retentionand conductivity, whereas y in the upper portions ofthe wetted zone decreases according to the dryingcurves. Because a drying retention curve has greatery for a given c, water contents remain higher in theupper portions than they would if there were nohysteresis. Thus one important consequence of hys-teresis is to hold more water near the land surfacewhere it is accessible to plants.Usually, the above considerations need to be ad-
justed or reinterpreted with attention to preferentialflow. Qualitatively, a major effect of preferential flowis to permit more rapid movement of water to signifi-cant depths. This would occur primarily under verywet conditions, and would be followed in the redistri-bution process by a slower flow of water into theregions between preferential flow channels.A common phenomenon in layered media is perch-
ing, the accumulation of water in a region of thevadose zone to the point where it becomes saturatedeven though there is unsaturated material betweenthat region and the water table. The high water con-tent of a perched zone causes greater hydraulicconductivity and potentially faster transport throughthe three-dimensional system. The main effect is nota direct increase in vertical flow, though possibly inhorizontal flow. New and different conditions mayaffect biological and chemical processes in a perchedzone, e.g., reduced aeration.A situation comparable to perching exists when
a body of surface water has a vadose zone underneathit (Figure 15). Thismay be caused by a flow-restrictinglayer at or beneath a lakebed or streambed. The situa-tion may alternatively be thought of as a perchedwater body directly under the lake or stream. Thekey condition is that the impeding layer must reducethe downward flow rate to less than the saturatedhydraulic conductivity of the layer immediately belowit. Another way this can happen is as a transientresponse to ephemeral surface water, below whichan unsaturated state may persist for some time afterstanding water has come into the depression orchannel.
Aquifer Recharge
Aquifer recharge is water that moves from the landsurface or unsaturated zone into the saturated zone.Quantitative estimation of recharge rate contributesto the understanding of large-scale hydrologic pro-cesses. It is important for evaluating the sustain-ability of groundwater supplies, though it does notequate with a sustainable rate of extraction. Wherecontamination of an aquifer is a concern, estimatingthe recharge rate is a first step toward predicting solutetransport to the aquifer. Rechargemay cause a short- orlong-term rise of the water table. Artificial drainage,e.g., with horizontal porous pipes buried at a chosendepth, is sometimes used to maintain a minimal thick-ness of vadose zone for agricultural or other purposes.
Recharge rates vary considerably in time and space.Recharge often occurs episodically in response tostorms and other short-term, high-intensity inputs.For a given amount of infiltration, temporal concen-tration enhances recharge because it entails shorterresidence times for water in the portions of the soilfrom which evapotranspiration takes place. Similarly,a larger fraction will become recharge if it is concen-trated in narrow channels such as fingers or macro-pores, not only because this tends to hasten its passagethrough the unsaturated zone, but also because thewater then occupies less of the volume of soil fromwhich evapotranspiration takes place.
Conclusion
The state and dynamics of vadose water are compli-cated by the interaction of multiple phases. At leastthree drastically different substances – water, air, andsolid mineral – are critical to its nature and quantifi-cation. Unsaturated flow phenomena are extremelysensitive to the proportions of those phases, especiallythe fluid phases, as natural variations in the relative
Hydrology _ Vadose Water 777
amounts of water and air can cause a property likehydraulic conductivity to vary over many ordersof magnitude. When the flow of vadose water isdiffuse in character, it can be treated quantitativelywith Darcy’s law adapted for unsaturated flow, andwith Richards’ equation. When it occurs within pref-erential pathways, there are various models, none yetgenerally accepted, to quantify the flow. The state anddynamics of vadose water control or contribute to awide variety of processes within the hydrologic cycle,including infiltration, evapotranspiration, infiltrationand runoff, and aquifer recharge.
See also: Atmospheric Water and Precipitation;Evapotranspiration; Ground Water; Hydrological Cycleand Water Budgets.
Further Reading
Bear J and Bachmat Y (1990) Introduction toModeling Phenomenaof Transport in Porous Media. Dordrecht, Netherlands: Kluwer.
Dane JH and Topp GC (2002) Methods of Soil Analysis,Part 4 – Physical Methods. Madison, WI: Soil Science Societyof America.
Gardner WH (1986) Early soil physics into the mid-20th century.
In: Stewart BA (ed.) Advances in Soil Science, vol. 4, pp. 1–101.New York: Springer-Verlag.
Germann PF and DiPietro L (1996) When is porous-media flow
preferential? A hydromechanical perspective. Geoderma 74:
1–21.
Hillel D (1998) Environmental Soil Physics. San Diego: AcademicPress.
Simunek J, Jarvis NJ, van Genuchten MT, and Gardenas A (2003)
Review and comparison of models for describing non-equilibrium
and preferential flow and transport in the vadose zone. Journal ofHydrology 272: 14–35.
Jury WA and Horton R (2004) Soil Physics. New York: Wiley.
Nimmo JR (2005) Unsaturated zone flow processes. In: AndersonMG and Bear J (eds.) Encyclopedia of Hydrological Sciences,vol. 4, pp. 2299–2322. Chichester, UK: Wiley.
Nimmo JR (2007) Simple predictions of maximum transport rate in
unsaturated soil and rock. Water Resources Research 43:W05426, doi:10.1029/2006WR005372.
Scanlon BR, Tyler SW, andWierenga PJ (1997) Hydrologic issues in
arid unsaturated systems and implications for contaminant
transport. Reviews of Geophysics 35: 461–490.