empirical evidence on the determinants of tfp and...
TRANSCRIPT

Empirical Evidence on the
Determinants of TFP and Its Role
in the Growth of Innovation-Driven
Economies
Hag-Soo Kim*1
This paper provides some empirical evidence for R&D stock,
openness, and economic freedom that foster the growth of TFP.
However, it finds no empirical evidence for markup price and non-
constant returns to scale, implying the growth rate of TFP measured
as the Solow residual reflects the true productivity growth. In
addition, it also suggests empirical evidence for the enlarged role
of TFP in the growth of innovation-driven economies by exploring
two dynamic panel models specifying the relationship among TFP,
investment, and employment. Based on these main findings, I
suggest a few policy implications for Korea to fully utilize the role
of TFP in the growth of the Korean economy that is transitioning
to or has already transitioned to an innovation-driven economy.
Keywords: Total factor productivity (TFP), Growth, R&D, Openness,
Economic freedom
JEL Classification: O30, O43, O47
I. Introduction
Total factor productivity (TFP) has been recognized for a long time as
an important source of economic growth. The growth rate of TFP,
measured as the Solow residual in the growth accounting, captures
* Research Fellow, Korea Economic Research Institute, 8th Fl., HanaDaetoo
Securities Bldg., 27-3, Yoido-Dong, Yongdungpo-Gu, Seoul 150-705, Korea, (Tel)
+82-2-3771-0022, (Fax) +82-2-785-0273, (E-mail) [email protected]. Paper pres-
ented at the 16th Seoul Journal of Economics International Symposium held at
Seoul National University, Seoul, 27 November 2008.
[Seoul Journal of Economics 2009, Vol. 22, No. 1]

SEOUL JOURNAL OF ECONOMICS56
changes in the amount of output that cannot be explained by changes
in traditional factor inputs such as labor and capital. More intuitively,
an increase in TFP shifts out the production function at a given
quantity of factor inputs so that more output can be produced with the
same factor inputs.
Since the growth rate of TFP is measured as a residual including
everything but changes in labor and capital, many factors may cause
changes in TFP. Technological innovation is said to be an important
determinant of TFP. It also comprises many other factors such as
institutional changes, changes in societal behavior, changes in factor
shares, fluctuations in demand, other omitted variables, and measure-
ment errors. Even if we could guess and name as many factors as
possible, these factors are not directly and separately observed or
measured but summed together as a residual.1
In addition, TFP is measured under the assumptions of constant
returns to scale and perfect competition, which are the standard
assumptions of a neoclassical model of production. As explained in
Hulten (2000), these assumptions are sources of possible bias in TFP.
However, the assumption of constant returns to scale is required to
estimate the return to capital, which is closely related to the GDP
accounting identity and the production function. In practice, the
growth rate of TFP is measured using a Cobb-Douglas production
function that is homogeneous of degree 1 with respect to labor and
capital. When the perfect competition is violated so that price is greater
than marginal cost, Hall (1988, 1990) shows that the growth rate of
TFP measured as the Solow residual does not reflect the true produc-
tivity growth any more.
Kee (2002) relaxes these two assumptions and shows that the
traditional TFP measure will have a downward bias in the presence of
imperfect competition or decreasing returns to scale technology. She
also shows that in the presence of imperfect competition the theoretical
difference between primal and dual TFP growth measures will vanish if
factor shares in revenue are held constant.2 This result is contrary to
Roeger (1995) showing that markup greater than one could explain the
difference between the primal and dual TFP measures based upon U.S.
1 Abramovitz (1956) put TFP as ‘measure of our ignorance.’2The primal TFP growth rate is measured from the production function and
the dual one is from the cost function. The constant factor shares are one of
stylized facts of empirical studies.

DETERMINANTS AND EFFECTS OF TFP GROWTH 57
manufacturing data.
As briefly discussed above, TFP is measured under the assumptions
of both perfect competition and constant returns to scale; furthermore,
as it is measured, it consists of many determinants in addition to what
we are really trying to isolate. This paper investigates the validity of
two assumptions mentioned above using panel data on 20 OECD
countries from 1985 to 2006.3 It also provides some empirical evidence
for major determinants of TFP such as research and development
stock, openness to international trade, and economic freedom. In
addition, it is also investigated how changes in the TFP affect two
major macroeconomic variables, investment and employment.
This paper is organized as follows. Section 2 presents a basic model
for the determinants of TFP and regression results with the evidence
for economic freedom measures as a determinant of TFP. Section 3
describes how investment and employment will respond to changes in
TFP in the short-run versus the long-run. The last section concludes
by suggesting some policy implications.
II. Empirical Study on the Determinants of TFP
A. Basic Model
Suppose that the output of an economy is defined as a Cobb-
Douglas production function that is homogeneous of degree 1 with
respect to factor inputs.
Yt=TFPt Kt1-θLt
θ, (1)
where TFPt , Kt , Lt , θ , and Yt denote total factor productivity, capital
stock, work hours, labor income share, and total output (GDP),
respectively.4 From equation (1) the growth rate of TFP can be easily
deduced as follows:
3The major reason that I choose to use OECD country level data instead of
industry level data like EU KLEMS data is hard to get industry level data for
R&D investment and economic freedom indices, which are major determinants
of TFP as will be shown in later section.4In some literature, equation (1) is defined using capital stock accumulated
until the last period instead of current period. However, the empirical results
presented below are not quite different from the case of using capital stock
accumulated until the last period.
SEOUL JOURNAL OF ECONOMICS58
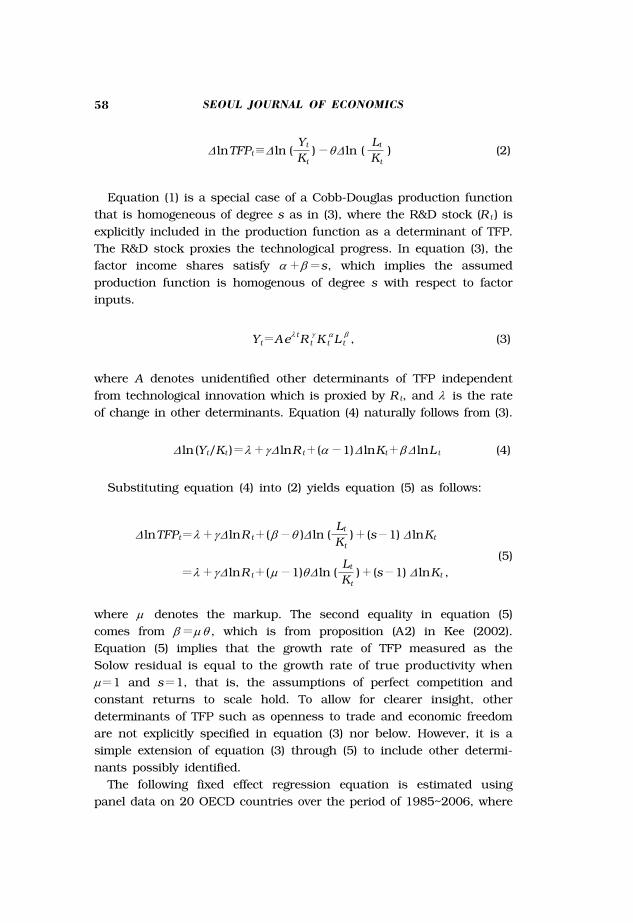
Δ lnTFPt≡Δ ln (Yt
)-θΔ ln (Lt
) (2)Kt Kt
Equation (1) is a special case of a Cobb-Douglas production function
that is homogeneous of degree s as in (3), where the R&D stock (Rt ) is
explicitly included in the production function as a determinant of TFP.
The R&D stock proxies the technological progress. In equation (3), the
factor income shares satisfy α+β=s, which implies the assumed
production function is homogenous of degree s with respect to factor
inputs.
Yt=Aeλ tR tγ Kt
αLtβ , (3)
where A denotes unidentified other determinants of TFP independent
from technological innovation which is proxied by Rt, and λ is the rate
of change in other determinants. Equation (4) naturally follows from (3).
Δ ln(Yt/Kt )=λ+γ Δ lnRt+(α-1)Δ lnKt+β Δ lnLt (4)
Substituting equation (4) into (2) yields equation (5) as follows:
Δ lnTFPt=λ+γ Δ lnRt+(β-θ )Δ ln (
Lt)+(s-1) Δ lnKt Kt
(5)
=λ+γ Δ lnRt+(μ-1)θΔ ln (Lt
)+(s-1) Δ lnKt ,Kt
where μ denotes the markup. The second equality in equation (5)
comes from β=μ θ , which is from proposition (A2) in Kee (2002).
Equation (5) implies that the growth rate of TFP measured as the
Solow residual is equal to the growth rate of true productivity when
μ=1 and s=1, that is, the assumptions of perfect competition and
constant returns to scale hold. To allow for clearer insight, other
determinants of TFP such as openness to trade and economic freedom
are not explicitly specified in equation (3) nor below. However, it is a
simple extension of equation (3) through (5) to include other determi-
nants possibly identified.
The following fixed effect regression equation is estimated using
panel data on 20 OECD countries over the period of 1985~2006, where

DETERMINANTS AND EFFECTS OF TFP GROWTH 59
ci and ct denote country-specific effect and time effect, respectively:5
Δ lnTFPit=ci+ct+c1Δ lnRit+c2θΔ ln (Lit
)+c3Δ lnKit+ε it (6)Kit
The estimated coefficient on θ Δ ln(Lit/Kit ) will point out the existence
of markup price if the estimated c2 is statistically greater than 0
implying μ-1>0⇒ μ>1. The estimated coefficient on Δ ln (Kit ) in-
dicates the existence of non-constant returns to scale if the estimated
c3 is statistically different from 0 implying s>1 or s<1. Therefore, it
can be inferred from the estimated coefficients of c2 and c3 whether or
not the standard neoclassical assumptions are violated. If these estimated
coefficients are not statistically significant, the Solow residual reflects
the true productivity growth.
B. Estimation Results of Basic Model
In this section, the regression results of equation (6) will be pres-
ented including openness to trade as an additional determinant of TFP.
Openness to trade is defined as the ratio of trade to GDP. Two openness
variables can be defined as follows: one is the ratio of imports only to
GDP (OM1it ) and the other is the ratio of the sum of imports and
exports to GDP (OM2it ). Even if the conventional openness measure
has been usually defined in the literature as the ratio of the sum of
imports and exports to GDP, OM1it is additionally defined to examine
more specifically whether the openness of the domestic market to other
countries fosters TFP growth.6 In order to examine if the regression
results are time invariant, regression results are also presented for two
sub-sample periods: 1985~1995 and 1996~2006.
Looking at the table 1 that shows the regression results of equation
(6) including two openness measures as additional explanatory variables,
there is no empirical evidence for the violation of two standard assump-
5See the appendix at the end of this paper for the details about the countries
included in the analysis, the data sources, and availability.6Nicoletti and Scarpetta (2003), Dawson (1998, 2006), Gwartney et al. (2004)
and other literatures show also that less stringent economic regulations or more
economic freedom foster the growth of TFP or long-run economic performance
indicators such as investment, labor productivity and the growth of GDP. We
consider the effect of economic freedom measures as another determinant of
TFP in the following subsection.

SEOUL JOURNAL OF ECONOMICS60
tions discussed above in any sub-sample periods. Both estimated
coefficients on θΔ ln (Lit/Kit-1) and Δ ln (Kit-1) are not significant even at
the 10% level. This implies that the growth rate of TFP measured as
the Solow residual reflects the true productivity growth rate and there
is no empirical evidence for markup pricing behavior or non-constant
returns to scale over the sample period or two sub-sample periods.
That is to say, the assumptions maintained to measure the growth rate
of TFP for each country are valid over the period of 1985~2006. This
result is in direct contrast to the main empirical finding of Kee (2002)
that all industries in Singapore’s manufacturing sector violated at least
one of those two assumptions. Such difference may be due to the level
of data used in the regressions. Here, the country level data were used
while Kee (2002) used the industry level data.
The estimated coefficients on the growth rate of R&D stock (Δ ln(Rit ))
indicating technological innovation are significant at the 5% level at
least for both the whole sample period and the sub-sample period of
1996~2006. The regression results indicate that TFP increases about
0.06% as the research and development stock increases by 1%. The
estimated coefficients on the change in the imports share in GDP
(ΔOM1it ) are found to be significant at 1% level in the regression with
the whole sample period and two sub-sample periods. As imports share
in GDP increases by 1% point, TFP increases by 0.1~0.2%. The
regression results also show that the responsiveness of TFP to the
openness of the domestic market became smaller in the second
sub-sample period of 1996~2006 than the first sub-sample period.
However, the estimated coefficient on the conventional openness
measure (ΔOM2it ) is significant only in the regression with the first
sub-sample period of 1985~1995.
From the regression results discussed above, three points can be
inferred. First, at the aggregate level, there is no empirical evidence for
markup pricing or non-constant returns to scale, which implies that
conventionally measured growth rate of TFP represents the true
productivity growth rate. Second, the growth rate of R&D stock seemed
to become a major determinant of TFP since the mid of 1990s. In
addition, the effect on the growth of TFP gets larger and more
significant in the second sub-sample period. The last inference that
could be made from this analysis is that the openness measure as a
determinant of TFP would be more appropriate to be defined as the
imports share in GDP and TFP responds less sensitively to the change
in openness as the economy grows.7

DETERMINANTS AND EFFECTS OF TFP GROWTH 61
TABLE 1
CROSS-COUNTRY TFP REGRESSION RESULTS, 1985~2006
Variable 1985~1995 1996~2006 1985~2006
Δ ln(Rit) 0.0458 0.0469 0.0636** 0.0597** 0.0612 * 0.0637*
(0.0298) (0.0313) (0.0282) (0.0271) (0.0197) (0.0210)
θΔ ln(Lit/Kit) -0.0011 -0.0011 -0.0024 -0.0024 -0.0022 -0.0022
(0.0014) (0.0014) (0.0029) (0.0028) (0.0014) (0.0014)
Δ ln(Kit) -0.1069 -0.0548 -0.2259 -0.1914 -0.0934 -0.0900
(0.1029) (0.1053) (0.1773) (0.1815) (0.0684) (0.0669)
ΔOM1it 0.2029*-
0.1133*-
0.1161*-
(0.0653) (0.0398) (0.0331)
ΔOM2it-
0.0975*-
-0.0029-
0.0280
(0.0278) (0.0460) (0.0265)
R ̅2 0.35 0.35 0.39 0.37 0.34 0.32
DW-stat 1.74 1.67 2.13 1.98 1.67 1.65
No. of Countries 18 18 20 20 20 20
No. of Obs. 158 158 201 201 359 359
Notes: 1) *, **, and *** indicate statistical significance at the 1%, 5%, and
10%, respectively.
2) Parentheses contain White’s standard errors.
3) The dependent variable is Δ ln(TFPit ) and both time and individual
fixed effect dummies are included.
C. Economic Freedom and the Growth of TFP
It is not easy to find both theoretical and empirical researches on how
much and through which channel reforming regulations or enhancing
economic freedom will improve economic performance. However, it might
not be too strong to assume that regulations imposed by governments
will possibly do deteriorate the economic efficiency of resource alloca-
tion as well as the voluntary participation of economic agents in those
regulated economic activities. It may be regarded that the economic
performance indicators will be affected by the stringency of regulations
in an economy. The stringency of regulation can be interpreted as a
part of economic freedom given in the economy. Therefore, it can be
7Someone may raise a question that human capital and capacity utilization
should be considered as determinants of TFP. This research does not consider
other determinants than those included in table 1 and 2 because human capital
accumulation for each country is hard to measure and capacity utilization rate
denoting fluctuation in demand side could be controlled by both individual and
time specific dummies.

SEOUL JOURNAL OF ECONOMICS62
said in general that the long-run economic performance of an economy
will be improved by less stringent regulation and more economic
freedom through encouraging more voluntary participation of economic
agents and enhancing the efficiency of resource allocation.
Nicoletti and Scarpetta (2003) suggest empirical evidence that pro-
competitive regulatory reforms and privatization policies tend to boost
the growth of TFP using 18 OECD countries data over the period of
1984~1998. This work appears to be the only research that inves-
tigates the direct relationship between TFP and regulatory reform.
However, it has a caveat that there is no proxy variable for techno-
logical innovation in the specification. This implies that the effect of
regulatory reform on the growth of TFP could be overestimated.
Other literatures such as Dawson (1998, 2006) and Gwartney et al.
(2004) provide empirical results for the existence of a positive relationship
between regulatory reform or economic freedom and economic perfor-
mance indicators such as GDP growth, investment ratio to GDP, and
labor productivity, implicitly assuming a positive relationship between
the TFP growth and regulatory reform or economic freedom. They do
not explicitly address how much of the TFP growth will be improved by
reforming regulations and enhancing economic freedom. They both
explain that regulatory reform or economic freedom will directly foster
the GDP growth through the improvement of TFP and indirectly
through an increase in investment.8
In order to grasp the effect of economic freedom or regulatory reform
on the TFP growth, equation (6) is estimated with the openness
variable defined in subsection 2.1 and a variable measuring the
improvement of economic freedom. I define 4 kinds of dummy variables
representing the improvement of economic freedom based upon EFW
(Economic Freedom of the World) by the Fraser institute. The first
dummy variable is ER indicating an improvement of rating for regulation
of credit, labor, and business. The second one is EF, which indicates
an improvement of rating for overall economic freedom. These two
dummies take the value 1 if each rating for the current survey is
strictly greater than the last survey. The third and fourth ones are
defined using the rank of overall rating for economic freedom. The rank
8Nicoletti and Scarpetta (2003) uses industry level OECD STAN data set and
the OECD indicators for production market regulation surveyed in 1998. On the
other hand, Dawson (1998, 2006) and Gwartney et al. (2004) use indices for
Economic Freedom of the word surveyed by Fraser Institute since 1975.

DETERMINANTS AND EFFECTS OF TFP GROWTH 63
TABLE 2
ECONOMIC FREEDOM AS A DETERMINANT OF TFP
Variable BaselineEconomic
Regulation
Freedom
IndexRank
Rank
Percentile
Δln(Rit) 0.0779*** 0.0772*** 0.0751*** 0.0609*** 0.0878**
(0.0432) (0.0424) (0.0411) (0.0338) (0.0397)
θΔln(Lit/Kit) -0.0021 -0.0024 -0.0023 -0.0021 -0.0027
(0.0018) (0.0016) (0.0017) (0.0017) (0.0017)
Δln(Kit) -0.1236 -0.1453 -0.1256 -0.1163 -0.1658
(0.1621) (0.1602) (0.1554) (0.1581) (0.1413)
ΔOM2it 0.0353* 0.0341* 0.0340* 0.0348* 0.0334*
(0.0107) (0.0108) (0.0100) (0.0071) (0.0091)
ER dummy
-0.3339
- - -(0.3220)
EF dummy
- -0.4932
- -(0.3528)
Rank dummy - - -
0.7327**-
(0.2766)
5% dummy
- - - -1.1792*
(0.3650)
R ̅2 0.56 0.57 0.57 0.64 0.61
DW-stat 2.26 2.30 2.08 2.18 2.40
No. of Countries 20 20 20 20 20
No. of Obs. 70 70 70 70 70
Notes: 1) *, **, and *** indicates statistical significance at the 1%, 5%, and
10%, respectively.
2) Parentheses contain white’s standard errors.
3) The dependent variable is Δ ln (TFPit ) and both time and individual
fixed effect dummies are included.
4) ER-, EF-, and Rank dummy are defined as X dummyit=1(Xit>Xit-1)
and 5% dummy is defined as 5% dummyit=1(Rank Percentileit≤
0.05).
dummy takes the value 1 for an improvement of overall rank while the
5% dummy takes the value 1 if the rank percentile of individual
country is within the top 5%.
All the regression results in table 2 are based on only every 5-year
observation from 1985 to 2005 for 20 OECD countries since the
indices for economic freedom of the world were published once every
5-year until the year 2000. In table 2, five different regression results
are presented: a baseline regression result without any dummy for
economic freedom and four regression results specifying each dummy
for economic freedom in the baseline regression equation.

SEOUL JOURNAL OF ECONOMICS64
The estimated coefficients on the variables included in the baseline
equation are not different qualitatively from the empirical findings
presented in table 1. There is no evidence for markup or non-constant
returns to scale, but the results indicate that TFP growth is boosted by
the growth of R&D stock or the increase in openness.9 These empirical
findings are still valid even in other cases including some of economic
freedom measures.
The estimated coefficients on the 4 dummies for economic freedom
do not suggest clear cut inferences about the role of economic freedom
on the growth of TFP. For the cases of dummies generated from the
rating scores, it cannot be inferred from the estimated coefficients for
both the ER dummy and the EF dummy that greater economic freedom
indicated by higher rating than previous observation does foster the
TFP growth. For the cases of dummies related to rank, however, the
estimated coefficients for the rank dummy and the 5% dummy are
positive and statistically significant at the 5% and 1% level, respectively.
It can be inferred from this result that the TFP growth is higher on
average when the rank for overall evaluation of economic freedom of an
economy is improved over previous evaluation or when the economic
freedom of an economy is ranked within the top 5%.10
Although the regression results of 4 different dummies for economic
freedom do not strongly support without exception that the improve-
ment of economic freedom will result in a higher growth rate of TFP, I
could find some empirical evidence for the claim that the economic
freedom of an economy would be another determinant of TFP. Therefore,
policy makers should consider institutional improvements to enhance
economic freedom as well as the increase in R&D and openness in
order to improve TFP.
III. The Effects of TFP on Investment and Employment
It has been discussed up to this point what will determine the total
9In table 2, I tabulate the regression results with the openness measure
defined as the change in the ratio of trade amount to GDP (ΔOM2it ). When the
imports share in GDP (ΔOM1it ) is included instead, the regression results are
almost the same except for the magnitude of the estimated coefficient on the
openness measure. The estimated coefficients on ΔOM2it is about half of those
on ΔOM1it .10 I tried other dummies related to rank percentile such as 10% and 20%
dummy but those are not significant even at 10% level.

DETERMINANTS AND EFFECTS OF TFP GROWTH 65
factor productivity of an economy. I can infer from the results of
section 2 that the growth of TFP is boosted by the growth of R&D
stock, higher openness to international trade, and institutional im-
provements to enhance economic freedom. As shown in equation (1),
TFP growth causes GDP growth directly for every given stock of capital
and labor. This implies that the increase in TFP shifts out the
production possibility frontier (PPF) in the space of capital and labor.
As the PPF shifts according to a change in TFP, the combination of
capital and labor can be altered. That is to say, changes in TFP might
result in different quantities of capital and/or labor being optimal.
In the related literature, it is hard to find research work addressing
the relationships among TFP, investment, and employment using
country-level aggregate data. Most of the literature focuses on
investigating those relationships with firm-level data. Specially, it
focuses on the relationship between innovation in technology and
employment. For example, Peters (2004), Brower et al. (1993), and Hall
et al. (2007) classify the firm level innovation in technology into two
categories, process innovation and product innovation, and they
analyze the effect of each innovation on the growth of employment.11
However, their findings contradict each other. Peters (2004) found,
using firm level survey data named Community Innovation Survey, that
process innovation reduces employment in German firms while product
innovation increases it. However, Hall et al. (2007) concluded that they
could not find any empirical evidence for the substitution effect of
process innovation on employment in Italian firms over the period of
1995~2003. On the other hand, Brower et al. (1993) presented empirical
evidence for both the positive effect of product innovation on employment
and the negative effect of overall innovation measured by R&D on
employment during the1980’s in Netherlands. Besides these results,
Zimmerman (1991) and Piva and Vaivarelli (2005) also suggested
contradicting results. Zimmerman (1991) presented the negative
relationship between overall innovation and employment using German
firm level cross section data while Piva and Vaivarelli (2005) found a
small but significantly positive effect of overall innovation on the
employment of Italian firms.
Exploring the relationship between TFP and important macro-variables
11Process innovation is technological improvements or new technology to
produce existing products while product innovation means those to products
that could not be produced with old technology before new innovation.

SEOUL JOURNAL OF ECONOMICS66
such as investment and employment, I might deduce about the role of
TFP in the growth of innovation-driven economies and find some
grounds for the adequacy of policies to improve TFP. For this purpose,
two dynamic panel models with equation (7) and (8) are set up, using
20 OECD countries’ annual observations from 1985 to 2006.
Δ lnGFCFit=α 1Δ lnGFCFit-1+α 2Δ lnTFPit+α 3
EXGSit-1
GDPit-1(7)
+α 4
GDPSit-1+η 1i+μ 1t+ε1it
GDPit-1 ,
Δ lnEMPit=β1Δ lnEMPit-1+β2Δ lnTFPit+β3Δ lnGFCFit (8)
+β4
EXGSit-1+β5
GDPS
it-1+η 2i+μ 2t+ε2it
GDPit-1 GDPit-1 ,
where GFCF, EMP, EXGS, and GDPS denote gross fixed capital
formation, total employment, the sum of imports and exports of goods
and services, and service sector GDP. In addition, η.i and μ.t are
individual country specific fixed effect and year specific fixed effect
while ε.it are random errors satisfying usual orthogonal condition for
GMM estimation suggested by Arellano and Bond (1991) that will be
employed in this section.
Besides the variables in equation (7) and (8), I include the 1-period
lagged openness (EXGSit-1/GDPit-1) and the lagged service sector’s GDP
share (GDPSit-1/GDPit-1) to control for individual countries’ characteris-
tics that could affect the impact of key explanatory variables on
dependent variables. Since equations (7) and (8) are usual dynamic
panel models including 1-period lagged dependent variables as an
explanatory variable to assess long-run effects later, usual fixed effect
estimation results are inconsistent as pointed out by Nickell (1981)
even if explanatory variables other than 1-period lagged dependent
variables are exogenous. However, it may not be even ascertained that
TFP, investment, and employment do not have simultaneity at all in
period t, which implies they are not exogenous. Therefore, in order to
get consistent estimates, GMM method suggested by Arellano and Bond
(1991) is applied using predetermined endogenous variables properly as
instrumental variables. Before looking at the estimated coefficients in
detail, I first examine the Sargan test results for the null hypothesis of
the validity of instrumental variables used in the estimation. The
DETERMINANTS AND EFFECTS OF TFP GROWTH 67
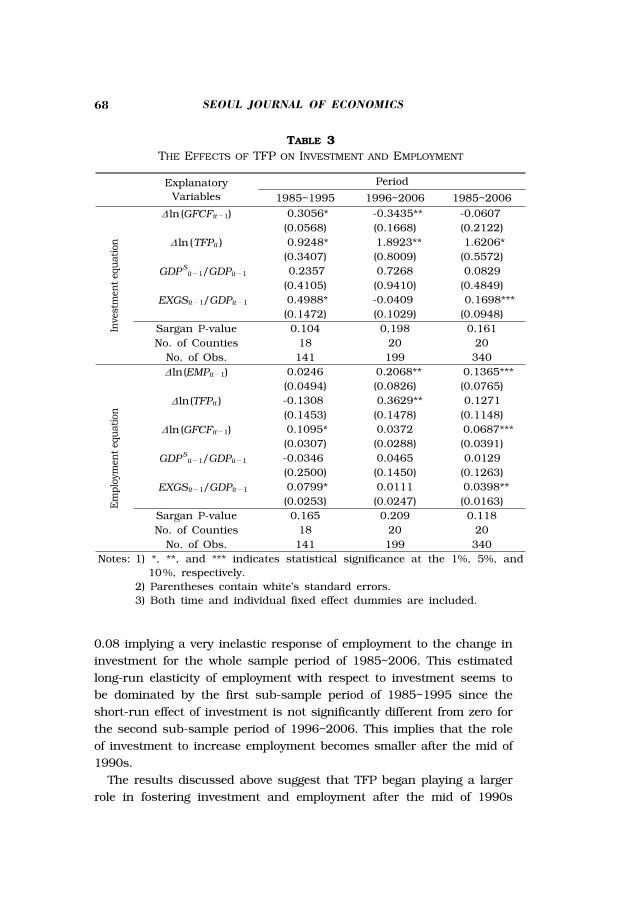
reported p-values for Sargan test statistics in table 3 indicate no
evidence for rejecting the null hypothesis even at the significance level
of 10%.12
Table 3 presents the estimation results of equations (7) and (8) for
each corresponding sample period. For the whole sample period of
1985~2006, TFP growth and higher openness increase investment
while the estimated coefficient on the last year’s GDP share of the
service sector is insignificant. The short-run effect of TFP on investment
is estimated as 1.6 and statistically significant at the 1% level. The
long-run effect of TFP on investment is estimated as 1.5. However, it
should be used with a caution since the coefficient on the lagged
investment is not significant. For the first sub-sample period of
1985~1995, the lagged investment turned out to have a statistically
non-zero coefficient and the long-run effect of TFP on investment is
estimated as 1.3 while the short-run effect is 0.9. For the second
sub-sample period of 1996~2006, the long-run effect of TFP is
estimated as 1.4 while the short-run effect is about 1.9. Therefore, it
may be inferred that the long-run effect of TFP on investment is
approximately 1.3~1.5, which implies that investment is elastically
responsive to the improvement of TFP. In addition, the regression
results show that the short-run effect of TFP on investment is
estimated larger for the second sub-sample period than the first one,
which indicates that the role of TFP increases in the growth of
economy around OECD area.
The long-run effect of TFP on employment is quite ambiguous except
for the second sub-sample period of 1996~2006 since the short-run
effects of TFP on employment are insignificant for both the whole
sample period and the first sub-sample period of 1985~1995. For the
second sub-sample period, the long-run effect of TFP on employment is
about 0.5, which implies that the response of employment is quite
inelastic to the change in TFP. However, the estimated coefficient on
TFP is negative for the first sub-sample period even if it is not
significant. This could be thought of as evidence for the enlarged role
of TFP in the growth of innovation-driven economies. In addition, the
increase in TFP could boost employment indirectly through the
increase in investment.
The long-run effect of investment on employment is estimated at
12 Sargan test statistic follows asymptotically a chi-square distribution with
the number of over identifying restrictions as its degrees of freedom.
SEOUL JOURNAL OF ECONOMICS68
TABLE 3
THE EFFECTS OF TFP ON INVESTMENT AND EMPLOYMENT
Explanatory
Variables
Period
1985~1995 1996~2006 1985~2006
Δ ln (GFCFit-1) 0.3056* -0.3435** -0.0607
(0.0568) (0.1668) (0.2122)
Δ ln (TFPit ) 0.9248* 1.8923** 1.6206*
(0.3407) (0.8009) (0.5572)
GDPS
it-1/GDPit-1 0.2357 0.7268 0.0829
(0.4105) (0.9410) (0.4849)
EXGSit-1/GDPit-1 0.4988* -0.0409 0.1698***
(0.1472) (0.1029) (0.0948)
Sargan P-value 0.104 0.198 0.161
No. of Counties 18 20 20
No. of Obs. 141 199 340
Δln(EMPit-1) 0.0246 0.2068** 0.1365***
(0.0494) (0.0826) (0.0765)
Δln(TFPit ) -0.1308 0.3629** 0.1271
(0.1453) (0.1478) (0.1148)
Δln (GFCFit-1) 0.1095* 0.0372 0.0687***
(0.0307) (0.0288) (0.0391)
GDPSit-1/GDPit-1 -0.0346 0.0465 0.0129
(0.2500) (0.1450) (0.1263)
EXGSit-1/GDPit-1 0.0799* 0.0111 0.0398**
(0.0253) (0.0247) (0.0163)
Sargan P-value 0.165 0.209 0.118
No. of Counties 18 20 20
No. of Obs. 141 199 340
Notes: 1) *, **, and *** indicates statistical significance at the 1%, 5%, and
10%, respectively.
2) Parentheses contain white’s standard errors.
3) Both time and individual fixed effect dummies are included.
0.08 implying a very inelastic response of employment to the change in
investment for the whole sample period of 1985~2006. This estimated
long-run elasticity of employment with respect to investment seems to
be dominated by the first sub-sample period of 1985~1995 since the
short-run effect of investment is not significantly different from zero for
the second sub-sample period of 1996~2006. This implies that the role
of investment to increase employment becomes smaller after the mid of
1990s.
The results discussed above suggest that TFP began playing a larger
role in fostering investment and employment after the mid of 1990s

DETERMINANTS AND EFFECTS OF TFP GROWTH 69
and as a result, a larger role in the growth of innovation-driven
economies. Moreover, the employment effect of investment became
weaker for the second sub-sample period than the first sub-sample
period while the employment effect of TFP became significant and
larger than the first sub-sample period even if it is not significant for
the whole sample period. These findings help give more credits to
policies to improve TFP because the standalone investment in an
innovation-driven economy would not yield the employment effect or
the growth effect as much as in a factor input-driven economy.
IV. Conclusion
This paper has examined what determines total factor productivity,
how sensitively investment and employment respond to a change in
TFP, and how their responsiveness has changed after the mid of
1990s. TFP measured as the Solow residual could be affected by many
factors. I first considered R&D stock, openness to international trade,
and economic freedom as the important determinants of TFP and
found empirical evidence for those key determinants boosting TFP. It is
also shown that the growth rate of TFP measured as the So low
residual reflect the true productivity growth by presenting empirical
evidence for perfect competition and constant returns to scale. Then I
suggested empirical evidence for the enlarged role of TFP in the growth
of innovation-driven economy by exploring two dynamic panel models
specifying the relationship among TFP, investment, and employment.
I conclude this paper suggesting a few policy implications for Korea
that is transitioning to or has already transitioned to an innovation-
driven economy from a factor input-driven economy. According to the
paradigm shift of the growth toward an innovation-driven one, the
Korean government should consider policies to fully utilize the role of
TFP in her growth.
First, more R&D investment should be made continuously. Korean
R&D intensity, R&D investment share in GDP, has been ranked in a
leading group during recent years. In 2006, the Korean R&D intensity
was 3.23% following Sweden (3.73%), Finland (3.45%), and Japan
(3.39%). However, Korea has a short history of R&D relative to other
major OECD countries and so is the accumulated stock level. As
shown in figure 1, the average GDP share of R&D stock for each period
is ranked in a middle group in the 2000s even if the R&D intensity is
highly ranked. In addition, the R&D investment increases at a lower

SEOUL JOURNAL OF ECONOMICS70
(UNIT: %)
FIGURE 1
INTERNATIONAL COMPARISON OF THE AVERAGE GDP SHARE OF R&D STOCK
0.0
5.0
10.0
15.0
20.0
25.0
Greece
Portugal
Spain
Ireland
Italy
Newzealand
Australia
Norway
Netherlands
Belgium
Korea
Canada U
.K.
Austria
Denmark
France
Germany
U.S
Switzerland
Finland
Japan
Sweden
1980s 1990s 2000s
rate after 1998 in Korea. Therefore, the Korean government should
consider extending both the R&D direct subsidies and tax credits to
foster R&D activities.
Second, Korea should open her domestic market more widely to the
world. Specially, Korea’s service sectors such as telecommunication,
transportation, finance, education, legal, medical sectors, and so on
should improve their competitiveness through opening their domestic
markets to the world.13 Figure 2 shows, as a measure of the openness
of the service sector, the average share of the service sector in total
trade amount for each period.14 Korea’s openness of service sector is
below the OECD or world average for any period as shown in figure 2
while Korea is known to have a very high GDP share of international
13In the past, these services were considered as non-tradable so that there
was no international agreement on trade in services until 1994. However,
‘General Agreement on Trade in Services’ enacted in 1995 started to form an
international agreement even if it needs to be developed to better one like one
on trade in commodities. 14
Trade in services statistics does not fully reflect 4 modes of services defined
in GATS. Mostly, cross border supply (mode 1) and consumption abroad (mode
2) consist of statistics for trade in services. The importance of services traded
by commercial presence (mode 3) and presence of a natural person (mode 4)
gets larger as the globalization proceeds further. However, the data encom-
passing all 4 modes of supply of services are hardly available so that I proceed
the discussion with the usual data for trade in services.

DETERMINANTS AND EFFECTS OF TFP GROWTH 71
(UNIT: %)
FIGURE 2
INTERNATIONAL COMPARISON OF THE OPENNESS OF SERVICE SECTOR
trade. Korea’s average share of trade amount in GDP is around 80%
since 2000. However, the OECD average share for the same period is
only 45%. This means that almost 85% of Korea’s international trade
has been focused on the import and export of goods, which implies, in
turn, that there is plenty of room for improving Korea’s TFP through
opening the service sector to the world more widely and drastically.
Lastly, Korea should not be afraid of institutional changes to enhance
economic freedom that could improve her TFP and eventually causes
the Korean economy flourish. According to the recently published ‘Doing
Business 2009’ by the World Bank, however, the rank for Korea of the
overall ease of doing business goes down from 22nd in 2008 to 23rd in
2009 among 181 countries, implying the relative stringency of regulations
in Korea will be stronger in 2009 than 2008. Sub-fields whose ranks
are way below the overall rank are starting a business, employing
workers, registering property, protecting investors, and paying taxes.
Specially, the relative stringency of regulations related to both starting
a business and employing workers seems to be sharply worsening.15
As shown in subsection 2.3, the growth of TFP will be leveled up by
the improvement of the rank of economic freedom. Therefore, those
fields ranked way lower than the overall rank need strong and decisive
15The rank of starting a business is worsened from 107
th in 2008 to 126
th in
2009 and the one of employing workers is worsened from 122nd in 2008 to
152nd
in 2009.

SEOUL JOURNAL OF ECONOMICS72
regulatory reform.
What are founded from the pattern of growth can be summarized as
follows. The growth of an economy will slow down as the scale of
economy becomes bigger, where the role of TFP increases while the
traditional factor inputs play a smaller role in the growth of innovation
driven economies. Therefore, policies to improve TFP should be imple-
mented more extensively since the growth of GDP will be enhanced
directly by TFP itself and indirectly by increases in investment and
employment induced by the improvement of TFP.
(Received 13 November 2008; Revised 29 January 2009)

DETERMINANTS AND EFFECTS OF TFP GROWTH 73
Variable Description Sources
Δ ln (TFPit) Growth rate of TFP OECD Productivity Database
Δ ln (Kit) Growth rate of capital OECD Productivity Database
Δ ln (Lit) Growth rate of labor hour OECD Productivity Database
θ Labor income share OECD Productivity Database
Δ ln (Rit) Growth rate of R&D stock OECD Main Science and
Technology Indicators
OM1it GDP share of imports Word Bank World Development
Indicators
OM2it GDP share of imports and
exports
Word Bank World Development
Indicators
Δ ln (GFCFit) Growth rate of gross fixed
capital formation
Word Bank World Development
Indicators
Δ ln (EMPit) Growth rate of Employment OECD Stats Portal
EXGS/GDP GDP share of imports and
exports
Word Bank World Development
Indicators
GDPS/GDP GDP share of service sector Word Bank World Development
Indicators
ER Dummy ER dummyit=1(ERit>ERit-1) Fraser Institute Economic
Freedom of the World
EF Dummy EF dummyit=1(EFit>EFit-1) Fraser Institute Economic
Freedom of the World
Rank
Dummy
Rank dummyit
=1(Rankit<Rankit-1)
Fraser Institute Economic
Freedom of the World
5% Dummy 5% dummyit
=1(Rank Percentileit>0.05)
Fraser Institute Economic
Freedom of the World
Appendix: Data Sources and Availability
A. List of Countries: 20 OECD Countries
Australia, Austria, Belgium, Canada, Denmark, Finland, France,
Germany, Ireland, Italy, Japan, Korea, Netherlands, New Zealand,
Portuga1, Spain, Sweden, Switzerland, United Kingdom, United States.
B. Data Sources and Availability
Notes on Availability:
1) TFP and its related data for Korea are not available in OECD pro-
ductivity database. Author calculate the growth rate of TFP with OECD
method using capital stock series from KIET (Korea Industrial Economics
and Trade) and labor data from NSO (National Statistical Office).
2) OECD Productivity Database includes 19 counties data basically since
1985. However, data for some countries are available from 1990 (New
Zealand), 1991 (Spain), 1992 (Switzerland and Germany), or 1996 (Austria
and Portugal).

SEOUL JOURNAL OF ECONOMICS74
3) Based on the perpetual inventory method, R&D stock data are calculated
by author using R&D investment data from OECD MSTI. The stock data
are available in PPP constant million dollars from 1981 to 2006 or the
last available for 22 OECD countries that are 20 OECD countries listed
above with Greece and Norway.
4) Dummy variables for economic freedom are generated from EFW by
Fraser Institute. EFW are available every 5-year from 1975 to 2000 and
every year since 2000. ER is the rating score for regulation of credit,
labor, and business. EF is the rating for overall economic freedom. Rank
denotes the rank of overall rating for economic freedom. Rank percentile
is the rank of overall rating divided by the total number of countries
surveyed.
References
Abramovitz, M. “Resource and Output Trends in the United States
since 1870.” American Economic Review 46 (No. 2 1956): 5-23.
Arellano, M., and Bond, S. R. “Some Tests of Specification for Panel
Data: Monte Carlo Evidence and Application to Employment
Equations.” Review of Economic Studies 58 (No. 2 1991): 277-
97.
Brower, E., Kleinknecht, A., and Reijnen, J. “Employment Growth and
Innovation at the Firm Level. An Empirical Study.” Journal of
Evolutionary Economics 3 (No. 2 1993): 153-59.
Dawson, J. W. “Institutions, Investment, and Growth: New Cross-
Country and Panel Data Evidence.” Economic Inquiry 36 (No. 4
1998): 603-19.
. “Regulation, Investment, and Growth: Across Countries.”
Cato Journal 26 (No. 3 2006): 489-509.
Gwartney, J. D., Holombe, G. R., and Lawson, R. A. “Economic
Freedom, Institutional Quality, and Cross-Country Differences
in Income and Growth,” Cato Journal 24 (No. 3 2004): 205-33.
Hall, B. H., Lotti, F., and Mairesse, J. Employment, Innovation, and
Productivity: Evidence from Italian Microdata. NBER Working
Paper No. 13296, 2007.
Hall, R. E. “The Relation between Price and Marginal Cost in U.S.
Industry.” The Journal of Political Economy 29 (No. 5 1988):
921-47.
. “Invariance Properties of Solow's Productivity Residual.”
In P. Diamond (ed.), Growth/Productivity/Unemployment. MIT
Press, pp. 71-112, 1990.
Hulten, C. R. Total Factor Productivity: A Short Biography. NBER

DETERMINANTS AND EFFECTS OF TFP GROWTH 75
Working Paper No. 7471, 2000.
Kee, H. L. Markups, Returns to Scale, and Productivity. The World
Bank Policy Reserach Working Paper No. 2587, 2002.
Nickell, S. “Biases in Dynamic Models with Fixed Effects.” Econometrica
49 (No. 6 1981): 1417-26.
Nicoletti, G., and Scarpetta, S. Regulation, Productivity, and Growth:
OECD Evidence. World Bank Working Paper No. 2944, 2003.
OECD. Main Science and Technology Indicators. OECD Publishing,
2008.
Peters, B. Employment Effects of Different Innovation Activities: Macro-
econometric Evidence. ZEW Discussion Papers 04-73, 2004.
Piva, M., and Vaivarelli, M. “Innovation and Employment: Evidence
from Italian Microdata.” Journal of Economics 86 (No. 1 2005):
65-83.
Roeger, W. “Can Imperfect Competition Explain the Difference between
Primal and Dual Productivity Measures? Estimates for U.S.
Manufacturing.” Journal of Political Economy 103 (No. 2 1995):
316-30.
World Bank. Doing Business 2009: Country Profile for Korea. http://
www.doingbusiness.org, 2008.
Zimmerman, K. F. “Employment Consequences of Technological Advance:
Demand and Labour Costs in 16 German Industries.” Empirical
Economics 16 (No. 2 1991): 253-66.
