emission, fate and effects of soluble silicates (waterglass) in the aquatic environment
TRANSCRIPT
Emission, Fate and Effects ofSoluble Silicates (Waterglass) inthe Aquatic EnvironmentH E N N O P . V A N D O K K U M , * , §
J A N H . J . H U L S K O T T E , #
K E E S J . M . K R A M E R , ‡ A N DJ O E L W I L M O T †
Department for Ecological Risk Studies, TNO Environment,Energy and Process Innovation, P.O. Box 57, 1780 AB, DenHelder, Netherlands, Department for Emissions Assessment,TNO Environment, Energy and Process Innovation, P.O. Box342, 7300 AH, Apeldoorn, Netherlands, Mermayde, P.O. Box109, 1860 AC, Bergen, Netherlands, and CEFIC-CEES, AvenueE. van Nieuwenhuyse 4, bte 1, B-1160 Bruxelles, Belgium
Soluble silicates, commercially known as waterglass, areamong the largest volume synthetic chemicals in theworld. Silicon from waterglass is rapidly transformed tothe biologically active orthosilicic acid (referred to as dissolvedsilicate). This paper aims to assess the impact ofwaterglass on the aquatic environment in WesternEurope. The emission to surface waters from the fourmost relevant application areas, household detergents, pulpand paper production, water and wastewater treatment,and soil stabilization, is estimated to be ca. 88-121 kton ofSiO2 per year. This is a small fraction (<2%) of theestimated total amount of dissolved silicate transportedby rivers to the oceans. Locally, increases in dissolved silicateconcentration will decrease the ratios of N:Si and P:Si,which could influence phytoplankton species compositionand favor the growth of diatoms over other groups ofalgae. Significant adverse effects in aquatic ecosystemsare not expected.
1. IntroductionSoluble silicates, commonly known as waterglass, are amongthe largest volume of synthetic chemicals, surpassed involume only by commodity acids and bases. The worldwideproduction volume is estimated at ca. 3 million metric tonnesof SiO2 per year, about one-third of which is produced inWestern Europe (1). The chemical properties allow waterglassto be used for many different applications. For example,soluble silicates are used as a builder in household laundrydetergents, as a Si source in chemical synthesis processes,as stabilizers in paper pulp and textile bleaching, and asadhesives.
The general formula of soluble silicates is
where M is an alkali metal (sodium, potassium or lithium),
and m is the molar ratio defining the number of moles ofsilica (SiO2) per mole of metal oxide (M2O). The molar ratioranges between 0.5 and 4, most commonly m ) 3.3. Solublesilicates are supplied as glasses, powders or liquids (2).
Silicon from waterglass is rapidly transformed to thebiologically active orthosilicic acid (commonly referred to asdissolved silicate). Because of the large production volumeand the wide application range, it is important to assess theenvironmental effects of waterglass use on the aquaticenvironment. The main component of waterglass, silica(SiO2), is a naturally occurring substance with 28% of theEarth’s crust as silicon (Si). Silicon is present in all livingorganisms (3), and it is an essential element for diatoms(algae), an important species of phytoplankton in aquaticecosystems. In spring, depletion of dissolved silicate may belimiting for the production of diatoms in aquatic ecosystems(4). Considering this, the question is not simply whethersoluble silicates have an adverse effect on aquatic ecosystems,but a quest to describe the complex effects of adding anessential nutrient and the valuation of these effects.
Only some of the applications and use of waterglass willresult in emissions of dissolved silicate to the aquaticenvironment. The most important applications that mayresult in emission to the aquatic environment were definedwith the help of the European Silicate Producers (CEES,Centre Europeen d’Etude des Silicates):
Detergents: laundry detergents and dishwasher detergent,both household and industrial markets. Soluble silicatebuilders are used for water softening and bleach stabilization.The remaining detergents are discharged to the sewer systemsand then to surface water.
Pulp and paper production: soluble silicates are used forbleaching of pulp manufacturing and de-inking of recycledpaper. Part of the soluble silicates are discharged as dissolvedsilicate with the (treated) wastewater of the paper mill.
Water and wastewater treatment: for complexation andcorrosion inhibition in potable water treatment and mu-nicipal and industrial wastewater treatment. Soluble silicatesmay enter the aquatic environment with the (treated)wastewater.
Soil stabilization: Soluble silicates are injected into soilto consolidate soil and decrease permeability, for exampleduring tunnel construction. Soluble silicates may entersurface water after groundwater transport.
In this paper, we will assess the emission of soluble silicatesfrom these four application areas. We will describe the fateof the soluble silicate in sewer systems and their subsequentemission as dissolved silicate to surface waters and assessthe effects of enrichment of dissolved silicate on aquaticecosystems.
2. MethodsTwo approaches were used to assess the quantity of dissolvedsilicate released from the use of waterglass (see Figure 1).The first approach is to compare the total emission ofdissolved silicate to the aquatic environment (in tonnes ofSiO2/year) to the natural flux of dissolved silicate resultingfrom weathering. The total emission is based on applyingemission factors to both consumption data and productiondata provided by manufacturers. This approach will provideinsight in the relative magnitude of the anthropogenicwaterglass emissions. The second approach is a concentra-tion/risk based approach, comparable to the EC risk as-sessment procedures for New and Existing Substances (5).Two representative worst-case exposure scenarios are de-fined, and aquatic concentrations are calculated. These
* Corresponding author phone: +(0)31 223 638 810; fax: +(0)31223 630 687; e-mail: [email protected].
† CEFIC-CEES.‡ Mermayde.§ Department for Ecological Risk Studies, TNO Environment,
Energy and Process Innovation.# Department for Emissions Assessment, TNO Environment,
Energy and Process Innovation.
mSiO2‚M2O‚nH2O
Environ. Sci. Technol. 2004, 38, 515-521
10.1021/es0264697 CCC: $27.50 2004 American Chemical Society VOL. 38, NO. 2, 2004 / ENVIRONMENTAL SCIENCE & TECHNOLOGY 9 515Published on Web 12/12/2003
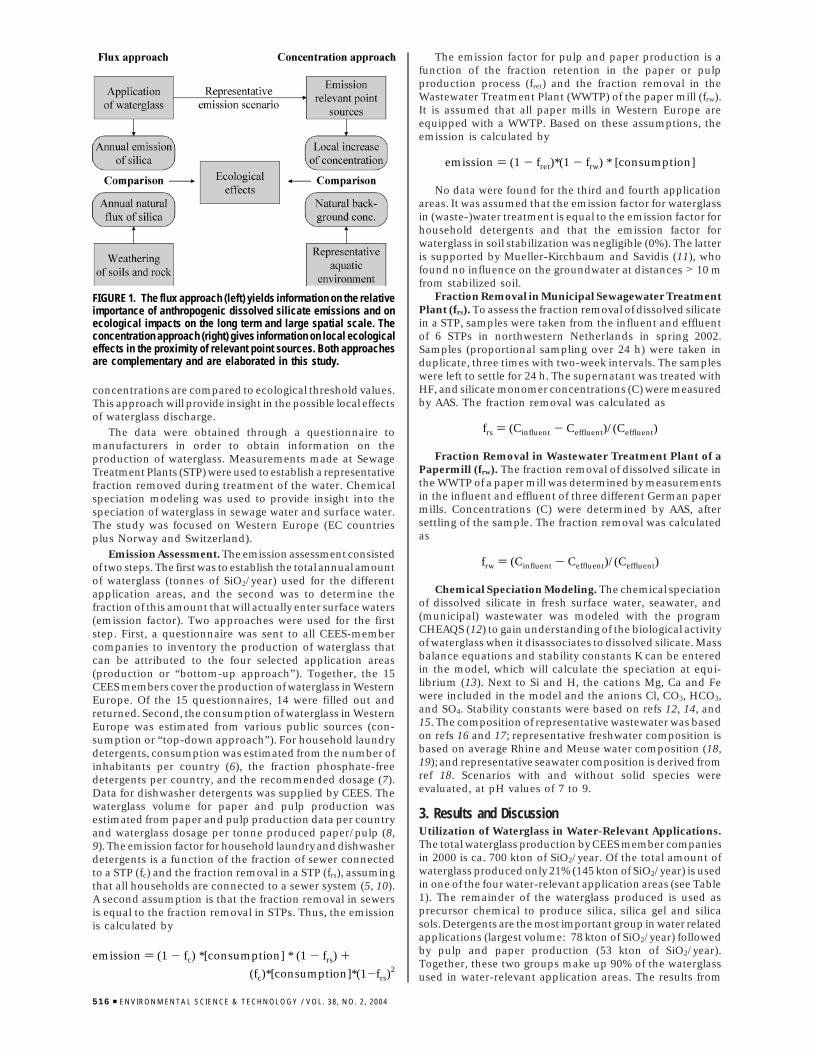
concentrations are compared to ecological threshold values.This approach will provide insight in the possible local effectsof waterglass discharge.
The data were obtained through a questionnaire tomanufacturers in order to obtain information on theproduction of waterglass. Measurements made at SewageTreatment Plants (STP) were used to establish a representativefraction removed during treatment of the water. Chemicalspeciation modeling was used to provide insight into thespeciation of waterglass in sewage water and surface water.The study was focused on Western Europe (EC countriesplus Norway and Switzerland).
Emission Assessment. The emission assessment consistedof two steps. The first was to establish the total annual amountof waterglass (tonnes of SiO2/year) used for the differentapplication areas, and the second was to determine thefraction of this amount that will actually enter surface waters(emission factor). Two approaches were used for the firststep. First, a questionnaire was sent to all CEES-membercompanies to inventory the production of waterglass thatcan be attributed to the four selected application areas(production or “bottom-up approach”). Together, the 15CEES members cover the production of waterglass in WesternEurope. Of the 15 questionnaires, 14 were filled out andreturned. Second, the consumption of waterglass in WesternEurope was estimated from various public sources (con-sumption or “top-down approach”). For household laundrydetergents, consumption was estimated from the number ofinhabitants per country (6), the fraction phosphate-freedetergents per country, and the recommended dosage (7).Data for dishwasher detergents was supplied by CEES. Thewaterglass volume for paper and pulp production wasestimated from paper and pulp production data per countryand waterglass dosage per tonne produced paper/pulp (8,9). The emission factor for household laundry and dishwasherdetergents is a function of the fraction of sewer connectedto a STP (fc) and the fraction removal in a STP (frs), assumingthat all households are connected to a sewer system (5, 10).A second assumption is that the fraction removal in sewersis equal to the fraction removal in STPs. Thus, the emissionis calculated by
The emission factor for pulp and paper production is afunction of the fraction retention in the paper or pulpproduction process (fret) and the fraction removal in theWastewater Treatment Plant (WWTP) of the paper mill (frw).It is assumed that all paper mills in Western Europe areequipped with a WWTP. Based on these assumptions, theemission is calculated by
No data were found for the third and fourth applicationareas. It was assumed that the emission factor for waterglassin (waste-)water treatment is equal to the emission factor forhousehold detergents and that the emission factor forwaterglass in soil stabilization was negligible (0%). The latteris supported by Mueller-Kirchbaum and Savidis (11), whofound no influence on the groundwater at distances > 10 mfrom stabilized soil.
Fraction Removal in Municipal Sewagewater TreatmentPlant (frs). To assess the fraction removal of dissolved silicatein a STP, samples were taken from the influent and effluentof 6 STPs in northwestern Netherlands in spring 2002.Samples (proportional sampling over 24 h) were taken induplicate, three times with two-week intervals. The sampleswere left to settle for 24 h. The supernatant was treated withHF, and silicate monomer concentrations (C) were measuredby AAS. The fraction removal was calculated as
Fraction Removal in Wastewater Treatment Plant of aPapermill (frw). The fraction removal of dissolved silicate inthe WWTP of a paper mill was determined by measurementsin the influent and effluent of three different German papermills. Concentrations (C) were determined by AAS, aftersettling of the sample. The fraction removal was calculatedas
Chemical Speciation Modeling. The chemical speciationof dissolved silicate in fresh surface water, seawater, and(municipal) wastewater was modeled with the programCHEAQS (12) to gain understanding of the biological activityof waterglass when it disassociates to dissolved silicate. Massbalance equations and stability constants K can be enteredin the model, which will calculate the speciation at equi-librium (13). Next to Si and H, the cations Mg, Ca and Fewere included in the model and the anions Cl, CO3, HCO3,and SO4. Stability constants were based on refs 12, 14, and15. The composition of representative wastewater was basedon refs 16 and 17; representative freshwater composition isbased on average Rhine and Meuse water composition (18,19); and representative seawater composition is derived fromref 18. Scenarios with and without solid species wereevaluated, at pH values of 7 to 9.
3. Results and DiscussionUtilization of Waterglass in Water-Relevant Applications.The total waterglass production by CEES member companiesin 2000 is ca. 700 kton of SiO2/year. Of the total amount ofwaterglass produced only 21% (145 kton of SiO2/year) is usedin one of the four water-relevant application areas (see Table1). The remainder of the waterglass produced is used asprecursor chemical to produce silica, silica gel and silicasols. Detergents are the most important group in water relatedapplications (largest volume: 78 kton of SiO2/year) followedby pulp and paper production (53 kton of SiO2/year).Together, these two groups make up 90% of the waterglassused in water-relevant application areas. The results from
FIGURE 1. The flux approach (left) yields information on the relativeimportance of anthropogenic dissolved silicate emissions and onecological impacts on the long term and large spatial scale. Theconcentration approach (right) gives information on local ecologicaleffects in the proximity of relevant point sources. Both approachesare complementary and are elaborated in this study.
emission ) (1 - fret)*(1 - frw) * [consumption]
frs ) (Cinfluent - Ceffluent)/(Ceffluent)
frw ) (Cinfluent - Ceffluent)/(Ceffluent)
emission ) (1 - fc) *[consumption] * (1 - frs) +(fc)*[consumption]*(1-frs)
2
516 9 ENVIRONMENTAL SCIENCE & TECHNOLOGY / VOL. 38, NO. 2, 2004
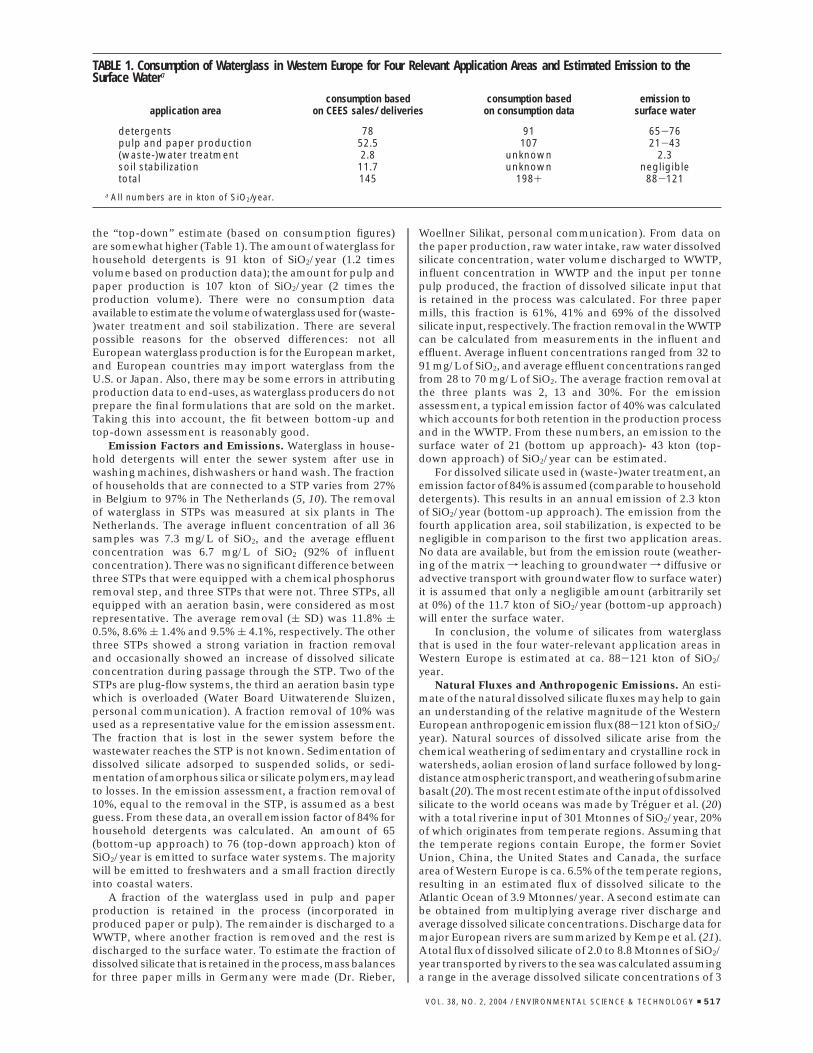
the “top-down” estimate (based on consumption figures)are somewhat higher (Table 1). The amount of waterglass forhousehold detergents is 91 kton of SiO2/year (1.2 timesvolume based on production data); the amount for pulp andpaper production is 107 kton of SiO2/year (2 times theproduction volume). There were no consumption dataavailable to estimate the volume of waterglass used for (waste-)water treatment and soil stabilization. There are severalpossible reasons for the observed differences: not allEuropean waterglass production is for the European market,and European countries may import waterglass from theU.S. or Japan. Also, there may be some errors in attributingproduction data to end-uses, as waterglass producers do notprepare the final formulations that are sold on the market.Taking this into account, the fit between bottom-up andtop-down assessment is reasonably good.
Emission Factors and Emissions. Waterglass in house-hold detergents will enter the sewer system after use inwashing machines, dishwashers or hand wash. The fractionof households that are connected to a STP varies from 27%in Belgium to 97% in The Netherlands (5, 10). The removalof waterglass in STPs was measured at six plants in TheNetherlands. The average influent concentration of all 36samples was 7.3 mg/L of SiO2, and the average effluentconcentration was 6.7 mg/L of SiO2 (92% of influentconcentration). There was no significant difference betweenthree STPs that were equipped with a chemical phosphorusremoval step, and three STPs that were not. Three STPs, allequipped with an aeration basin, were considered as mostrepresentative. The average removal (( SD) was 11.8% (0.5%, 8.6% ( 1.4% and 9.5% ( 4.1%, respectively. The otherthree STPs showed a strong variation in fraction removaland occasionally showed an increase of dissolved silicateconcentration during passage through the STP. Two of theSTPs are plug-flow systems, the third an aeration basin typewhich is overloaded (Water Board Uitwaterende Sluizen,personal communication). A fraction removal of 10% wasused as a representative value for the emission assessment.The fraction that is lost in the sewer system before thewastewater reaches the STP is not known. Sedimentation ofdissolved silicate adsorped to suspended solids, or sedi-mentation of amorphous silica or silicate polymers, may leadto losses. In the emission assessment, a fraction removal of10%, equal to the removal in the STP, is assumed as a bestguess. From these data, an overall emission factor of 84% forhousehold detergents was calculated. An amount of 65(bottom-up approach) to 76 (top-down approach) kton ofSiO2/year is emitted to surface water systems. The majoritywill be emitted to freshwaters and a small fraction directlyinto coastal waters.
A fraction of the waterglass used in pulp and paperproduction is retained in the process (incorporated inproduced paper or pulp). The remainder is discharged to aWWTP, where another fraction is removed and the rest isdischarged to the surface water. To estimate the fraction ofdissolved silicate that is retained in the process, mass balancesfor three paper mills in Germany were made (Dr. Rieber,
Woellner Silikat, personal communication). From data onthe paper production, raw water intake, raw water dissolvedsilicate concentration, water volume discharged to WWTP,influent concentration in WWTP and the input per tonnepulp produced, the fraction of dissolved silicate input thatis retained in the process was calculated. For three papermills, this fraction is 61%, 41% and 69% of the dissolvedsilicate input, respectively. The fraction removal in the WWTPcan be calculated from measurements in the influent andeffluent. Average influent concentrations ranged from 32 to91 mg/L of SiO2, and average effluent concentrations rangedfrom 28 to 70 mg/L of SiO2. The average fraction removal atthe three plants was 2, 13 and 30%. For the emissionassessment, a typical emission factor of 40% was calculatedwhich accounts for both retention in the production processand in the WWTP. From these numbers, an emission to thesurface water of 21 (bottom up approach)- 43 kton (top-down approach) of SiO2/year can be estimated.
For dissolved silicate used in (waste-)water treatment, anemission factor of 84% is assumed (comparable to householddetergents). This results in an annual emission of 2.3 ktonof SiO2/year (bottom-up approach). The emission from thefourth application area, soil stabilization, is expected to benegligible in comparison to the first two application areas.No data are available, but from the emission route (weather-ing of the matrix f leaching to groundwater f diffusive oradvective transport with groundwater flow to surface water)it is assumed that only a negligible amount (arbitrarily setat 0%) of the 11.7 kton of SiO2/year (bottom-up approach)will enter the surface water.
In conclusion, the volume of silicates from waterglassthat is used in the four water-relevant application areas inWestern Europe is estimated at ca. 88-121 kton of SiO2/year.
Natural Fluxes and Anthropogenic Emissions. An esti-mate of the natural dissolved silicate fluxes may help to gainan understanding of the relative magnitude of the WesternEuropean anthropogenic emission flux (88-121 kton of SiO2/year). Natural sources of dissolved silicate arise from thechemical weathering of sedimentary and crystalline rock inwatersheds, aolian erosion of land surface followed by long-distance atmospheric transport, and weathering of submarinebasalt (20). The most recent estimate of the input of dissolvedsilicate to the world oceans was made by Treguer et al. (20)with a total riverine input of 301 Mtonnes of SiO2/year, 20%of which originates from temperate regions. Assuming thatthe temperate regions contain Europe, the former SovietUnion, China, the United States and Canada, the surfacearea of Western Europe is ca. 6.5% of the temperate regions,resulting in an estimated flux of dissolved silicate to theAtlantic Ocean of 3.9 Mtonnes/year. A second estimate canbe obtained from multiplying average river discharge andaverage dissolved silicate concentrations. Discharge data formajor European rivers are summarized by Kempe et al. (21).A total flux of dissolved silicate of 2.0 to 8.8 Mtonnes of SiO2/year transported by rivers to the sea was calculated assuminga range in the average dissolved silicate concentrations of 3
TABLE 1. Consumption of Waterglass in Western Europe for Four Relevant Application Areas and Estimated Emission to theSurface Watera
application areaconsumption based
on CEES sales/ deliveriesconsumption based
on consumption dataemission to
surface water
detergents 78 91 65-76pulp and paper production 52.5 107 21-43(waste-)water treatment 2.8 unknown 2.3soil stabilization 11.7 unknown negligibletotal 145 198+ 88-121
a All numbers are in kton of SiO2/year.
VOL. 38, NO. 2, 2004 / ENVIRONMENTAL SCIENCE & TECHNOLOGY 9 517
mg/L of SiO2 (average of the Rhine in Holland) (18) to 13mg/L of SiO2 (average concentration world rivers) (22). Asthese estimates are based on actual data, they include bothnatural and anthropogenic dissolved silicate loads. Thenatural flux to the aquatic environment is higher than theseestimates, because net removal of dissolved silicate occursin river systems (see later). On the scale of western Europe,the anthropogenic emissions (ca. 100 ktonnes of SiO2/year)are therefore <) 2% of the total flux of dissolved silicatecarried by rivers to the sea (ca. 5 Mtonnes of SiO2/year). Itshould be noted that the estimated percent (<2%) is anaverage value, because the dissolved silicate load of riversvaries over the seasons due to seasonal changes in diatomproduction.
Increase in Concentration as a Consequence of Water-glass Use. The emission assessment showed that the emissionof dissolved silicate from waterglass use is only a small fractionof the natural dissolved silicate flux. However, in a localsituation, the contribution of anthropogenic sources may bemuch higher. Two representative local situations are evalu-ated: (i) a paper mill and (ii) a municipal STP both dischargingto a river.
The total dissolved silicate emission of four paper plants,one in The Netherlands (situated near a lesser branch of theRiver Rhine) and four (anonymous) plants in Germany, wascalculated from the paper production, fraction recycled paperused as resource, soluble silicate input (tonne/tonne) in theprocess, and the calculated emission factor of 40%. Thecalculated dissolved silicate emission was 408 tonnes of SiO2/year for the Dutch plant and 840, 280 and 392 for the threeGerman plants. The discharge of the River Rhine near theDutch plant is ca. 25 m3/s, and the average backgroundconcentration is ca. 3 mg/L SiO2 (18). Assuming that theGerman plants discharge to a similar (i.e., medium-sized)river, and assuming instantaneous and homogeneous mixing,the increase in concentration is 0.4-1.1 mg/L of SiO2 or ca.10-40% of the background concentration. Measurementsin the German plants showed an increase in the concentrationof the wastewater (in comparison to the raw water used inthe process) of 22 to 75 mg/L of SiO2. Two aspects shouldbe kept in mind when assessing the local impact. First, inlocal situations where the ratio between wastewater dischargevolume and discharge volume of the receiving water systemis higher, a larger increase in the concentration may beexpected. Second, the natural background concentration inreceiving waters will vary during the season, from highconcentrations in winter to the lowest concentrations in latespring (after the diatom spring bloom). For example,concentrations in the Rhine varied from 7.9 mg/L of SiO2 inJanuary to 1.2 mg/L of SiO2 in early May (23). This will affectthe relative impact of the dissolved silicate discharge.
The municipal STP of Houtrust in The Netherlands (cityof The Hague) was taken as a representative for STPs. In1999, the effluent production was ca. 270 000 m3/day (17).Assuming that ca. 60% of the STP loading of 1 500 000“pollution units” can be attributed to households (and theremainder to industry), the dissolved silicate loading fromhouseholds (household and dishwasher detergents) is ca.624 kg/day of SiO2. Taking various losses into account, thiswill result in an increase of 1.1 mg/L of SiO2 in the effluent.As already mentioned, the average measured effluent con-centration of six Dutch municipal STPs was 6.7 mg/L of SiO2,in comparison to a local tap water concentration of ca. 2mg/L of SiO2. However, wastewater (in The Netherlands)contains significant quantities of rainwater and runoff waternext to tap water, and the difference can therefore not simplybe attributed to the use of waterglass in households. Inconclusion, locally, dissolved silicate emissions from wa-terglass may result in a concentration increase of the receivingwater on the order of magnitude of <0.1-10 mg/L of SiO2.
The relative impact depends on the background concentra-tion.
What Will Happen to Waterglass before and afterEntering the Water System? Silicon chemistry is a highlycomplex matter (1, 24). It is virtually impossible to describethe Si speciation during the entire pathway from applicationof the product, via transport through the sewer system,through a STP, and its subsequent emission to the (fresh ormarine) surface water. However, the speciation of Si afterdischarge of effluent in the surface water is known fromliterature and can be analyzed by chemical speciationmodeling. The speciation is determined mainly by the pHand the dissolved silicate concentration. In a natural pH rangeof 7-9, the majority of the Si in freshwater systems is presentas orthosilicic acid H2(H2SiO4), also known as dissolvedsilicate, the biologically active species (24-27). Modelingshows that the fraction dissolved silicate is >99% at pH )7 and ca. 87% at pH ) 9, the remainder being H(H2SiO4).When the concentration of Si increases, precipitation ofamorphous silica H2(H2SiO4) (s) will occur. The solubility ofamorphous silica is virtually independent of pH in the range7-9 and ca. 95 mg/L of SiO2 at 25 °C. The solubility increasesat higher pH (>9), when stable multinuclear species can occur(26). Impurities reduce the solubility of amorphous silica.Aluminum and clay minerals may reduce the maximumconcentration of dissolved silicate in water, because of theformation of very insoluble aluminosilicates (27). From anecological perspective, it means that soluble silicates enteringthe aquatic environment will be available to biota as dissolvedsilicate, up to a maximum concentration of 95 mg/L of SiO2
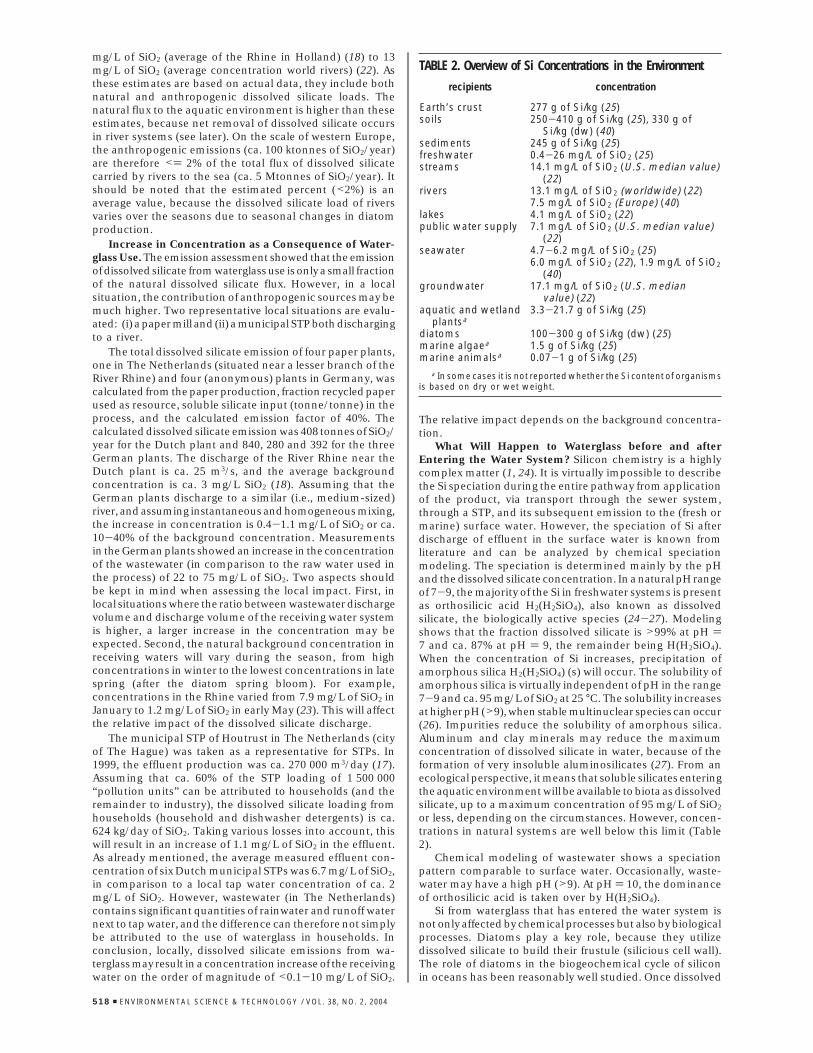
or less, depending on the circumstances. However, concen-trations in natural systems are well below this limit (Table2).
Chemical modeling of wastewater shows a speciationpattern comparable to surface water. Occasionally, waste-water may have a high pH (>9). At pH ) 10, the dominanceof orthosilicic acid is taken over by H(H2SiO4).
Si from waterglass that has entered the water system isnot only affected by chemical processes but also by biologicalprocesses. Diatoms play a key role, because they utilizedissolved silicate to build their frustule (silicious cell wall).The role of diatoms in the biogeochemical cycle of siliconin oceans has been reasonably well studied. Once dissolved
TABLE 2. Overview of Si Concentrations in the Environment
recipients concentration
Earth’s crust 277 g of Si/kg (25)soils 250-410 g of Si/kg (25), 330 g of
Si/kg (dw) (40)sediments 245 g of Si/kg (25)freshwater 0.4-26 mg/L of SiO2 (25)streams 14.1 mg/L of SiO2 (U.S. median value)
(22)rivers 13.1 mg/L of SiO2 (worldwide) (22)
7.5 mg/L of SiO2 (Europe) (40)lakes 4.1 mg/L of SiO2 (22)public water supply 7.1 mg/L of SiO2 (U.S. median value)
(22)seawater 4.7-6.2 mg/L of SiO2 (25)
6.0 mg/L of SiO2 (22), 1.9 mg/L of SiO2(40)
groundwater 17.1 mg/L of SiO2 (U.S. medianvalue) (22)
aquatic and wetlandplantsa
3.3-21.7 g of Si/kg (25)
diatoms 100-300 g of Si/kg (dw) (25)marine algaea 1.5 g of Si/kg (25)marine animalsa 0.07-1 g of Si/kg (25)
a In some cases it is not reported whether the Si content of organismsis based on dry or wet weight.
518 9 ENVIRONMENTAL SCIENCE & TECHNOLOGY / VOL. 38, NO. 2, 2004
silicate is incorporated into a diatom frustule as an amor-phous solid known as biogenic silica, upon death of thediatom it will take some time (on average: 50 days for 50%)for the biogenic silica to dissolve (4). In the oceans, a largefraction (60% on average) of biogenic silica production isrecycled via dissolution in the upper 100 m of the watercolumn (28, 29). Because of this removal process, surfacewater in oceans is undersaturated with respect to Si (27).Dissolution continues during sedimentation, and the specificsurface area and solubility of biogenic silica decrease withdepth (28). Once on the sea floor, the frustules will dissolveslowly, and the biogenic silica deposits (referred to as opal,or SiO2‚nH2O) may persist from a few months to a fewhundred years at the sediment-water interface (20). Pro-cesses on and in the sediment are complex and involveinteraction with Al(III) from dissolved detrital minerals,reducing the solubility and dissolution kinetics of biogenicsilica and inducing precipitation of aluminosilicates (28, 30).The result of the various processes is an asymptotic decreasingconcentration profile in marine sediments.
The net removal of dissolved silicate from the watercolumn also occurs in freshwaters, especially in lakes, butalso behind impoundments or dams which has been termedthe “artificial lake effect” (31). For example, 50% of inputsof dissolved silicate were removed or retained in three Frenchreservoirs (32). The retention represented only a small fractionof the internal fluxes of phytoplankton uptake and recyclingat the sediment-water interface. The dissolved silicateremoval by the “Iron Gate” dam in the Danube River wasdescribed by Humborg et al. (33). Admiraal et al. (23) describeremoval of dissolved silicate in man-made sedimentationareas in the Rhine Delta. Dissolved silicate concentration inrivers decreases strongly during bloom periods, up to a levelwhere a limitation of diatoms by dissolved silicate may occur(34). Meybeck (35) reports a marked decrease in dissolvedsilicate concentrations in the river Seine basin during theperiod 1848-1990, coinciding with a marked increase ofphosphorus and nitrogen levels and the creation of reservoirsin the 1960s. As the dissolved silicate flux to the river probablyhas not changed much in this period (see ref 36), the decreaseis likely due to removal processes in the river basin. Theimportance for this study is that part of the dissolved silicatefrom waterglass emission is likely to be removed from theaquatic environment in sinks such as lakes, reservoirs anddammed river sections.
Ecological Effects. Silicon is a naturally occurring sub-stance, which is present in all environmental compartmentsand all biota (3) (see Table 2). It is an essential element fordiatoms (algae) but not for other algae (such as green orbluegreen algae). The concentrations of dissolved silicate
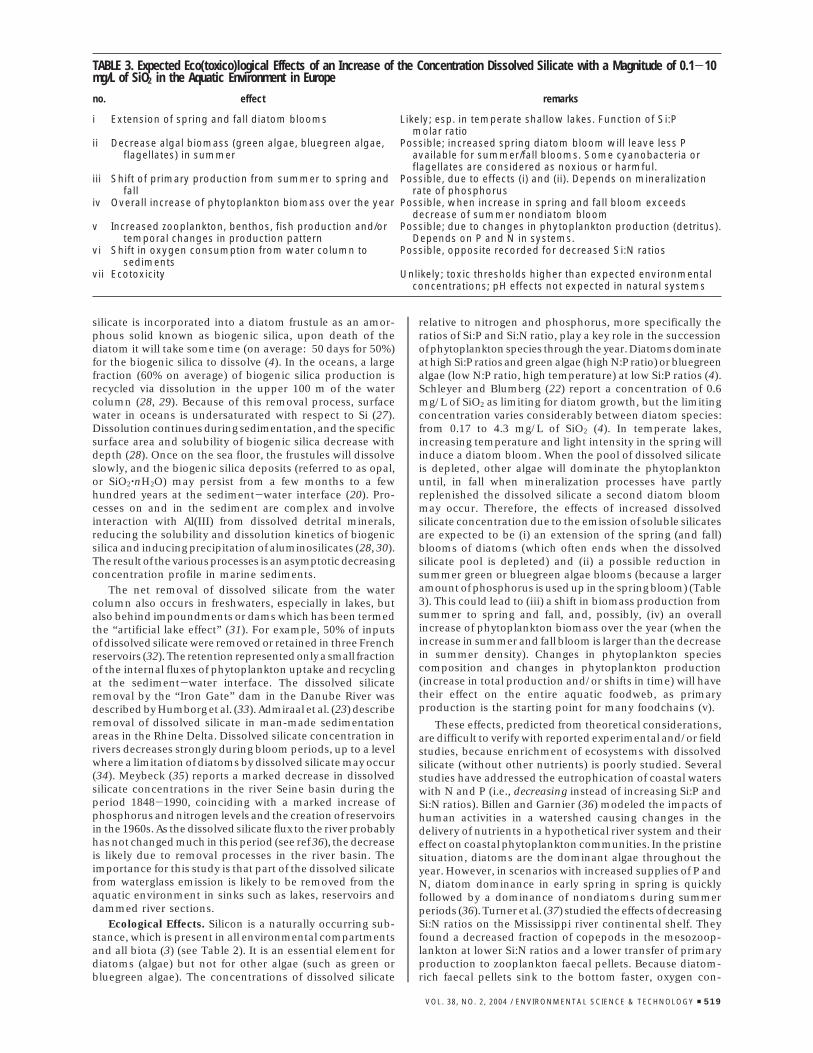
relative to nitrogen and phosphorus, more specifically theratios of Si:P and Si:N ratio, play a key role in the successionof phytoplankton species through the year. Diatoms dominateat high Si:P ratios and green algae (high N:P ratio) or bluegreenalgae (low N:P ratio, high temperature) at low Si:P ratios (4).Schleyer and Blumberg (22) report a concentration of 0.6mg/L of SiO2 as limiting for diatom growth, but the limitingconcentration varies considerably between diatom species:from 0.17 to 4.3 mg/L of SiO2 (4). In temperate lakes,increasing temperature and light intensity in the spring willinduce a diatom bloom. When the pool of dissolved silicateis depleted, other algae will dominate the phytoplanktonuntil, in fall when mineralization processes have partlyreplenished the dissolved silicate a second diatom bloommay occur. Therefore, the effects of increased dissolvedsilicate concentration due to the emission of soluble silicatesare expected to be (i) an extension of the spring (and fall)blooms of diatoms (which often ends when the dissolvedsilicate pool is depleted) and (ii) a possible reduction insummer green or bluegreen algae blooms (because a largeramount of phosphorus is used up in the spring bloom) (Table3). This could lead to (iii) a shift in biomass production fromsummer to spring and fall, and, possibly, (iv) an overallincrease of phytoplankton biomass over the year (when theincrease in summer and fall bloom is larger than the decreasein summer density). Changes in phytoplankton speciescomposition and changes in phytoplankton production(increase in total production and/or shifts in time) will havetheir effect on the entire aquatic foodweb, as primaryproduction is the starting point for many foodchains (v).
These effects, predicted from theoretical considerations,are difficult to verify with reported experimental and/or fieldstudies, because enrichment of ecosystems with dissolvedsilicate (without other nutrients) is poorly studied. Severalstudies have addressed the eutrophication of coastal waterswith N and P (i.e., decreasing instead of increasing Si:P andSi:N ratios). Billen and Garnier (36) modeled the impacts ofhuman activities in a watershed causing changes in thedelivery of nutrients in a hypothetical river system and theireffect on coastal phytoplankton communities. In the pristinesituation, diatoms are the dominant algae throughout theyear. However, in scenarios with increased supplies of P andN, diatom dominance in early spring in spring is quicklyfollowed by a dominance of nondiatoms during summerperiods (36). Turner et al. (37) studied the effects of decreasingSi:N ratios on the Mississippi river continental shelf. Theyfound a decreased fraction of copepods in the mesozoop-lankton at lower Si:N ratios and a lower transfer of primaryproduction to zooplankton faecal pellets. Because diatom-rich faecal pellets sink to the bottom faster, oxygen con-
TABLE 3. Expected Eco(toxico)logical Effects of an Increase of the Concentration Dissolved Silicate with a Magnitude of 0.1-10mg/L of SiO2 in the Aquatic Environment in Europe
no. effect remarks
i Extension of spring and fall diatom blooms Likely; esp. in temperate shallow lakes. Function of Si:Pmolar ratio
ii Decrease algal biomass (green algae, bluegreen algae, Possible; increased spring diatom bloom will leave less Pflagellates) in summer available for summer/fall blooms. Some cyanobacteria or
flagellates are considered as noxious or harmful.iii Shift of primary production from summer to spring and
fallPossible, due to effects (i) and (ii). Depends on mineralization
rate of phosphorusiv Overall increase of phytoplankton biomass over the year Possible, when increase in spring and fall bloom exceeds
decrease of summer nondiatom bloomv Increased zooplankton, benthos, fish production and/or Possible; due to changes in phytoplankton production (detritus).
temporal changes in production pattern Depends on P and N in systems.vi Shift in oxygen consumption from water column to
sedimentsPossible, opposite recorded for decreased Si:N ratios
vii Ecotoxicity Unlikely; toxic thresholds higher than expected environmentalconcentrations; pH effects not expected in natural systems
VOL. 38, NO. 2, 2004 / ENVIRONMENTAL SCIENCE & TECHNOLOGY 9 519

sumption in the water column is lower, but oxygen con-sumption near the bottom is higher and more uniformlydistributed at high Si:N ratios than at lower Si:N ratios (vi).The authors suggest that a decrease of Si:N ratios leads toa smaller risk of bottom water hypoxia but to a larger risk offlaggelated algal blooms, including harmful algae blooms.The potential effects of the relative decrease of dissolvedsilicate in coastal waters on the occurrence of harmful algalblooms and changes in zooplankton communities and theentire coastal ecosystem are also discussed in ref 33. Thepotential effects are large, but much more research isnecessary to obtain a better understanding of the conse-quences of reductions in dissolved silicate. The ecologicaleffects in rivers are less likely to be as important, becauseprimary production is often light-limited due to the highturbidity (33).
Toxicity from dissolved silicate from waterglass (vii) isnot likely to occur in natural water systems. According toecotoxicity data (Table 4), waterglass has been classified as“slightly toxic” to “very slightly toxic” (5). The toxicity varieswith molar ratio and pH (1, 21). However, toxicity is notrealistic for natural water systems, because, as discussedearlier, precipitation of amorphous silica will occur at adissolved silicate concentration of ca. 95 mg/L of SiO2 (pH< 9; T ) 25 °C), and natural waters are greatly undersaturatedwith respect to amorphous silica. The observed effects inolder toxicity tests (without a pH-buffered medium) maywell be caused by the high pH of the test medium and notnecessarily due to high waterglass concentrations. Forexample, the upper pH at which waterfleas (crustaceans)Chydorus sphaericus, Eurycercus lamellatus, Ceriodaphniareticulata, Daphnia magna and D. pulex can survive is 10.5-11 with decreasing densities of daphnid species at pH > 9observed in enclosure studies (38).
The overall, long-term ecological effects of waterglassemissions are not known but are expected to be small. Thetotal emission from Europe is <2% of the total riverinedissolved silicate load. However, in local situations, theemission of soluble silicate may lead to a much strongerincrease in dissolved silicate concentrations in aquaticecosystems, especially when dissolved silicate levels aredepleted after a diatom bloom, and strong effects may occurlocally. The primary effect is hypothesized to be shifts inphytoplankton species composition and production, followedby changes at higher trophic levels. The impact must beinterpreted within the context of the current situation:dissolved silicate concentrations in dammed rivers andcoastal waters have decreased over the past decades due toeutrophication and damming (33), whereas phosphorus andnitrogen levels have increased dramatically (36). The mostimportant emission routes of dissolved silicate from water-glass are via a Sewage Treatment Plant, so that dissolvedsilicate is discharged together with phosphorus and nitrogen.This means that waterglass emissions can make a small, butpotentially locally large, contribution in increasing Si:P andSi:N ratios, although total nutrient concentrations of P andN will probably always be higher than in the pristine situation.It is for this reason, that additions of dissolved silicate were
proposed as a measure to reduce the negative effects ofsewage effluent discharge and reduced Si:P and Si:N ratiosin marine ecosystems (39).
AcknowledgmentsThe research underlying this paper was funded by CEFIC-CEES (http://www.cees-silicates.org/). We thank the Fate andEffects Working group (Elisabeth Olsson, Wolfram Rieber,Wilhelm Kuhr, Ralf Bohlander, Ken McDonald, JennyNicholls) and the TNO researchers Monique Blankendaal,Karlijn Holthaus, Jacqueline Tamis and Diederik Schakelaarfor their contributions. The comments of three anonymousreviewers have greatly improved the paper.
Literature Cited(1) Falcone, J. S. In Kirk-Othmer Encyclopedia of Chemical Tech-
nology, 4th ed.; Wiley: New York, U.S.A., 1997;Vol. 22, pp 1-30.(2) Fawer, M. EMPA Bericht Nr. 241; Swiss Federal Laboratories for
Materials Testing and Research: St. Gallen, Switserland, 1997.(3) Freemantle, M. C&EN 2002, February 11(4) Lampert, W.; Sommer, U. Limnoecology: the ecology of lakes
and streams; Oxford University Press: Oxford, U.K., 1997.(5) Technical Guidance Document in support of commission directive
93/67/EEC on risk assessment for new notified substances andcommission regulation (EC) No 1488/94 on risk assessment forexisting substances. Part II; European Community; Office forofficial publications of the European Communities: Luxem-bourg, 1996; ISBN 92-827-8012-0.
(6) The World Factbook 2002; Central Intelligence Agency: Wash-ington DC, U.S.A., 2000.
(7) Zeolites for detergents. As nature intended; Association ofDetergent Zeolite Producers: Brussels, Belgium, 2000.
(8) Annual Statistics 1998; Confederation of European PaperIndustries: Brussels, Belgium, 1999.
(9) Special Recycling 1999 Statistics; Confederation of EuropeanPaper Industries: Brussels, Belgium, 2000.
(10) Environmental Data 1999; Sewerage and sewage treatment.Compendium 1999; Organization for Economic Co-operationand Development: Paris, France, 1999.
(11) Mueller-Kirchbaum, H.; Savidis, S. A. Grundwasserbeeinflussungdurch Silikatinjektionen; Techn. Universitat Berlin: Berlin,Germany, 1982.
(12) Verweij, W. Equilibria and constants in CHEAQS: selectioncriteria, sources and assumptions; Rijksinstituut voor Volksg-ezondheid en Milieuhygiene: Bilthoven, Netherlands, 2000.
(13) Kramer, C. J. M.; Van de Meent, D. In Manual on aquaticecotoxicology; De Kruijf, H. A. M., De Zwart, D., Visvanathan,P. N., Ray, P. K., Eds.; Allied Publ. PVT Ltd.: New Delhi, India,1988; pp 95-99.
(14) Morel, F. M. M. Principles of aquatic chemistry; John Wiley andSons: New York, U.S.A., 1983.
(15) MINTEQA2, an equilibrium metal speciation model; Usersmanual; EPA/600/3-87/012; U.S. Environmental ProtectionAgency: Athens, Georgia, U.S.A., 1989.
(16) Milieustatistieken; Centraal Bureau voor de Statistiek: Voorburg,Netherlands, 1990.
(17) Annual report WWTP Houtrust; Waterboard Delftland, Delft,Netherlands, 2000; Internal report.
(18) Jaarboek Monitoring Rijkswateren 1998. Kengetallen. Rijksin-stituut voor Zoetwaterbeheer en Afvalwaterbehandeling/Rijksinstituut voor Kust en Zee: Lelystad/Den Haag, Nether-lands, 1999.
(19) Annual report 1998. Part C. The Rhine and the Meuse; Inter-national Association of River Waterworks: Amsterdam, Neth-erlands, 2000.
(20) Treguer, P.; Nelson, D. M.; Van Bennekom, A. J.; DeMaster, D.J.; Leynaert, A.; Queguiner, B. Science 1995, 268(5209), 375-379.
(21) Kempe, S.; Pettine, M.; Cauwet, G. In Biochemistry of majorworld rivers; Degens, E. T.; Kempe, S.; Richey, J. E., Eds.; Scope42; John Wiley and Sons: Chichester, U.K., 1991.
(22) Schleyer, W. L.; Blumberg, J. G. In Soluble silicates; Falcone, J.S., Ed.; ACS Symposium Series 194; American ChemicalSociety: Washington, DC, U.S.A., 1982; pp 49-69.
(23) Admiraal, W.; Breugem, P.; Jacobs, D. M. L. H. A.; De Ruyter vanSteveninck, E. D. Biogeochemistry 1990, 9, 175-185.
(24) Iler, R. K. The chemistry of silica. Solubility, polymerization,colloid and surface properties, and biochemistry; Wiley: Chich-ester, U.K., 1979.
TABLE 4. Acute Toxicity of Waterglassa
speciesthreshold value (EC50)
(mg/L of SiO2) references
algae 213 (41)crustaceans 160-895 (41, 42)fish 215-2320 (22, 41, 42)microorganisms 10 - >1000 (41)a Effects may well be due to increased pH of the test medium, see
text.
520 9 ENVIRONMENTAL SCIENCE & TECHNOLOGY / VOL. 38, NO. 2, 2004
(25) Vymazal, J. Algae and element cycling in wetlands; LewisPublishers: Boca Raton, FL, 1995.
(26) Stumm, W.; Morgan, J. J. Aquatic chemistry. Chemical equilibriaand rates in natural waters, 3rd ed.; John Wiley and Sons: NewYork, U.S.A., 1996.
(27) Wedepohl, K. H.; Correns, C. W.; Shaw, D. M.; Turekian, K. K.;Zemann, J., Eds. Handbook of geochemistry; Springer-Verlag:Berlin, Germany, 1972; Vol. II-3.
(28) Dixit, S.; Van Cappellen, P.; Van Bennekom, A. J. Mar. Chem.2001, 73, 333-352.
(29) Van Capellen, P.; Dixit, S.; Van Beusekom, J. Global Biochem.Cycles 2002, 16(4), 1075, doi:10.1029/2001GB0011431.
(30) Van Cappellen, P.; Qiu, L. Deep-Sea Res. II 1997, 44(5), 1109-1128.
(31) Van Bennekom, A. J.; Salomons, W. In River input to oceansystems; Martin, J.-M., Burton, J. D., Eisma, D., Eds.; UNEP,IOC, SCOR, United Nations: New York, USA, 1981; pp 33-51.
(32) Garnier, J.; Leporcq, B.; Sanchez, N.; Philippon, X. Biogeochem-istry 1999, 47(2), 119-146.
(33) Humborg, C.; Conley, D. J.; Rahm, L.; Wulff, F.; Cociasu, A.;Ittekkot, V. Ambio 2000, 29, 45-49.
(34) Admiraal, W.; Mylius, S. D.; De Ruyter van Stevenink, E. D.;Tubbing, D. M. J. J. Plankton Res. 1993, 15(6), 659-682.
(35) Meybeck, M. Hydrobiologica 1998, 373/374, 1-20.(36) Billen, G.; Garnier, J. Aquat. Microb. Ecol. 1997, 13, 3-17.(37) Turner, R. E.; Qureshi, N.; Rabalais, N. N.; Dortch, Q.; Justic, D.;
Shaw, R. F.; Cope, J. Proc. Natl. Acad. Sci. U.S.A. 1998, 95, 13048-13051.
(38) Hansen, A.-M.; Christensen, J. V.; Sortkjær, O. Arch. Hydrobiol1991, 123, 143-164.
(39) Officer, C. B.; Ryther, J. H. Mar. Ecol. Prog. Ser. 1980, 3, 83-91.(40) Jorgensen, S. E.; Nielsen, S. N.; Jorgensen, L. A. Handbook of
ecological parameters and ecotoxicology; Elsevier: Amsterdam,The Netherlands, 1991.
(41) IUCLID data sheets Silicic acid, sodium salt (CAS-No. 1312-76-1; 1344-09-8); European Chemicals Bureau: Ispra, Italy.
(42) Produits de remplacement du tripolyphosphate dans la fabrica-tion de detergents; United Nations Publication, 1992; F.91.II.E.33;ISBN 92-1-216310-6.
Received for review December 24, 2002. Revised manuscriptreceived October 23, 2003. Accepted October 23, 2003.
ES0264697
VOL. 38, NO. 2, 2004 / ENVIRONMENTAL SCIENCE & TECHNOLOGY 9 521