emergy measures of carrying capacity and sustainability of a target region for an ecological...
TRANSCRIPT
at SciVerse ScienceDirect
Journal of Environmental Management 102 (2012) 55e64
Contents lists available
Journal of Environmental Management
journal homepage: www.elsevier .com/locate/ jenvman
Emergy measures of carrying capacity and sustainability of a target region for anecological restoration programme: A case study in Loess Hilly Region, China
Xiaohu Dang a,*, Guobin Liu b
aCollege of Geology and Environment, Xi’an University of Science and Technology, 54 Yanta Road, Xi’an 710054, Shaanxi, PR Chinab Institute of Soil and Water Conservation, Chinese Academy of Science and Ministry of Water Resources, 26 Xinong Road, Yangling 712100, Shaanxi, PR China
a r t i c l e i n f o
Article history:Received 25 August 2011Received in revised form15 December 2011Accepted 18 February 2012Available online 22 March 2012
Keywords:Emergy synthesisSustainabilityCarrying capacityEcological restoration programmeLoess Hilly Region
* Corresponding author. Tel.: þ86 29 85583188; faxE-mail addresses: [email protected] (X.
(G. Liu).
0301-4797/$ e see front matter � 2012 Elsevier Ltd.doi:10.1016/j.jenvman.2012.02.023
a b s t r a c t
Evaluating the sustainability of a target region for an ecological restoration programme is challengingbecause it involves different aspects of human society and environment as well as multiple disciplines.Carrying capacity provides a useful measure of the sustainability of a given region where an ecologicalrestoration programme is implemented. In this article, the Yangou catchment, a geomorphic unit, wasused as a case study in the Loess Hilly Region of China, where emergy synthesis was used to measure theenvironmental resources base. The specific standard of living in terms of emergy was employed tocalculate carrying capacity over the period 1998e2005 and to assess the sustainability of the Yangoucatchment where an ecological restoration programme was carried out. The results of the evaluationindicated that after implementing the ecological restoration programme, there was some improvementin the environmental aspects of the Yangou catchment during the study period, suggesting that theecological restoration programme alleviated ecological degradation. However, several emergy-basedindices and the support areas also illustrated that the ecological restoration programme was notsuccessful enough in terms of preservation and utilisation of environmental resources to enhancesustainability. This indicates that further actions are necessary on conserving environmental resources,improving the emergy input structure for agricultural production and in lifestyle changes for the localpeople in living in the Yangou catchment.
� 2012 Elsevier Ltd. All rights reserved.
1. Introduction
In the Loess Hilly Regions of the Northern Shaanxi Province inChina, there is great tension between economic growth and themaintenance of ecological processes, a tension that largely arisesfrom the combination of a sensitive natural environment andpopulation poverty. Under impoverished circumstances, farmers inthese regions are commonly prone to economic activities that bringshort-term profits while overlooking environmental concerns,which in turn contribute to further environmental deterioration (Liand Song, 1994; Rees, 2002; Wang and Xie, 2004; Zhao and Liu,1996). In other words, impoverishment leads farmers to preferimmediate returns that provide security, even if it induces envi-ronmental degradation (Barrow, 2003; Taddesse, 1995; Wezel andRath, 2002). Several ongoing ecological restoration programmeswere primarily designed to alleviate these enormous
: þ86 29 85583187.Dang), [email protected]
All rights reserved.
environmental challenges and to simultaneously restructure therural land-based economy so that participating farmers couldgradually shift into more environmentally and economicallysustainable activities in China’s ecologically fragile areas (Yin andYin, 2009). These programmes include the Grain for Green Pro-gramme (also called the Sloping Land Conversion Programme),which is the largest ecological restoration programme in the worldin terms of government investments and land area covered (Forestand Grassland Taskforce of China, 2003). The Grain for Green Pro-gramme was launched by the Chinese Government in 1999 asa cropland retirement programme (Xu et al., 2006). A total of 14.67million hectares in cropland on steep slopes located in the Yellowand Yangtze River basins and other vulnerable places, are going tobe converted into woodland or grassland by the programmecompletion in 2010 (Liu et al., 2008; Wang et al., 2007). In addition,some experimental projects at small or medium spatial scales havebeen carried out by researchers to explore the mechanism ofecological restoration, for example, the Yan’an Experimental Areafor Ecological Rehabilitation, an area of 707 km2 that is a repre-sentative ecological restoration research project of the ChineseAcademy of Sciences (CAS).

X.H. Dang, G.B. Liu / Journal of Environmental Management 102 (2012) 55e6456
For the assessment on such an ecological restoration pro-gramme, there are three main questions to be answered. First, howdo the ecological restoration programmes affect the carryingcapacity and sustainability of the target regions? Second, how cansustainability be measured? And thrird, what is the carryingcapacity of a given region beyond which economic developmentcauses declines in resource availability and environmental integ-rity? The answers to these questions require the careful evaluationof the region where an ecological restoration programme isimplemented. Such an evaluation however, is complicated by theneed to evaluate the network of interactions occurring betweenhuman beings and their environmental support systems.
“The concept of carrying capacity relates resource use to envi-ronmental support and is often used to understand such interac-tions. Reaching a carrying capacity for a population infers that thereis a balance between the supply of environmental resources and theimpacts sustained as a result of that supply. In recent years therehas been some discussion concerning the carrying capacity of theearth for humans, and the ultimate limit to global carrying capacityfor economic development”(Brown and Ulgiati, 2001). There arenumerous papers that discuss qualitatively, the relationships ofenvironment to carrying capacity (see for instance, Arrow et al.,1995; Cohen, 1995, 1997; Fearnside, 1997; King and Slesser, 1995;Sterrer, 1993; Van Den Bergh, 1993; Wetzel and Wetzel, 1995),however there are few quantitative studies.
Using a logistic equation and food supply data as a variable ofcarrying capacity, Hopfenberg (2003) gave population estimateswhich were in accord with actual population numbers. McConnell(1995) estimated the carrying capacity of the Chesapeake BayWatershed to be about 8 million people by relating past populationin the watershed to the onset of major episodes of Bay degradation.Liu and Borthwick (2011) proposed a comprehensive measurementsystem for carrying capacity of the environment which comprisesmodels of natural resources capacity, environmental assimilativecapacity, ecosystem services capacity and society supportingcapacity, and applied this measurement system to a case study ofNingbo, China.
Folke et al. (1997) calculated the area “appropriated” by cities inBaltic Europe and globally; the 29 largest cities of Baltic Europeappropriate for their resource consumption and waste assimilationan area of forest, agricultural, marine, and wetland ecosystems thatis at least 565e1130 times larger than the area of the cities them-selves. Likewise, using the concept of “ecological footprint”Wakernagle and Rees (1996) determined the amount of landrequired for various human processes, and then by summing theresource requirements for the variousprocesses andeconomies theycould determine the amount of land required to support economies.
From the perspective of ecological economics, Hall (1992) hasdocumented the need for an alternative integrated approach tounderstand systems of humanity and nature with regard to theirsocioeconomiceenvironmental interfaces. The alternative analysissystem used in this paper to make sub-regional assessments isEmergy Synthesis which integrates ecology and economics withinthe context of thermodynamics and general systems theory.
Emergy is a record of the available energy previously used up.Most often, emergy is expressed as solar energy joule (abbreviatedas sej), which expresses the emergy of a product or service in unitsof solar equivalent energy. For a more complete explanation ofemergy see Odum (1996). Emergy synthesis is an environmentalaccounting method that examines the use of resources in a givensystem based on the common unit of solar energy. Brown et al.(2000) gave this methodology the term emergy synthesis since itis an approach that strives for understanding the whole system andits relationship to surrounding systems rather than the dissectionand fragmentation that is involved in analysis.
Publications focused on emergy synthesis are appearing withincreasing frequency in the scientific literature to address prob-lems that require integrated ecological-economic evaluation(Odum, 1988; Tilley and Swank, 2003). Pereira and Orteg (2010)assessed the sustainability of ethanol produced from sugarcaneand examined the environmental feasibility of a large-scaleproduction through the use of a fossil fuel embodied energyanalysis and emergy assessment adopting Life Cycle concepts.Employing economic cost and return estimation (CAR), ecologicalfootprint (EF) and emergy analysis (EA), Cuadra and Björklund(2007) assessed economic viability, EF per gigacalorie andsustainability for six agricultural crop production systems inNicaragua. Campbell (1998), in an emergy analysis of the State ofMaine, USA, calculated the carrying capacity for human pop-ulations. Nam et al. (2010) carried out an emergy evaluation toassess the human carrying capacity of a small, uninhabited islandoff the southwestern coast of South Korea. Using the emergysynthesis approach, Lomas et al. (2008) investigated a historicalseries of resource use during five annual periods in the last20 years of conservation policy, and the effects on the preservationof natural capital in Spain. Although these studies make somequantitative estimates, none of them relate the measurement ofcarrying capacity and sustainability to the evaluation of a specificecological restoration programme.
This study applies emergy synthesis to gain a better under-standing of carrying capacity and sustainability than can beobtained from using traditional environmental monitoring indica-tors alone. Using a case study of the Yangou catchment, a geomor-phic unit within the Yan’an Experimental Area for EcologicalRehabilitation selected for an ecological restoration researchproject of the CAS, this paper has two specific objectives. The firstobjective is to identify changes in ecologicaleeconomic processesand to assess the environmental resources base of the case studycatchment in terms of emergy-based indices for the period of1998e2005 and after implementing the ecological restorationprogramme. The second objective is to determine the lower andupper bounds for carrying capacity of local environments atdifferent standards of living in terms of emergy, and discuss thehuman carrying capacity and sustainability for the Yangoucatchment.
2. Methods
2.1. Study area
The Yan’an Experimental Area for Ecological Rehabilitation(36�2204000e36�3201600N; 109�0400600e109�3402500E) covers an areaof 707 km2, is located in the Yan’an Prefecture of northern ShaanxiProvince, China, and is composed of nine townships within AnsaiCounty and the Baota District. The Yan’an Prefecture is represen-tative of Loess Hilly Regions and is part of the Loess Plateau locallyknown as the “sandy coarse-sandy area” fromwhich approximately90% of the sediment delivered to the Yellow River originates(Douglas, 1989). Over the past 20 years, the government of Chinahas given special attention to the region due to erosion and itseffects downstream on major rivers and because the area is ofagricultural importance (Liu, 1999). Since 2000 a 707 km2 mediumspatial scale study areawas selected and researchers from CAS haveconducted a research project related to the ecological restorationprogramme; experimental and demonstration research on soil andwater conservation and sustainable eco-rehabilitation on the LoessPlateau. This project was based on long-term observations at theAnsai station of soil and water conservation research, a part ofChina Ecosystems Research Net. The Yangou catchment is one offive sites selected for experimental demonstrations within the

X.H. Dang, G.B. Liu / Journal of Environmental Management 102 (2012) 55e64 57
Yan’an Experimental Area for Ecological Rehabilitation as well asbeing a pilot site to experiment with the Grain for Green Pro-gramme (see Fig. 1).
The Yangou catchment is located in the Baota District of theYan’an Prefecture and covers an area of 47 km2 comprising 14administrative villages. By the end of 2005, there were 3255 peopleand 596 households with an average household size of 5.5 persons,cropland per capita of 0.189 ha and yearly income per capita of 3432yuan (414 US$, 1 US$ ¼ 8.277 yuan at 2002 exchange rates, which isused hereafter) in this catchment. The climate is semiarid with anaverage annual temperature of 8.8 �C, 147 frost-free days per yearand monthly means ranging from 22 �C in July to �7 �C in January.The average annual precipitation is 528 mm and is strongly influ-enced by the monsoon season, while the evapotranspirationpotential reaches 1860 mm. Agricultural production is highlydependent on smallholder rain-fed farming that has been practisedfor several thousands of years (Li, 1984). The soil is classified as CalcicCambisol (FAO-UNESCO, 1977) and is mainly wind-deposited loesssoil that is highly erosive. In the year 1997, the soil erosion rateincreased dramatically to more than 9000 tons per square kilometre.
As a pilot site of the Grain for Green Programme, croplandretirement was implemented in the Yangou catchment in 1999, andthe corresponding studies on the mechanism of ecological resto-ration have been conducted since 2000. Thereafter land use in thecatchment has undergone substantial changes. Cropland accountedfor 39.1% of the land area of the Yangou catchment in 1999 (i.e.,prior to the implementation of the Grain for Green Programme),and declined to 13.1% in 2005, whereas the vegetation cover(forestland and grassland) sharply increased from 24% in 1999 to62.4% in 2005. For this reason, a great effort has been made toadjust and optimise the rural industrial structure to increase thediversity of rural sectors and sources of farmers’ income. Tradi-tionally, the primary sector in this catchment has been farming, andaccordingly, farmers’ income heavily depends on farming and issensitive to land use change and changes in climatic conditions.
2.2. Sources of data
Socio-economic data and information were collected usinga household-level questionnaire and from statistics available at
Fig. 1. Locations of the Yangou catchment and the Yan’an Experimental
town levels. The household survey was conducted in November2002 and September 2005. Out of approximately 596 householdsin this catchment, 65 heads of household were interviewed. Withassistance from village leaders, three income groups were identi-fied and used as the framework for a stratified random samplingdesign. Using a list of households in each income group, 20e25households were randomly chosen from each of three categoriesdesignated as well-off, middle, and the poor income levels,resulting in a sample size of 65 households. Representatives of theselected households were asked to complete the pre-designedstructural questionnaire in a designated room. The pre-designedquestionnaire included fifteen categories of questions coveringcharacteristics prior to and after the implementation of theecological restoration programmes, including personal character-istics, household consumption, farming, land use and participationin the ecological restoration programme, perceived changes insocioeconomic condition and their attitudes towards the Grain forGreen Programme. The collected survey information was thenstored in a computer database for analysis. Historical data onchanges in land use and cover, meteorology, soil attributes, soilerosion, hydrology, biodiversity, biomass and net primaryproduction were primarily derived from field experiments con-ducted by the Ansai station of soil and water conservationresearch, CAS.
2.3. Methodology
2.3.1. Emergy synthesisEmergy was introduced by Odum (1994, 1996), as a method for
overcoming the so-called “metric” problems and linking theecological processes with economic value. Developed over the lastthree decades, emergy systems theory provides a valuable unit (theemjoule) and method (emergy synthesis) for overcoming “metric”problems; all products and services of the system are normalised toa unit of measure that represents the quantity and quality of workbeing created and maintained by that system (Odum, 1996; Tilleyand Swank, 2003). In emergy synthesis, all kinds of material andenergy flows are transferred to the same unit, solar emjoules, bymultiplying the various available energy values of the flows by theappropriate solar transformity (sej/J), defined as the quantity of
Area for Ecological Rehabilitation within the Loess Plateau of China.
X.H. Dang, G.B. Liu / Journal of Environmental Management 102 (2012) 55e6458
emergy required to generate a single unit of a product (Odum,1988):
Solar emergyðsejÞ ¼ Solar transformityðsej=JÞ� available energyðJÞ (1)
Solar emergyðsejÞ ¼ Specific solar emergyðsej=gÞ �massðgÞ(2)
The emergy budget of the geobiosphere calculated by Odumet al. (2000) was used as the baseline for our emergy calculation.
The emergy synthesis for the Yangou catchment was in accor-dance with the usual emergy evaluation procedure (Odum, 1996),as follows:
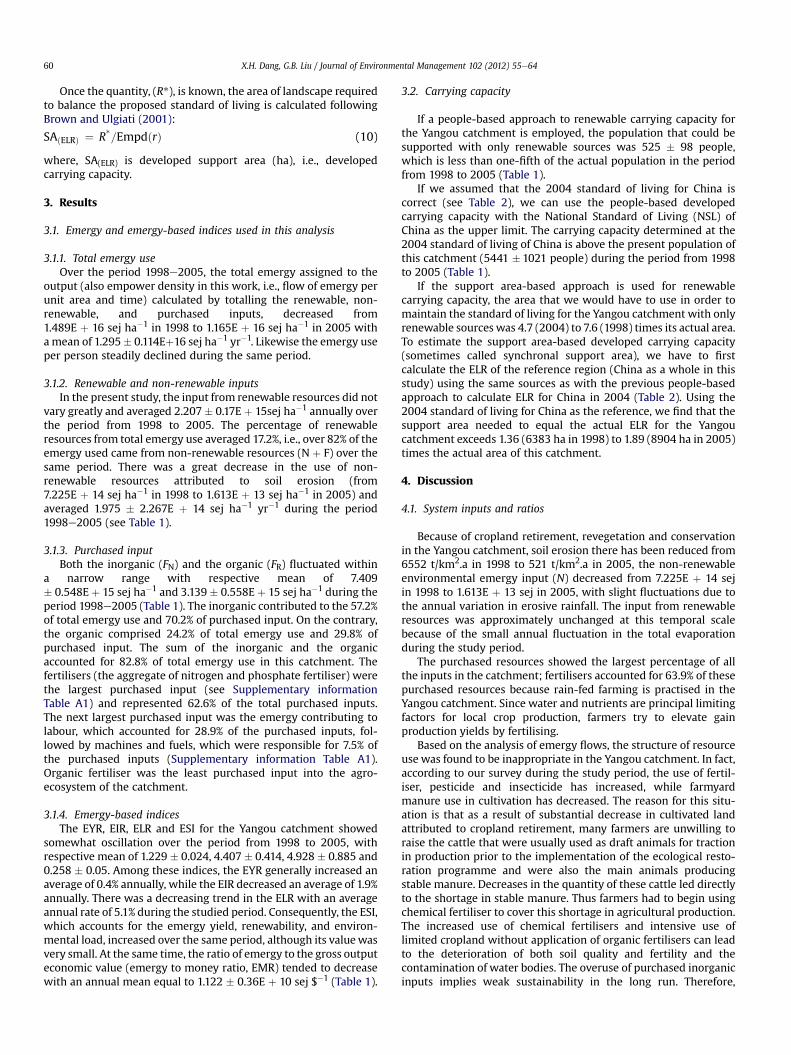
(1) Draw a simplified flow diagram of the catchment as a system(following the method established by Brown and Ulgiati(1997)) (Fig. 2).
(2) Prepare an emergy evaluation table.(3) Calculate the main flows, storages and unit emergy values or
transformities (Supplementary information Table A1).(4) Discuss the performance of the main evaluation indicators.
Three main inputs to the Yangou catchement can be recognisedin the present evaluation: free renewable local resources (R), suchas sunlight, rain and wind; free non-renewable local resources (N),soil erosion, for instance; and purchased inputs (F) (see Fig. 2). Toavoid possible double-accounting for the free renewable inputs,such as sunlight, rain, wind and geothermal heat, only the largestcontribution, the rain in the present case, is taken into account assuggested by Odum (1996), although all the emergy input items arecalculated, as listed in the supplementary information Table A1.Purchased input (F) was divided into the two parts, the inorganic(FN) (including fertiliser, pesticide and insecticide, plastic film, farmmachinery and fuel) and the organic (FR) (including seed, organicmanure, draught animal and labour). To make these flows easilycomparable, the “Raw data” and “Emergy” columns of the supple-mentary information Table A1 were normalized for area andquantified as values in solar emjoules per hectare per year(sej ha�1 yr�1).
A suite of indices, e.g., the ratio of renewable resources (%Renew), empower density, renewable empower density, theemergy to money ratio, the emergy yield ratio (EYR), the emergyinvestment ratio (EIR), the environmental loading ratio (ELR), andthe emergy sustainability index (ESI), were used to examine thechanges in environmental resource base in the Yangou catchmentfrom 1998 to 2005. Among these indicators the ratio of renewable
non-renewable
renewable
Environment
Local
Local
N 0.20(0
R 2.207(0.
Fig. 2. Summary diagram of emergy flows in the Yangou catchment. All emergy flow
resources (% Renew) is the ratio of renewable emergy to totalemergy use, or rather the percentage of the total emergy drivinga process that stems from local renewable sources. This ratioreflects some aspects of the system’s sustainability potential orability to be driven by local renewable resources. In the long run,only processes with a high % Renew are ecologically sustainable.Empower density is a relative measure of the intensity of activity,expressed as the total emergy used per unit time per unit area.Renewable empower density is the renewable emergy used perunit area per unit time. Empower density is a relative measure ofthe intensity of activity, expressed as the total emergy used per unittime per unit area. Rural areas have empower densities of1e10E þ 11 sej m�2 yr�1. Industrial agriculture and extractiveindustries have empower densities of from 10 to 1000E þ 11sej m�2 yr�1, while major urban centres are characterised byempower densities in excess of 1000e100 000E þ 11 sej m�2 yr�1.The average global renewable empower density is about 0.2E þ 11sej m�2 yr�1. On land, where geobiospheric processes converge, therenewable empower density is between 0.5 and 5E þ 11sej m�2 yr�1 (Brown and Ulgiati, 2001). The EYR is the ratio of theemergy of the output (UE) to the purchased inputs (F). According toBrown and Ulgiati (2002, 2004), the EYR is a measure of the abilityof a process to exploit and make available local resources byinvesting in outside resources. It quantifies the appropriation oflocal resources by a process, which can be read as a potentialadditional contribution, or gain to the overall economy by investingin resources already available. The lowest possible value of the EYRis 1, which indicates that a process delivers the same amount ofemergy that was provided to drive it, and it is unable to usefullyexploit any local resource. Therefore, a process inwhich the EYR is 1or only slightly higher does not provide significant net emergy tothe economy and only transforms resources that are alreadyavailable from previous a process. In so doing, it acts more asa consumer process, and it does not create new opportunities forgrowth in the system. A process with an EYR in the range from 2 to5 indicates a moderate contribution to the economy. EIR is the ratioof the purchased inputs to the indigenous emergy inputs; it indi-cates whether the process is a good user of purchased emergy(Brown and Ulgiati, 1997). ELR is a direct inverse function of thefraction of renewable sources (Ulgiati and Brown, 1998) and anindicator of the human pressure on the environment. It can beconsidered a measure of the stress level of the ecosystem due toproduction activities (Brown and Buranakarn, 2003). ESI, defined asthe ratio of the above EYR to the ELR, is an aggregate measure ofyield and environmental loading, i.e., a sustainability function fora given process or economy under study (Brown and Ulgiati, 1997).An ESI < 1 appears to be indicative of an economy dominated by
Agricultural activities
U
F
U =R+N+FE
E
FN
.23)
17)
7.409(0.548)
R 3.139(0.558)F
12.953(1.14)
10.55(1.01)
s are 1015 sej ha�1 yr�1. The figures in parentheses are standard deviation (SD).

X.H. Dang, G.B. Liu / Journal of Environmental Management 102 (2012) 55e64 59
consumption, whereas an ESI > 1 appears to be indicative of aneconomy dominated by processes and products that offer a netcontribution to society. Thus, a low ESI (<1) indicates a consumer-oriented economy (Ulgiati and Brown, 1998).
2.3.2. Carrying capacity of the Yangou catchmentCarrying capacity can be determined based on the emergy
requirements for a given population or the emergy intensity ofa given economic development. The carrying capacity of an envi-ronment is determined by that environment’s ability to supply therequired emergy. A rich environment can support larger pop-ulations or more intense economic developments. Ultimately,carrying capacity is related to the ability of a local environment toprovide necessary resources for a population or economicendeavour on a renewable basis since non-renewables by their verydefinition cannot be depended on in the long term. In emergyterms, the long term carrying capacity of an area is limited by theflux of renewable emergy that is characteristic of that area. Onemight term this renewable carrying capacity, since it relies on anenvironment’s ability to support a population or economic devel-opment based solely on its renewable emergy sources. In manyrespects renewable carrying capacity is an unrealistic number,since a population or economic development, by its very naturerequires non-renewable emergy which is matched with renewableemergy sources to extract a net yield. Be that as it may, therenewable carrying capacity provides a benchmark for a lower limitto the carrying capacity of a region (Brown and Ulgiati, 2001).Calculating a renewable carrying capacity assumes that all emergyrequirements of a population will be derived from renewablesources. Carrying capacity calculated in this waymay be a predictorof long term sustainability.
A second approach to carrying capacity is related to the “fitness”of development within an environmental system. This secondapproach is based on environmental loading (Brown and Ulgiati,2001, termed this the intensity of development). The intensity ofdevelopment in relation to existing conditions may be critical inpredicting its effect and its short-term sustainability (Brown et al.,1995; Ulgiati et al., 1996; Brown and Ulgiati, 1997). If a develop-ment’s intensity is much greater than that which is characteristic ofthe surrounding region, on average, the development has greatercapacity to alter existing social, economic, and ecologic patterns(Odum, 1980). If it is similar in intensity it is more easily integratedinto existing patterns. This second method of evaluating carryingcapacity uses the Environmental Loading Ratio (ELR) and providesan upper limit to carrying capacity (Brown and Ulgiati, 2001).Campbell (1998) also termed it developed carrying capacity.Combined, the two approaches provide lower and upper boundsrespectively, to carrying capacity of local environment for economicdevelopment.
Carrying capacity may have two main forms: a people-basedcarrying capacity (more similar to the classical concept ofcarrying capacity), linked to number of people supported byemergy used (Odum, 1996; Campbell, 1998), and an area-basedcarrying capacity (similar to ecological footprint), associated tosupport area needed tomaintain the standard of living of people (interms of emergy use per capita) (Brown and Ulgiati, 2001). Thesetwo forms could be applied to both ‘‘only renewable’’ and ‘‘devel-oped’’ scenarios. In this study, the 2004 standard of living for Chinaas a whole (Jiang et al., 2008) was used as a reference for “devel-oped’’ scenarios.
1) The people-based carrying capacity
Renewable carrying capacity at the present standard of living isderived by dividing the renewable emergy input to the case
catchment by the total emergy use per person in this catchment asfollows:
CCR ¼ REUE=P
(3)
where, CCR is the renewable carrying capacity (person), the RE is therenewable emergy input to the case catchment (sej), UE is the totalemergy use (sej), and P is the population of this catchment(person).
The developed carrying capacity at the national standard ofliving in 2004 is given by following equations:
CCNSL ¼ NSL � REUE=P
(4)
NSL ¼ UN=RN (5)
where, CCNSL is the developed carrying capacity (person), NSL is the2004 national standard of living, UN is the quantity of emergy usedby Chinese economy in 2004, and RN is the renewable emergy flowinput into China in 2004.
2) The area-based carrying capacity
The carrying capacity indices are expressed as land arearequired to maintain the standard of living of a given population.We call this required area the “support area”. The renewablesupport area is derived by dividing the total emergy input to thiscatchment by the average renewable empower density of thecatchment as follows:
SAðrÞ ¼ UE=EmpdðrÞ (6)
where, SA (r) is renewable support area (ha), Empd (r) is renewableempower density (sej m�2 yr�1), and UE is given as given inEquation (4).
The result is the necessary area of the surrounding region thatwould be required if the economic activities of the case catchmentare using solely renewable emergy inputs. It is a lower limit toenvironmental carrying capacity because it requires the largestsupport area, thereby placing the highest limits on the economicactivities.
To determine the area of support necessary for a proposedstandard of living (i.e., reference standard of living in this study)under current condition, first the environmental loading ratio forthe catchment is calculated (as above) and then the followingsimple equivalent proportion is constructed according to Brownand Ulgiati (2001):
ELRðrÞ ¼ ELRðdÞ (7)
where, ELR (r) is environmental loading ratio of the Yangoucatchment, and ELR (d) is environmental loading ratio at thereference standard of living (2004 standard of living for China inpresent work), which is given by follows:
ELRðdÞ ¼ ½F þ N�d=R* (8)
The ELR (d) is the loading ratio that is necessary to equal that ofthe catchment, thus the R* in Equation (8) is the required amount ofrenewable emergy necessary to lower the ELR (d) to ELR (r). [FþN]dis the amount of free non-renewable local resources and purchasedinputs at the proposed standard of living. The equation is solved asfollows:
R* ¼ ½F þ N�d=ELRðrÞ (9)
X.H. Dang, G.B. Liu / Journal of Environmental Management 102 (2012) 55e6460
Once the quantity, (R*), is known, the area of landscape requiredto balance the proposed standard of living is calculated followingBrown and Ulgiati (2001):
SAðELRÞ ¼ R*=EmpdðrÞ (10)
where, SA(ELR) is developed support area (ha), i.e., developedcarrying capacity.
3. Results
3.1. Emergy and emergy-based indices used in this analysis
3.1.1. Total emergy useOver the period 1998e2005, the total emergy assigned to the
output (also empower density in this work, i.e., flow of emergy perunit area and time) calculated by totalling the renewable, non-renewable, and purchased inputs, decreased from1.489E þ 16 sej ha�1 in 1998 to 1.165E þ 16 sej ha�1 in 2005 withamean of 1.295� 0.114Eþ16 sej ha�1 yr�1. Likewise the emergy useper person steadily declined during the same period.
3.1.2. Renewable and non-renewable inputsIn the present study, the input from renewable resources did not
vary greatly and averaged 2.207 � 0.17E þ 15sej ha�1 annually overthe period from 1998 to 2005. The percentage of renewableresources from total emergy use averaged 17.2%, i.e., over 82% of theemergy used came from non-renewable resources (N þ F) over thesame period. There was a great decrease in the use of non-renewable resources attributed to soil erosion (from7.225E þ 14 sej ha�1 in 1998 to 1.613E þ 13 sej ha�1 in 2005) andaveraged 1.975 � 2.267E þ 14 sej ha�1 yr�1 during the period1998e2005 (see Table 1).
3.1.3. Purchased inputBoth the inorganic (FN) and the organic (FR) fluctuated within
a narrow range with respective mean of 7.409� 0.548E þ 15 sej ha�1 and 3.139 � 0.558Eþ 15 sej ha�1 during theperiod 1998e2005 (Table 1). The inorganic contributed to the 57.2%of total emergy use and 70.2% of purchased input. On the contrary,the organic comprised 24.2% of total emergy use and 29.8% ofpurchased input. The sum of the inorganic and the organicaccounted for 82.8% of total emergy use in this catchment. Thefertilisers (the aggregate of nitrogen and phosphate fertiliser) werethe largest purchased input (see Supplementary informationTable A1) and represented 62.6% of the total purchased inputs.The next largest purchased input was the emergy contributing tolabour, which accounted for 28.9% of the purchased inputs, fol-lowed by machines and fuels, which were responsible for 7.5% ofthe purchased inputs (Supplementary information Table A1).Organic fertiliser was the least purchased input into the agro-ecosystem of the catchment.
3.1.4. Emergy-based indicesThe EYR, EIR, ELR and ESI for the Yangou catchment showed
somewhat oscillation over the period from 1998 to 2005, withrespective mean of 1.229 � 0.024, 4.407 � 0.414, 4.928 � 0.885 and0.258 � 0.05. Among these indices, the EYR generally increased anaverage of 0.4% annually, while the EIR decreased an average of 1.9%annually. There was a decreasing trend in the ELR with an averageannual rate of 5.1% during the studied period. Consequently, the ESI,which accounts for the emergy yield, renewability, and environ-mental load, increased over the same period, although its valuewasvery small. At the same time, the ratio of emergy to the gross outputeconomic value (emergy to money ratio, EMR) tended to decreasewith an annual mean equal to 1.122 � 0.36E þ 10 sej $�1 (Table 1).
3.2. Carrying capacity
If a people-based approach to renewable carrying capacity forthe Yangou catchment is employed, the population that could besupported with only renewable sources was 525 � 98 people,which is less than one-fifth of the actual population in the periodfrom 1998 to 2005 (Table 1).
If we assumed that the 2004 standard of living for China iscorrect (see Table 2), we can use the people-based developedcarrying capacity with the National Standard of Living (NSL) ofChina as the upper limit. The carrying capacity determined at the2004 standard of living of China is above the present population ofthis catchment (5441 � 1021 people) during the period from 1998to 2005 (Table 1).
If the support area-based approach is used for renewablecarrying capacity, the area that we would have to use in order tomaintain the standard of living for the Yangou catchment with onlyrenewable sources was 4.7 (2004) to 7.6 (1998) times its actual area.To estimate the support area-based developed carrying capacity(sometimes called synchronal support area), we have to firstcalculate the ELR of the reference region (China as a whole in thisstudy) using the same sources as with the previous people-basedapproach to calculate ELR for China in 2004 (Table 2). Using the2004 standard of living for China as the reference, we find that thesupport area needed to equal the actual ELR for the Yangoucatchment exceeds 1.36 (6383 ha in 1998) to 1.89 (8904 ha in 2005)times the actual area of this catchment.
4. Discussion
4.1. System inputs and ratios
Because of cropland retirement, revegetation and conservationin the Yangou catchment, soil erosion there has been reduced from6552 t/km2.a in 1998 to 521 t/km2.a in 2005, the non-renewableenvironmental emergy input (N) decreased from 7.225E þ 14 sejin 1998 to 1.613E þ 13 sej in 2005, with slight fluctuations due tothe annual variation in erosive rainfall. The input from renewableresources was approximately unchanged at this temporal scalebecause of the small annual fluctuation in the total evaporationduring the study period.
The purchased resources showed the largest percentage of allthe inputs in the catchment; fertilisers accounted for 63.9% of thesepurchased resources because rain-fed farming is practised in theYangou catchment. Since water and nutrients are principal limitingfactors for local crop production, farmers try to elevate gainproduction yields by fertilising.
Based on the analysis of emergy flows, the structure of resourceuse was found to be inappropriate in the Yangou catchment. In fact,according to our survey during the study period, the use of fertil-iser, pesticide and insecticide has increased, while farmyardmanure use in cultivation has decreased. The reason for this situ-ation is that as a result of substantial decrease in cultivated landattributed to cropland retirement, many farmers are unwilling toraise the cattle that were usually used as draft animals for tractionin production prior to the implementation of the ecological resto-ration programme and were also the main animals producingstable manure. Decreases in the quantity of these cattle led directlyto the shortage in stable manure. Thus farmers had to begin usingchemical fertiliser to cover this shortage in agricultural production.The increased use of chemical fertilisers and intensive use oflimited cropland without application of organic fertilisers can leadto the deterioration of both soil quality and fertility and thecontamination of water bodies. The overuse of purchased inorganicinputs implies weak sustainability in the long run. Therefore,

Table 1Main emergy indexes and flows for time series emergy synthesis of the Yangou catchment.
No. Flow/index Units Expression 1998 1999 2000 2001 2002
1 Renewable emergy flow sej ha�1 yr�1 R 1.968E þ 15 2.139E þ 15 2.183E þ 15 2.171E þ 15 2.119E þ 152 Nonrenewable indigenous flow sej ha�1 yr�1 N 7.225E þ 14 5.868E þ 14 6.413E þ 13 7.432E þ 13 3.800E þ 133 Purchased emergy sej ha�1 yr�1 F 1.220E þ 16 1.207E þ 16 1.065E þ 16 1.031E þ 16 1.018E þ 16
Inorganic sej ha�1 yr�1 FN 8.080E þ 15 7.995E þ 15 7.824E þ 15 7.426E þ 15 7.274E þ 15Organic sej ha�1 yr�1 FR 4.121E þ 15 4.079E þ 15 2.828E þ 15 2.883E þ 15 2.909E þ 15
4 Total emergy used sej ha�1 yr�1 UE 1.489E þ 16 1.480E þ 16 1.290E þ 16 1.255E þ 16 1.234E þ 165 Fraction of use that is renewable R/UE 0.132 0.145 0.169 0.173 0.1726 Emergy investment ratio (EIR) F/(R þ N) 4.535 4.430 4.740 4.592 4.7207 Emergy yield ratio (EYR) UE/F 1.221 1.226 1.211 1.218 1.2128 Environmental loading ratio (ELR) (N þ F)/R 6.566 5.920 4.908 4.783 4.8229 Emergy sustainability index (ESI) EYR/ELR 0.186 0.207 0.247 0.255 0.25110 Gross output economic value sej $�1 V 879 123 890 540 1 018 666 1 230 132 1 234 62611 Emergy to money ratio (EMR) UE/V 1.694E þ 10 1.662E þ 10 1.266E þ 10 1.021E þ 10 9.994E þ 0912 Empower density sej ha�1 yr�1 Empd 1.489E þ 16 1.480E þ 16 1.290E þ 16 1.255E þ 16 1.234E þ 1613 Renewable empower density sej ha�1 yr�1 Empd (r) 1.968E þ 15 2.139E þ 15 2.183E þ 15 2.171E þ 15 2.119E þ 1514 Population inhabitant P 2888 2931 2966 3044 311715 Emergy use per person sej cap�1 yr�1 Empd*erea/P 2.424E þ 16 2.373E þ 16 2.044E þ 16 1.938E þ 16 1.861E þ 1616 Renewable carrying capacity person (R/U)*population 382 424 502 526 53517 Developed carrying capacity at 2004
China standard of livingperson NSL*(R/U)*population 3957 4392 5206 5458 5551
18 Renewable support area (SA(r)) ha Empd*area/Empd (r) 3.556E þ 04 3.252E þ 04 2.777E þ 04 2.718E þ 04 2.737E þ 0419 R* at the 2004 standard of living
for Chinasej yr�1 (F þ N)d/ELR(r) 1.256E þ 19 1.393E þ 19 1.681E þ 19 1.725E þ 19 1.711E þ 19
20 Synchronal support area at the 2004standard of living for China
ha R*/Empd (r) 6383 6516 7698 7945 8072
No. Flow/index Units Expression 2003 2004 2005 Mean (SD)a
1 Renewable emergy flow sej ha�1 yr�1 R 2.132E þ 15 2.556E þ 15 2.389E þ 15 2.207 (0.170)E þ 152 Nonrenewable indigenous flow sej ha�1 yr�1 N 9.750E þ 12 6.813E þ 13 1.613E þ 13 1.795 (2.267)E þ 143 Purchased emergy sej ha�1 yr�1 F 1.027E þ 16 9.451E þ 15 9.249E þ 15 1.055(0.101)E þ 16
Inorganic sej ha�1 yr�1 FN 7.517E þ 15 6.700E þ 15 6.460E þ 15 7.409 (0.548)E þ 15Organic sej ha�1 yr�1 FR 2.750E þ 15 2.750E þ 15 2.789E þ 15 3.139 (0.558)E þ 15
4 Total emergy used sej ha�1 yr�1 UE 1.241E þ 16 1.207E þ 16 1.165E þ 16 1.295 (0.114)E þ 165 Fraction of use that is renewable R/UE 0.172 0.212 0.205 0.172 (0.025)6 Emergy investment ratio (EIR) F/(R þ N) 4.793 3.601 3.846 4.407 (0.414)7 Emergy yield ratio (EYR) UE/F 1.209 1.278 1.260 1.229 (0.024)8 Environmental loading ratio (ELR) (N þ F)/R 4.820 3.724 3.878 4.928 (0.885)9 Emergy sustainability index (ESI) EYR/ELR 0.251 0.343 0.325 0.258 (0.050)10 Gross output economic value sej $�1 V 1 431 799 1 554 210 1 683 509 1 240 326 (281 443)11 Emergy to money ratio (EMR) UE/V 8.666E þ 09 7.769E þ 09 6.923E þ 09 1.122 (0.360)E þ 1012 Empower density sej ha�1 yr�1 Empd 1.241E þ 16 1.207E þ 16 1.165E þ 16 1.295 (0.114)E þ 1613 Renewable empower density sej ha�1 yr�1 Empd (r) 2.132E þ 15 2.556E þ 15 2.389E þ 15 2.207 (0.170)E þ 1514 Population inhabitant P 3194 3241 3255 3079 (134)15 Emergy use per person sej cap�1 yr�1 Empd*erea/P 1.826E þ 16 1.751E þ 16 1.683E þ 16 1.977 (0.259)E þ 1616 Renewable carrying capacity person (R/U)*population 549 686 667 525 (98)17 Developed carrying capacity at 2004
China standard of livingperson NSL*(R/U)*population 5691 7114 6919 5441 (1021)
18 Renewable support area (SA(r)) ha Empd*area/Empd (r) 2.735E þ 04 2.220E þ 04 2.293E þ 04 2.758 (0.416)E þ 0419 R* at the 2004 standard of living
for Chinasej yr�1 (F þ N)d/ELR(r) 1.712E þ 19 2.215E þ 19 2.127E þ 19 1.727 (0.303)E þ 19
20 Synchronal support area at the 2004standard of living for China
ha R*/Empd (r) 8028 8667 8904 7827 (850)
a SD represents standard deviation.
X.H. Dang, G.B. Liu / Journal of Environmental Management 102 (2012) 55e64 61
measures should be taken to improve the input structure offarming. In addition, more attention should be paid to furthermitigating soil erosion through, for example, enhancing manage-ment of planted forests so that their ecological functions are ful-filled as quickly and fully as possible.
Taking into account the population factor of scale, the evolutionof the potential standard of living in emergy terms or emergy useper capita showed a decrease (Table 1, item 15). This was becausethe renewable resources (R) were almost unchanged, the nonre-newable indigenous flow (N) and purchased emergy (F) declined,and the population had a steady increase during the study period.
Taking into account the area size factor of the catchment,territorial intensity of the emergy actually used or empowerdensity decreased at an average annual rate of 2.7% over the wholeperiod. If we consider that the agroecosystem of the catchment isincreasingly dependent on purchased and nonrenewable sources,
the empower density depends mainly on the non-renewable frac-tion of empower density (78.8%e86.8% of total empower density isnonrenewable), especially the purchased fraction. According toBrown and Ulgiati (2001), the empower density averaged1.295 � 0.114E þ 16 sej ha�1 yr�1, falling the interval of10e1000E þ 11 sej m�2 yr�1, which indicates industrial agricultureand extractive industries. The result is consistent with the presentsituation of the Yangou catchment, showing that in spite of therural area, its agroecosystem uses exceeded non-renewable inputsand it exhibits some essential features of industrial agriculture,which in turn goes against the goals of ecological restoration forthat catchment.
Taking into account the economic size factor of scale in terms ofthe output economic value, the average emergy which is mobilisedper monetary unit or the buying power (emergy to money ratio,EMR) decreased an average of 7.4% annually throughout the study

Table 2Main emergy flows supporting economies for Shaanxi province, China and the world.
Item U R N F ELR Population Emergy useper capita
NSL ¼ U/R Empowerdensity
EMR
(sej yr�1) (sej yr�1) (sej yr�1) (sej yr�1) (person) (sej person�1) (sej ha�1) (sej $�1)
the case study(2004)a
1.207E þ 16 2.556E þ 15 6.813E þ 13 9.451E þ 15 3.72 3.241E þ 03 1.751E þ 16 e 1.207E þ 16 4.623E þ 13
Shaanxi preovince(2000)b
1.797E þ 22 3.311E þ 21 2.013E þ 21 1.265E þ 22 1.20 e e e 6.876E þ 15 e
China (2004)c 1.94E þ 25 1.87E þ 24 1.30E þ 25 3.85E þ 24 8.99 1.302E þ 09 1.49E þ 16 10.37 2.02E þ 16 1.18E þ 13Global economy
(1999)d5.10E þ 25 1.59E þ 25 3.44E þ 25 2.22 5.900E þ 09 8.52E þ 15 3.22 e e
a this study for the case catchment.b Data source, Liu, X.W., Chen, B.M., 2007. Efficiency and sustainability analysis of grain production in Jiangsu and Shaanxi Provinces of China. Journal of Cleaner Production
15, 313e322.c Data source, Jiang, M.M., Zhou, J.B., Chen, B., Chen, G.Q., 2008. Emergy-based ecological account for the Chinese economy in 2004. Communications in Nonlinear Science
and Numerical Simulation 13, 2337e2356.d Data source, Cialani, C., Russi, D., Ulgiati, S., 2005. Investigating a 20-year national economic dynamics by means of eMergy-based indicators. In: Brown, M.T., Bardi, E.,
Tilley, D., Ulgiati, S. (Eds.), eMergy Synthesis 3: Theory and Applications of the eMergy Methodology, Proceedings of the Third Biennial eMergy Conference. Center forEnvironmental Policy, University of Florida, Gainesville, FL, USA, pp. 325e334.
X.H. Dang, G.B. Liu / Journal of Environmental Management 102 (2012) 55e6462
period. The main reasons for this decrease are that, in addition tothe decrease in the total emergy flows used, the catchment’s outputeconomic value experienced a steady growth from 1998 to 2005. Acomparison of EMR, or buying power in emergy terms, for China asa whole (1.18E þ 13 sej $�1) to the EMR for this catchment (alsocalled the Emergy Exchange Ratio, EER) shows that there aredifferences in the relative buying power of different parts of thecountry. So as an energy resources exporting region, the Yangoucatchment has an emergy advantage in product exchanges withthose regions having an EMR close to the national average.However, North Shaanxi Province, in which the case study area islocated, is an important energy resource and chemical engineeringbase for China; and its economy is mainly based on the extractionand export of coal, oil and natural gas. The eastern developed parts(generally having an EMR lower than North Shaanxi Province) ofChina are considered the importers of these energy resources,where a rapid increase in the use of energy and other rawmaterialshas promoted a highly industrialized trend that shifts the envi-ronmental impacts required by their growth to those regions thatsupply energy sources and raw materials. This has exacerbatedpoverty in the under-developed supplier regions with tradingdisadvantages in emergy terms (those which have an EER smallerthan EER in the developed importer regions). This situation clearlymakes it difficult to coordinate ecological rehabilitation with theimprovement of living condition for the local people.
The EYR for the Yangou catchment was only slightly higher than1 (Table 1, item 7), indicating that the resource conversion effi-ciency of each process was still low. Compared to the ELR (1.20) andESI (1.18) of the grain production system for Shaanxi Province in2000 (Liu and Chen, 2007), the ELR and ESI value of the catchmentaveraged 4.928 � 0.885 and 0.258 � 0.05, respectively, during theperiod from 1998 to 2005 (see Tables 1 and 2), thus reflecting thefact that this catchment has a very highly developed consumersystem.
4.2. Carrying capacity
In this work emergy use per personwas used as an expression ofthe people’s standard of living. During the study period from 1998to 2005, at the present standard of living the renewable resourcesof this case catchment could support a human carrying capacity of382 (1998) to 686 (2004) people (i.e., the lower limit to the people-based carrying capacity), only 13.2e20.5% of its respective 1998 and2004 populations. The present human population indicated thattheway of life in this catchment is not sustainable using the presentsystem design. In the long run human population and/or the
standard of living must adjust to come within the range that therenewable environmental resource base can support. On the otherhand, the developed carrying capacity exceeded 1.37 (3957 peoplein 1998) to 2.20 (7114 people in 2004) times its present population.The developed human carrying capacity is defined as the number ofpeople a region or country could support at their present standardof living if its emergy use was 8 times the renewable resource base(Campbell, 1998). The factor of eight represents an average ratio fordeveloped countries in the world circa 1980 (Odum et al., 1987).China is a developing country and the case study area is lessdeveloped, so we take the 2004 standard of living of China asa reference for calculating the developed human carrying capacityfor the Yangou catchment, that is, we assume that the catchmentuses 10.37 (the ratio of the total emergy use to the renewableemergy of China in 2004) times its renewable emergy. That meansthe Yangou catchment’s population can increase 1.8 times onaverage before it reaches to the upper limit of population that thecatchment can support at 2004 standard of living for China. Such anincrease clearly will be at the expense of its environment andresources.
The renewable support area ranges between 22 200 ha (2004)and 35 560 ha (1998), exceeding 4.72e7.57 times the actual area ofthis catchment respectively. This implies that the present people’sstandard of living exceeds what the renewable resource base cansupport. Corresponding to the people-based developed carryingcapacity, the area-based developed carrying capacity was between6383 ha (1998) and 8904 ha (2005), indicating that if people in thiscatchment live at the Chinese standard of living in 2004, they needa support area 1.36e1.89 times its actual area. Taking into accountthe people-based developed carrying capacity, an average 1.438 ha/cap of the developed support area per capita is given by dividingthe developed support area by the people-based developedcarrying capacity (7827 ha/5441 people between 1998 and 2005).This confirms the pattern suggested by another study of ecologicalfootprint in the same catchment. Dang (2007) estimated theecological footprint changes of the Yangou catchment to be from2.056 ha/inhabitant (1998) to 1.387 ha/inhabitant (2005), whichovershot the catchment’s biocapacity by 154 percent in 1998 and by83 percent in 2005 and agrees well with the developed supportarea per capita determined by the present study.
5. Conclusions
In general, the results from carrying capacity did not indicatesignificant environmental performances of the ecological restora-tion programme in the Yangou catchment. There were, however,

X.H. Dang, G.B. Liu / Journal of Environmental Management 102 (2012) 55e64 63
some improvements in the environmental aspects as shown byseveral emergy-based indices over the study period, and it wasfound that the present population did not exceed its people-baseddeveloped carrying capacity (i.e., upper limit). These improvementswere primarily related to the decrease in the use of local non-renewable resources, and because the cropland retirement, reveg-etation and conservation effectively eliminated soil erosion, thuscontributing to the decrease in non-renewable uses. Consequently,land productivity increased during the study period. The results ofthis study also suggest that further actions are necessary forconservation of environmental resources, improvement of emergyinput structure in agricultural production and change in the way oflife for local people in the Yangou catchment.
Again in this paper we have demonstrated a quantitativemethod for evaluating carrying capacity and sustainability ofa geomorphic unit under an ecological restoration programme. Itcan be argued that sustainable development, in the long run, is thatwhich can be supported by the flow of renewable emergy fora given region as was shown by this study. In this sense, anyecological restoration programme in a given region should belinked to preservation of the environmental support area and thechanges in the way of life for local people, because regionalsustainability depends on the wise use of indigenous resources. Byadding a quantitative methodology to the evaluation and discus-sion of environmental decision making, we may move a stepforward in achieving a more balanced approach to human use ofenvironments.
Acknowledgements
This workwas funded by the Strategic Technology Project of CAS(XDA05060300), the Science and Technology Research and Devel-opment Program of Shaanxi Province (2011JQ5007), and theNational Key Technology R & D programme (No. 2011BAD31B05).The authors appreciate the cadres of the villages in the casecatchment for their help in conducting the household surveys. Theauthors gratefully acknowledge four anonymous reviewers for theirhighly valuable suggestions. We also thank Mr. Terry Evan Baxter,an associate professor of Northern Arizona University for his help inlanguage edits in this manuscript.
Supplementary data
Supplementary data associated with this article can be found, inthe online version, at doi:10.1016/j.jenvman.2012.02.023.
References
Arrow, K., Bolin, B., Costanza, R., Dasgupta, P., Folke, C., Holling, C.S., Jansson, B.O.,Levin, S., Maeler, K.G., Perrings, C., Dimentel, D., 1995. Economic growth,carrying capacity, and the environment. Science 268 (5210), 520e521.
Barrow, C.J., 2003. Introduction: land degradation in Africa. Land Degradation andDevelopment 14, 3.
Brown, M.T., Buranakarn, V., 2003. Emergy indices and ratios for sustainablematerial cycles and recycle options. Resources. Conservation and Recycling 38,1e22.
Brown, M.T., Ulgiati, S., 1997. Emergy-based indices and ratios to evaluatesustainability: monitoring economies and technology toward environmentallysound innovation. Ecological Engineering 9, 51e69.
Brown, M.T., Ulgiati, S., 2001. Emergy measures of carrying capacity to evaluateeconomic investments. Population and Environment 22 (5), 471e501.
Brown, M.T., Ulgiati, S., 2002. Emergy evaluations and environmental loading ofelectricity production systems. Journal of Cleaner Production 10, 321e334.
Brown, M.T., Ulgiati, S., 2004. Emergy analysis and environmental accounting.Encyclopedia Energy 2, 329e354.
Brown, M.T., Odum, H.T., Murphy, R.C., Christianson, R.A., Doherty, S.J.,McClanahan, T.R., Tennenbaum, S.E., 1995. Rediscovery of the world: developingan Interface of ecology and economics. In: Hall, C.A.S. (Ed.), Maximum Power:The Ideas and Applications of H. T. Odum. University of Colorado Press, Boulder,pp. 216e250.
Brown, M.T., Brandt-Williams, S., Tilley, D.R., Ulgiati, S., 2000. Emergy Synthesis:Theory and Application of the Emergy Methodology. University of Florida,Center for Environmental Policy, Gainesville, pp. 328.
Campbell, D.E., 1998. Emergy analysis of human carrying capacity and regionalsustainability: an example using state of Maine. Environmental Monitoring andAssessment 51, 531e569.
Cohen, J.E., 1995. Population growth and Earth’s human carrying capacity. Science26 (5222), 341e346.
Cohen, J.E., 1997. Population, economics, environment and culture: an introductionto human carrying capacity. Journal of Applied Ecology 34 (6), 1325e1333.
Cuadra, M., Björklund, J., 2007. Assessment of economic and ecological carryingcapacity of agricultural crops in Nicaragua. Ecological Indicators 7, 133e149.
Dang, X.H., 2007. A study on economic process and ecological/economic coupling inthe ecological restoration in Loess Hilly Region. Dissertation for Doctor’sDegree, Graduate University of Chinese Academy of Sciences, Yangling, Shaanxiprovince, China (in Chinese).
Douglas, I., 1989. Land degradation, soil conservation and the sediment load of theYellow River, China: review and assessment. Land Degradation and Rehabili-tation 1, 141e151.
FAO-UNESCO, 1977. FAO-UNESCO Soil Map of the World, 1:50,000,000. Sheets VIII-1, VIII-2, VIII-3: North and Central Asia. UNESCO, Paris.
Fearnside, P.M., 1997. Human carrying capacity estimation in Brazilian Amazonia asa basis for sustainable development. Environmental Conservation 24 (3),271e282.
Folke, C., Jansson, A., Larsson, J., Costanza, R., 1997. Ecosystem appropriation bycities. AMBIO 26 (3), 167e172.
Forest and Grassland Taskforce of China, 2003. In Pursuit of a Sustainable GreenWest. Newsletter. January.
Hall, C.A.S., 1992. Economic development or developing economics: what are ourpriorities? In: Wali, M.K. (Ed.), Ecosystem Rehabilitation Policy Issues, vol. 1.Academic Publishing, the Hague, the Netherlands, pp. 101e120.
Hopfenberg, R., 2003. Human carrying capacity is determined by food availability.Population and Environment 25 (2), 109e117.
Jiang, M.M., Zhou, J.B., Chen, B., Chen, G.Q., 2008. Emergy-based ecological accountfor the Chinese economy in 2004. Communications in Nonlinear Science andNumerical Simulation 13, 2337e2356.
King, J., Slesser, M., 1995. Prospects for sustainable development: the significance ofpopulation growth. Population and Environment 16 (6), 487e505.
Li, J.C., 1984. The development of history of agricultural and livestock production inthe northern part of Shaanxi province. Agricultural Research in the Arid Areas 1,76e89 (in Chinese).
Li, Z., Song, R.M., 1994. A study on pertinence between ecologically sensitive zonesand poverty-stricken areas. Rural Economy and Society 5, 49e56 (in Chinese).
Liu, G.B., 1999. Soil conservation and sustainable agriculture on the Loess Plateau:challenges and prospects. AMBIO 28, 663e668.
Liu, R.Z., Borthwick, A.G.L., 2011. Measurement and assessment of carrying capacityof the environment in Ningbo, China. Journal of Environmental Management92, 2047e2053.
Liu, X.W., Chen, B.M., 2007. Efficiency and sustainability analysis of grain productionin Jiangsu and Shaanxi Provinces of China. Journal of Cleaner Production 15,313e322.
Liu, J.G., Li, S.X., Ouyang, Z.Y., Tam, C., Chen, X.D., 2008. Ecological and socioeco-nomic effects of China’s policies for ecosystem services. PNAS 105, 9477e9482.
Lomas, P.L., Álvarez, S., Rodiguez, M., Montes, C., 2008. Environmental accounting asa management tool in the Mediterranean context: the Spanish economy duringthe last 20 years. Journal of Environmental Management 88, 326e347.
McConnell, R.L., 1995. The human population carrying capacity of the ChesapeakeBay watershed: a preliminary analysis. Population and Environment 16 (4),339e352.
Nam, J., Chang, W., Kang, D., 2010. Carrying capacity of an uninhabited island off thesouthwestern coast of Korea. Ecological Modelling 221 (17), 2102e2107.
Odum, H.T., 1980. Principle of environmental energy matching for estimatingpotential economic value: a rebuttal. Coastal Zone Management 5 (3), 239e243.
Odum, H.T., 1988. Self organization, transformity and information. Science 242,1132e1139.
Odum, H.T., 1994. Ecological and General Systems: An Introduction to SystemsEcology. University Press of Colorado, Niwot, CO.
Odum, H.T., 1996. Environmental AccountingdEmergy and Decision Making. JohnWiley & Sons, New York.
Odum, H T., Odum, E C., Blissett, M., 1987. The Texas system, emergy analysis andpublic policy. A special project report, L.B. Johnson School of Public Afairs.University of Texas at Austin, and the Office of Natural Resources, TexasDepartment of Agriculture, Austin, pp. 92.
Odum, H.T., Brown, M.T., Brandt-Williams, S., 2000. Handbook of Emergy Evalua-tion. In: Introduction and Global Budget, Folio #1. Center for EnvironmentalPolicy. Environmental Engineering Sciences, University of Florida, Gainesville,FL, pp. 16.
Pereira, C.L.F., Orteg, E., 2010. Sustainability assessment of ethanol production fromsugarcane. Journal of Cleaner Production 18 (1), 77e82.
Rees, W.E., 2002. An ecological economics perspective on sustainability and pros-pects for ending poverty. Population and Environment 24, 15e46.
Sterrer, W., 1993. Human economics: a non-human perspective. EcologicalEconomics 7 (3), 183e202.
Taddesse, B., 1995. Deforestation and environmental degradation in Ethiopia: thecase of Jam province. Northeast African Studies 2, 139e156.

X.H. Dang, G.B. Liu / Journal of Environmental Management 102 (2012) 55e6464
Tilley, D.R., Swank, W.T., 2003. Emergy-based environmental systems assessment ofa multi-purpose temperate mixed-forest watershed of the southern Appala-chian Mountains, USA. Journal of Environmental Management 69, 213e227.
Ulgiati, S., Brown, M.T., 1998. Monitoring patterns of sustainability in natural andman-made ecosystems. Ecological Modelling 108 (1), 23e36.
Ulgiati, S., Brown, M.T., Bastianoni, S., Marchettini, N., 1996. Emergy based indicesand ratios to evaluate sustainable use of resources. Ecological Engineering 5,497e517.
Van Den Bergh, J.C.J.M., 1993. A framework for modeling economy-environment-development relationships based on dynamic carrying capacity and sustain-able development feedback. Environmental Resources and Economics 3 (4),395e412.
Wakernagle, M., Rees, W.E., 1996. Our Ecological Footprint: Reducing Human Impacton Earth. New Society Publishers, Gabriola Island, BC and Philadelphia, PA.
Wang, L.C., Xie, Y.C., 2004. Feature and mechanism of the socioeconomic system inpoverty-stricken areas characterized by ecological frailties: taking Longnan
District as a case. Journal of Northwest Normal University: Natural ScienceEdition 40 (1), 76e80 (in Chinese).
Wang, G.Y., Innes, J.L., Lei, J.F., Dai, S.Y., Wu, S.W., 2007. China’s forestry reforms.Science 318, 1556e1557.
Wetzel, K.R., Wetzel, J.F., 1995. Sizing the earth: recognition of economic carryingcapacity. Ecological Economics 12 (1), 13e21.
Wezel, A., Rath, T., 2002. Resource conservation strategies in agroecosystems ofsemi-arid West Africa. Journal of Arid Environments 51, 383e400.
Xu, J.T., Yin, R.S., Li, Z., Liu, C., 2006. China’s ecological rehabilitation: unprecedentedefforts, dramatic impacts, and requisite policies. Ecological Economics 57,595e607.
Yin, R.S., Yin, G.P., 2009. China’s primary programs of terrestrial ecosystem resto-ration: initiation, implementation, and challenges. Environmental Management45, 429e441.
Zhao, Y.L., Liu, Y.H., 1996. Distribution of vulnerable environment and its relation-ship with poverty in China. Anthropogeography 11 (2), 1e7 (in Chinese).