emergent properties from feature co-occurrence in … properties from feature co-occurrence in image...
TRANSCRIPT
Emergent Properties from Feature Co-occurrence inImage Collections
Umair Mateen Khan, Steven Mills, Brendan McCane, and Andrew TrotmanDepartment of Computer Science, University of Otago, Dunedin, New Zealand
{umairkhan, steven, mccane, andrew}@cs.otago.ac.nz
Abstract—This paper proposes a novel approach to exploreemergent patterns in images in an unsupervised setting. Weconsider emergent patterns to be sets of co-occurring visualwords that appear together more often than chance wouldindicate. Rather than focusing on finding ways to learn a largenumber of objects or their categories we focus on analyzingbehavior associated with emergent patterns. We show that thesepatterns emerge from the data and in some cases relate toobject identifiers. We extract SIFT descriptors [1] and thencluster them to represent each image as a bag-of-words. Toencode co-occurrences between visual words we represent themas edges of a graph which are weighted by the number of imagescontaining a particular co-occurrence. Performing a statisticalanalysis on weights of the edges identifies words which co-occursignificantly more often than expected. These highly co-occurringnodes produce clusters in the graph which can be separatedusing normalized cuts. Applying normalized cuts reveals that insimple images datasets these emergent clusters can identify objectclasses. Results on more complex datasets like Caltech101 [2]show that interesting patterns other than object classes can alsoemerge from the data.
I. INTRODUCTION
Learning useful information from data in an unsupervisedway is a challenging task but is becoming increasingly im-portant given the need to learn from extremely large datasets[3], [4], [5], [6]. The main motivation for such approachesover supervised ones is scalability, which is a prerequisitewhen working with large image datasets. We hypothesize thatemergent properties can serve as a basis for machine visionsystems even though such properties may be different to thosehumans use.
In this paper we propose an approach for exploring emer-gent patterns in a set of images in an unsupervised manner.Our approach is inspired by graph theoretic approaches andrepresents co-occurrence information among words in the formof a large graph. Partitioning this graph results in clusters ofco-occurring words which emerge from the dataset. Evaluatingemergent information is a challenging task, so to see whetherour proposed approach is finding useful emergent information,a simpler dataset is initially used. Later on experiments on amore complex dataset are conducted.
The main contribution of this paper is to suggest a novelcriterion for choosing significant edges of the graph whichare used in the graph partitioning process. This allows us toaddress the question — what do emerging patterns look likein databases of different levels of complexity? While thesepatterns may correspond to our a priori expectations of objectcategories or classes, this need not be the case.
Related Work
Prior literature on unsupervised learning from images canbe categorized into 3 broad domains: itemset-mining, statisticaland graph-based.
In [7] knowledge discovery in databases (KDD) was intro-duced and later several algorithms such as Apriori [8], Eclat[9], Fp-Growth [10] and Apriori Inverse [11] were developed tomine information from market basket datasets generated fromlist of items purchased by customers in their groceries. Thegrocery items in a basket or a transaction are called itemset.These algorithms focused on finding frequent and rare itemsetfrom the entire datasets.
Quack et al. [12] use itemset mining techniques, such asApriori [8], for solving computer vision problems. Each localneighborhood of image features is considered as a transactionin a market-basket metaphor. Frequent itemset mining tech-niques are applied and result in frequently co-occurring fea-tures pertaining to particular objects or movie actors. SimilarlyMalik [13] uses association rule mining for clustering webimages. Association rules are generated for both visual and textfeatures from web pages and then represented this as hyper-graphs, which are clustered to find similar images. Severalother papers have also used similar data mining approaches tofind interesting patterns in images [14], [15], [16], [17].
Sivic et al. [3] use statistical modeling to discover patternsin images. They use topic modeling via probabilistic LatentSemantic Analysis (pLSA). Topic modeling is a kind of gener-ative model initially used for identifying topics in text corporaand assumes each document has a mixture of topics, and eachtopic has a distribution of words. They use this approach fortopic discovery from unlabelled images; classification of un-seen images; and object detection. Performance was evaluatedon four categories (faces, motorbikes, airplanes, cars) fromthe Caltech101 dataset, giving an accuracy of more than 90%.They also introduce the notion of doublets which store infor-mation about spatially co-occurring regions. In another workSivic et al. [18] introduce the hierarchical Latent DirichletAllocation (hLDA) model for automatically discovering objecthierarchies from unlabeled data. Other notable work that usesstatistical modeling based approaches includes [5], [19].
Another broad area uses graph theoretic approaches to mineinformation. These techniques build graphs from visual wordsor images by capturing their correspondences. Graph clusteringor edge cutting techniques are then applied to obtain partitionsthat represent objects. Grauman and Darrell [20] present anapproach for categorizing unlabelled images. Their approachstarts by finding feature correspondences and based on these
correspondences they calculate affinities among images. Aspectral clustering technique is then applied to partition data.The partitioned data can be used to train classifiers for differentobject categories. Evaluation on the Caltech-4 dataset gives94% accuracy when grouping images according to their cate-gories. In another approach Kim et al [21] created a large graphdirectly from image features and then captured object categoryinformation using analysis techniques widely used in web andsocial network data. For the 4 objects from the Caltech101dataset they achieved a classification accuracy of 95.42% andfor 3 objects from TUD/ETHZ dataset a classification accuracyof 95.47% was achieved.
Most previous work described focuses on unsuperviseddiscovery of object categories which is different from whatwe aim for in our approach. We focus on finding emergentpatterns using co-occurrence of features that might or mightnot relate to a single object.
II. PROPOSED APPROACH
We consider the problem of finding emergent patterns as agraph clustering problem where clusters in a graph representsome emergent behavior. The graph contains co-occurrenceinformation among different visual words. An edge weightrepresents how many images contain a pair of words that co-occur. The goal is to partition the graph into parts that representemergent patterns.
In this paper we suggest an approach to select significantedges (co-occurrences) from a large numbers of total edges.Keeping only significant edges not only reduces the complexityof the graph partitioning process but also facilitates emergentpatterns by only keeping the most important information.
A. Co-occurrence Graph
We use SIFT [1] descriptors to represent image features.These descriptors are then quantized by using K-Means togenerate a Bag of Words representation for each image. Forour approach co-occurrence is the basis for emergence. Co-occurrence is encoded in a graph G(V,E) where a node,vi ∈ V , represents a single visual word, and an edge,ei ≡ (vi, vj , fij) ∈ E encodes the frequency, fij , of co-occurrence of two visual words, vi and vj , in the imageset (ignoring multiple co-occurrences in a single image). Theresulting graph is an undirected weighted graph.
B. Statistical Analysis and Graph Visualization
Significant edges are chosen based on the binomial test.The null hypothesis is that visual words appear independentlyin each image. Those words that co-occur much more fre-quently than expected are dependent on each other and areresult of some activity in images and hence they are chosen assignificant co-occurrences. This is measured by calculating az-score for each co-occurrence or an edge in our graph. Detailsof this process is given in Algorithm 1. This z-score is alsoassigned as edge weight by replacing previous co-occurrencecount based weight. The edges are then thresholded basedon this value, in order to keep only the most significant co-occurrences. We experimented with multiple z-score values asthresholds discussed in Sub-section III-A.
Algorithm 1: Finding significant edgesData: A graph G = (V,E) where an edge is a
co-occurrence of two words and edge weightencodes the frequency of this co-occurrence
Result: Edges score according to their statisticalsignificance
1 for each vi ∈ V do2 Find probability of each vertex:
P (vi) =# of document containing this word
total documents (n)
3 for each edge ek ∈ E in the graph do4 Compute joint probability of vertices vi and vj
co-occurring together P (vivj) = P (vi)P (vj)5 Compute the probability of failure
Q(vivj) = 1− P (vivj)6 Compute the mean of the binomial distribution
µ = nP (vivj)7 Compute the standard deviation:
σ =√nP (vivj)Q(vivj)
8 z-score =x− µσ
9 weight of an edge(wij) = z-score
The graph obtained after applying a threshold value is visu-alized using the graph viewing package Gephi [22]. Visualizingthe graph allows us to see emergent clusters before analyzingthem using a graph partitioning or clustering method. The edgeweight distribution can also give important insight to the graphstructure and could also be used for deciding the edge thresholdvalue. As described earlier, emergent patterns appear as denseclusters of words in the graph, ideally disconnected from eachother (although this is not the typical case).
C. Graph Clustering
Graphs obtained after only keeping the most significantedges still have many connections among emergent clusters.In order to obtain vertices that are related to each cluster we usespectral clustering via normalized cuts [23]. Unlike other graphpartitioning techniques, spectral clustering uses the spectrum(eigenvalues) of an affinity matrix of data points to obtain adimensionality reduced version of the data. The affinity matrixW is defined as:
Wij =
wij , if (vi, vj) ∈ E1, if i = j
0, otherwise.
(1)
Here wij is the weight (z-score) of the edge calculatedduring statistical analysis.
Experiments were performed with two partitioning algo-rithms: recursive two-way Ncut and simultaneous K-way cutwith multiple eigenvectors as described in [23]. The recur-sive two-way Ncut approach is a hierarchical partitioningtechnique, creating a tree of partitions. The root of this treecontains all nodes of the graph. At each level a partitioningproblem (D − W )x = λDx is solved for the eigenvectorswith the K smallest eigenvalues. Here W is the affinity matrixof the graph and D is a diagonal matrix containing the sum
of the weights incident on each vertex. For this approach,only the second smallest eigenvalue is used to bipartition thegraph, although the next few eigenvectors also contain usefulpartitioning information. For each subgraph we again solvethe partitioning problem and similarly use the second smallesteigenvalue to recursively partition it down to a fixed level. Thisapproach can be computationally wasteful, since it only usesthe second smallest eigenvector and ignores all others. For theSimultaneous K-way cut approach, instead of using the secondsmallest eigenvalues, the top K eigenvectors are used to get aK-way partition [23].
Purity Measure: Partitions obtained after normalized cutssplit words into different emergent clusters. In a scenariowhere a dataset contains images related to some categories ofobjects, it is possible that an emergent cluster may representone of these objects categories. To compute how much, or towhat extent words from an emergent cluster are related to aparticular object category, a metric called purity is used.
The purity of a cluster can be defined as:
purity(i) = maxj(Pi(cj)), and i = 1 to K (2)
Here, K is the total number of clusters obtained after nor-malized cuts and all the words in these clusters are from Ccategories of objects. Also, Pi(cj) is the proportion of thewords from the jth category to the total number of the wordsin all other categories, found in the ith cluster. The purity of acluster can only help us to evaluate whether a particular clusterbelongs to any object category or not and does not help to findemergent clusters. There could be a perfectly valid emergentcluster that does not belong to a single object category.
D. Image Ranking
Once we have different partitions or emergent clusters con-taining sets of words that co-occurred significantly more thantheir expectation, it is desirable to visualize these clusters. Allimages containing these clusters are identified and locationsof words in them are marked. A ranking mechanism is alsopresented to rank images according to the number of significantedges they contain. If an image contains a large number ofsignificant edges from a cluster then it covers a majority ofthe co-occurrences from this cluster and hence, is a betterrepresentation of this cluster. The total number of significantco-occurrences present in an image gives the rank of an image.
III. EXPERIMENTAL SETUP AND RESULTS
We have experimented with two different image datasets. Inthe first experiment we investigate emergence in a very simpleset of images. We created a dataset of 6000 images namedToymix as shown in Figure 6(a). It contains 6 objects andfor each object there are exactly 1000 images. This datasethas low complexity as there are only small transformations(rotations, translations and scale changes) in it and all imageshave a plain background. To see emergence in a more complexscenario we chose the Caltech101 [6] dataset and used 20categories from it, chosen based on a criteria of having at-least80 images, in total 1600 images from 20 categories. We used,the first 80 images per object to give equal weighting to allcategories even when more images were available. Figure 6(b)shows single images from each of the chosen categories. After
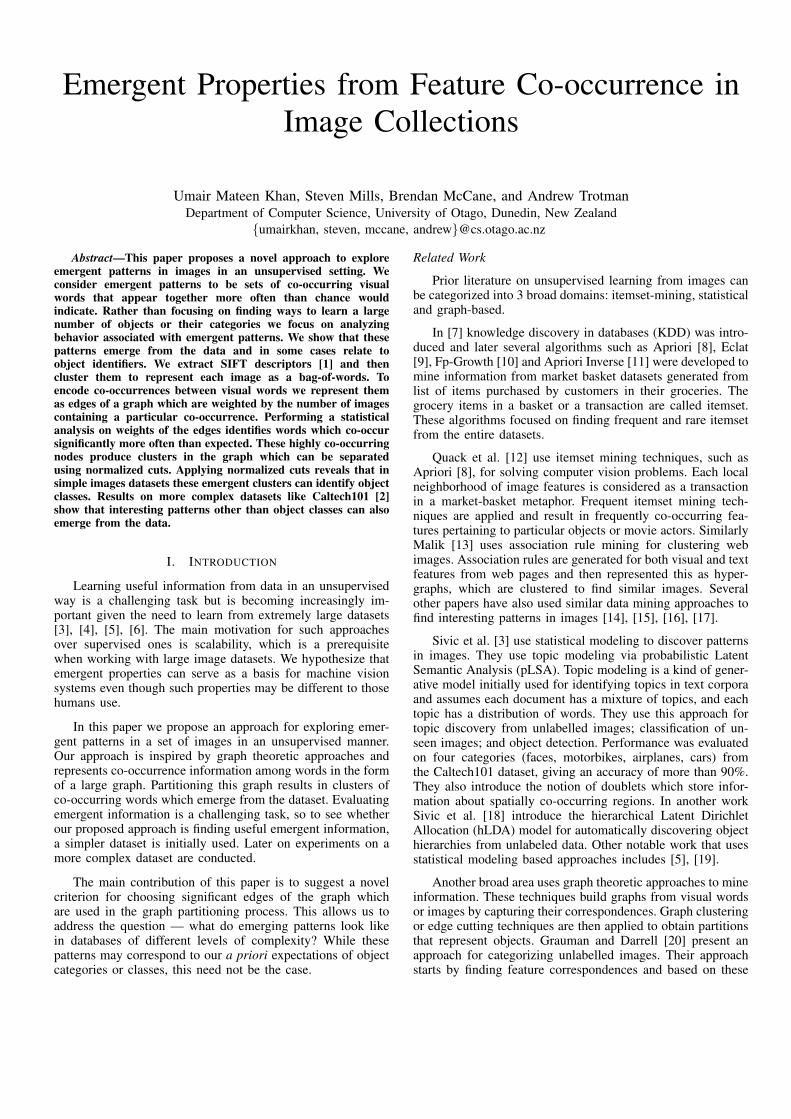
Figure 1. Edge weights distributions for both dataset for 10,000 visual words.
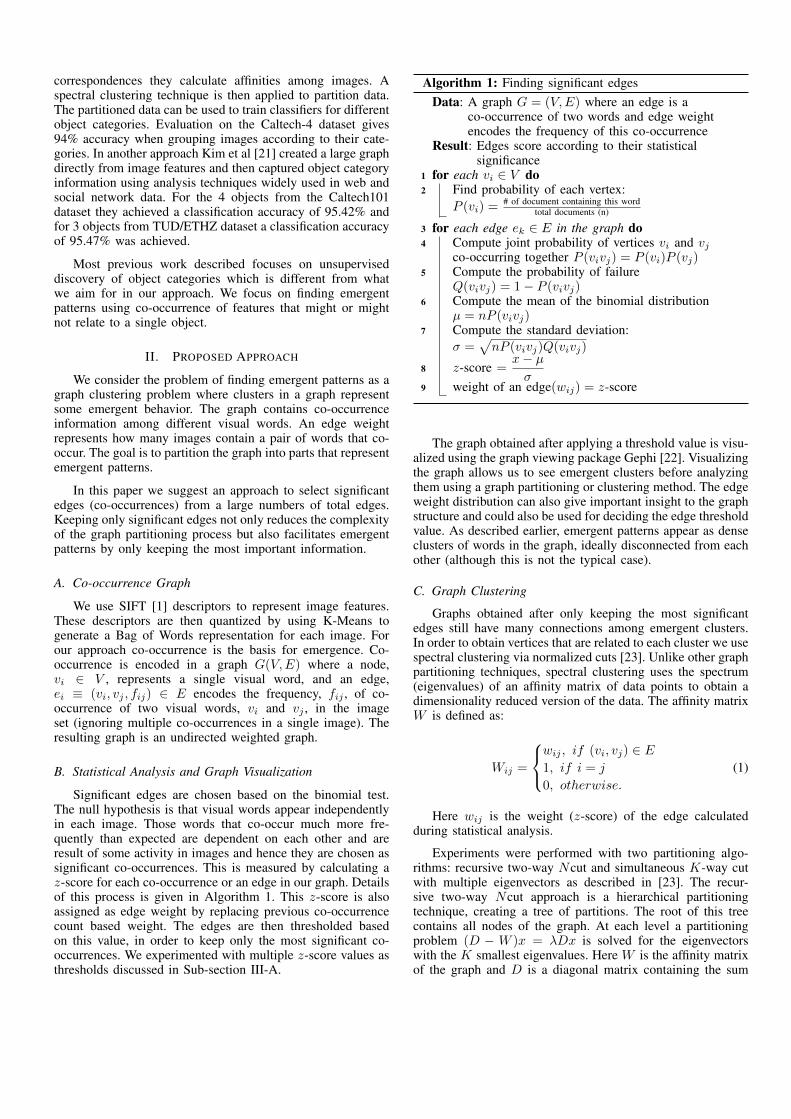
Figure 2. Graph structure obtained for 6 objects categories from the Toymixdataset. Here we keep significant edges by choosing a minimum z-score of30 as a threshold of significance (These figures are best viewed in color)
extracting SIFT [1] descriptors from images we quantized theminto 10,000 visual words in our experiments.
A. Graph building and Significant Co-occurrences Selection
For the Toymix dataset there are approximately 26 millionedges and for the Caltech101 dataset there are 46 millionedges. Figure 1 shows the edge weight distribution for thegraphs containing 10,000 vertices (visual word) generated foreach dataset. The maximum edge weights are z-scores of 68and 35 respectively. There are also significant differences inthe shape of the distributions. In the Toymix case the z-scoresare more spread out than in the Caltech101 case. As in theToymix, a large number of non-unique co-occurrences resultedin having a large number of bins in the edge weight histogram.On the other hand, in Caltech101 there are fewer non-uniqueco-occurrences which caused fewer bins.
Edges that have high z-scores are more significant becausesuch edges appeared more than expected and so should containmore important information. Up until this stage, no graphcutting or partitioning technique has been applied. The Toymix
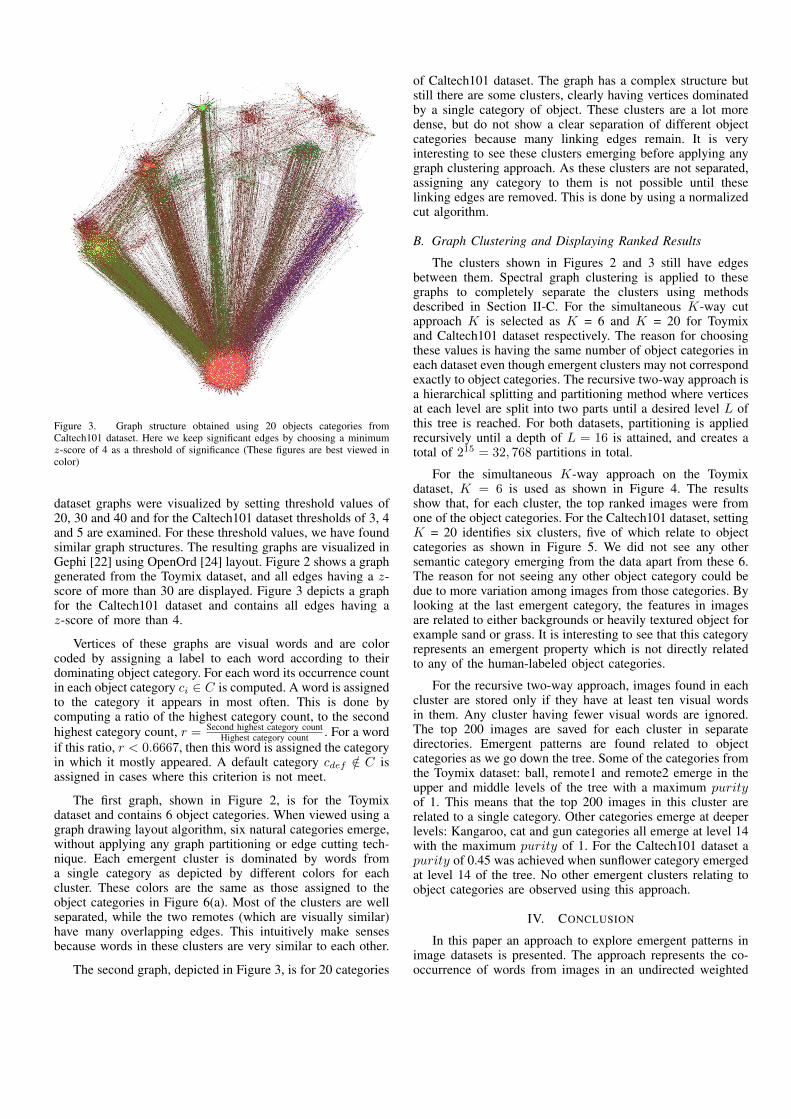
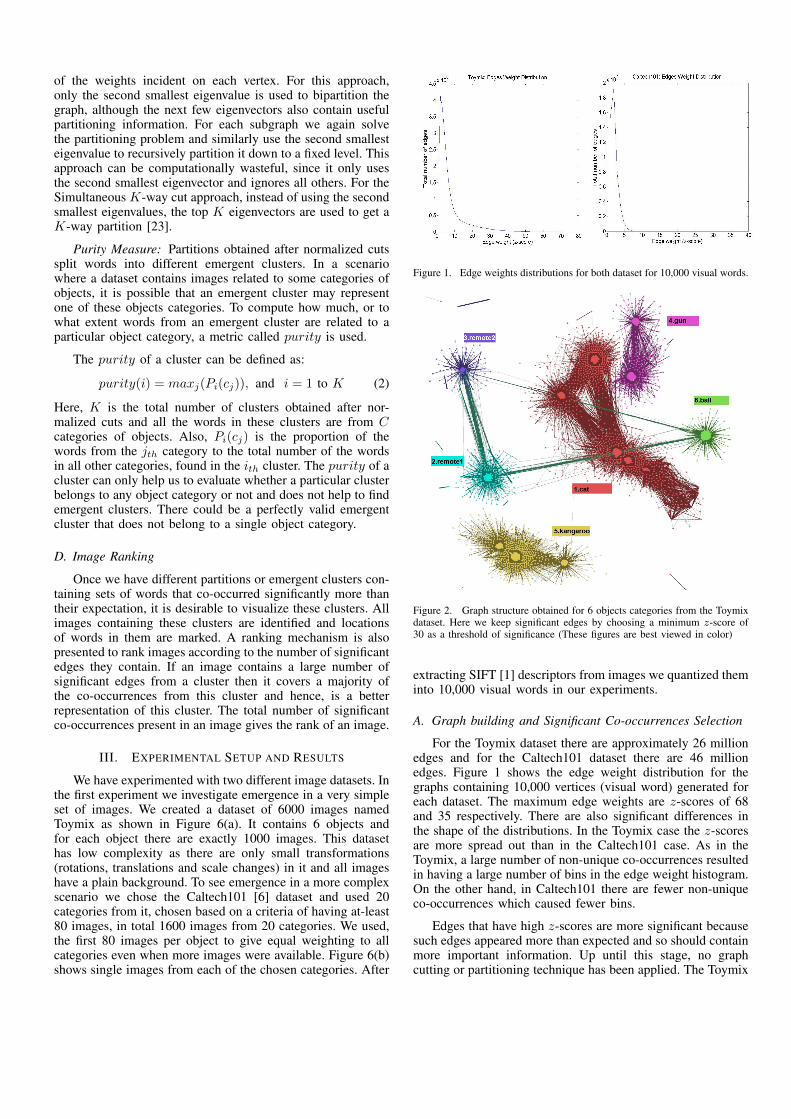
Figure 3. Graph structure obtained using 20 objects categories fromCaltech101 dataset. Here we keep significant edges by choosing a minimumz-score of 4 as a threshold of significance (These figures are best viewed incolor)
dataset graphs were visualized by setting threshold values of20, 30 and 40 and for the Caltech101 dataset thresholds of 3, 4and 5 are examined. For these threshold values, we have foundsimilar graph structures. The resulting graphs are visualized inGephi [22] using OpenOrd [24] layout. Figure 2 shows a graphgenerated from the Toymix dataset, and all edges having a z-score of more than 30 are displayed. Figure 3 depicts a graphfor the Caltech101 dataset and contains all edges having az-score of more than 4.
Vertices of these graphs are visual words and are colorcoded by assigning a label to each word according to theirdominating object category. For each word its occurrence countin each object category ci ∈ C is computed. A word is assignedto the category it appears in most often. This is done bycomputing a ratio of the highest category count, to the secondhighest category count, r = Second highest category count
Highest category count . For a wordif this ratio, r < 0.6667, then this word is assigned the categoryin which it mostly appeared. A default category cdef /∈ C isassigned in cases where this criterion is not meet.
The first graph, shown in Figure 2, is for the Toymixdataset and contains 6 object categories. When viewed using agraph drawing layout algorithm, six natural categories emerge,without applying any graph partitioning or edge cutting tech-nique. Each emergent cluster is dominated by words froma single category as depicted by different colors for eachcluster. These colors are the same as those assigned to theobject categories in Figure 6(a). Most of the clusters are wellseparated, while the two remotes (which are visually similar)have many overlapping edges. This intuitively make sensesbecause words in these clusters are very similar to each other.
The second graph, depicted in Figure 3, is for 20 categories
of Caltech101 dataset. The graph has a complex structure butstill there are some clusters, clearly having vertices dominatedby a single category of object. These clusters are a lot moredense, but do not show a clear separation of different objectcategories because many linking edges remain. It is veryinteresting to see these clusters emerging before applying anygraph clustering approach. As these clusters are not separated,assigning any category to them is not possible until theselinking edges are removed. This is done by using a normalizedcut algorithm.
B. Graph Clustering and Displaying Ranked Results
The clusters shown in Figures 2 and 3 still have edgesbetween them. Spectral graph clustering is applied to thesegraphs to completely separate the clusters using methodsdescribed in Section II-C. For the simultaneous K-way cutapproach K is selected as K = 6 and K = 20 for Toymixand Caltech101 dataset respectively. The reason for choosingthese values is having the same number of object categories ineach dataset even though emergent clusters may not correspondexactly to object categories. The recursive two-way approach isa hierarchical splitting and partitioning method where verticesat each level are split into two parts until a desired level L ofthis tree is reached. For both datasets, partitioning is appliedrecursively until a depth of L = 16 is attained, and creates atotal of 215 = 32, 768 partitions in total.
For the simultaneous K-way approach on the Toymixdataset, K = 6 is used as shown in Figure 4. The resultsshow that, for each cluster, the top ranked images were fromone of the object categories. For the Caltech101 dataset, settingK = 20 identifies six clusters, five of which relate to objectcategories as shown in Figure 5. We did not see any othersemantic category emerging from the data apart from these 6.The reason for not seeing any other object category could bedue to more variation among images from those categories. Bylooking at the last emergent category, the features in imagesare related to either backgrounds or heavily textured object forexample sand or grass. It is interesting to see that this categoryrepresents an emergent property which is not directly relatedto any of the human-labeled object categories.
For the recursive two-way approach, images found in eachcluster are stored only if they have at least ten visual wordsin them. Any cluster having fewer visual words are ignored.The top 200 images are saved for each cluster in separatedirectories. Emergent patterns are found related to objectcategories as we go down the tree. Some of the categories fromthe Toymix dataset: ball, remote1 and remote2 emerge in theupper and middle levels of the tree with a maximum purityof 1. This means that the top 200 images in this cluster arerelated to a single category. Other categories emerge at deeperlevels: Kangaroo, cat and gun categories all emerge at level 14with the maximum purity of 1. For the Caltech101 dataset apurity of 0.45 was achieved when sunflower category emergedat level 14 of the tree. No other emergent clusters relating toobject categories are observed using this approach.
IV. CONCLUSION
In this paper an approach to explore emergent patterns inimage datasets is presented. The approach represents the co-occurrence of words from images in an undirected weighted
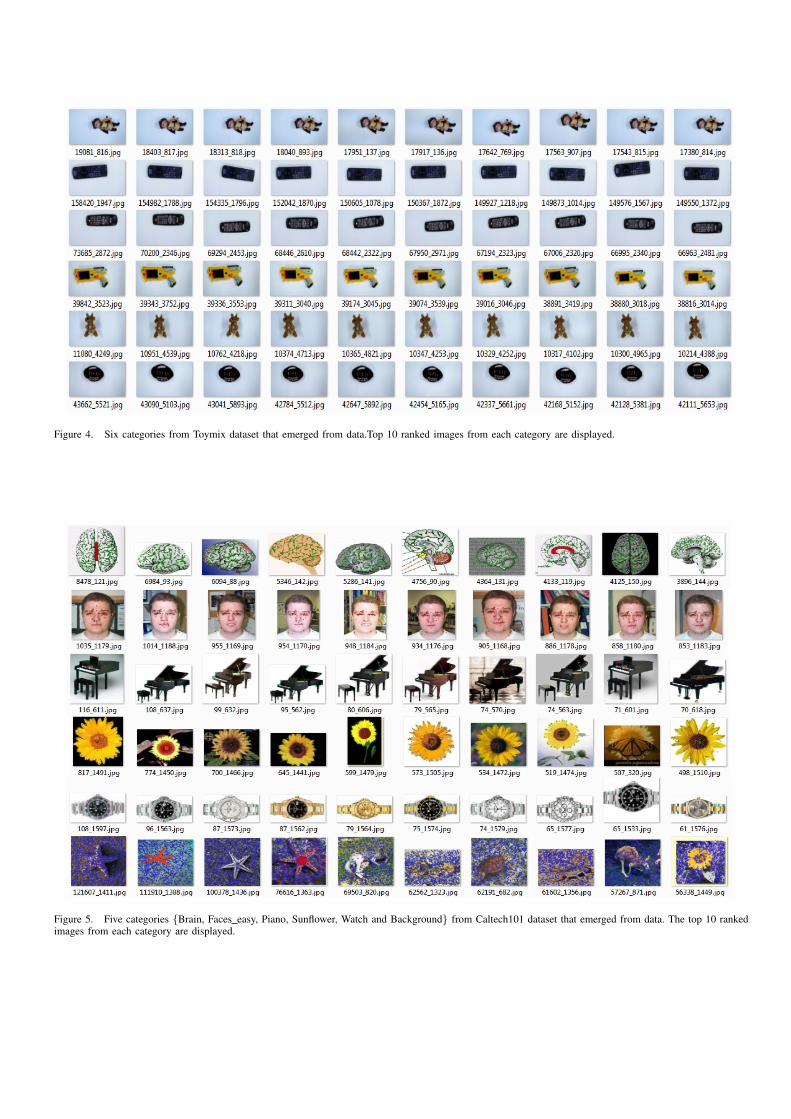
Figure 4. Six categories from Toymix dataset that emerged from data.Top 10 ranked images from each category are displayed.
Figure 5. Five categories {Brain, Faces easy, Piano, Sunflower, Watch and Background} from Caltech101 dataset that emerged from data. The top 10 rankedimages from each category are displayed.
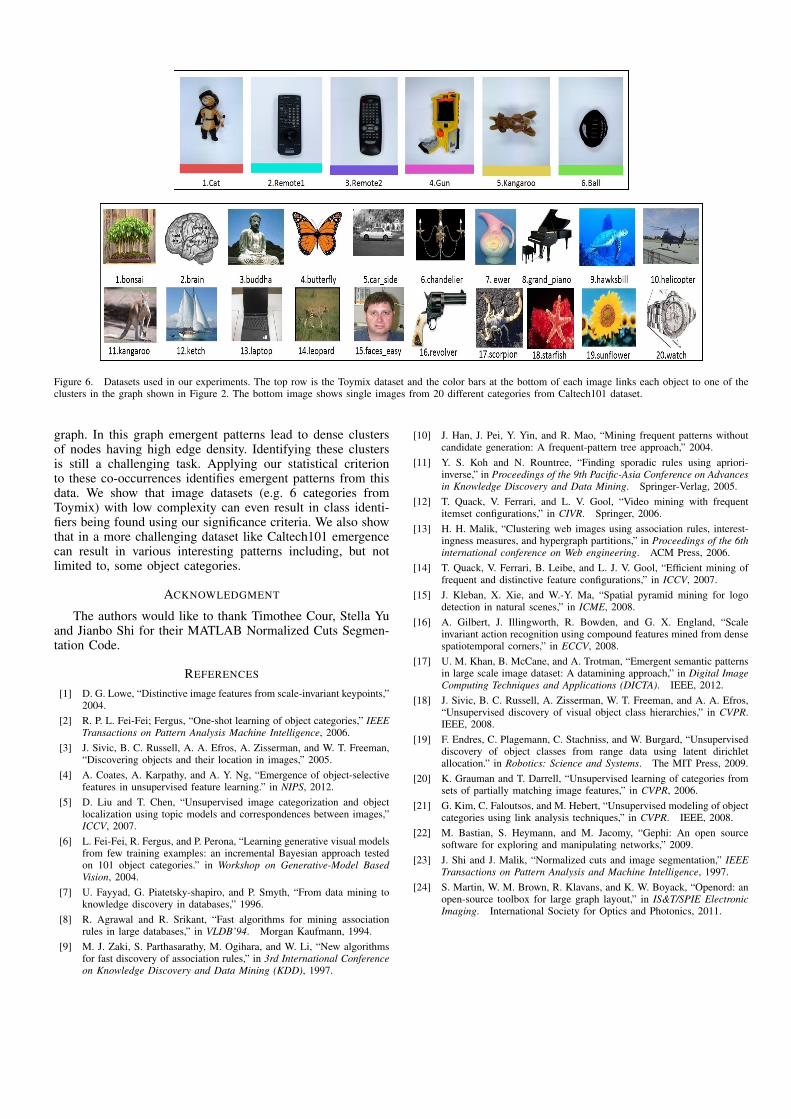
Figure 6. Datasets used in our experiments. The top row is the Toymix dataset and the color bars at the bottom of each image links each object to one of theclusters in the graph shown in Figure 2. The bottom image shows single images from 20 different categories from Caltech101 dataset.
graph. In this graph emergent patterns lead to dense clustersof nodes having high edge density. Identifying these clustersis still a challenging task. Applying our statistical criterionto these co-occurrences identifies emergent patterns from thisdata. We show that image datasets (e.g. 6 categories fromToymix) with low complexity can even result in class identi-fiers being found using our significance criteria. We also showthat in a more challenging dataset like Caltech101 emergencecan result in various interesting patterns including, but notlimited to, some object categories.
ACKNOWLEDGMENT
The authors would like to thank Timothee Cour, Stella Yuand Jianbo Shi for their MATLAB Normalized Cuts Segmen-tation Code.
REFERENCES
[1] D. G. Lowe, “Distinctive image features from scale-invariant keypoints,”2004.
[2] R. P. L. Fei-Fei; Fergus, “One-shot learning of object categories,” IEEETransactions on Pattern Analysis Machine Intelligence, 2006.
[3] J. Sivic, B. C. Russell, A. A. Efros, A. Zisserman, and W. T. Freeman,“Discovering objects and their location in images,” 2005.
[4] A. Coates, A. Karpathy, and A. Y. Ng, “Emergence of object-selectivefeatures in unsupervised feature learning.” in NIPS, 2012.
[5] D. Liu and T. Chen, “Unsupervised image categorization and objectlocalization using topic models and correspondences between images,”ICCV, 2007.
[6] L. Fei-Fei, R. Fergus, and P. Perona, “Learning generative visual modelsfrom few training examples: an incremental Bayesian approach testedon 101 object categories.” in Workshop on Generative-Model BasedVision, 2004.
[7] U. Fayyad, G. Piatetsky-shapiro, and P. Smyth, “From data mining toknowledge discovery in databases,” 1996.
[8] R. Agrawal and R. Srikant, “Fast algorithms for mining associationrules in large databases,” in VLDB’94. Morgan Kaufmann, 1994.
[9] M. J. Zaki, S. Parthasarathy, M. Ogihara, and W. Li, “New algorithmsfor fast discovery of association rules,” in 3rd International Conferenceon Knowledge Discovery and Data Mining (KDD), 1997.
[10] J. Han, J. Pei, Y. Yin, and R. Mao, “Mining frequent patterns withoutcandidate generation: A frequent-pattern tree approach,” 2004.
[11] Y. S. Koh and N. Rountree, “Finding sporadic rules using apriori-inverse,” in Proceedings of the 9th Pacific-Asia Conference on Advancesin Knowledge Discovery and Data Mining. Springer-Verlag, 2005.
[12] T. Quack, V. Ferrari, and L. V. Gool, “Video mining with frequentitemset configurations,” in CIVR. Springer, 2006.
[13] H. H. Malik, “Clustering web images using association rules, interest-ingness measures, and hypergraph partitions,” in Proceedings of the 6thinternational conference on Web engineering. ACM Press, 2006.
[14] T. Quack, V. Ferrari, B. Leibe, and L. J. V. Gool, “Efficient mining offrequent and distinctive feature configurations,” in ICCV, 2007.
[15] J. Kleban, X. Xie, and W.-Y. Ma, “Spatial pyramid mining for logodetection in natural scenes,” in ICME, 2008.
[16] A. Gilbert, J. Illingworth, R. Bowden, and G. X. England, “Scaleinvariant action recognition using compound features mined from densespatiotemporal corners,” in ECCV, 2008.
[17] U. M. Khan, B. McCane, and A. Trotman, “Emergent semantic patternsin large scale image dataset: A datamining approach,” in Digital ImageComputing Techniques and Applications (DICTA). IEEE, 2012.
[18] J. Sivic, B. C. Russell, A. Zisserman, W. T. Freeman, and A. A. Efros,“Unsupervised discovery of visual object class hierarchies,” in CVPR.IEEE, 2008.
[19] F. Endres, C. Plagemann, C. Stachniss, and W. Burgard, “Unsuperviseddiscovery of object classes from range data using latent dirichletallocation.” in Robotics: Science and Systems. The MIT Press, 2009.
[20] K. Grauman and T. Darrell, “Unsupervised learning of categories fromsets of partially matching image features,” in CVPR, 2006.
[21] G. Kim, C. Faloutsos, and M. Hebert, “Unsupervised modeling of objectcategories using link analysis techniques,” in CVPR. IEEE, 2008.
[22] M. Bastian, S. Heymann, and M. Jacomy, “Gephi: An open sourcesoftware for exploring and manipulating networks,” 2009.
[23] J. Shi and J. Malik, “Normalized cuts and image segmentation,” IEEETransactions on Pattern Analysis and Machine Intelligence, 1997.
[24] S. Martin, W. M. Brown, R. Klavans, and K. W. Boyack, “Openord: anopen-source toolbox for large graph layout,” in IS&T/SPIE ElectronicImaging. International Society for Optics and Photonics, 2011.