embraer market outlook 2009–2028 - team.aero · embraer market outlook 2009–2028 embraer –...
TRANSCRIPT

Embraer Market Outlook 2009–2028
Embraer – HeadquartersAv. Br igadeiro Far ia Lima, 2.170 12227-901 – São José dos Campos – SP – Brazi l Tel.: +55 12 3927 1000Fax: +55 12 3927 6600 Ex tension 1448
Sales Of f icesUSA, Canada & Caribbean276 SW 34th StreetFor t Lauderdale – FL 33315 – USATel.: +1 954 359 3700Fax: +1 954 359 8170
Europe, Middle East & AfricaBat. Eddington Par is Nord II – 33, Rue des VanessesBP 57391 Vi l lepinte95943 Roissy CDG Cedex – FranceTel.: +33 1 49 38 4400Fax: +33 1 49 38 4401
ChinaSuite 1806, Tower 2, China Central Place Of f ice Bui ldingNo. 79 Jianguo RoadChaoyang Distr ict – Bei j ing 100025People’s Republic of ChinaTel.: +86 10 6598 9988Fax: +86 10 6598 9986
Asia Pacif ic391B Orchard Road # 24-02 – Ngee Ann Ci t y – Tower B Singapore 238874 Tel.: +65 6734 4321Fax: +65 6734 8255
Latin AmericaEmpresa Brasi leira de Aeronáut ica SAAv. Br igadeiro Far ia Lima, 2.170 12227-901 – São José dos Campos – São Paulo – Brazi lTel.: +55 12 3927 3059Fax: +55 12 3927 8444
Feb, 2009

2
Any and all information contained herein is based on good faith assumptions and is provided for general information purposes only. This information does not constitute an of fer, promise, warranty, or guarantee of performance. This document should not be used or relied upon for any purpose other than as intended by Embraer.
30 to 60-Seat Turboprops
60+ Seat Turboprops 30 to 60-Seat Jets 61 to 90-Seat Jets 91 to 120-Seat Jets 121 to 210-Seat Narrow-Body Jets
210+ SeatWide-Body Jets
ATR-42Q300
Antonov An-140MA60
EMB-120Dornier DO328
Saab 340, 2000Fokker 50, F-27Jetstream 41
ATR-72Q400
Ilyushin Il-114
BAE ATP
ERJ 135, -140, -145CRJ100, 200, 440
328JetYAK-40
EMBRAER 170, 175CRJ701, 705, 900
TU-134 BAE 146-100, -200, AVRO-RJ70, -RJ85
Fokker F28, F70 DC-9-10, -20
ARJ-21Antonov An-148
Mitsubishi MRJ90
EMBRAER 190, 195A318
B737-600
B717, 727-100, 737-100, -200, -500
Fokker F100BAE 146-300, AVRO-RJ100
DC-9-30, -40, MD-87YAK-42 , BAC 111
Superjet 100CRJ1000, C110
A319, A320, A321B737-700, -800, -900
B707, 757, 727-200, 737-300, -400, -800
DC-9-50MD-80, -81, -82, -83, -88, -90
Tupolev TU-154, -204Ilyushin IL-62
C130
A330, A340, A380B777, B747
A300, A310, B767 DC-10MD-11
Ilyushin IL-86, -96
A350B787
De f in i t ions
Aircraft SegmentationEmbraer segments its forecast in the following categories:
Regional DefinitionsNorth America (USA and Canada)Latin America (includes Mexico and the Caribbean)Europe (includes Israel)Russia/CISAfrica Middle East (includes Egypt)Asia PacificChina (includes Hong Kong, Macau and Mongolia)
Data SourcesAll analyses developed in this outlook use data from:
Global InsightBACK, ACASICAO, IATA, ATA, CAAsSabreEmbraer Market IntelligenceAirlines
Contact InformationFor additional information or market discussions, please contact:
Erik Alexander JenichenMarket Strategy & Forecast ManagerEmbraer – Empresa Brasileira de Aeronáutica SAAvenida Brigadeiro Faria Lima 2170 – Mailbox 13112227-901, São José dos Campos, SP, Brazil Tel: +55 12 39273948Fax: +55 12 39273099
The Embraer Market Outlook–6th Edition is also available online at:www.embraer.com/outlookWe welcome your feedback. Send your comments to [email protected]

Embraer Market Outlook 2009–20286th Edition

5
ForewordExecutive SummaryMarket TrendsRegional OverviewMarket ForecastDefinitions


Foreword


9
When we conceived The Rule of 70 to 110 six
years ago, we foresaw untapped opportunity
in a market segment defined by the forces of
economic growth, capacity right-sizing, ageing
fleets and network development. Our E-Jets
family is the product of that vision.
As this 20-year forecast shows, that foresight
has proven to be accurate. More than 500
E-Jets are in service with airlines on every
continent, and the segment has attracted new
manufacturers. That success is reflected in
our numbers, which indicate continued growth
of commercial air transport, especially in the
emerging markets of China, Latin America and
Russia/CIS.
In a period of volatile fuel costs, the need
to improve airline operating efficiency has
accelerated the replacement of old-generation
aircraft. Today, the ability to upgrade fleets
is more challenging, given the economic
environment that is affecting asset financing
and passenger demand. Nonetheless, airlines
around the world continue to recognize the
importance of acquiring right-sized aircraft.
The aviation business is cyclical, and I remain
positive on the future prospects for our
market segment. We have weathered swings
in demand and cost, seen the maturity of the
50-seat regional jet market and introduced
innovative products to help airlines seize new
opportunities in our changing industry.
Now, more than ever, size matters.
9
Mauro Kern
Executive Vice President
Airline Market


Executive Summary
12
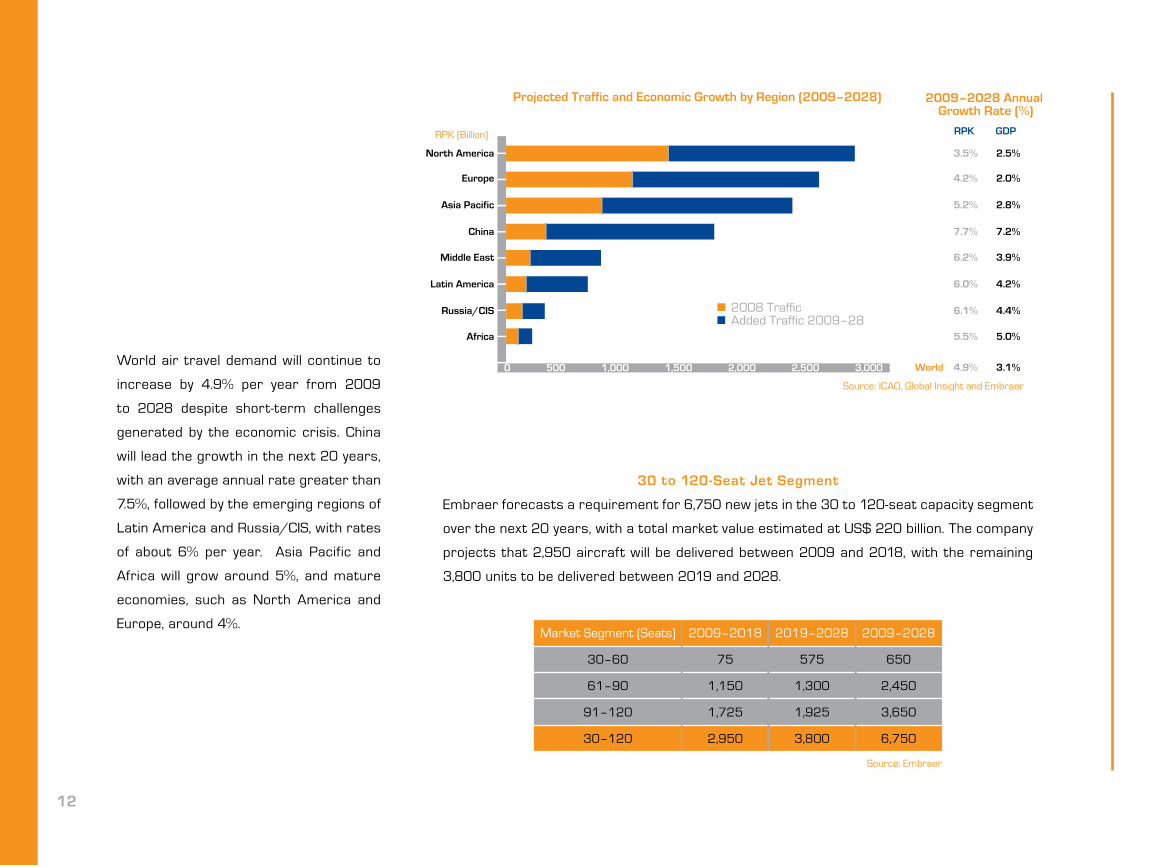
World air travel demand will continue to
increase by 4.9% per year from 2009
to 2028 despite short-term challenges
generated by the economic crisis. China
will lead the growth in the next 20 years,
with an average annual rate greater than
7.5%, followed by the emerging regions of
Latin America and Russia/CIS, with rates
of about 6% per year. Asia Pacific and
Africa will grow around 5%, and mature
economies, such as North America and
Europe, around 4%.
30 to 120-Seat Jet Segment
Embraer forecasts a requirement for 6,750 new jets in the 30 to 120-seat capacity segment
over the next 20 years, with a total market value estimated at US$ 220 billion. The company
projects that 2,950 aircraft will be delivered between 2009 and 2018, with the remaining
3,800 units to be delivered between 2019 and 2028.
Market Segment (Seats) 2009–2018 2019–2028 2009–2028
30–60 75 575 650
61–90 1,150 1,300 2,450
91–120 1,725 1,925 3,650
30–120 2,950 3,800 6,750
Source: Embraer
13
Over the next five years, the 30 to 60-
seat capacity segment will be under
pressure due to the economic crisis and
fuel price volatility, which will force airlines
to review their strategies, mainly in the
North American environment. Although
the 50-seat regional jet market has
reached maturity, it will continue to feed
hubs in the USA and Europe and support
regional aviation development in Russia/
CIS, Mexico, Africa and South America.
The 61 to 120-seat capacity segment will
continue to help airlines match aircraft
capacity to market demand, with improved
service levels through the right-sizing
of low load factor narrow-body flights,
natural growth of regional airlines on high
demand 50-seat markets and expansion
into mid-sized markets.
The issue of emissions will become
one of the main drivers of airline fleet
decisions and will influence future aircraft
development. Today, more than 700 jets
in the 30 to 120-seat world fleet are older
than 20 years and need to be replaced with
more fuel-efficient and environmentally
friendly aircraft like Embraer E-Jets,
which produce up to 50% less CO2 than
older-generation jets of similar capacity.
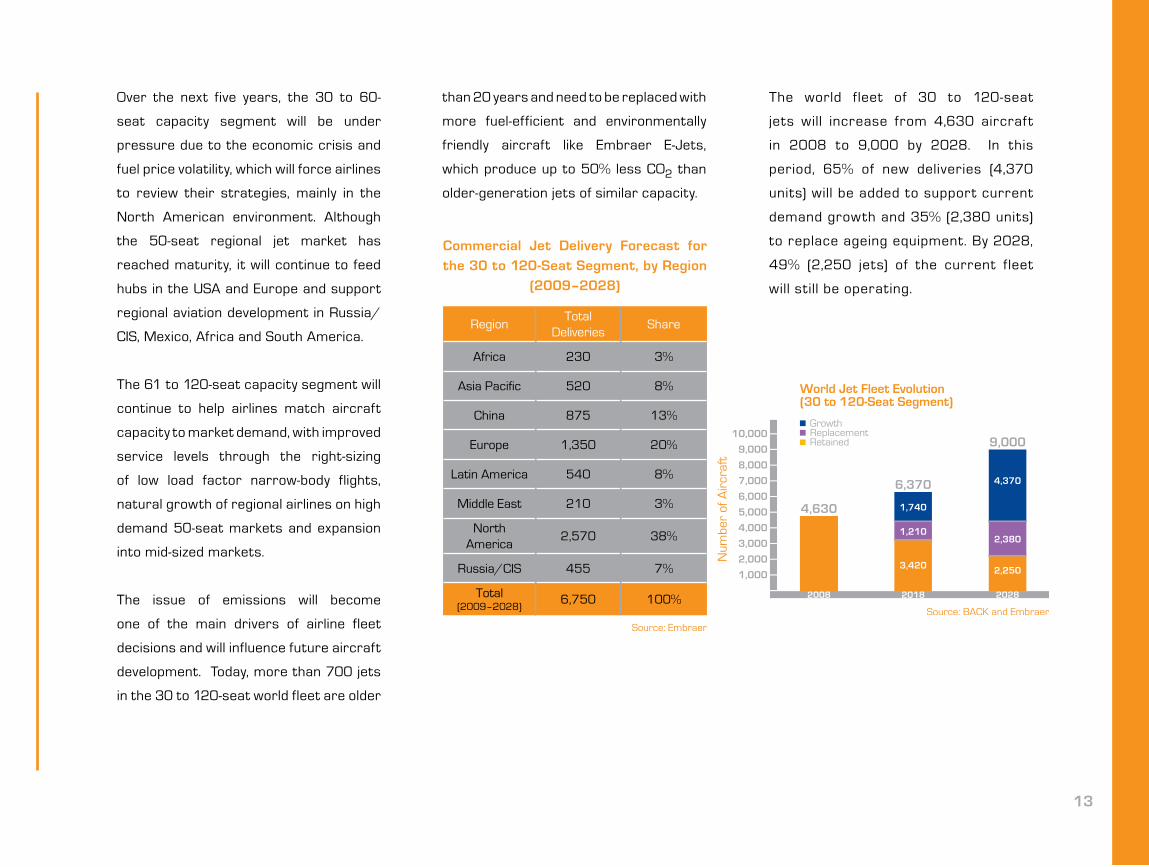
The world fleet of 30 to 120-seat
jets will increase from 4,630 aircraf t
in 2008 to 9,000 by 2028. In this
period, 65% of new deliveries (4,370
units) will be added to support current
demand growth and 35% (2,380 units)
to replace ageing equipment. By 2028,
49% (2,250 jets) of the current fleet
will still be operating.
Commercial Jet Delivery Forecast for the 30 to 120-Seat Segment, by Region
(2009–2028)
RegionTotal
DeliveriesShare
Africa 230 3%
Asia Pacific 520 8%
China 875 13%
Europe 1,350 20%
Latin America 540 8%
Middle East 210 3%
North America
2,570 38%
Russia/CIS 455 7%
Total (2009–2028)
6,750 100%
Source: Embraer
14
Market Segment (Seats) 2009–2018 2019–2028 2009–2028
NB (120–210) 7,100 7,550 14,650
WB (210+) 3,030 3,270 6,300
120+ 10,130 10,820 20,950
Turboprops
The focus on environmental issues
is helping renew turboprop demand.
Although turboprops have typically
operated in short-haul and niche
markets, new opportunities are
increasing. Jet aircraf t, however, will
continue to dominate the medium and
long-haul markets.
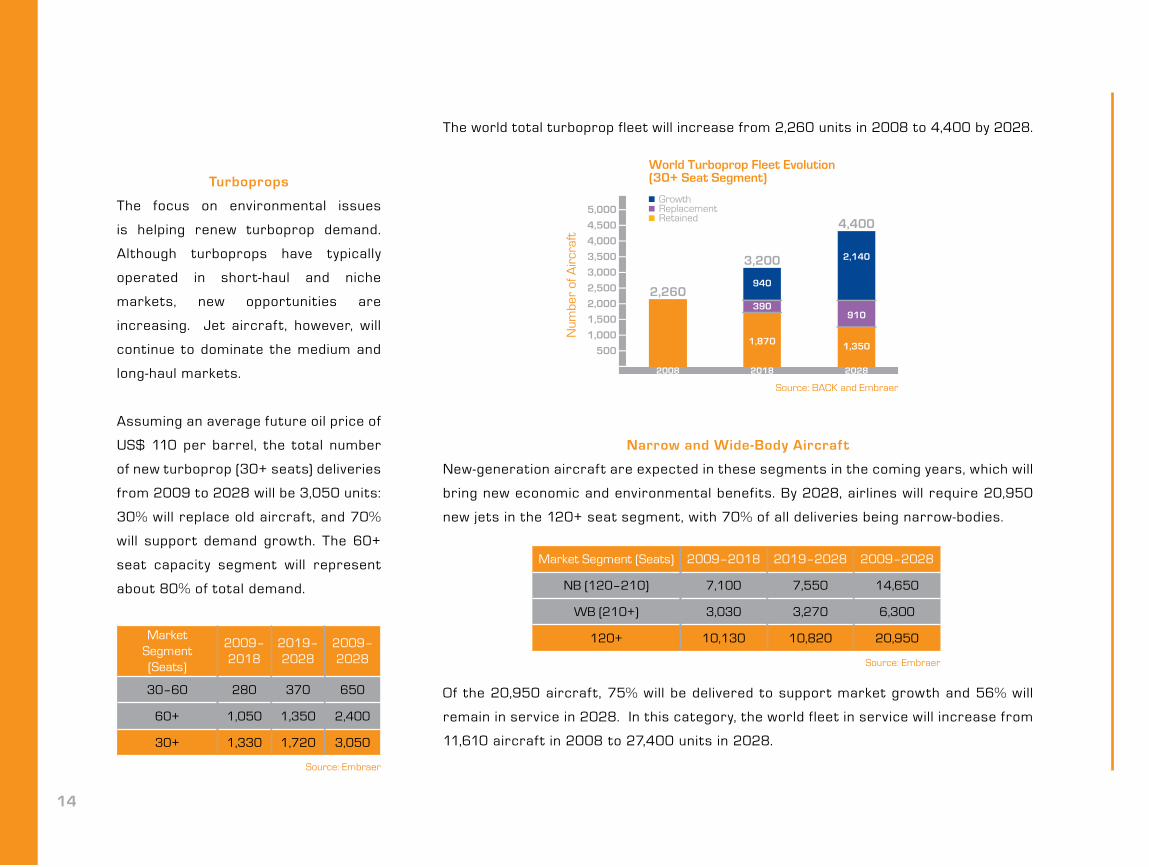
Assuming an average future oil price of
US$ 110 per barrel, the total number
of new turboprop (30+ seats) deliveries
from 2009 to 2028 will be 3,050 units:
30% will replace old aircraf t, and 70%
will support demand growth. The 60+
seat capacity segment will represent
about 80% of total demand.
The world total turboprop fleet will increase from 2,260 units in 2008 to 4,400 by 2028.
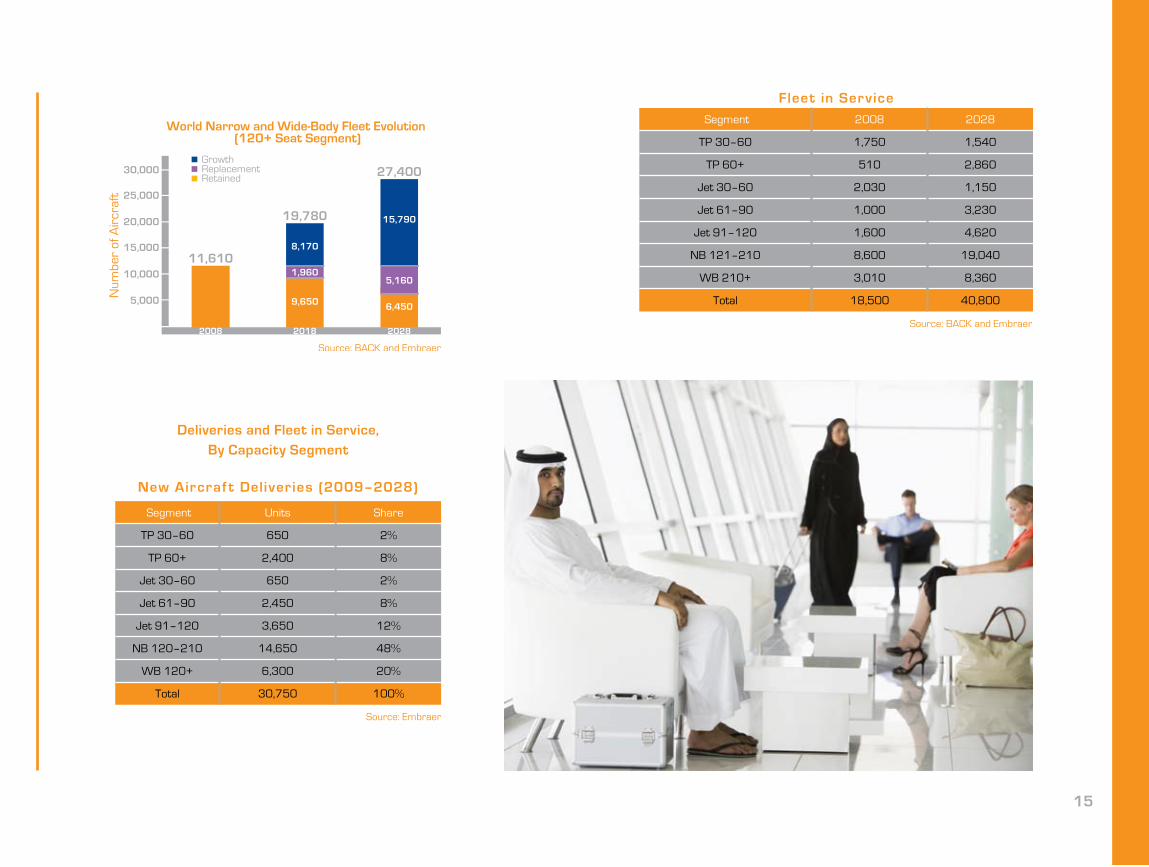
Narrow and Wide-Body Aircraft
New-generation aircraf t are expected in these segments in the coming years, which will
bring new economic and environmental benefits. By 2028, airlines will require 20,950
new jets in the 120+ seat segment, with 70% of all deliveries being narrow-bodies.
Of the 20,950 aircraf t, 75% will be delivered to support market growth and 56% will
remain in service in 2028. In this category, the world fleet in service will increase from
11,610 aircraf t in 2008 to 27,400 units in 2028.
Market Segment (Seats)
2009–2018
2019–2028
2009–2028
30–60 280 370 650
60+ 1,050 1,350 2,400
30+ 1,330 1,720 3,050
Source: Embraer
Source: Embraer
15
Fleet in Service
Segment 2008 2028
TP 30–60 1,750 1,540
TP 60+ 510 2,860
Jet 30–60 2,030 1,150
Jet 61–90 1,000 3,230
Jet 91–120 1,600 4,620
NB 121–210 8,600 19,040
WB 210+ 3,010 8,360
Total 18,500 40,800
Segment Units Share
TP 30–60 650 2%
TP 60+ 2,400 8%
Jet 30–60 650 2%
Jet 61–90 2,450 8%
Jet 91–120 3,650 12%
NB 120–210 14,650 48%
WB 120+ 6,300 20%
Total 30,750 100%
New Aircraft Deliveries (2009–2028)
Source: Embraer
Source: BACK and Embraer
Deliveries and Fleet in Service, By Capacity Segment

Market Trends
18
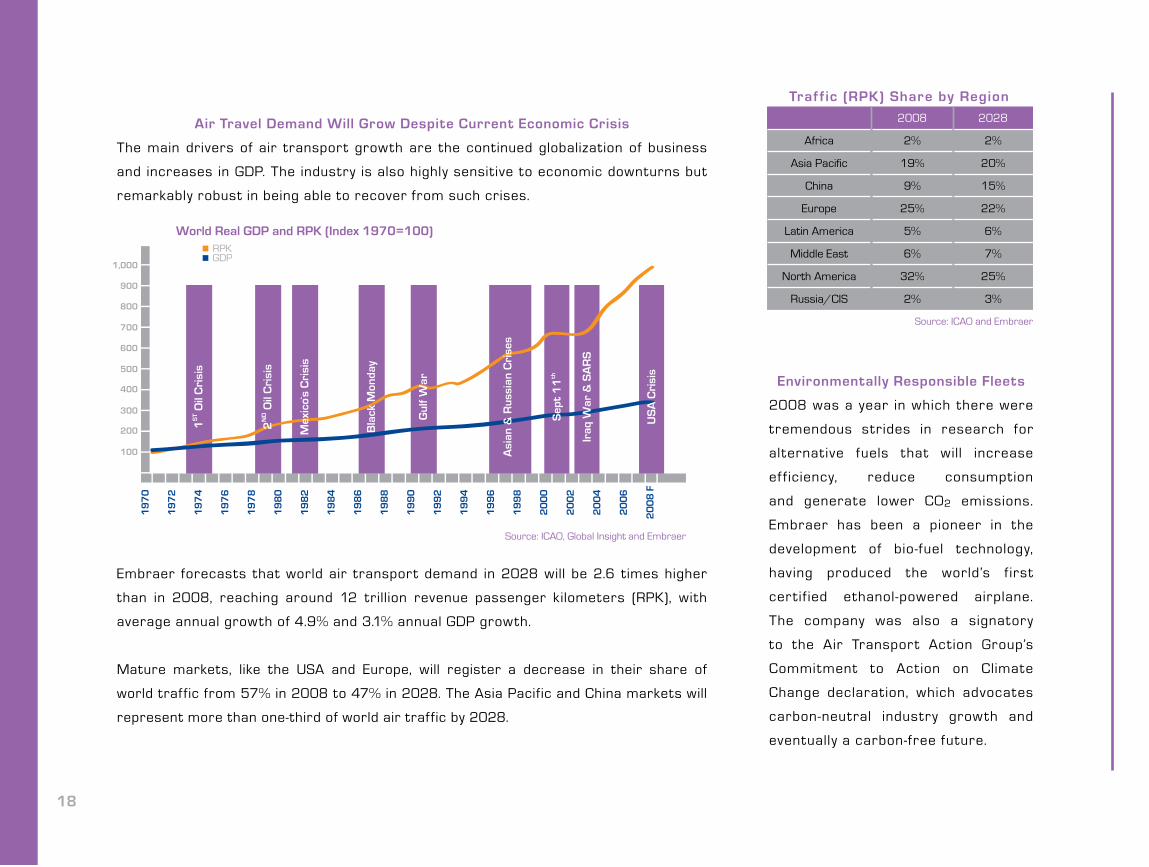
Air Travel Demand Will Grow Despite Current Economic Crisis
The main drivers of air transport growth are the continued globalization of business
and increases in GDP. The industry is also highly sensitive to economic downturns but
remarkably robust in being able to recover from such crises.
Embraer forecasts that world air transport demand in 2028 will be 2.6 times higher
than in 2008, reaching around 12 trillion revenue passenger kilometers (RPK), with
average annual growth of 4.9% and 3.1% annual GDP growth.
Mature markets, like the USA and Europe, will register a decrease in their share of
world traffic from 57% in 2008 to 47% in 2028. The Asia Pacific and China markets will
represent more than one-third of world air traffic by 2028.
Environmentally Responsible Fleets
2008 was a year in which there were
tremendous strides in research for
alternative fuels that will increase
ef f iciency, reduce consumption
and generate lower CO2 emissions.
Embraer has been a pioneer in the
development of bio-fuel technology,
having produced the world’s f irst
certif ied ethanol-powered airplane.
The company was also a signatory
to the Air Transport Action Group’s
Commitment to Action on Climate
Change declaration, which advocates
carbon-neutral industry growth and
eventually a carbon-free future.
Traf f ic (RPK) Share by Region
2008 2028
Africa 2% 2%
Asia Pacific 19% 20%
China 9% 15%
Europe 25% 22%
Latin America 5% 6%
Middle East 6% 7%
North America 32% 25%
Russia/CIS 2% 3%
Source: ICAO and Embraer
19
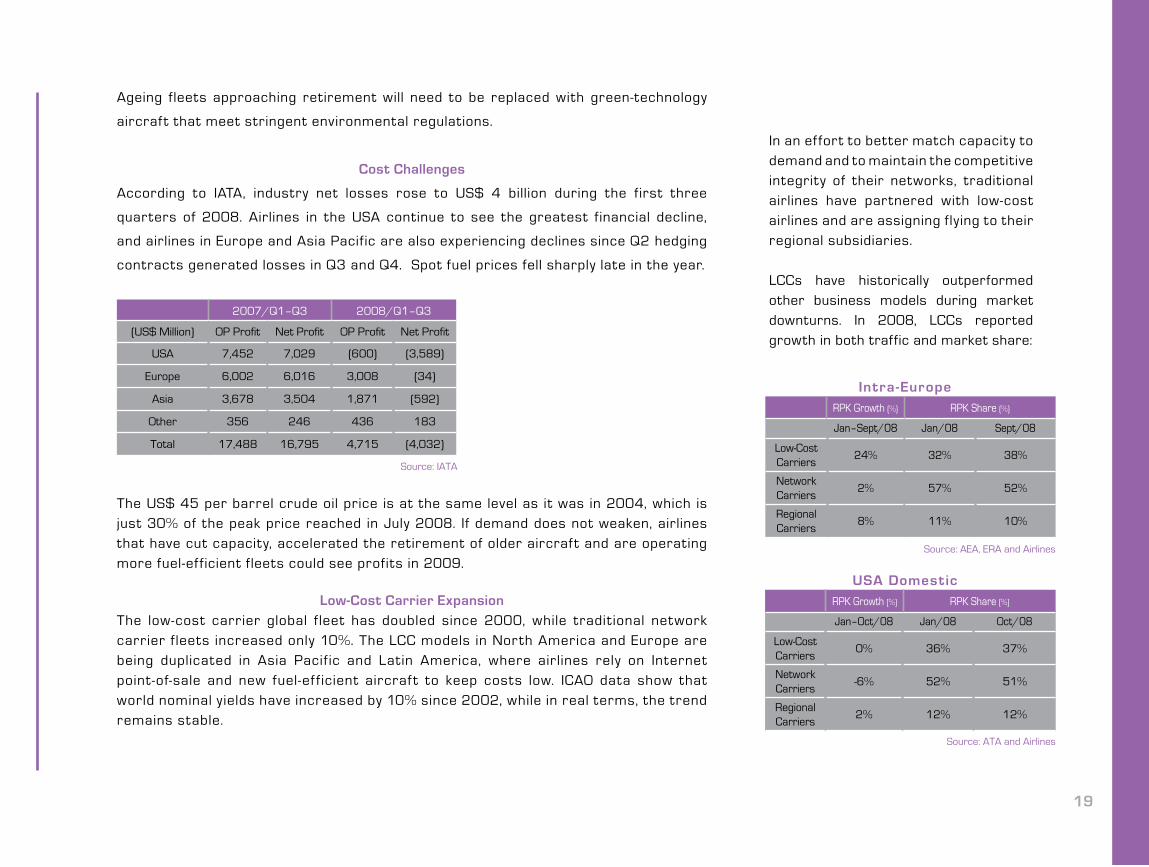
Ageing fleets approaching retirement will need to be replaced with green-technology
aircraf t that meet stringent environmental regulations.
Cost Challenges
According to IATA, industry net losses rose to US$ 4 billion during the first three
quarters of 2008. Airlines in the USA continue to see the greatest financial decline,
and airlines in Europe and Asia Pacific are also experiencing declines since Q2 hedging
contracts generated losses in Q3 and Q4. Spot fuel prices fell sharply late in the year.
The US$ 45 per barrel crude oil price is at the same level as it was in 2004, which is just 30% of the peak price reached in July 2008. If demand does not weaken, airlines that have cut capacity, accelerated the retirement of older aircraf t and are operating more fuel-ef ficient fleets could see profits in 2009.
Low-Cost Carrier ExpansionThe low-cost carrier global f leet has doubled since 2000, while tradit ional network carrier f leets increased only 10%. The LCC models in North America and Europe are being duplicated in Asia Pacif ic and Latin America, where airlines rely on Internet point-of-sale and new fuel-ef f icient aircraf t to keep costs low. ICAO data show that world nominal y ields have increased by 10% since 2002, while in real terms, the trend remains stable.
In an ef fort to better match capacity to demand and to maintain the competitive integrity of their networks, traditional airlines have partnered with low-cost airlines and are assigning flying to their regional subsidiaries.
LCCs have historically outperformed other business models during market downturns. In 2008, LCCs reported growth in both traffic and market share:
2007/Q1–Q3 2008/Q1–Q3–
(US$ Million) OP Profit Net Profit OP Profit Net Profit
USA 7,452 7,029 (600) (3,589)
Europe 6,002 6,016 3,008 (34)
Asia 3,678 3,504 1,871 (592)
Other 356 246 436 183
Total 17,488 16,795 4,715 (4,032)
Source: IATA
Jan–Sept/08 Jan/08 Sept/08
Low-Cost Carriers
24% 32% 38%
Network Carriers
2% 57% 52%
Regional Carriers
8% 11% 10%
Jan–Oct/08 Jan/08 Oct/08
Low-Cost Carriers
0% 36% 37%
Network Carriers
-6% 52% 51%
Regional Carriers
2% 12% 12%
Source: ATA and Airlines
RPK Growth (%) RPK Share (%)
Intra-Europe
RPK Growth (%) RPK Share (%)
USA Domestic
Source: AEA, ERA and Airlines
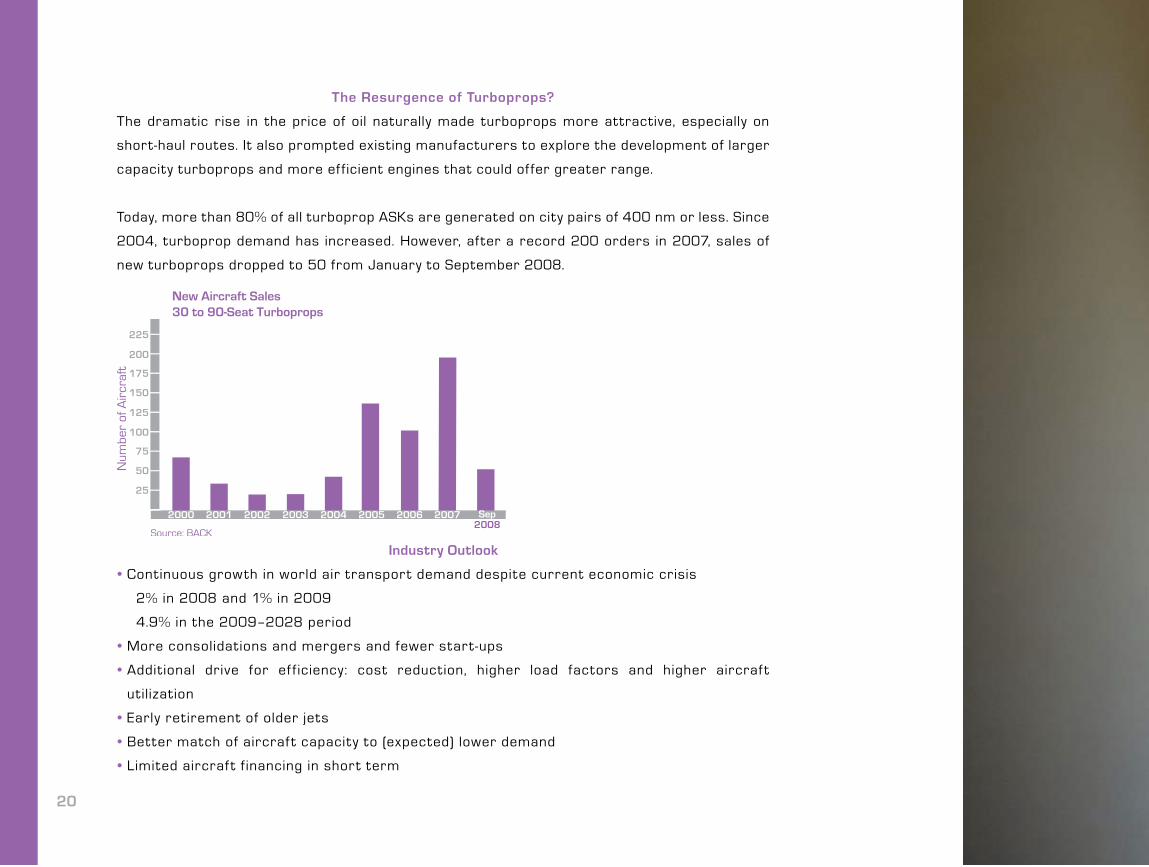
The Resurgence of Turboprops?
The dramatic rise in the price of oil naturally made turboprops more attractive, especially on
short-haul routes. It also prompted existing manufacturers to explore the development of larger
capacity turboprops and more ef ficient engines that could of fer greater range.
Today, more than 80% of all turboprop ASKs are generated on city pairs of 400 nm or less. Since
2004, turboprop demand has increased. However, af ter a record 200 orders in 2007, sales of
new turboprops dropped to 50 from January to September 2008.
Industry Outlook
• Continuous growth in world air transport demand despite current economic crisis
2% in 2008 and 1% in 2009
4.9% in the 2009–2028 period
• More consolidations and mergers and fewer start-ups
• Addit ional drive for ef f iciency: cost reduction, higher load factors and higher aircraf t
utilization
• Early retirement of older jets
• Better match of aircraf t capacity to (expected) lower demand
• Limited aircraf t f inancing in short term
20


Regional Overview
24
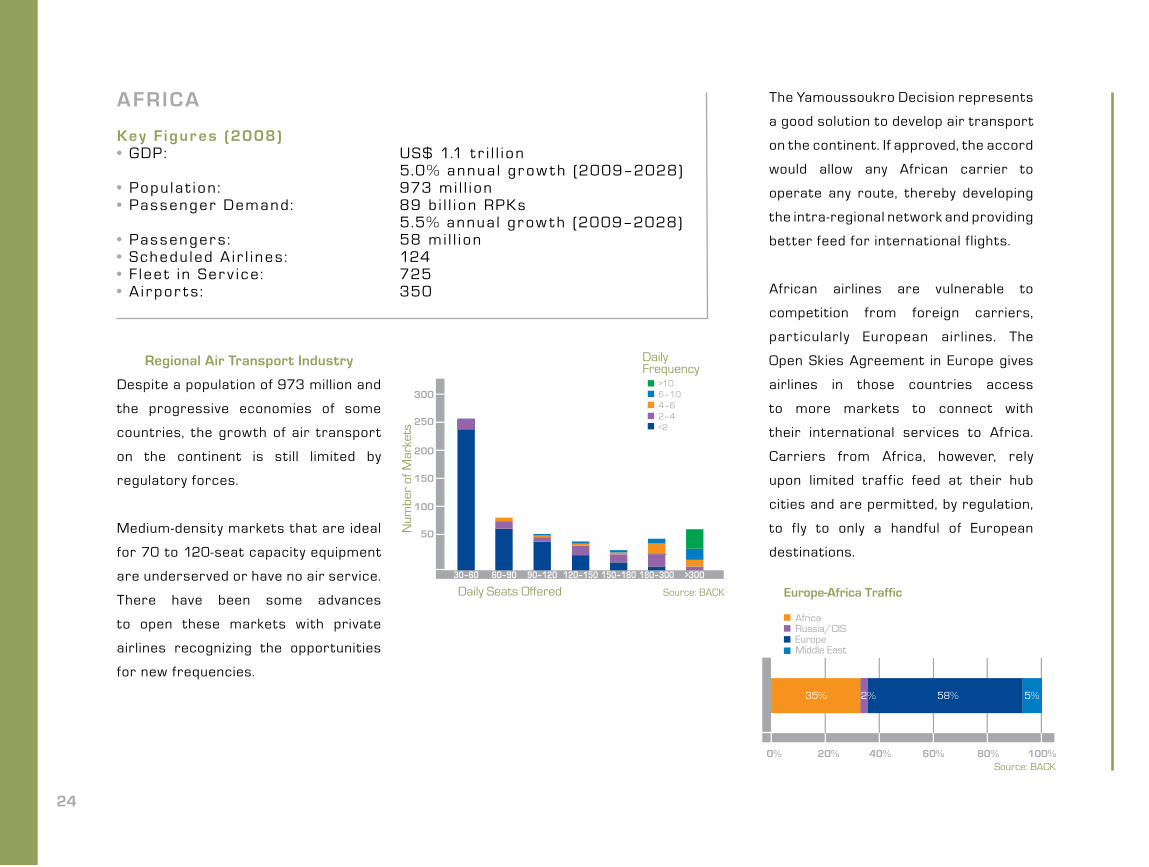
AFRICA
Key F igur es (2008)• GDP: US$ 1.1 t r i l l i on 5.0% annua l gr ow t h (2009–2028)• Popu la t i on: 973 mi l l i on• Pas senger Demand: 89 b i l l i on RPKs 5.5% annua l gr ow t h (2009–2028)• Pas senger s : 58 mi l l i on• Schedu led A i r l i nes : 124• F l ee t i n Ser v i ce : 725• A i r por t s : 350
Regional Air Transport Industry
Despite a population of 973 million and
the progressive economies of some
countries, the growth of air transport
on the continent is still limited by
regulatory forces.
Medium-density markets that are ideal
for 70 to 120-seat capacity equipment
are underserved or have no air service.
There have been some advances
to open these markets with private
airlines recognizing the opportunities
for new frequencies.
The Yamoussoukro Decision represents
a good solution to develop air transport
on the continent. If approved, the accord
would allow any African carrier to
operate any route, thereby developing
the intra-regional network and providing
better feed for international f lights.
African airlines are vulnerable to
competition from foreign carriers,
par t icularly European air l ines. The
Open Skies Agreement in Europe gives
airlines in those countries access
to more markets to connect with
their international services to Africa.
Carriers from Africa, however, rely
upon limited traf fic feed at their hub
cities and are permitted, by regulation,
to fly to only a handful of European
destinations.
30–60 60–90 90–120 120–150 150–180 180–300 >300
>106–104–62–4<2
25
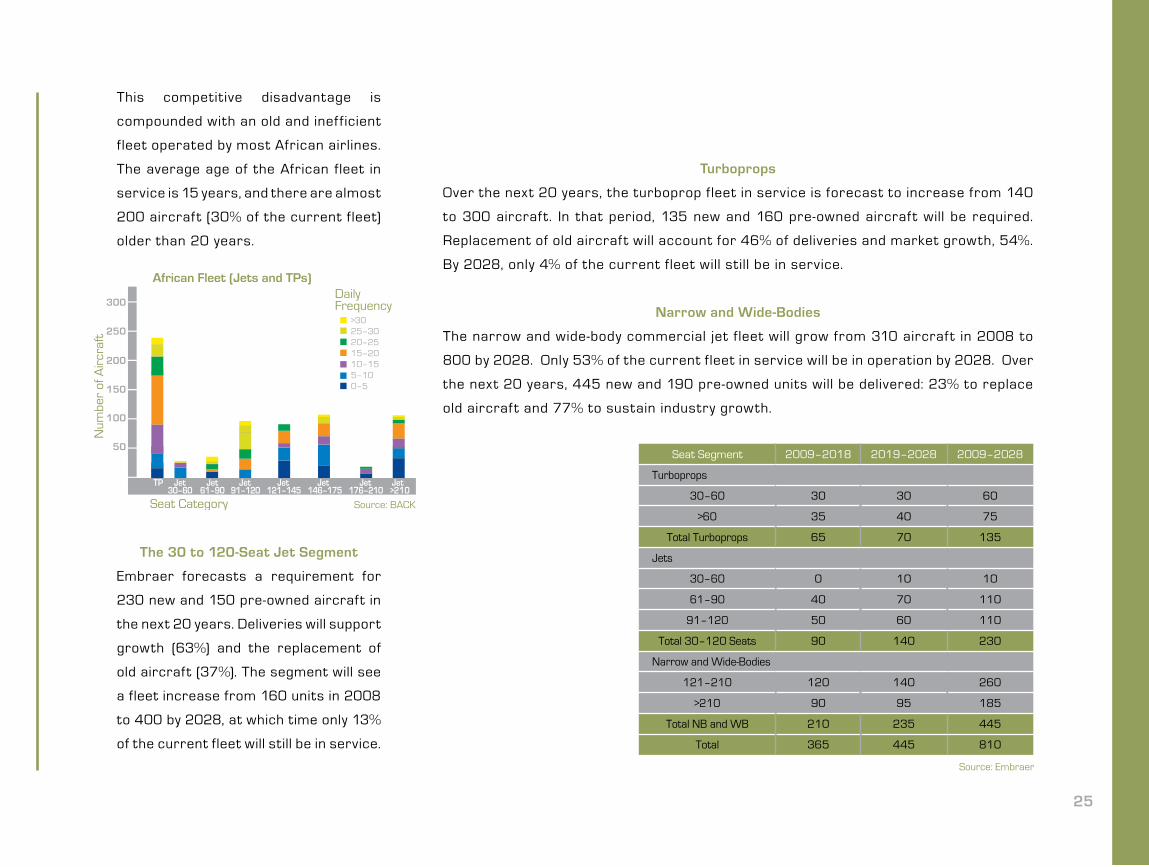
This competitive disadvantage is
compounded with an old and inef ficient
fleet operated by most African airlines.
The average age of the African fleet in
service is 15 years, and there are almost
200 aircraf t (30% of the current fleet)
older than 20 years.
The 30 to 120-Seat Jet Segment
Embraer forecasts a requirement for
230 new and 150 pre-owned aircraft in
the next 20 years. Deliveries will support
growth (63%) and the replacement of
old aircraft (37%). The segment will see
a fleet increase from 160 units in 2008
to 400 by 2028, at which time only 13%
of the current fleet will still be in service.
Turboprops
Over the next 20 years, the turboprop fleet in service is forecast to increase from 140
to 300 aircraf t. In that period, 135 new and 160 pre-owned aircraf t will be required.
Replacement of old aircraf t will account for 46% of deliveries and market growth, 54%.
By 2028, only 4% of the current fleet will still be in service.
Narrow and Wide-Bodies
The narrow and wide-body commercial jet f leet will grow from 310 aircraf t in 2008 to
800 by 2028. Only 53% of the current fleet in service will be in operation by 2028. Over
the next 20 years, 445 new and 190 pre-owned units will be delivered: 23% to replace
old aircraf t and 77% to sustain industry growth.
61–9030–60 91–120 121–145 146–175 176–210 >210Jet Jet Jet Jet Jet Jet Jet
>3025–3020–2515–2010–155–100–5
Seat Segment 2009–2018 2019–2028 2009–2028
Turboprops
30–60 30 30 60
>60 35 40 75
Total Turboprops 65 70 135
Jets
30–60 0 10 10
61–90 40 70 110
91–120 50 60 110
Total 30–120 Seats 90 140 230
Narrow and Wide-Bodies
121–210 120 140 260
>210 90 95 185
Total NB and WB 210 235 445
Total 365 445 810
Source: Embraer
26
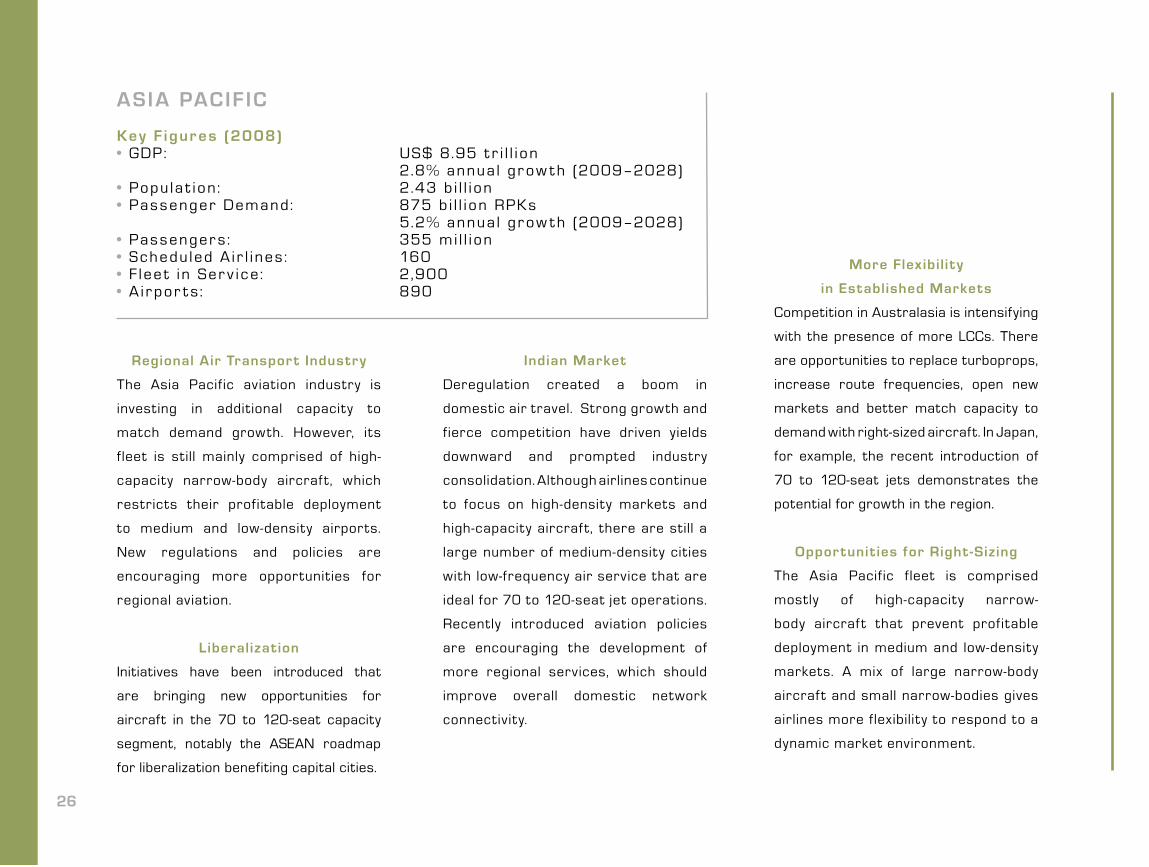
ASIA PACIFIC
Key F igur es (2008)• GDP: US$ 8.95 t r i l l i on 2.8% annua l gr ow t h (2009–2028)• Popu la t i on: 2.43 b i l l i on• Pas senger Demand: 875 b i l l i on RPKs 5.2% annua l gr ow t h (2009–2028)• Pas senger s : 355 mi l l i on• Schedu led A i r l i nes : 160• F l ee t i n Ser v i ce : 2,900• A i r por t s : 890
Regional Air Transport Industry
The Asia Pacific aviation industry is
investing in additional capacity to
match demand growth. However, its
f leet is still mainly comprised of high-
capacity narrow-body aircraf t, which
restricts their profitable deployment
to medium and low-density airports.
New regulations and policies are
encouraging more opportunities for
regional aviation.
Liberalization
Initiatives have been introduced that
are bringing new opportunities for
aircraft in the 70 to 120-seat capacity
segment, notably the ASEAN roadmap
for liberalization benefiting capital cities.
Indian Market
Deregulation created a boom in
domestic air travel. Strong growth and
fierce competition have driven yields
downward and prompted industry
consolidation. Although airlines continue
to focus on high-density markets and
high-capacity aircraf t, there are still a
large number of medium-density cities
with low-frequency air service that are
ideal for 70 to 120-seat jet operations.
Recently introduced aviation policies
are encouraging the development of
more regional services, which should
improve overall domestic network
connectivity.
More Flexibil ity
in Established Markets
Competition in Australasia is intensifying
with the presence of more LCCs. There
are opportunities to replace turboprops,
increase route frequencies, open new
markets and better match capacity to
demand with right-sized aircraft. In Japan,
for example, the recent introduction of
70 to 120-seat jets demonstrates the
potential for growth in the region.
Opportunit ies for Right -Sizing
The Asia Pacific f leet is comprised
mostly of high-capacity narrow-
body aircraf t that prevent profitable
deployment in medium and low-density
markets. A mix of large narrow-body
aircraf t and small narrow-bodies gives
airlines more flexibility to respond to a
dynamic market environment.

J>400
J301–400
J211–300
J121–210
J91–120
J61–90
J30–60
TP
27
The 30 to 120-Seat Jet Segment
Embraer forecasts a requirement for 520
new and 70 pre-owned jets in the next 20
years: 81% to support growth and 19%
to replace old aircraft. The 30 to 120-
seat jet fleet will increase from 220 units
in 2008 to 700 by 2028, when only 50%
of the current fleet will still be in service.
Turboprops
Over the next 20 years, the turboprop
fleet in service is forecast to increase
from 460 to 990 aircraf t. From 2009
to 2028, 720 new and 120 pre-owned
aircraf t will be required: 37% to replace
old aircraf t and 63% to support market
growth. In 2028, only 33% of the
current fleet will still be in service.
Narrow and Wide-Bodies
The narrow and wide-body commercial jet f leet will grow from 2,000 aircraf t to 5,850 in
the next 20 years. By 2028, 70% of the current fleet in service will remain in operation.
Over the next 20 years, 4,140 new and 320 pre-owned units will be delivered: 14% to
replace old aircraf t and 86% to sustain growth.
Seat Segment 2009–2018 2019–2028 2009–2028
Turboprops
30–60 50 60 110
>60 270 340 610
Total Turboprops 320 400 720
Jets
30–60 0 10 10
61–90 110 130 240
91–120 115 155 270
Total 30–120 Seats 225 295 520
Narrow and Wide-Bodies
121–210 1,285 1,105 2,390
>210 830 920 1,750
Total NB and WB 2,115 2,025 4,140
Total 2,660 2,720 5,380
Source: Embraer
28
CHINA
Key F igur es (2008)• GDP: US$ 3.1 t r i l l i on 7.2% annua l gr ow t h (2009–2028)• Popu la t i on: 1.3 b i l l i on• Pas senger Demand: 380 b i l l i on RPKs 7.7% annua l gr ow t h (2009–2028)• Pas senger s : 170 mi l l i on• Schedu led A i r l i nes : 33• F l ee t i n Ser v i ce : 1,250• A i r por t s : 147
More Economic Development
Beijing Capital Airport’s new Terminal
3 opened in t ime for the 2008 Summer
Olympic Games. The airport will be
capable of serving up to 90 million
passengers annually by 2012. Over the
next 20 years, China will enter a new era
of economic development. The rise of
domestic consumption and increasing
investment in the high-ef f iciency
energy industry will be the new driv ing
forces for economic growth. With a
population of 1.3 billion, urbanization
in China will further increase the f low
of people and goods.
High Growth of Air Transportation,
Low Share of Regional
Aviation Services
In recent years, the volume of air traffic
experienced rapid growth; however,
regional aviation lagged. Regional air
services represent only 2% to 4% of the
total market. This indicates that there
is great potential for more development
of regional aviation.
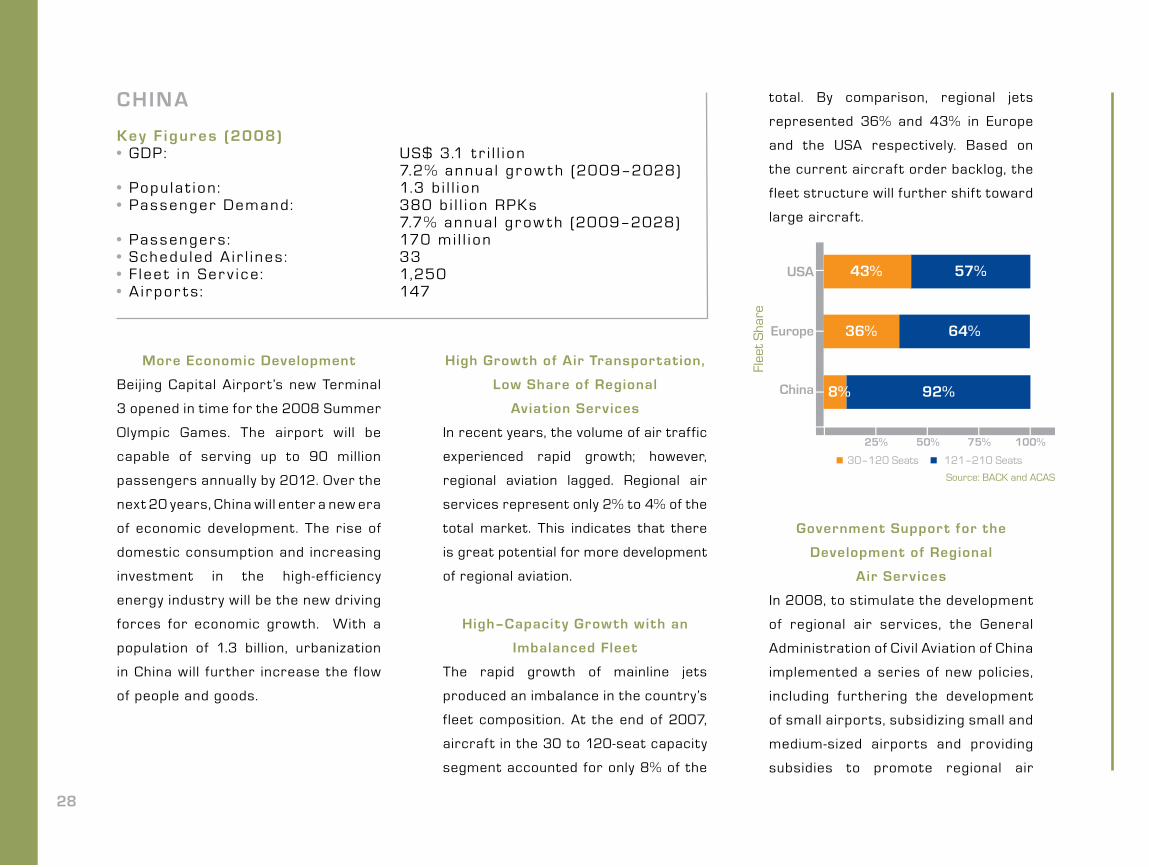
High–Capacity Growth with an
Imbalanced Fleet
The rapid growth of mainline jets
produced an imbalance in the country’s
f leet composition. At the end of 2007,
aircraf t in the 30 to 120-seat capacity
segment accounted for only 8% of the
30–120 Seats 121–210 Seats
Source: BACK and ACAS
total. By comparison, regional jets
represented 36% and 43% in Europe
and the USA respectively. Based on
the current aircraf t order backlog, the
fleet structure will further shif t toward
large aircraf t.
Government Support for the
Development of Regional
Air Services
In 2008, to stimulate the development
of regional air services, the General
Administration of Civil Aviation of China
implemented a series of new policies,
including furthering the development
of small airports, subsidizing small and
medium-sized airports and providing
subsidies to promote regional air
29
services. At the same time, many local
governments issued regulations to
support the development of regional
air services.
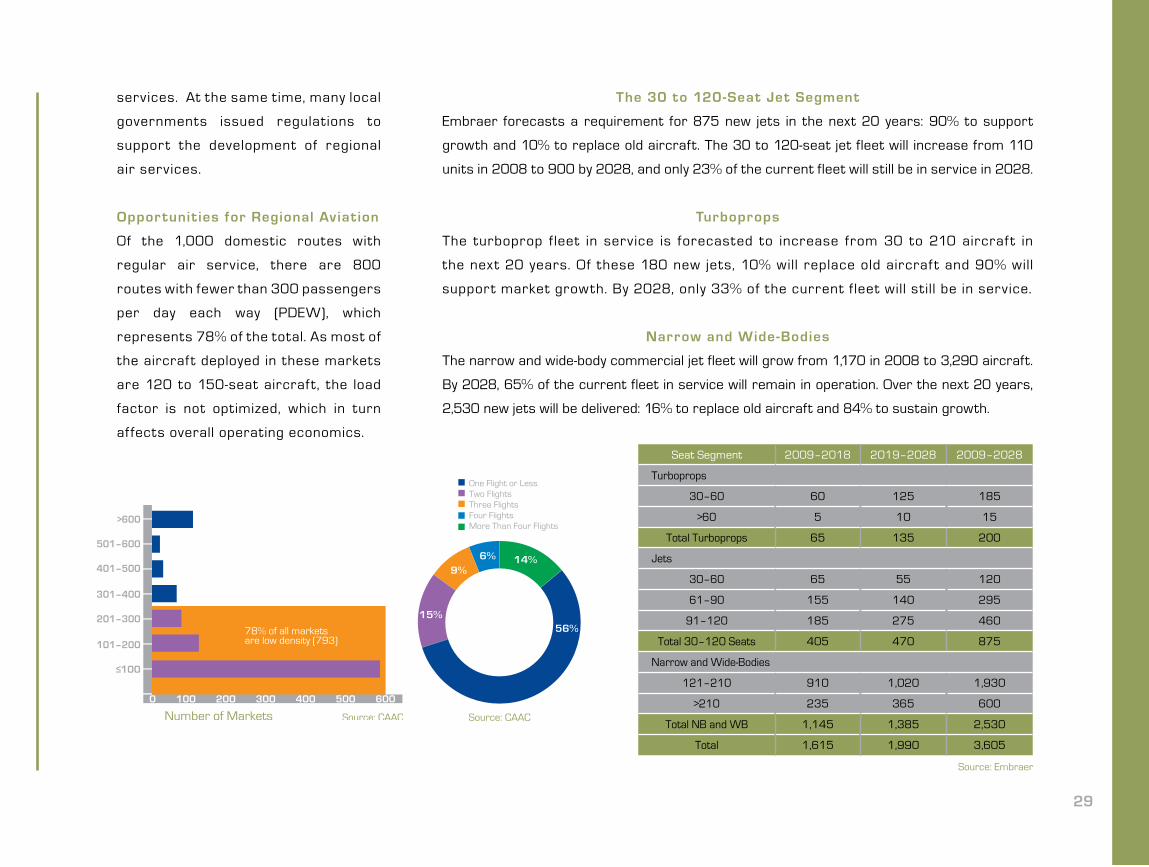
Opportunit ies for Regional Aviation
Of the 1,000 domestic routes with
regular air service, there are 800
routes with fewer than 300 passengers
per day each way (PDEW), which
represents 78% of the total. As most of
the aircraf t deployed in these markets
are 120 to 150-seat aircraf t, the load
factor is not optimized, which in turn
af fects overall operating economics.
The 30 to 120-Seat Jet Segment
Embraer forecasts a requirement for 875 new jets in the next 20 years: 90% to support
growth and 10% to replace old aircraft. The 30 to 120-seat jet fleet will increase from 110
units in 2008 to 900 by 2028, and only 23% of the current fleet will still be in service in 2028.
Turboprops
The turboprop f leet in service is forecasted to increase from 30 to 210 aircraf t in
the next 20 years. Of these 180 new jets, 10% will replace old aircraf t and 90% will
support market growth. By 2028, only 33% of the current f leet will st ill be in service.
Narrow and Wide-Bodies
The narrow and wide-body commercial jet fleet will grow from 1,170 in 2008 to 3,290 aircraft.
By 2028, 65% of the current fleet in service will remain in operation. Over the next 20 years,
2,530 new jets will be delivered: 16% to replace old aircraft and 84% to sustain growth.
>600
501–600
401–500
301–400
201–300
101–200
≤100
One Flight or LessTwo FlightsThree FlightsFour FlightsMore Than Four Flights
Seat Segment 2009–2018 2019–2028 2009–2028
Turboprops
30–60 60 125 185
>60 5 10 15
Total Turboprops 65 135 200
Jets
30–60 65 55 120
61–90 155 140 295
91–120 185 275 460
Total 30–120 Seats 405 470 875
Narrow and Wide-Bodies
121–210 910 1,020 1,930
>210 235 365 600
Total NB and WB 1,145 1,385 2,530
Total 1,615 1,990 3,605
Source: Embraer
30
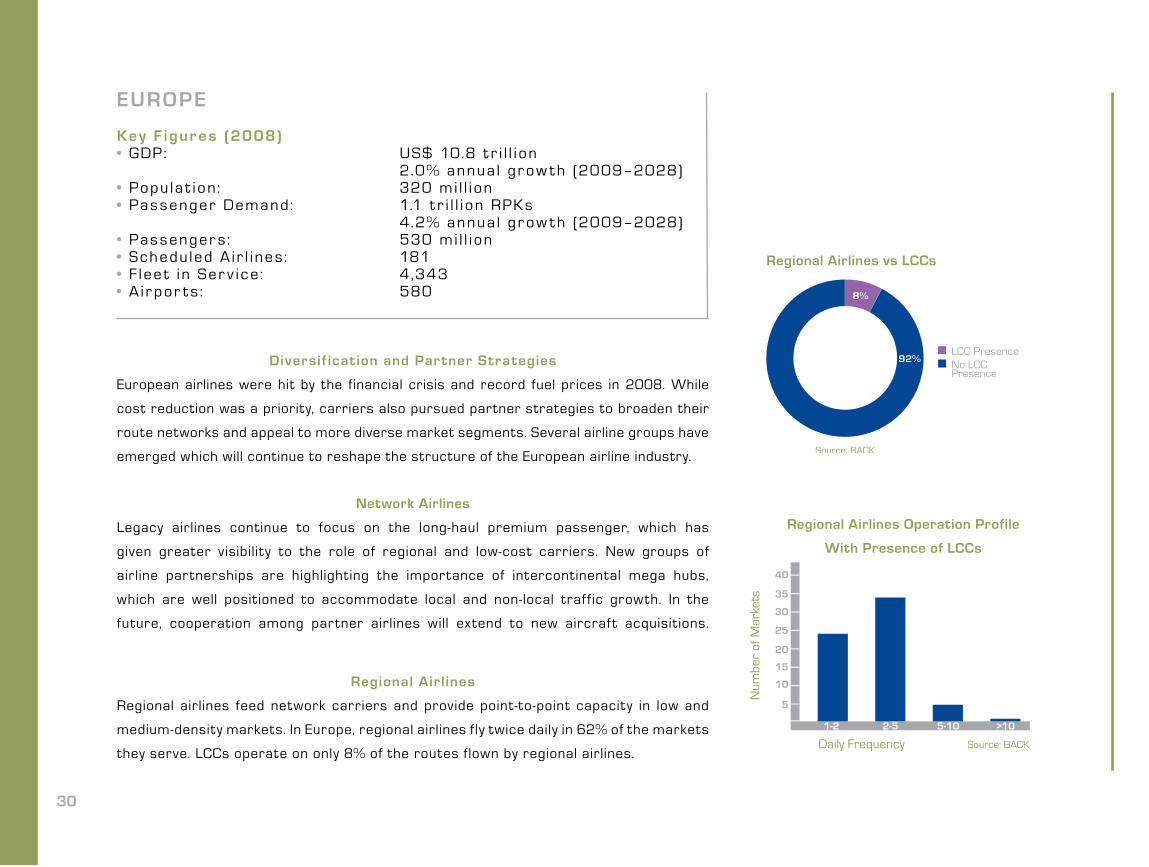
EUROPE
Key F igur es (2008)• GDP: US$ 10.8 t r i l l i on 2.0% annua l gr ow t h (2009–2028)• Popu la t i on: 320 mi l l i on• Pas senger Demand: 1.1 t r i l l i on RPKs 4.2% annua l gr ow t h (2009–2028)• Pas senger s : 530 mi l l i on• Schedu led A i r l i nes : 181• F l ee t i n Ser v i ce : 4,343• A i r por t s : 580
Diversif ication and Partner Strategies
European airlines were hit by the financial crisis and record fuel prices in 2008. While
cost reduction was a priority, carriers also pursued partner strategies to broaden their
route networks and appeal to more diverse market segments. Several airline groups have
emerged which will continue to reshape the structure of the European airline industry.
Regional Airlines Operation Profile
With Presence of LCCs
LCC PresenceNo LCC Presence
Regional Airlines vs LCCs
Network Airlines
Legacy airlines continue to focus on the long-haul premium passenger, which has
given greater visibility to the role of regional and low-cost carriers. New groups of
airline partnerships are highlighting the importance of intercontinental mega hubs,
which are well positioned to accommodate local and non-local traf fic growth. In the
future, cooperation among partner airlines will extend to new aircraf t acquisitions.
Regional Air lines
Regional airlines feed network carriers and provide point-to-point capacity in low and
medium-density markets. In Europe, regional airlines fly twice daily in 62% of the markets
they serve. LCCs operate on only 8% of the routes flown by regional airlines.
31
1–2 2–5 5–10
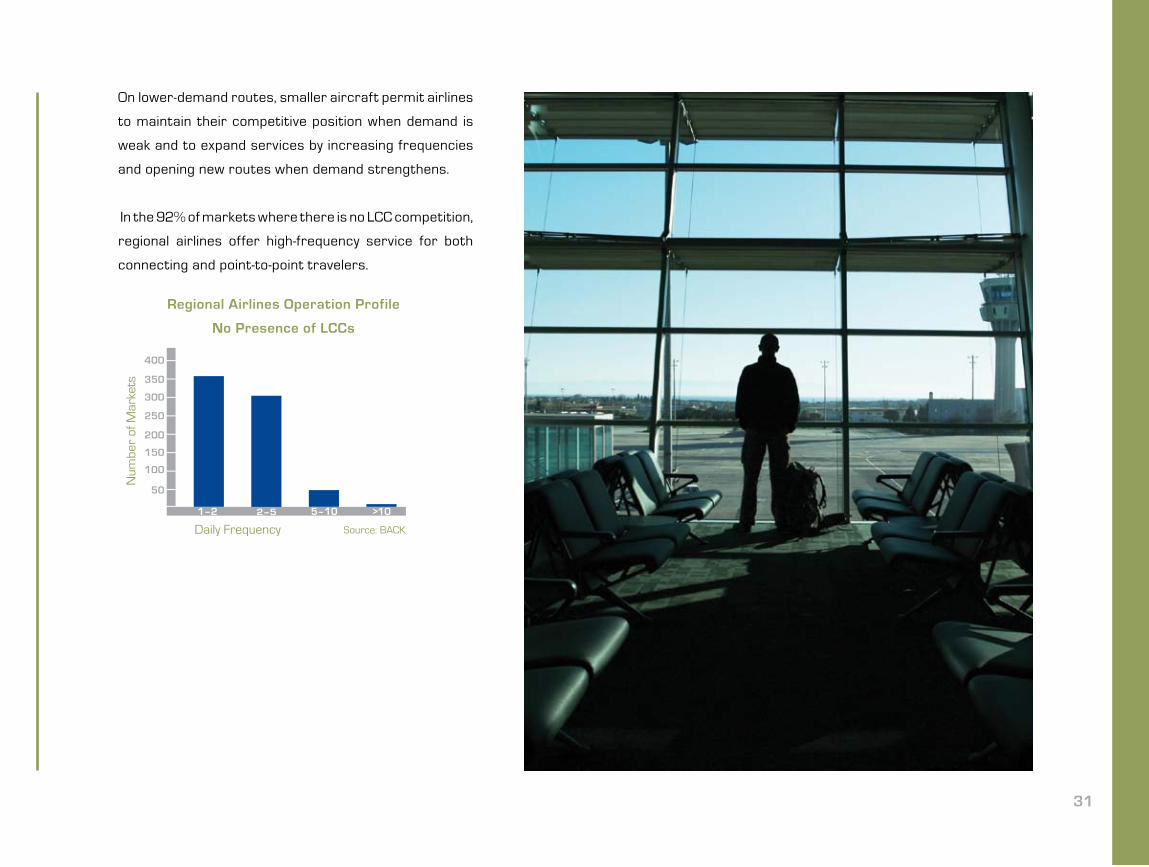
Regional Airlines Operation Profile
No Presence of LCCs
On lower-demand routes, smaller aircraft permit airlines
to maintain their competitive position when demand is
weak and to expand services by increasing frequencies
and opening new routes when demand strengthens.
In the 92% of markets where there is no LCC competition,
regional airlines offer high-frequency service for both
connecting and point-to-point travelers.
32
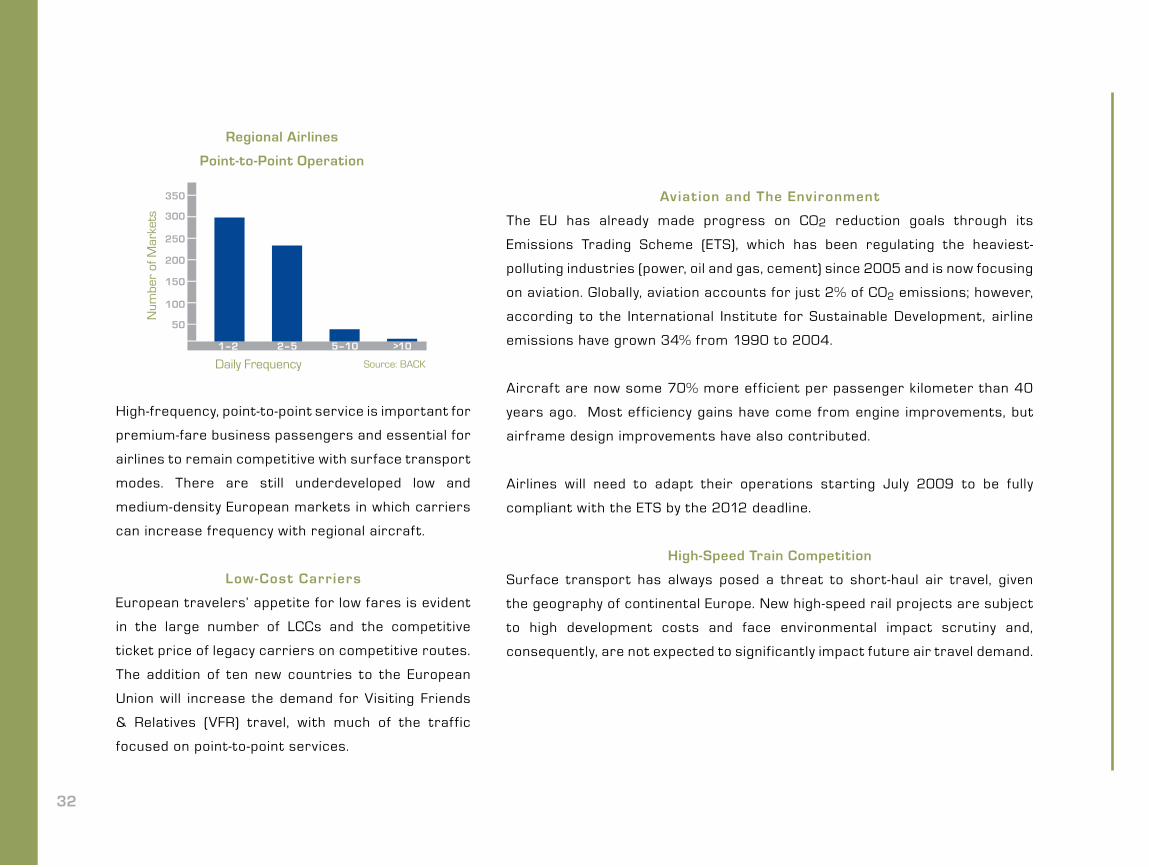
Regional Airlines
Point-to-Point Operation
1–2 2–5 5–10 >10
Aviation and The Environment
The EU has already made progress on CO2 reduction goals through its
Emissions Trading Scheme (ETS), which has been regulating the heaviest-
polluting industries (power, oil and gas, cement) since 2005 and is now focusing
on aviation. Globally, aviation accounts for just 2% of CO2 emissions; however,
according to the International Institute for Sustainable Development, airline
emissions have grown 34% from 1990 to 2004.
Aircraf t are now some 70% more ef ficient per passenger kilometer than 40
years ago. Most ef ficiency gains have come from engine improvements, but
airframe design improvements have also contributed.
Airlines will need to adapt their operations starting July 2009 to be fully
compliant with the ETS by the 2012 deadline.
High-Speed Train Competition
Surface transport has always posed a threat to short-haul air travel, given
the geography of continental Europe. New high-speed rail projects are subject
to high development costs and face environmental impact scrutiny and,
consequently, are not expected to significantly impact future air travel demand.
High-frequency, point-to-point service is important for
premium-fare business passengers and essential for
airlines to remain competitive with surface transport
modes. There are still underdeveloped low and
medium-density European markets in which carriers
can increase frequency with regional aircraft.
Low-Cost Carriers
European travelers’ appetite for low fares is evident
in the large number of LCCs and the competitive
ticket price of legacy carriers on competitive routes.
The addition of ten new countries to the European
Union will increase the demand for Visiting Friends
& Relatives (VFR) travel, with much of the traf fic
focused on point-to-point services.

The 30 to 120-Seat Jet Segment
Embraer forecasts a requirement for
1,350 new and 170 pre-owned jets for
Europe in the next 20 years: 57% to
support growth and 43% to replace old
aircraft. The 30 to 120-seat jet fleet
will increase from 900 units in 2008 to
1,760 by 2028, with 27% of the current
fleet in service in 2028.
Turboprops
The turboprop f leet in serv ice is forecast to increase from 570 to 980 aircraf t .
From 2009 to 2028, 680 new and 250 pre-owned aircraf t wil l be required: 56% to
replace old f leets and 44% to support growth. By 2028, only 9% of the current f leet
wil l st i l l be in serv ice.
Narrow and Wide-Bodies
The narrow and wide-body commercial jet fleet will grow from 2,730 aircraft in 2008, to
6,630 by 2028, when only 49% of the current fleet will still be in operation. Over the next
20 years, 5,110 new and 190 pre-owned units will be delivered: 26% to replace old aircraft
and 74% to sustain growth.
33
Seat Segment 2009–2018 2019–2028 2009–2028
Turboprops
30–60 50 60 110
>60 250 320 570
Total Turboprops 300 380 680
Jets
30–60 0 20 20
61–90 170 270 440
91–120 420 470 890
Total 30–120 Seats 590 760 1,350
Narrow and Wide-Bodies
121–210 1,780 2,050 3,830
>210 555 725 1,280
Total NB and WB 2,335 2,775 5,110
Total 3,225 3,915 7,140
Source: Embraer
34
L ATIN AMERICA
Key F igur es (2008)• GDP: US$ 2.8 t r i l l i on 4.2% annua l gr ow t h (2009–2028)• Popu la t i on: 576 mi l l i on• Pas senger Demand: 210 b i l l i on RPKs 6.0% annua l gr ow t h (2009–2028)• Pas senger s : 110 mi l l i on• Schedu led A i r l i nes : 120• F l ee t i n Ser v i ce : 1,300• A i r por t s : 404
Solid Base for Economic Growth
The economies of Latin American countries have been growing consistently since 2003,
and many are prosperous as a result of expanding global economic links. Brazil, Chile,
Colombia, Mexico and Peru are investment-grade-level countries that reported significant
improvements in macroeconomic fundamentals over the past decade. Consequently,
passenger air traffic has performed well above the world average.
Investment liberalization and the
expansion of free trade agreements in
Latin America are strong stimulators of
air transportation growth. The Fortaleza
Agreement–a sub-regional proposal
aimed at providing more efficient air
service beyond the bilateral agreements
among Argentina, Bolivia, Brazil, Chile,
Paraguay, Peru and Uruguay–is highly
committed to the development of air
transport in small and medium-sized
markets. The anticipation of economic
growth, regional cooperation and
greater emphasis on multilateral
agreements will be the foundation for the
expansion of the Fortaleza Agreement
to other countries. The result will be a
truly integrated air transport system.
Source: IATA Traffic Data – August 2008 (YTD 2008 vs. YTD 2007)
Region RPK Growth ASK Growth
Africa -1.9% -2.4%
Asia Pacific 2.2% 3.8%
Europe 2.9% 4.7%
Latin America 14.3% 12.7%
Middle East 9.0% 9.7%
North America 5.6% 6.4%
Industry 5.6% 6.4%
35
0 –
20
20 –
29
30 –
39
40 –
49
50 –
59
60 –
69
70 –
79
80 –
89
90 –
99
100
– 10
9
110
– 11
9
120
– 12
9
130
– 13
9
140
– 14
9
>=15
0
Source: Sabre GDD and Embraer (Routes up to 2,000nm)
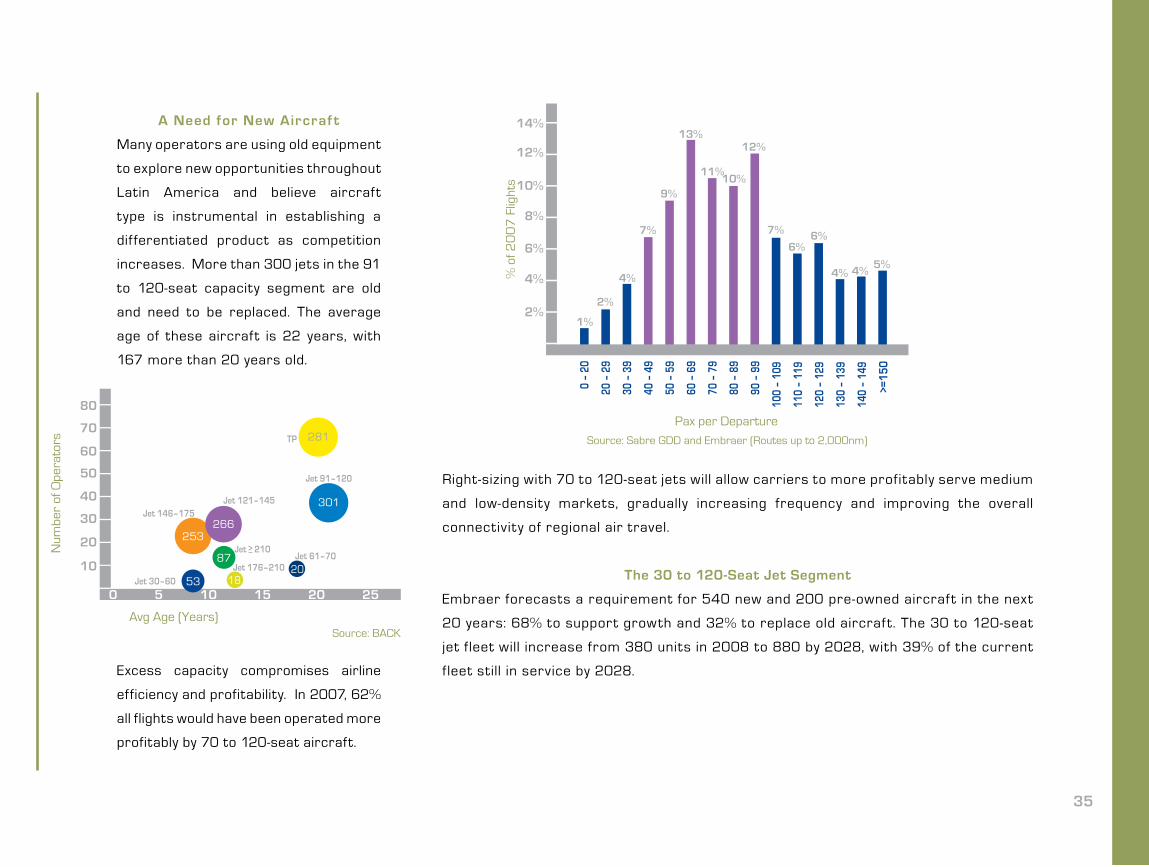
A Need for New Aircraft
Many operators are using old equipment
to explore new opportunities throughout
Latin America and believe aircraft
type is instrumental in establishing a
dif ferentiated product as competition
increases. More than 300 jets in the 91
to 120-seat capacity segment are old
and need to be replaced. The average
age of these aircraft is 22 years, with
167 more than 20 years old.
Excess capacity compromises airline
efficiency and profitability. In 2007, 62%
all flights would have been operated more
profitably by 70 to 120-seat aircraft.
Jet 30–60
TP
Jet 146–175Jet 121–145
Jet > 210
Jet 176–210Jet 61–70
Jet 91–120 Right-sizing with 70 to 120-seat jets will allow carriers to more profitably serve medium
and low-density markets, gradually increasing frequency and improving the overall
connectivity of regional air travel.
The 30 to 120-Seat Jet Segment
Embraer forecasts a requirement for 540 new and 200 pre-owned aircraf t in the next
20 years: 68% to support growth and 32% to replace old aircraf t. The 30 to 120-seat
jet f leet will increase from 380 units in 2008 to 880 by 2028, with 39% of the current
fleet still in service by 2028.
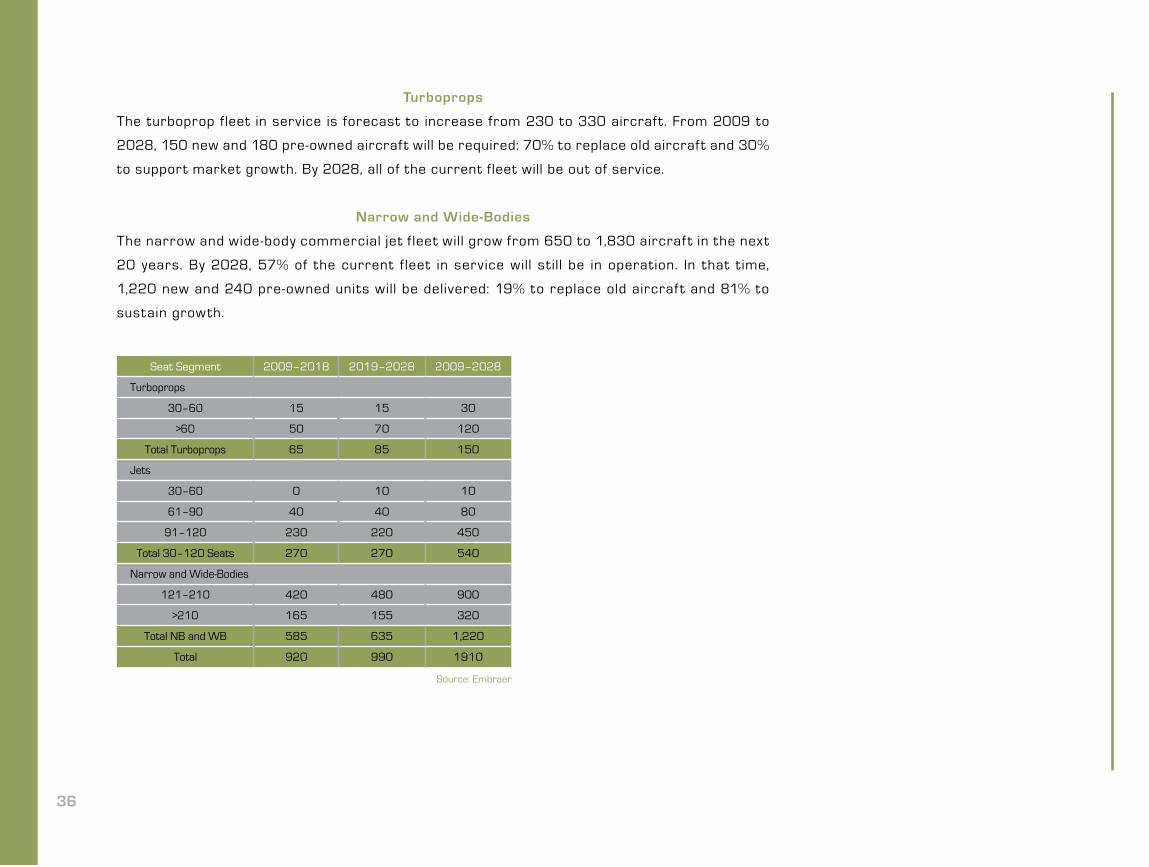
Turboprops
The turboprop fleet in service is forecast to increase from 230 to 330 aircraf t. From 2009 to
2028, 150 new and 180 pre-owned aircraf t will be required: 70% to replace old aircraf t and 30%
to support market growth. By 2028, all of the current fleet will be out of service.
Narrow and Wide-Bodies
The narrow and wide-body commercial jet f leet will grow from 650 to 1,830 aircraf t in the next
20 years. By 2028, 57% of the current f leet in service will st ill be in operation. In that t ime,
1,220 new and 240 pre-owned units will be delivered: 19% to replace old aircraf t and 81% to
sustain growth.
36
Seat Segment 2009–2018 2019–2028 2009–2028
Turboprops
30–60 15 15 30
>60 50 70 120
Total Turboprops 65 85 150
Jets
30–60 0 10 10
61–90 40 40 80
91–120 230 220 450
Total 30–120 Seats 270 270 540
Narrow and Wide-Bodies
121–210 420 480 900
>210 165 155 320
Total NB and WB 585 635 1,220
Total 920 990 1910
Source: Embraer

37
Middle East Middle East (Excluding EK, EY, OR)Europe USA
Ave
rage
Air
craf
t S
ize
(Sea
ts)
38
MIDDLE E AST
Key F igur es (2008)• GDP: US$ 1.3 t r i l l i on 3.9% annua l gr ow t h (2009–2028)• Popu la t i on: 209 mi l l i on• Pas senger Demand: 230 b i l l i on RPKs 6.2% annua l gr ow t h (2009–2028)• Pas senger s : 72 mi l l i on• Schedu led A i r l i nes : 40• F l ee t i n Ser v i ce : 641• A i r por t s : 120
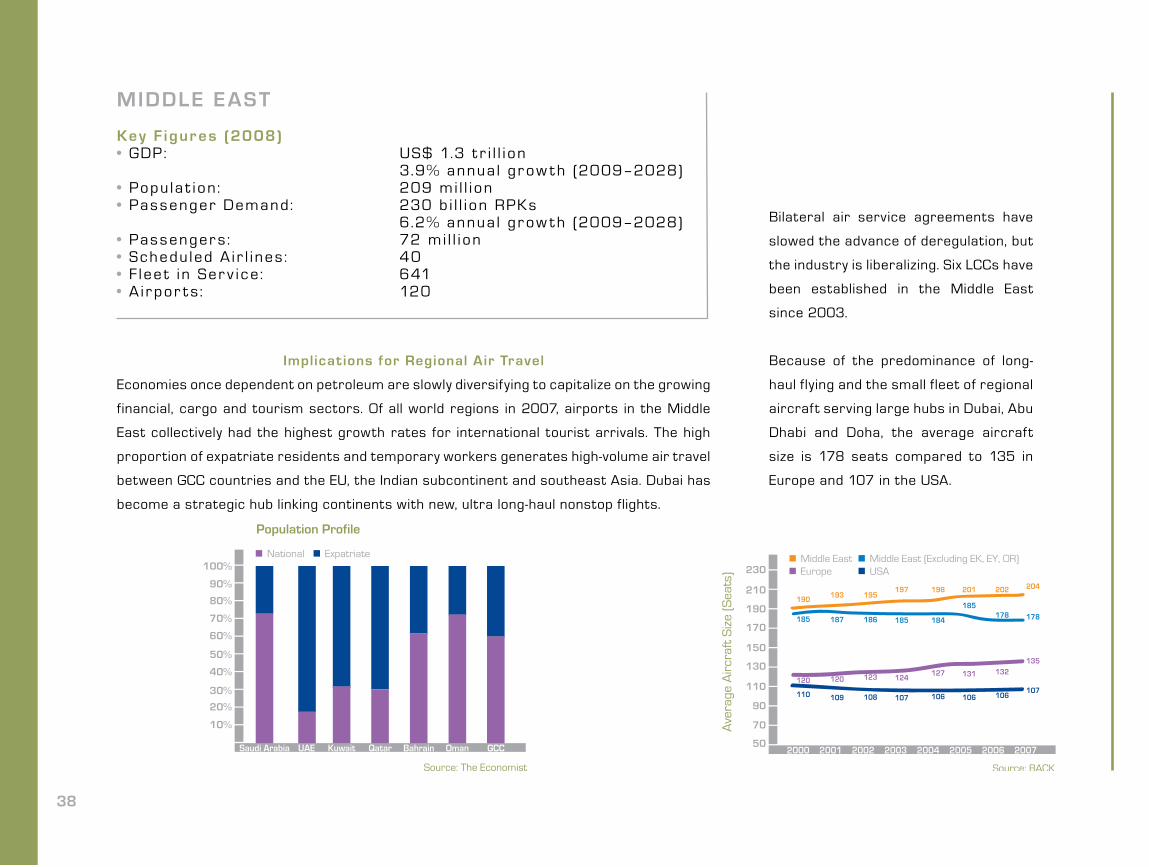
Implications for Regional Air Travel
Economies once dependent on petroleum are slowly diversifying to capitalize on the growing
financial, cargo and tourism sectors. Of all world regions in 2007, airports in the Middle
East collectively had the highest growth rates for international tourist arrivals. The high
proportion of expatriate residents and temporary workers generates high-volume air travel
between GCC countries and the EU, the Indian subcontinent and southeast Asia. Dubai has
become a strategic hub linking continents with new, ultra long-haul nonstop flights.
Bilateral air service agreements have
slowed the advance of deregulation, but
the industry is liberalizing. Six LCCs have
been established in the Middle East
since 2003.
Because of the predominance of long-
haul flying and the small fleet of regional
aircraft serving large hubs in Dubai, Abu
Dhabi and Doha, the average aircraft
size is 178 seats compared to 135 in
Europe and 107 in the USA.

There is also potential for improving connectivity within the region. Some 65% of airports
in the Middle East serve just f ive or fewer cities with nonstop flights. For those airports
linking more than five destinations, 78% of those cities do not have daily service.
60–90 90–120 120–150 150–180 >300180–300
>106–104–62–4<2
39
Narrow-body jets operate on most
intra-regional routes; however, several
carriers have acquired aircraf t in the
70 to 120-seat capacity segment and
are using them to right-size their f leets
and of fer more frequency, particularly
on city pairs in the Levant. There is still
opportunity for more flights in many
lower-demand markets.
The 30 to 120-Seat Jet Segment
Embraer forecasts a requirement for 210 new and 40 pre-owned aircraf t in the next
20 years: 64% to support growth and 36% to replace old aircraf t. The 30 to 120-seat
jet f leet will increase from 90 units in 2008 to 250 by 2028, by which time no aircraf t
from the current fleet will be in operation.
40
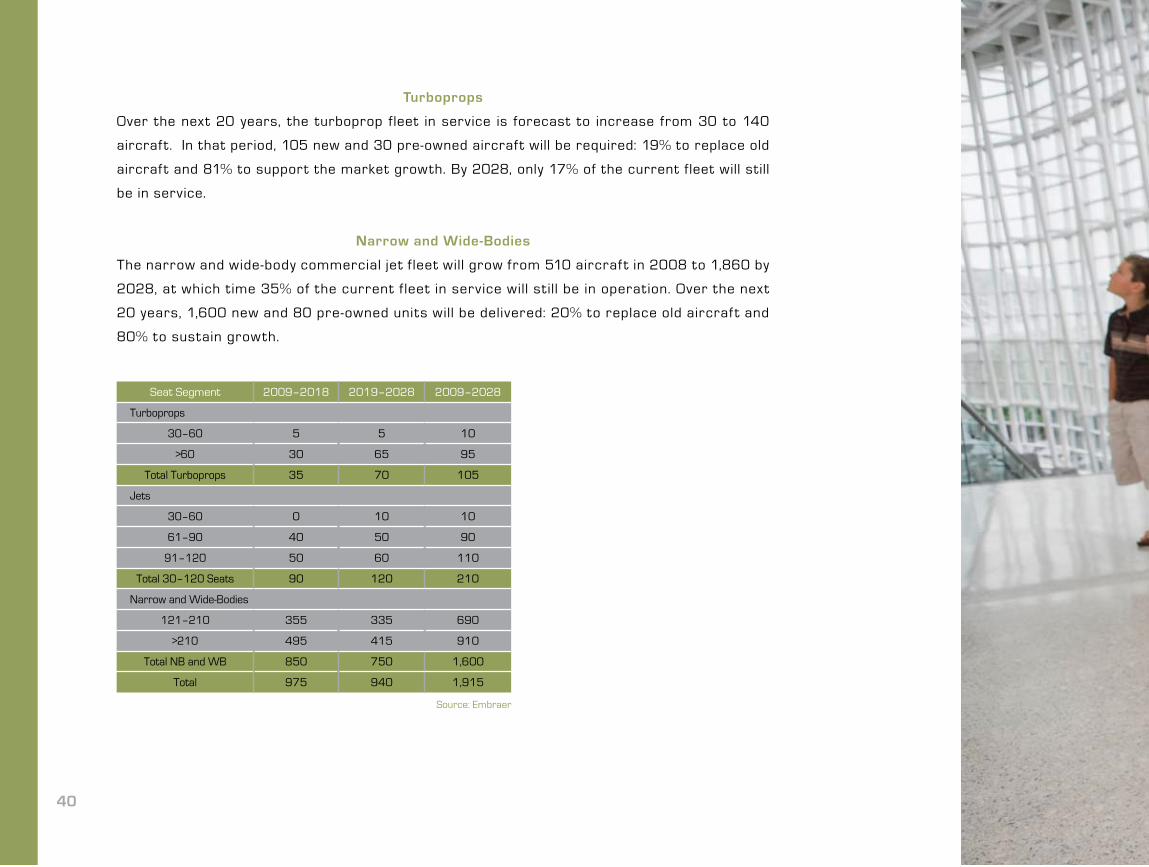
Turboprops
Over the next 20 years, the turboprop fleet in service is forecast to increase from 30 to 140
aircraf t. In that period, 105 new and 30 pre-owned aircraf t will be required: 19% to replace old
aircraf t and 81% to support the market growth. By 2028, only 17% of the current fleet will still
be in service.
Narrow and Wide-Bodies
The narrow and wide-body commercial jet f leet will grow from 510 aircraf t in 2008 to 1,860 by
2028, at which t ime 35% of the current f leet in service will st ill be in operation. Over the next
20 years, 1,600 new and 80 pre-owned units will be delivered: 20% to replace old aircraf t and
80% to sustain growth.
Seat Segment 2009–2018 2019–2028 2009–2028
Turboprops
30–60 5 5 10
>60 30 65 95
Total Turboprops 35 70 105
Jets
30–60 0 10 10
61–90 40 50 90
91–120 50 60 110
Total 30–120 Seats 90 120 210
Narrow and Wide-Bodies
121–210 355 335 690
>210 495 415 910
Total NB and WB 850 750 1,600
Total 975 940 1,915
Source: Embraer

41
42
NORTH AMERICA
Key F igur es (2008)• GDP: US$ 12.6 t r i l l i on 2.5% annua l gr ow t h (2009–2028)• Popu la t i on: 342 mi l l i on• Pas senger Demand: 1.4 t r i l l i on RPKs 3.5% annua l gr ow t h (2009–2028)• Pas senger s : 770 mi l l i on• Schedu led A i r l i nes : 120• F l ee t i n Ser v i ce : 6,700• A i r por t s : 965
Industry Trends
In order to survive in the intensely
competitive and low-yield environment,
North American airlines have focused
on controlling costs and increasing
productivity and efficiency. These
initiatives were not sufficient to offset
the dramatic increase in fuel cost in
2008 and the onset of the liquidity crisis
and economic recession.
As oil peaked at US$ 147 per barrel in
July 2008, network carriers cut capacity
by 12%, while LCCs curtailed growth plans
and deferred aircraft deliveries. Older
equipment was withdrawn from fleets and
is gradually being replaced with aircraft in
the 70 to 120-seat equipment segment.
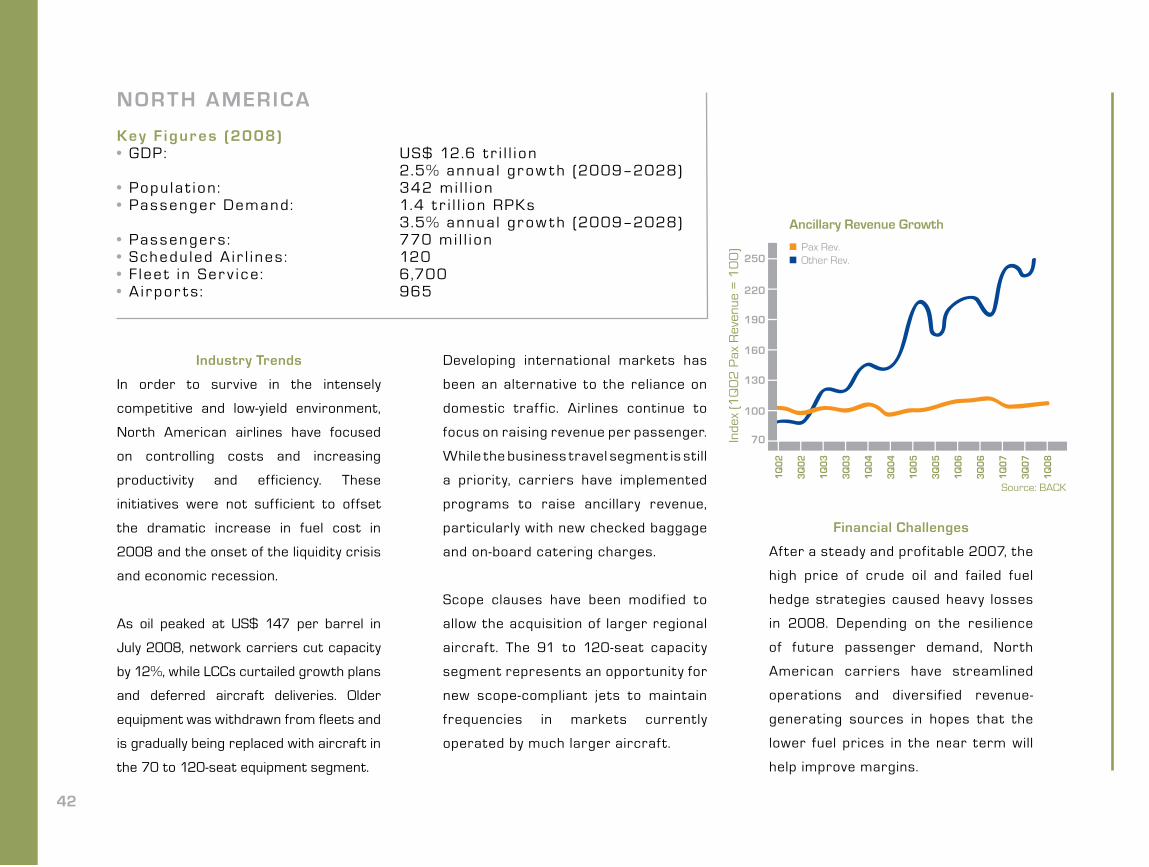
Developing international markets has
been an alternative to the reliance on
domestic traf fic. Airlines continue to
focus on raising revenue per passenger.
While the business travel segment is still
a priority, carriers have implemented
programs to raise ancillary revenue,
particularly with new checked baggage
and on-board catering charges.
Scope clauses have been modified to
allow the acquisition of larger regional
aircraf t. The 91 to 120-seat capacity
segment represents an opportunity for
new scope-compliant jets to maintain
frequencies in markets currently
operated by much larger aircraf t.
Financial Challenges
After a steady and profitable 2007, the
high price of crude oil and failed fuel
hedge strategies caused heavy losses
in 2008. Depending on the resilience
of future passenger demand, North
American carriers have streamlined
operations and diversif ied revenue-
generating sources in hopes that the
lower fuel prices in the near term will
help improve margins.
Ann
ual F
light
s (in
Tho
usan
ds)
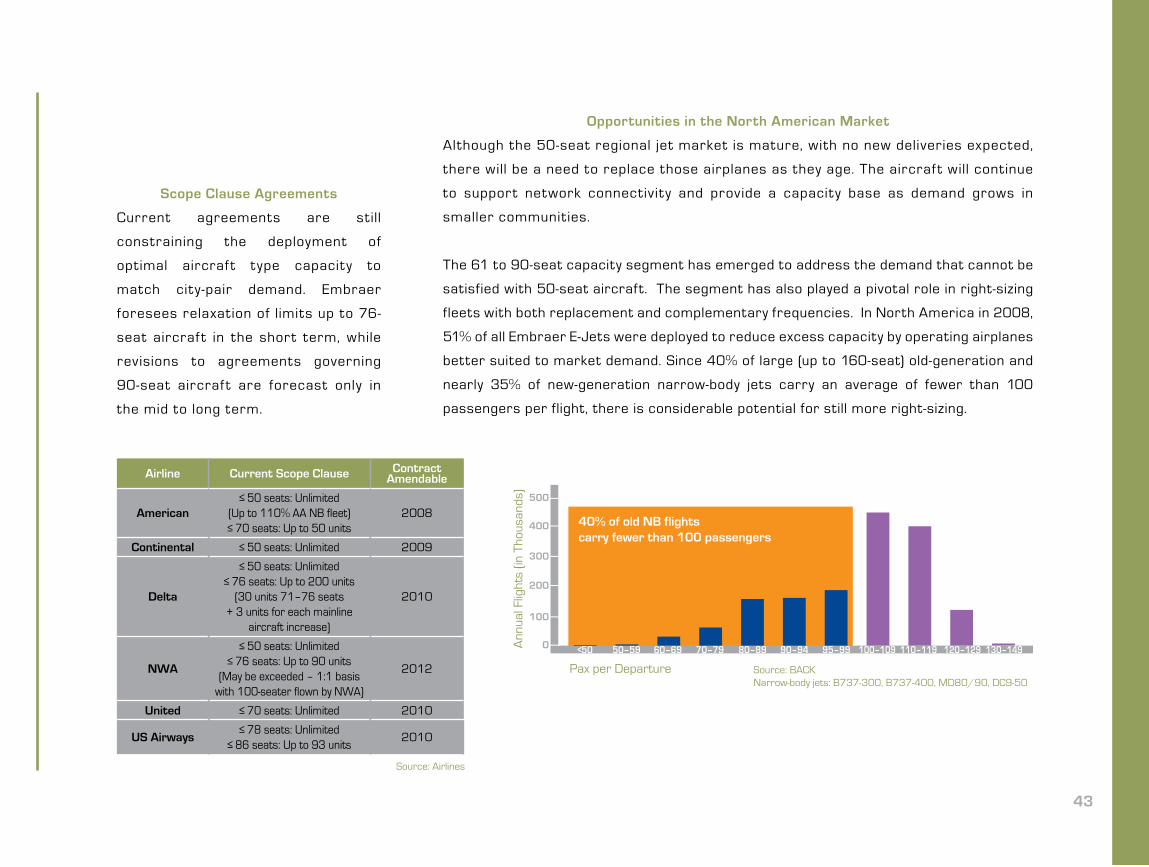
40% of old NB flightscarry fewer than 100 passengers
50–59 60–69<50 70–79 80–89 90–94 95–99 100–109 110–119 120–129 130–149
Airline Current Scope Clause Contract Amendable
American≤ 50 seats: Unlimited
(Up to 110% AA NB fleet)≤ 70 seats: Up to 50 units
2008
Continental ≤ 50 seats: Unlimited 2009
Delta
≤ 50 seats: Unlimited≤ 76 seats: Up to 200 units
(30 units 71–76 seats + 3 units for each mainline
aircraft increase)
2010
NWA
≤ 50 seats: Unlimited≤ 76 seats: Up to 90 units
(May be exceeded – 1:1 basis with 100-seater flown by NWA)
2012
United ≤ 70 seats: Unlimited 2010
US Airways≤ 78 seats: Unlimited
≤ 86 seats: Up to 93 units2010
43
Scope Clause Agreements
Current agreements are still
constraining the deployment of
optimal aircraf t type capacity to
match city-pair demand. Embraer
foresees relaxation of limits up to 76-
seat aircraf t in the short term, while
revisions to agreements governing
90-seat aircraf t are forecast only in
the mid to long term.
Opportunities in the North American Market
Although the 50-seat regional jet market is mature, with no new deliveries expected,
there will be a need to replace those airplanes as they age. The aircraf t will continue
to support network connectiv ity and provide a capacity base as demand grows in
smaller communities.
The 61 to 90-seat capacity segment has emerged to address the demand that cannot be
satisfied with 50-seat aircraft. The segment has also played a pivotal role in right-sizing
fleets with both replacement and complementary frequencies. In North America in 2008,
51% of all Embraer E-Jets were deployed to reduce excess capacity by operating airplanes
better suited to market demand. Since 40% of large (up to 160-seat) old-generation and
nearly 35% of new-generation narrow-body jets carry an average of fewer than 100
passengers per flight, there is considerable potential for still more right-sizing.
Source: BACKNarrow-body jets: B737-300, B737-400, MD80/90, DC9-50
Source: Airlines
44
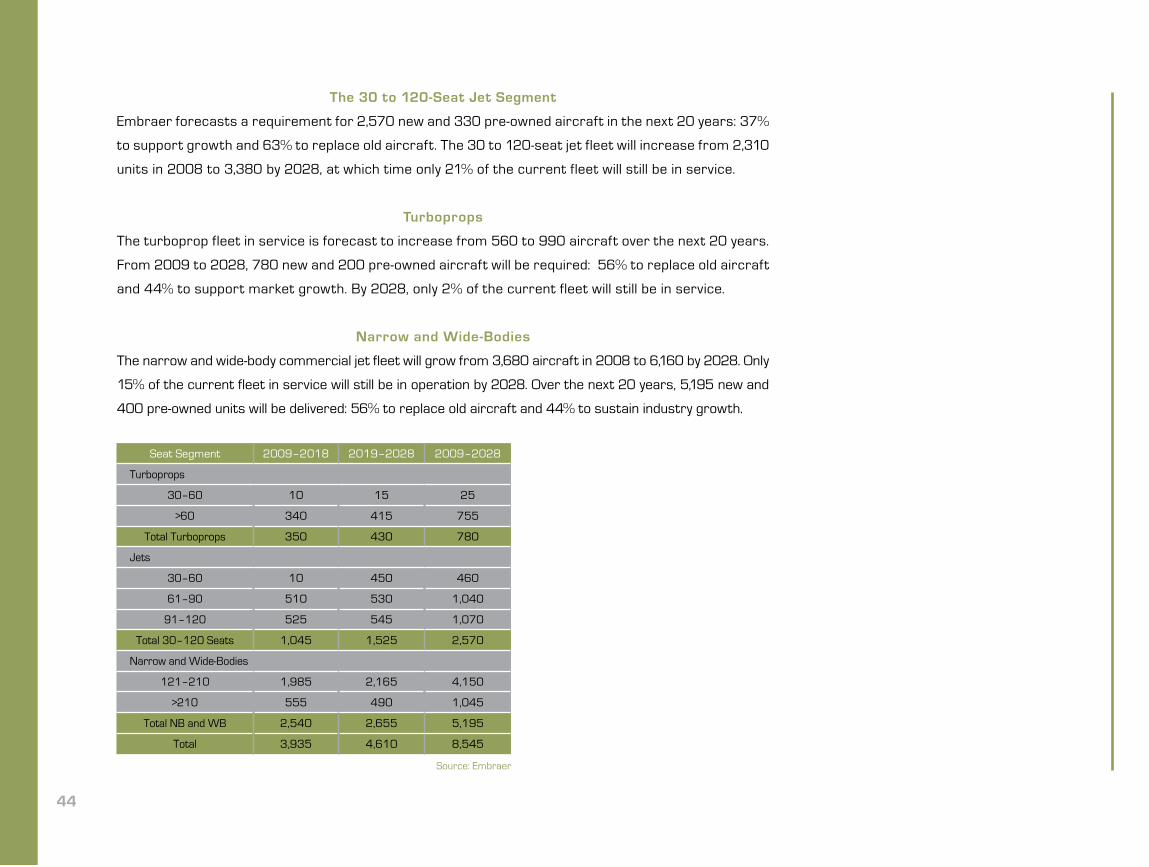
The 30 to 120-Seat Jet Segment
Embraer forecasts a requirement for 2,570 new and 330 pre-owned aircraft in the next 20 years: 37%
to support growth and 63% to replace old aircraft. The 30 to 120-seat jet fleet will increase from 2,310
units in 2008 to 3,380 by 2028, at which time only 21% of the current fleet will still be in service.
Turboprops
The turboprop fleet in service is forecast to increase from 560 to 990 aircraft over the next 20 years.
From 2009 to 2028, 780 new and 200 pre-owned aircraft will be required: 56% to replace old aircraft
and 44% to support market growth. By 2028, only 2% of the current fleet will still be in service.
Narrow and Wide-Bodies
The narrow and wide-body commercial jet fleet will grow from 3,680 aircraft in 2008 to 6,160 by 2028. Only
15% of the current fleet in service will still be in operation by 2028. Over the next 20 years, 5,195 new and
400 pre-owned units will be delivered: 56% to replace old aircraft and 44% to sustain industry growth.
Seat Segment 2009–2018 2019–2028 2009–2028
Turboprops
30–60 10 15 25
>60 340 415 755
Total Turboprops 350 430 780
Jets
30–60 10 450 460
61–90 510 530 1,040
91–120 525 545 1,070
Total 30–120 Seats 1,045 1,525 2,570
Narrow and Wide-Bodies
121–210 1,985 2,165 4,150
>210 555 490 1,045
Total NB and WB 2,540 2,655 5,195
Total 3,935 4,610 8,545
Source: Embraer

46
RUSSIA/CIS
Key F igur es (2008)• GDP: US$ 1.3 t r i l l i on 4.4% annua l gr ow t h (2009–2028)• Popu la t i on: 277 mi l l i on• Pas senger Demand: 104 b i l l i on RPKs 6.1% annua l gr ow t h (2009–2028)• Pas senger s : 36 mi l l i on• Schedu led A i r l i nes : 129• F l ee t i n Ser v i ce : 1,329• A i r por t s : 170
Nascent Regional
Air Transport Industry
Russia, with its 144 million inhabitants, is
the most populous of the 12 CIS member
states, while Ukraine (47 million) and
Uzbekistan (26 million) rank 2nd and
3rd. These regions were instrumental
in developing the Russian economy
and producing a steady increase in
disposable income. Consequently, from
2002 to 2006, the air transport market
grew approximately 10% per year.
There is a significant gap between
the mobility of the Russian population
and the mobility of other countries. In
2006, the ratio of airline passenger
departures to population was 0.27 for
Russia compared to a global average
of 0.70. This gap should decrease as
disposable income increases, trade
and economic relations expand and
new air routes are developed.
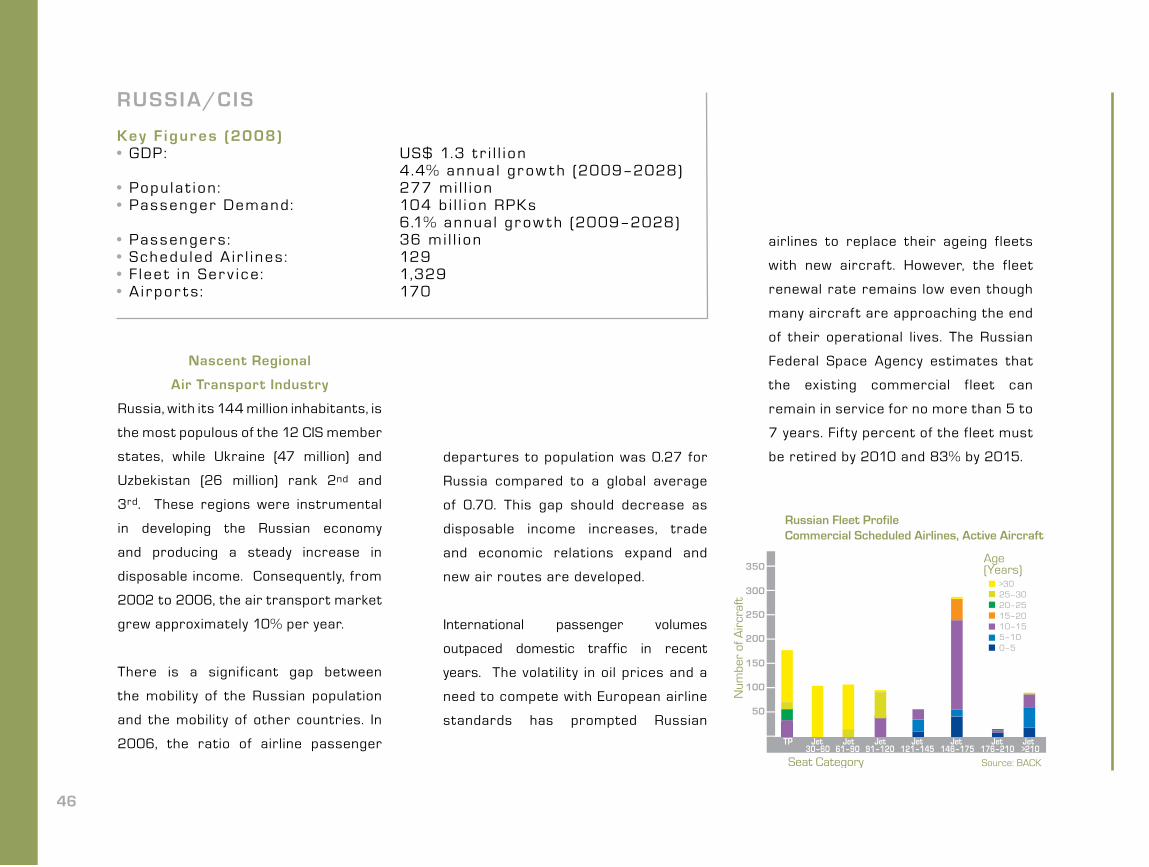
International passenger volumes
outpaced domestic traffic in recent
years. The volatility in oil prices and a
need to compete with European airline
standards has prompted Russian
airlines to replace their ageing fleets
with new aircraf t. However, the fleet
renewal rate remains low even though
many aircraf t are approaching the end
of their operational lives. The Russian
Federal Space Agency estimates that
the existing commercial f leet can
remain in service for no more than 5 to
7 years. Fif ty percent of the fleet must
be retired by 2010 and 83% by 2015.
Russian Fleet ProfileCommercial Scheduled Airlines, Active Aircraft
Age (Years)
>3025–3020–2515–2010–155–100–5
TP Jet Jet Jet Jet Jet Jet Jet30–60 61–90 91–120 121–145 146–175 176–210 >210
47
In the last 10 years, the Russian airline
market has seen a reduction in the
number of airlines from 389 to 182
as aviation authorities have enforced
compliance with stricter technical
standards. The number of airports has
also declined: 1,450 in 1991 to 330 in
2008. The prospects for acquiring 70
to 120-seat aircraft are long term, as
air transport in the Russian Federation
requires comprehensive infrastructure
modernization to meet ICAO standards.
Ukraine
Following the 1991 break-up of the
Soviet Union, Ukraine inherited a number
of usable airports, a well-developed rail
network and a fleet of outdated Soviet
aircraft. The existence of the rail network,
coupled with low per capita income,
hindered development of the domestic
airline market throughout the 1990s
and explains why most international air
routes serve Kiev’s Borispol airport.
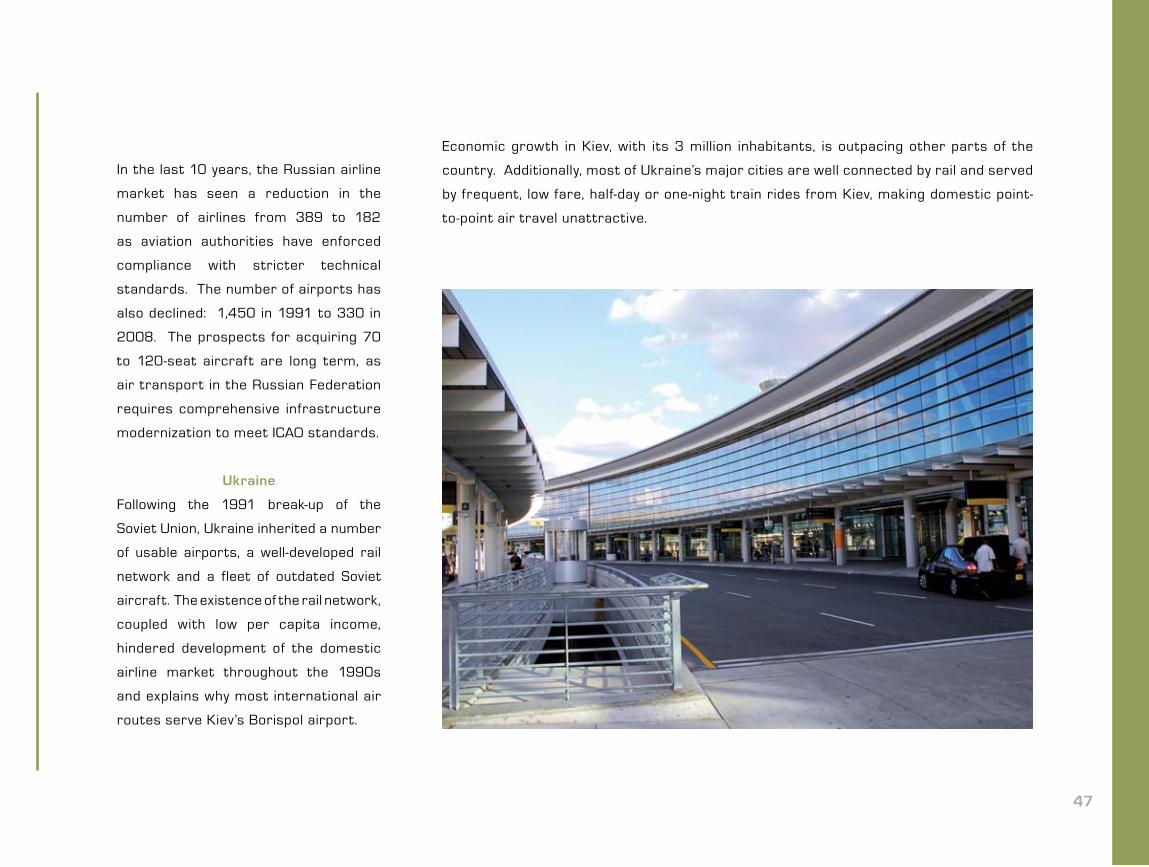
Economic growth in Kiev, with its 3 million inhabitants, is outpacing other parts of the
country. Additionally, most of Ukraine’s major cities are well connected by rail and served
by frequent, low fare, half-day or one-night train rides from Kiev, making domestic point-
to-point air travel unattractive.
48
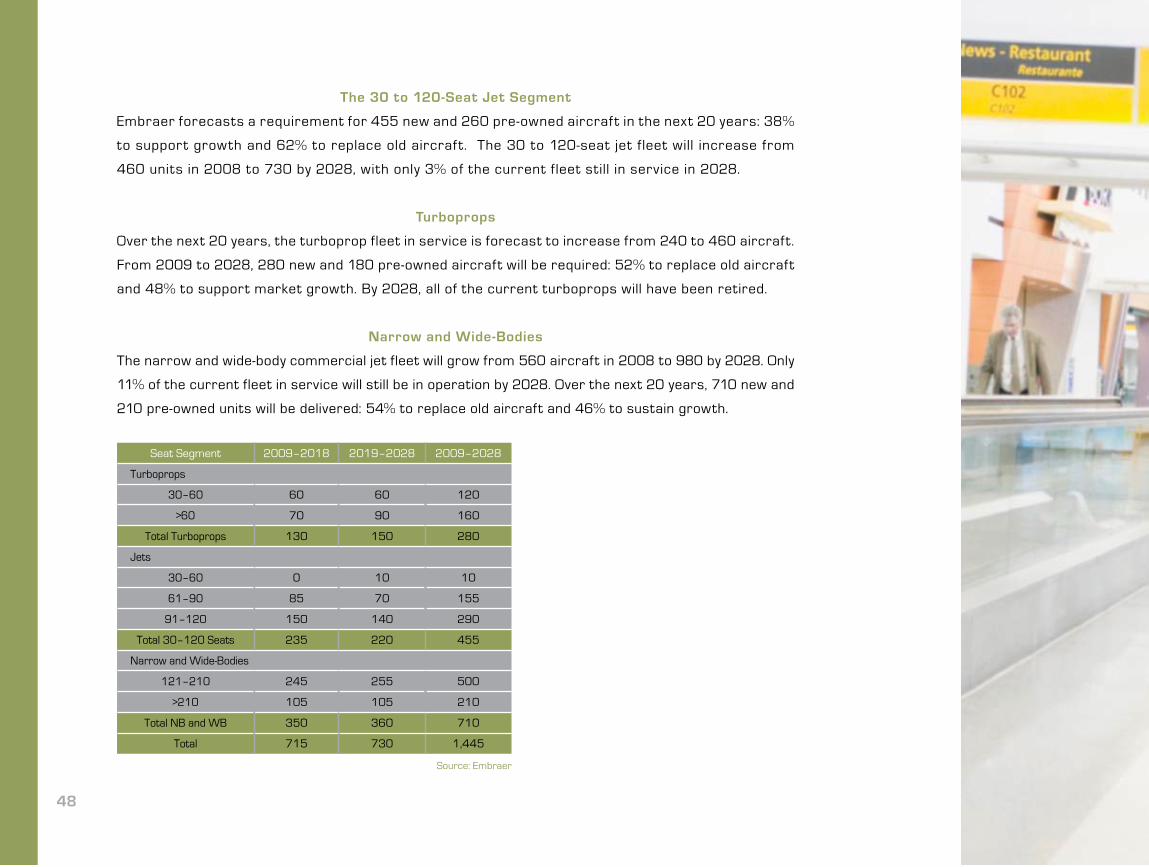
The 30 to 120-Seat Jet Segment
Embraer forecasts a requirement for 455 new and 260 pre-owned aircraf t in the next 20 years: 38%
to support growth and 62% to replace old aircraf t. The 30 to 120-seat jet f leet will increase from
460 units in 2008 to 730 by 2028, with only 3% of the current fleet still in service in 2028.
Turboprops
Over the next 20 years, the turboprop fleet in service is forecast to increase from 240 to 460 aircraft.
From 2009 to 2028, 280 new and 180 pre-owned aircraft will be required: 52% to replace old aircraft
and 48% to support market growth. By 2028, all of the current turboprops will have been retired.
Narrow and Wide-Bodies
The narrow and wide-body commercial jet fleet will grow from 560 aircraft in 2008 to 980 by 2028. Only
11% of the current fleet in service will still be in operation by 2028. Over the next 20 years, 710 new and
210 pre-owned units will be delivered: 54% to replace old aircraft and 46% to sustain growth.
Seat Segment 2009–2018 2019–2028 2009–2028
Turboprops
30–60 60 60 120
>60 70 90 160
Total Turboprops 130 150 280
Jets
30–60 0 10 10
61–90 85 70 155
91–120 150 140 290
Total 30–120 Seats 235 220 455
Narrow and Wide-Bodies
121–210 245 255 500
>210 105 105 210
Total NB and WB 350 360 710
Total 715 730 1,445
Source: Embraer

49


Market Forecast

52
30 to 120-Seat Jet Segment
North America
2,57038%
Latin America
5408%
Africa
2303%
Europe
1,35020%
Russia/CIS
4557%
China
87513%
Middle East
2103%
Asia Pacific
5208%
Projected New DeliveriesRegion 2009–2018 2009–2028 %
Africa 90 230 3%
Asia Pacific 225 520 8%
China 405 875 13%
Europe 590 1,350 20%
Latin America 270 540 8%
Middle East 90 210 3%
North America 1,045 2,570 38%
Russia/CIS 235 455 7%
World 2,950 6,750 100%
Source: Embraer

54
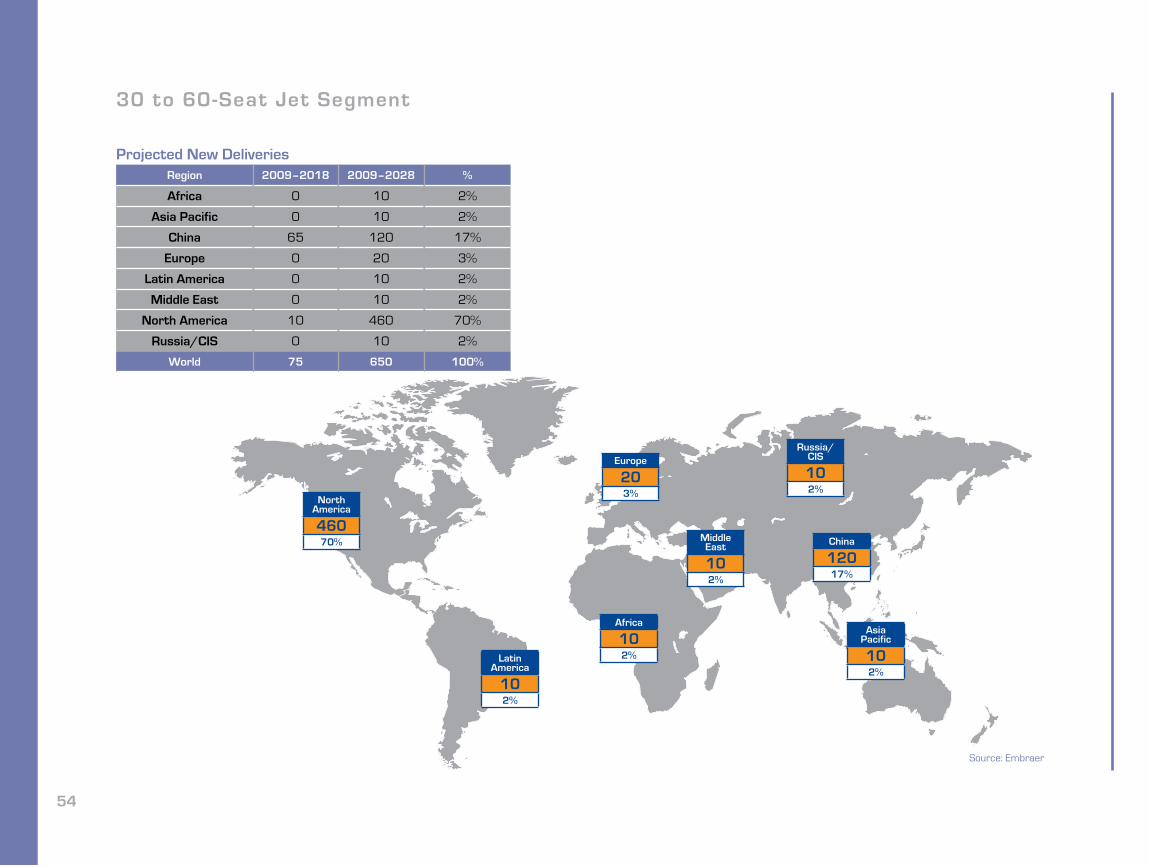
30 to 60-Seat Jet Segment
North America
46070%
Latin America
102%
Africa
102%
Europe
203%
Russia/CIS
102%
China
12017%
Middle East
102%
Asia Pacific
102%
Projected New DeliveriesRegion 2009–2018 2009–2028 %
Africa 0 10 2%
Asia Pacific 0 10 2%
China 65 120 17%
Europe 0 20 3%
Latin America 0 10 2%
Middle East 0 10 2%
North America 10 460 70%
Russia/CIS 0 10 2%
World 75 650 100%
Source: Embraer
55
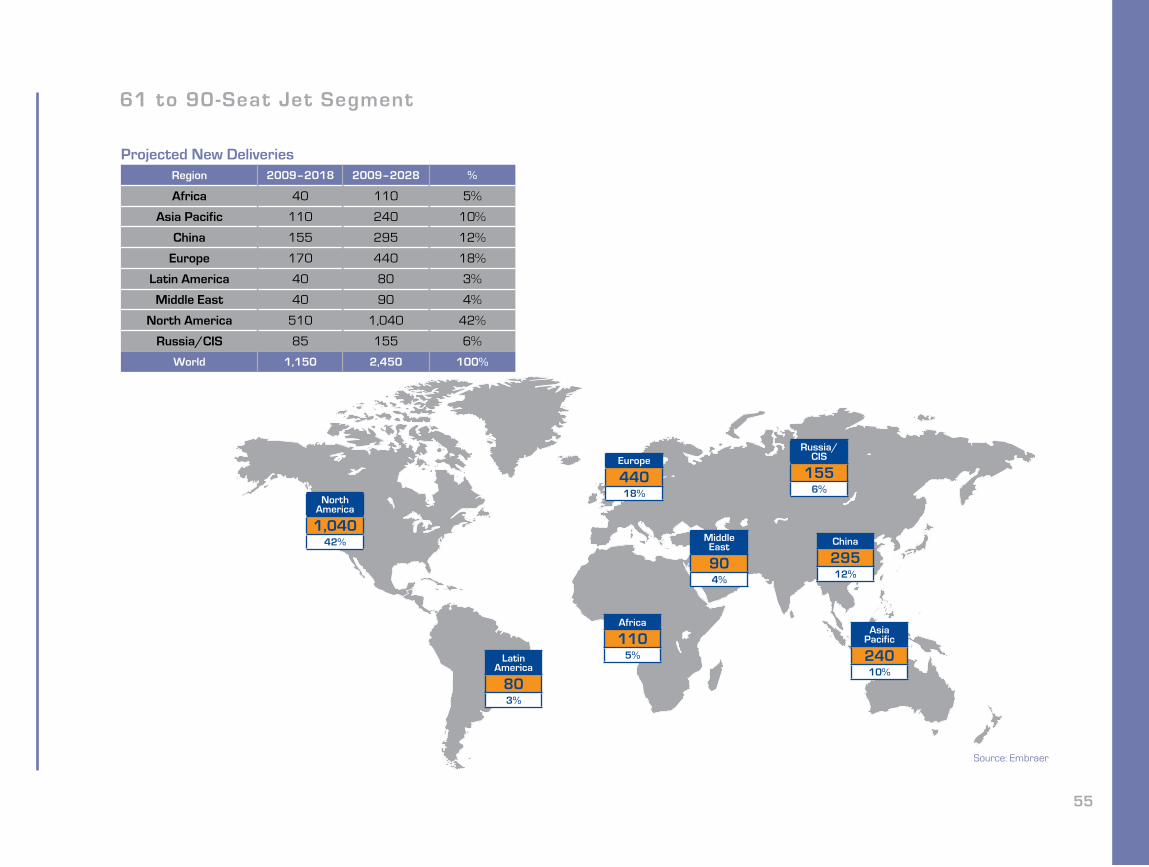
61 to 90-Seat Jet Segment
North America
1,04042%
Latin America
803%
Africa
1105%
Europe
44018%
Russia/CIS
1556%
China
29512%
Middle East
904%
Asia Pacific
24010%
Projected New DeliveriesRegion 2009–2018 2009–2028 %
Africa 40 110 5%
Asia Pacific 110 240 10%
China 155 295 12%
Europe 170 440 18%
Latin America 40 80 3%
Middle East 40 90 4%
North America 510 1,040 42%
Russia/CIS 85 155 6%
World 1,150 2,450 100%
Source: Embraer
56
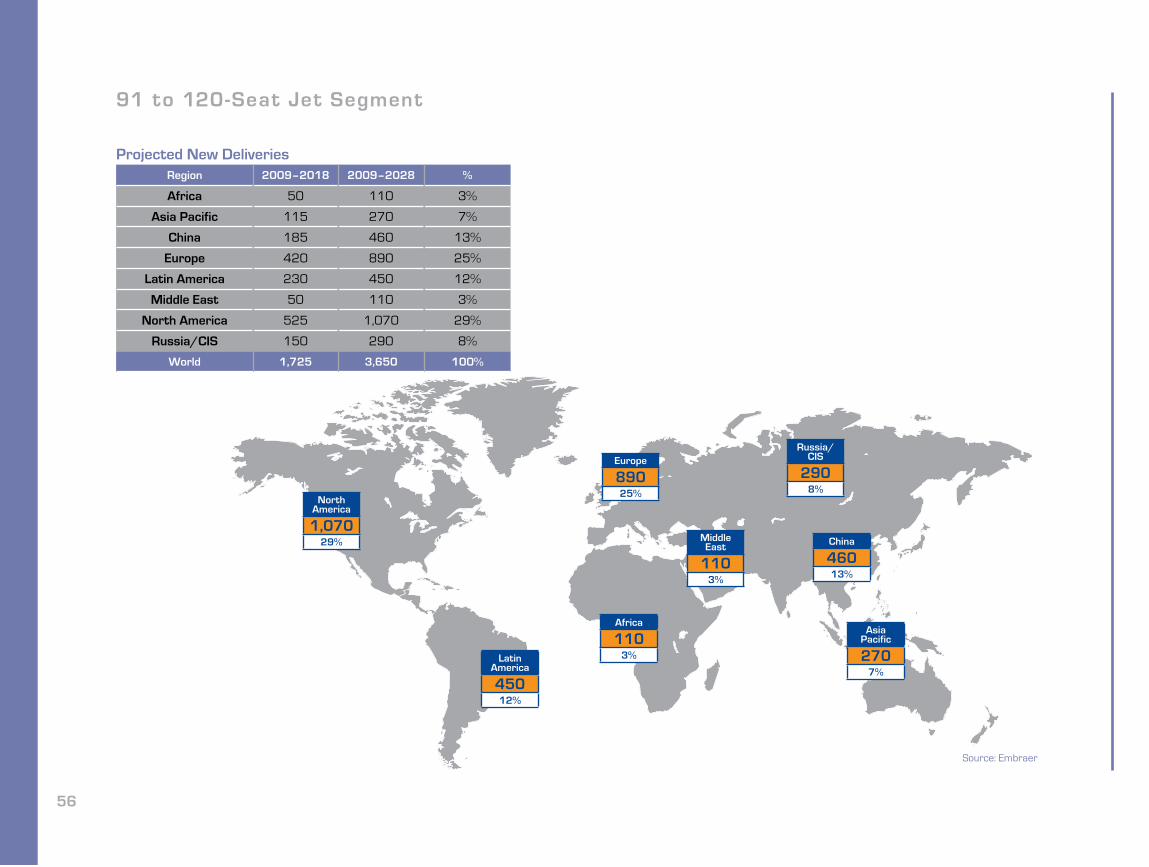
91 to 120-Seat Jet Segment
North America
1,07029%
Latin America
45012%
Africa
1103%
Europe
89025%
Russia/CIS
2908%
China
46013%
Middle East
1103%
Asia Pacific
2707%
Projected New DeliveriesRegion 2009–2018 2009–2028 %
Africa 50 110 3%
Asia Pacific 115 270 7%
China 185 460 13%
Europe 420 890 25%
Latin America 230 450 12%
Middle East 50 110 3%
North America 525 1,070 29%
Russia/CIS 150 290 8%
World 1,725 3,650 100%
Source: Embraer

58
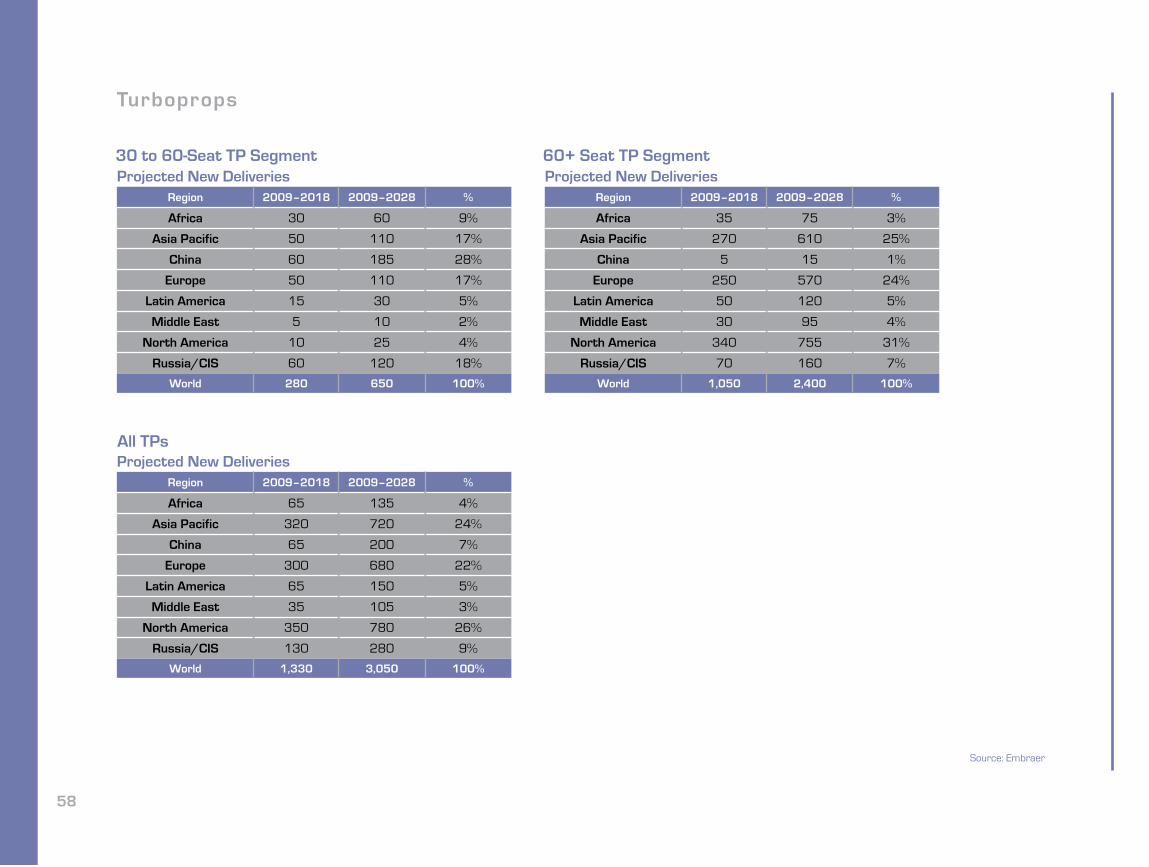
Turboprops
Projected New Deliveries Region 2009–2018 2009–2028 %
Africa 30 60 9%
Asia Pacific 50 110 17%
China 60 185 28%
Europe 50 110 17%
Latin America 15 30 5%
Middle East 5 10 2%
North America 10 25 4%
Russia/CIS 60 120 18%
World 280 650 100%
Projected New DeliveriesRegion 2009–2018 2009–2028 %
Africa 35 75 3%
Asia Pacific 270 610 25%
China 5 15 1%
Europe 250 570 24%
Latin America 50 120 5%
Middle East 30 95 4%
North America 340 755 31%
Russia/CIS 70 160 7%
World 1,050 2,400 100%
Projected New DeliveriesRegion 2009–2018 2009–2028 %
Africa 65 135 4%
Asia Pacific 320 720 24%
China 65 200 7%
Europe 300 680 22%
Latin America 65 150 5%
Middle East 35 105 3%
North America 350 780 26%
Russia/CIS 130 280 9%
World 1,330 3,050 100%
30 to 60-Seat TP Segment 60+ Seat TP Segment
All TPs
Source: Embraer
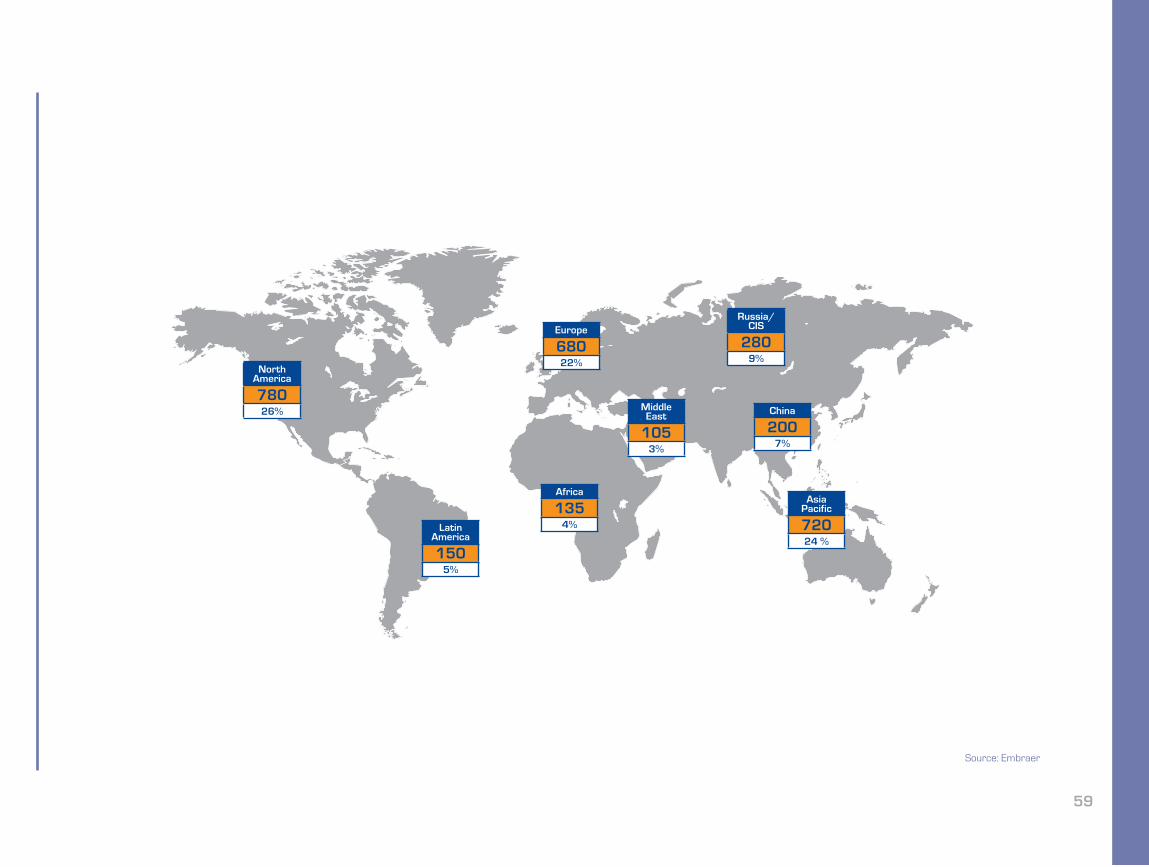
59
North America
78026%
Latin America
1505%
Africa
1354%
Europe
68022%
Russia/CIS
2809%
China
2007%
Middle East
1053%
Asia Pacific
72024 %
Source: Embraer
60
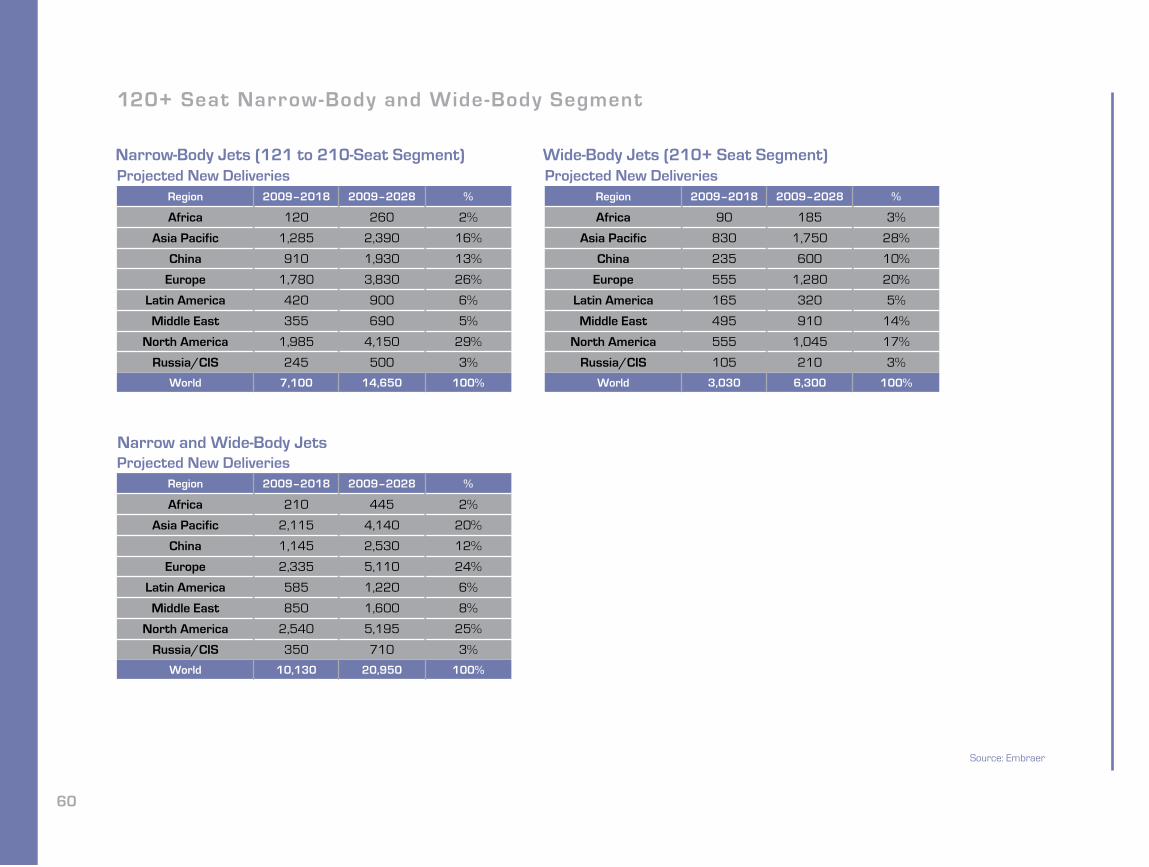
120+ Seat Narrow-Body and Wide-Body Segment
Projected New Deliveries Region 2009–2018 2009–2028 %
Africa 120 260 2%
Asia Pacific 1,285 2,390 16%
China 910 1,930 13%
Europe 1,780 3,830 26%
Latin America 420 900 6%
Middle East 355 690 5%
North America 1,985 4,150 29%
Russia/CIS 245 500 3%
World 7,100 14,650 100%
Projected New DeliveriesRegion 2009–2018 2009–2028 %
Africa 90 185 3%
Asia Pacific 830 1,750 28%
China 235 600 10%
Europe 555 1,280 20%
Latin America 165 320 5%
Middle East 495 910 14%
North America 555 1,045 17%
Russia/CIS 105 210 3%
World 3,030 6,300 100%
Projected New DeliveriesRegion 2009–2018 2009–2028 %
Africa 210 445 2%
Asia Pacific 2,115 4,140 20%
China 1,145 2,530 12%
Europe 2,335 5,110 24%
Latin America 585 1,220 6%
Middle East 850 1,600 8%
North America 2,540 5,195 25%
Russia/CIS 350 710 3%
World 10,130 20,950 100%
Narrow-Body Jets (121 to 210-Seat Segment) Wide-Body Jets (210+ Seat Segment)
Narrow and Wide-Body Jets
Source: Embraer
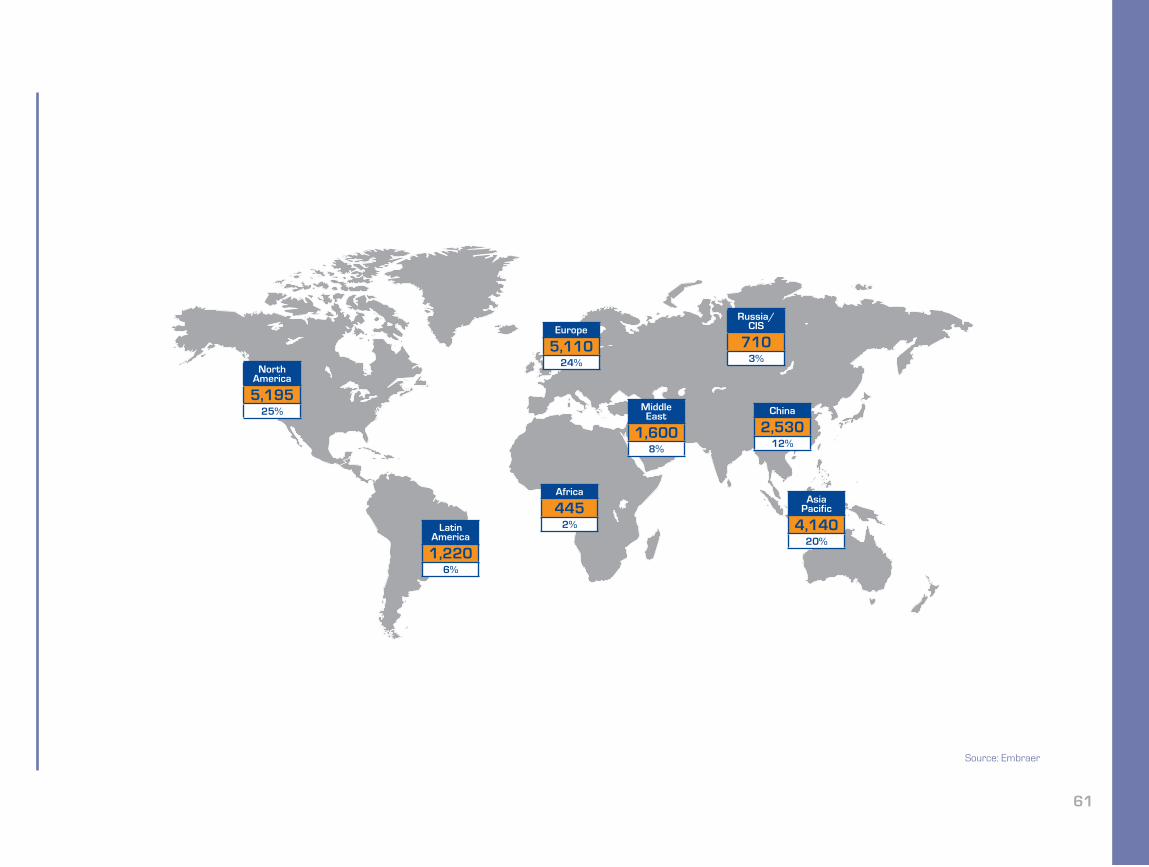
61
North America
5,19525%
Latin America
1,2206%
Africa
4452%
Europe
5,11024%
Russia/CIS
7103%
China
2,53012%
Middle East
1,6008%
Asia Pacific
4,14020%
Source: Embraer
62
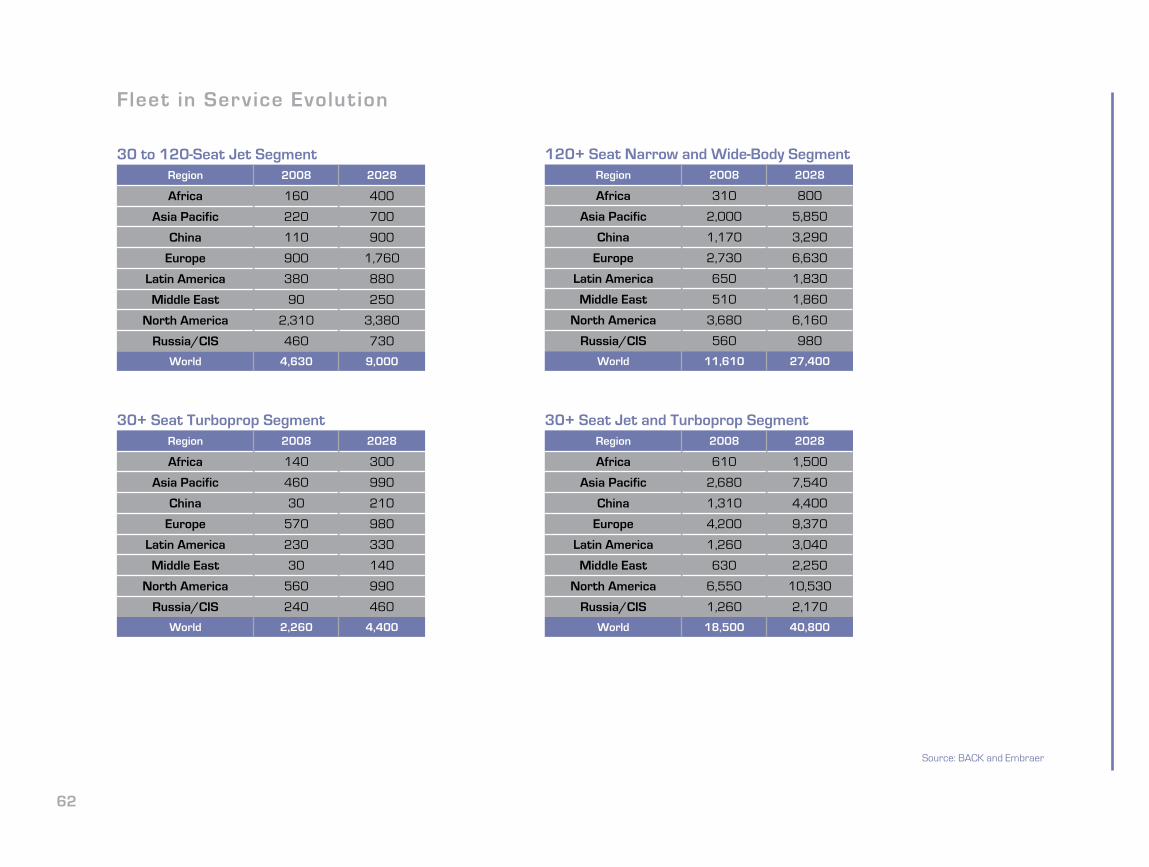
Fleet in Service Evolution
30 to 120-Seat Jet Segment Region 2008 2028
Africa 160 400
Asia Pacific 220 700
China 110 900
Europe 900 1,760
Latin America 380 880
Middle East 90 250
North America 2,310 3,380
Russia/CIS 460 730
World 4,630 9,000
120+ Seat Narrow and Wide-Body Segment Region 2008 2028
Africa 310 800
Asia Pacific 2,000 5,850
China 1,170 3,290
Europe 2,730 6,630
Latin America 650 1,830
Middle East 510 1,860
North America 3,680 6,160
Russia/CIS 560 980
World 11,610 27,400
30+ Seat Turboprop SegmentRegion 2008 2028
Africa 140 300
Asia Pacific 460 990
China 30 210
Europe 570 980
Latin America 230 330
Middle East 30 140
North America 560 990
Russia/CIS 240 460
World 2,260 4,400
30+ Seat Jet and Turboprop Segment Region 2008 2028
Africa 610 1,500
Asia Pacific 2,680 7,540
China 1,310 4,400
Europe 4,200 9,370
Latin America 1,260 3,040
Middle East 630 2,250
North America 6,550 10,530
Russia/CIS 1,260 2,170
World 18,500 40,800
Source: BACK and Embraer
2
Any and all information contained herein is based on good faith assumptions and is provided for general information purposes only. This information does not constitute an of fer, promise, warranty, or guarantee of performance. This document should not be used or relied upon for any purpose other than as intended by Embraer.
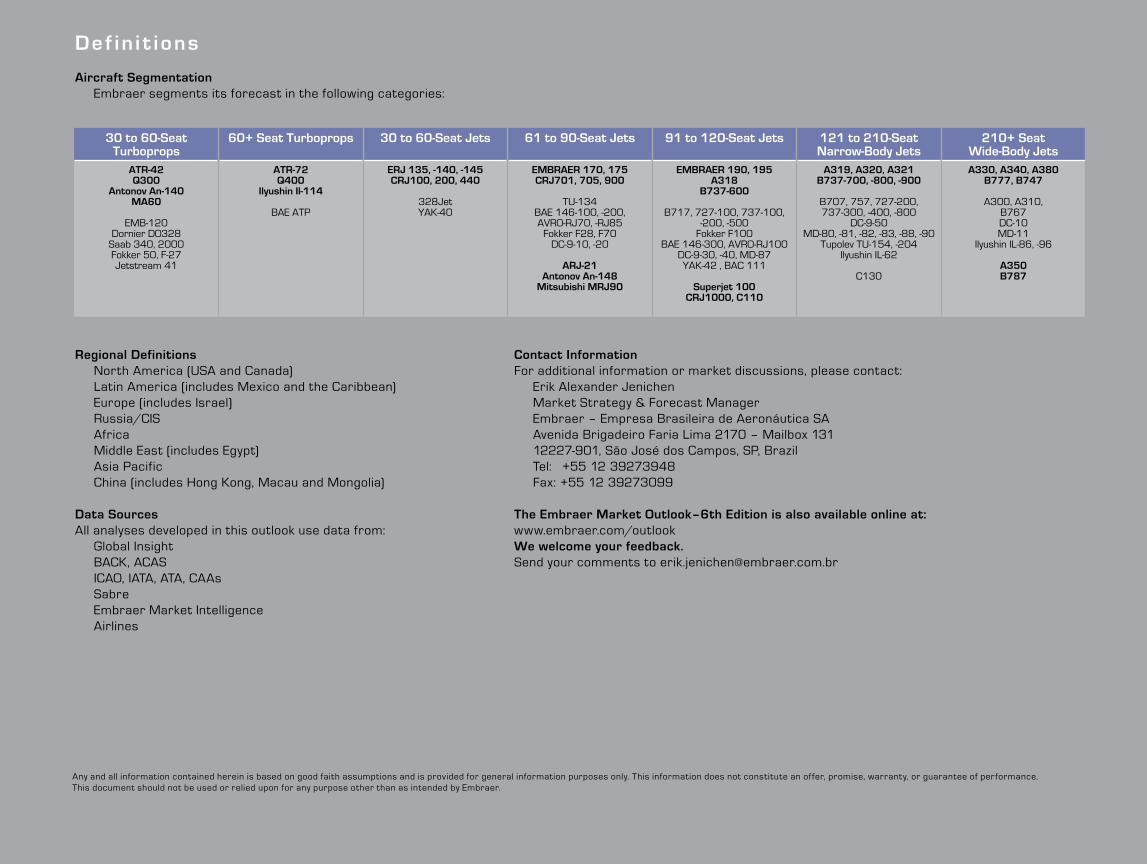
30 to 60-Seat Turboprops
60+ Seat Turboprops 30 to 60-Seat Jets 61 to 90-Seat Jets 91 to 120-Seat Jets 121 to 210-Seat Narrow-Body Jets
210+ SeatWide-Body Jets
ATR-42Q300
Antonov An-140MA60
EMB-120Dornier DO328
Saab 340, 2000Fokker 50, F-27Jetstream 41
ATR-72Q400
Ilyushin Il-114
BAE ATP
ERJ 135, -140, -145CRJ100, 200, 440
328JetYAK-40
EMBRAER 170, 175CRJ701, 705, 900
TU-134 BAE 146-100, -200, AVRO-RJ70, -RJ85
Fokker F28, F70 DC-9-10, -20
ARJ-21Antonov An-148
Mitsubishi MRJ90
EMBRAER 190, 195A318
B737-600
B717, 727-100, 737-100, -200, -500
Fokker F100BAE 146-300, AVRO-RJ100
DC-9-30, -40, MD-87YAK-42 , BAC 111
Superjet 100CRJ1000, C110
A319, A320, A321B737-700, -800, -900
B707, 757, 727-200, 737-300, -400, -800
DC-9-50MD-80, -81, -82, -83, -88, -90
Tupolev TU-154, -204Ilyushin IL-62
C130
A330, A340, A380B777, B747
A300, A310, B767 DC-10MD-11
Ilyushin IL-86, -96
A350B787
De f in i t ions
Aircraft SegmentationEmbraer segments its forecast in the following categories:
Regional DefinitionsNorth America (USA and Canada)Latin America (includes Mexico and the Caribbean)Europe (includes Israel)Russia/CISAfrica Middle East (includes Egypt)Asia PacificChina (includes Hong Kong, Macau and Mongolia)
Data SourcesAll analyses developed in this outlook use data from:
Global InsightBACK, ACASICAO, IATA, ATA, CAAsSabreEmbraer Market IntelligenceAirlines
Contact InformationFor additional information or market discussions, please contact:
Erik Alexander JenichenMarket Strategy & Forecast ManagerEmbraer – Empresa Brasileira de Aeronáutica SAAvenida Brigadeiro Faria Lima 2170 – Mailbox 13112227-901, São José dos Campos, SP, Brazil Tel: +55 12 39273948Fax: +55 12 39273099
The Embraer Market Outlook–6th Edition is also available online at:www.embraer.com/outlookWe welcome your feedback. Send your comments to [email protected]

Embraer Market Outlook 2009–2028
Embraer – HeadquartersAv. Br igadeiro Far ia Lima, 2.170 12227-901 – São José dos Campos – SP – Brazi l Tel.: +55 12 3927 1000Fax: +55 12 3927 6600 Ex tension 1448
Sales Of f icesUSA, Canada & Caribbean276 SW 34th StreetFor t Lauderdale – FL 33315 – USATel.: +1 954 359 3700Fax: +1 954 359 8170
Europe, Middle East & AfricaBat. Eddington Par is Nord II – 33, Rue des VanessesBP 57391 Vi l lepinte95943 Roissy CDG Cedex – FranceTel.: +33 1 49 38 4400Fax: +33 1 49 38 4401
ChinaSuite 1806, Tower 2, China Central Place Of f ice Bui ldingNo. 79 Jianguo RoadChaoyang Distr ict – Bei j ing 100025People’s Republic of ChinaTel.: +86 10 6598 9988Fax: +86 10 6598 9986
Asia Pacif ic391B Orchard Road # 24-02 – Ngee Ann Ci t y – Tower B Singapore 238874 Tel.: +65 6734 4321Fax: +65 6734 8255
Latin AmericaEmpresa Brasi leira de Aeronáut ica SAAv. Br igadeiro Far ia Lima, 2.170 12227-901 – São José dos Campos – São Paulo – Brazi lTel.: +55 12 3927 3059Fax: +55 12 3927 8444
Feb, 2009