embedded analytics and big data visualization inside any app
TRANSCRIPT
Embedded Analytics & Big Data Visualization in Any App
Boney Pandya Marketing Manager
Greg Harris Systems Engineer
Follow us @Jinfonet

Simplify the Complexity of Reporting
and Visualization
Our Mission
2
3
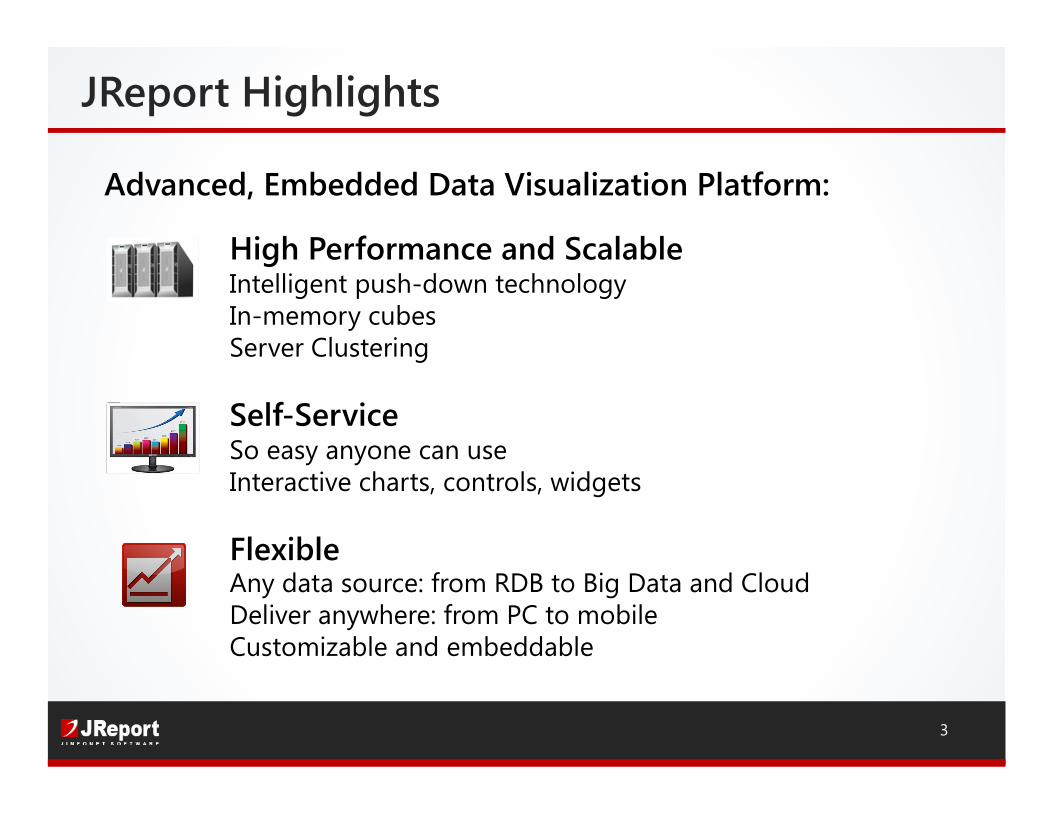
High Performance and Scalable Intelligent push-down technology In-memory cubes Server Clustering
Self-ServiceSo easy anyone can use Interactive charts, controls, widgets
Flexible Any data source: from RDB to Big Data and Cloud Deliver anywhere: from PC to mobile Customizable and embeddable
Advanced, Embedded Data Visualization Platform:
JReport Highlights
4
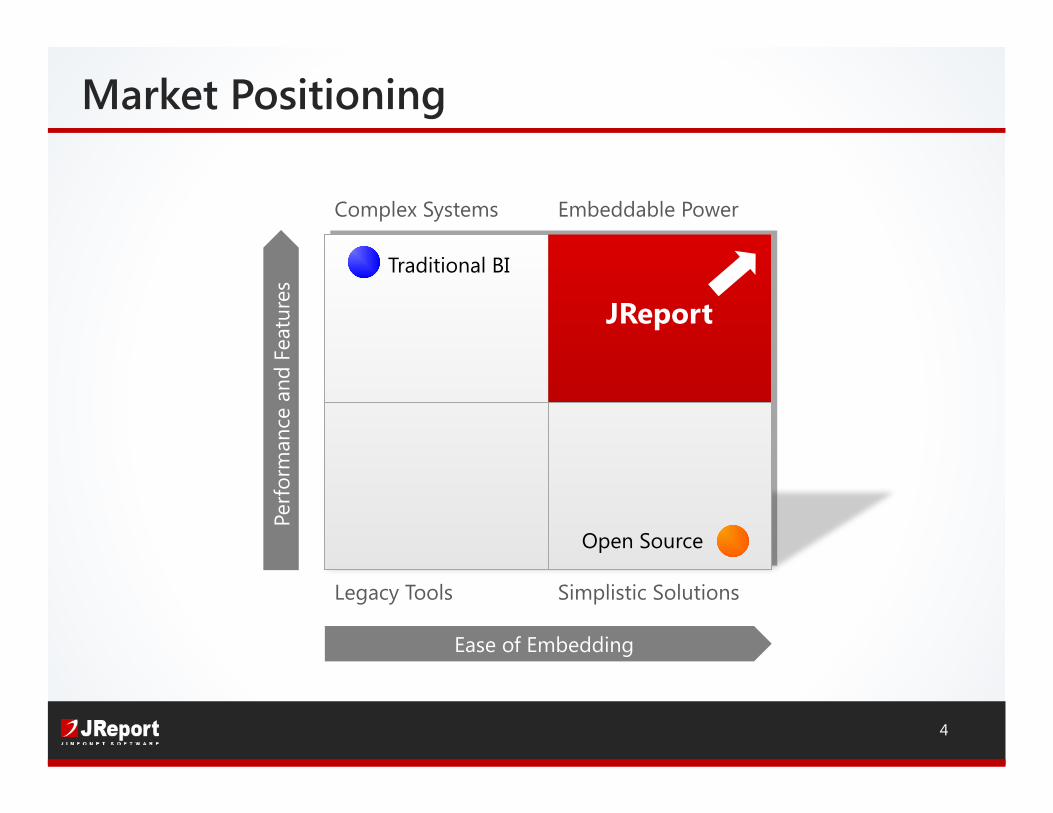
Ease of Embedding
Complex Systems
Simplistic Solutions
Embeddable Power
Legacy Tools
Perf
orm
ance
and
Fea
ture
s Traditional BI
Open Source
JReport
Market Positioning
5
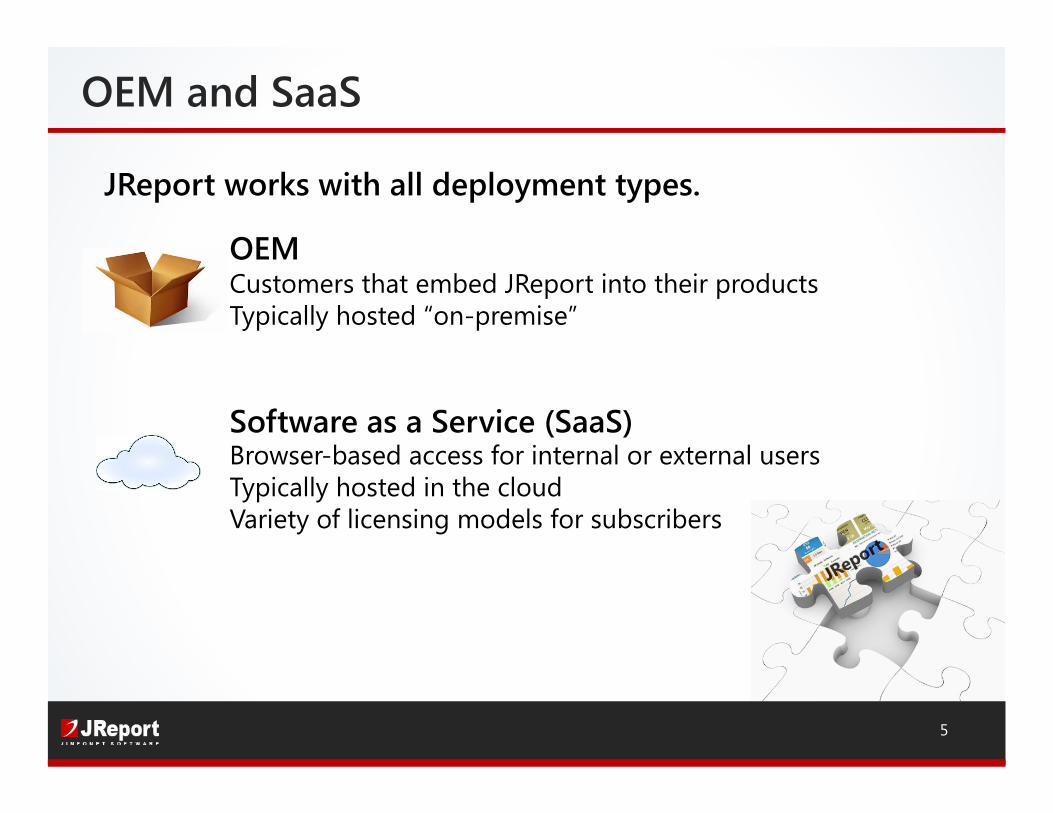
OEMCustomers that embed JReport into their products Typically hosted “on-premise”
Software as a Service (SaaS)Browser-based access for internal or external users Typically hosted in the cloudVariety of licensing models for subscribers
JReport works with all deployment types.
OEM and SaaS
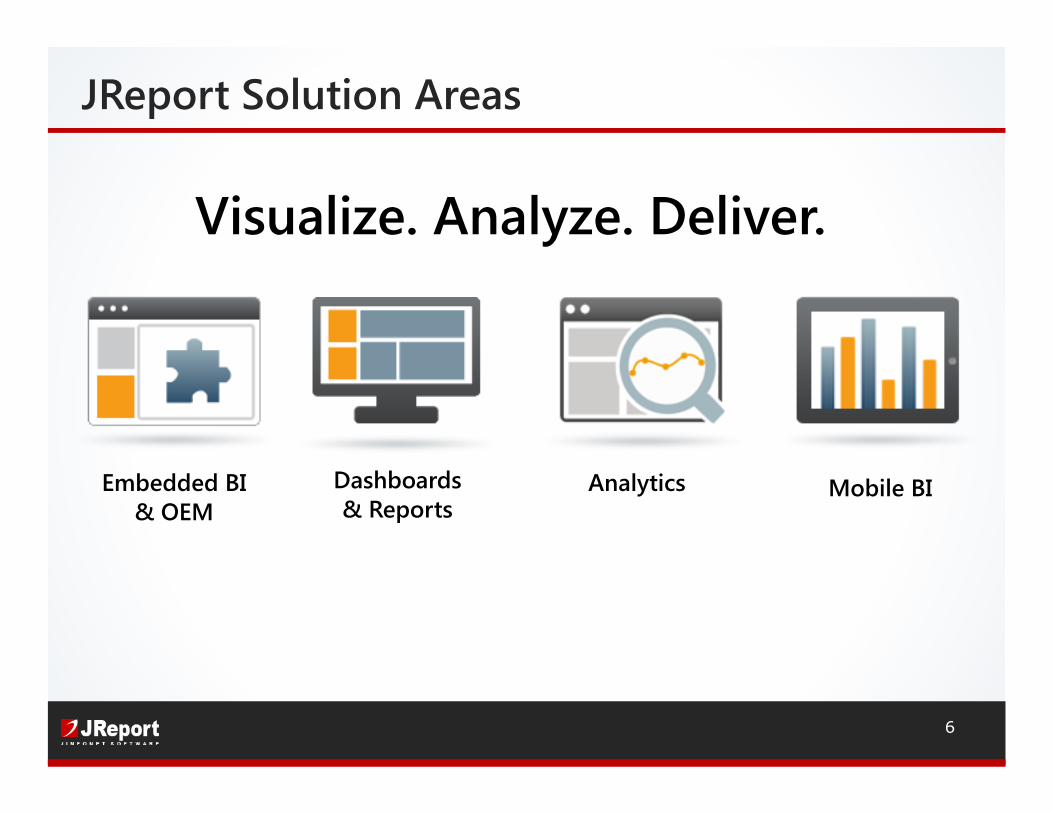
JReport Solution Areas
Embedded BI & OEM
Dashboards & Reports
Analytics Mobile BI
Visualize. Analyze. Deliver.
6
ACME Financials
Company News
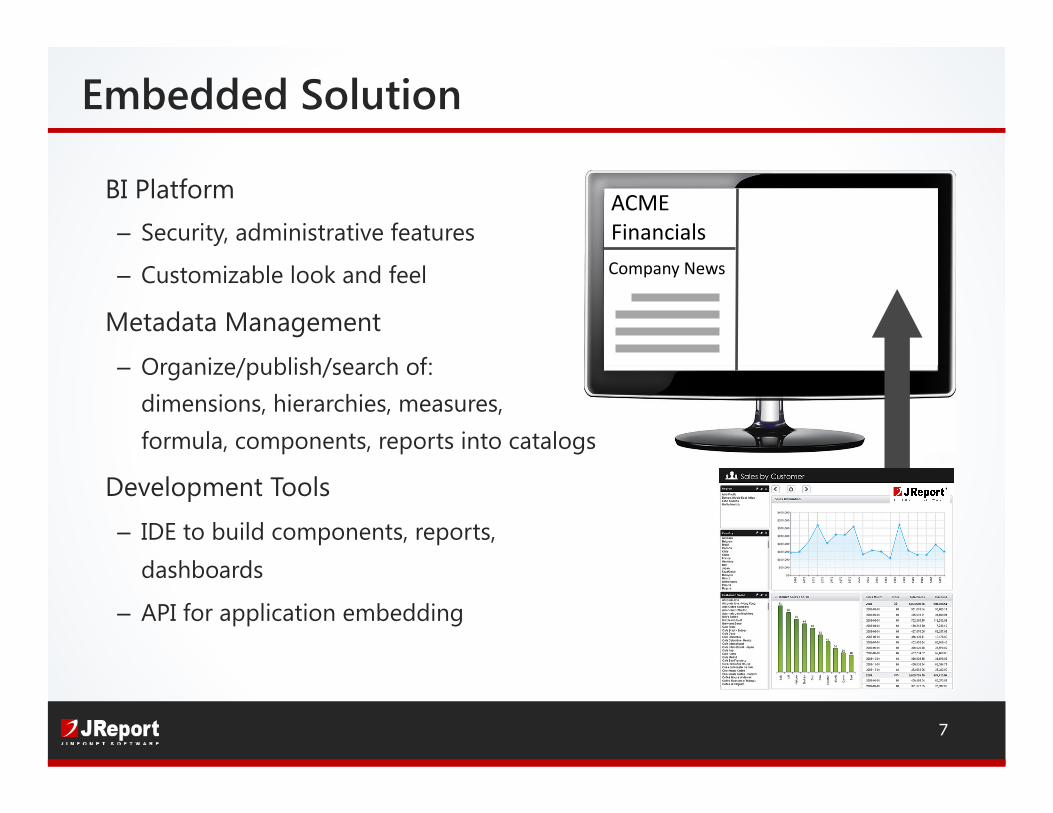
BI Platform – Security, administrative features
– Customizable look and feel
Metadata Management
– Organize/publish/search of: dimensions, hierarchies, measures, formula, components, reports into catalogs
Development Tools
– IDE to build components, reports, dashboards
– API for application embedding
7
Embedded Solution
8
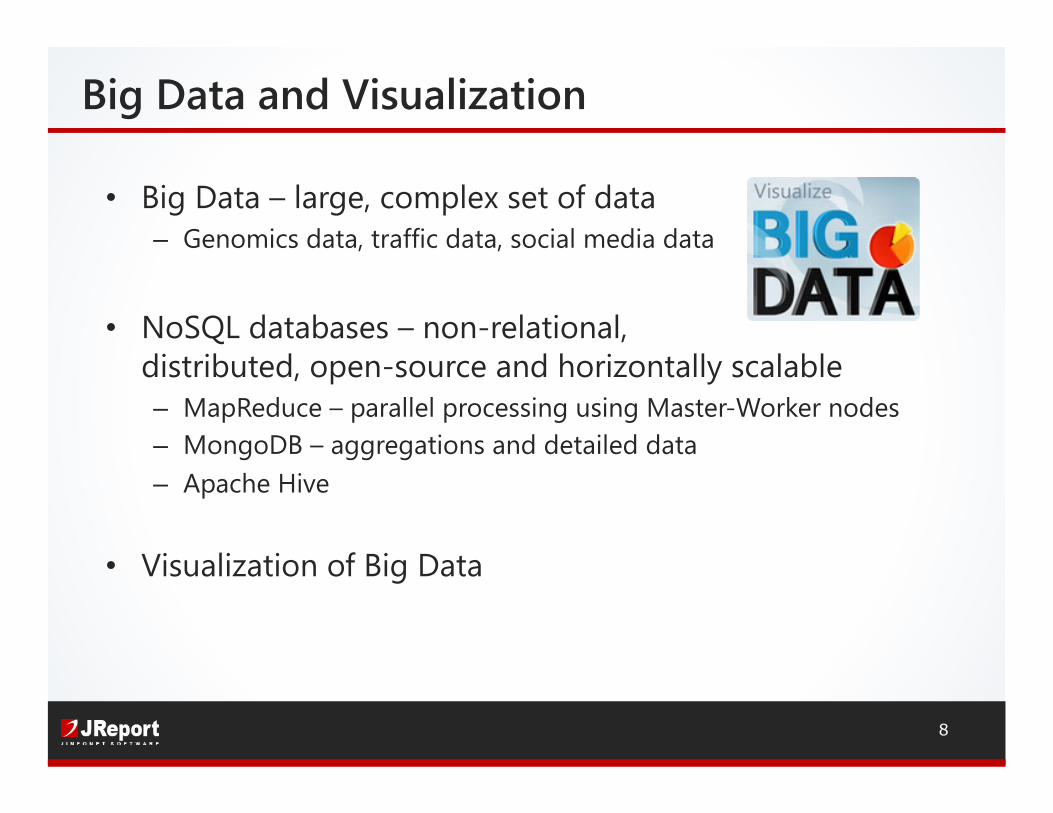
• Big Data – large, complex set of data – Genomics data, traffic data, social media data
• NoSQL databases – non-relational, distributed, open-source and horizontally scalable – MapReduce – parallel processing using Master-Worker nodes – MongoDB – aggregations and detailed data – Apache Hive
• Visualization of Big Data
Big Data and Visualization
9
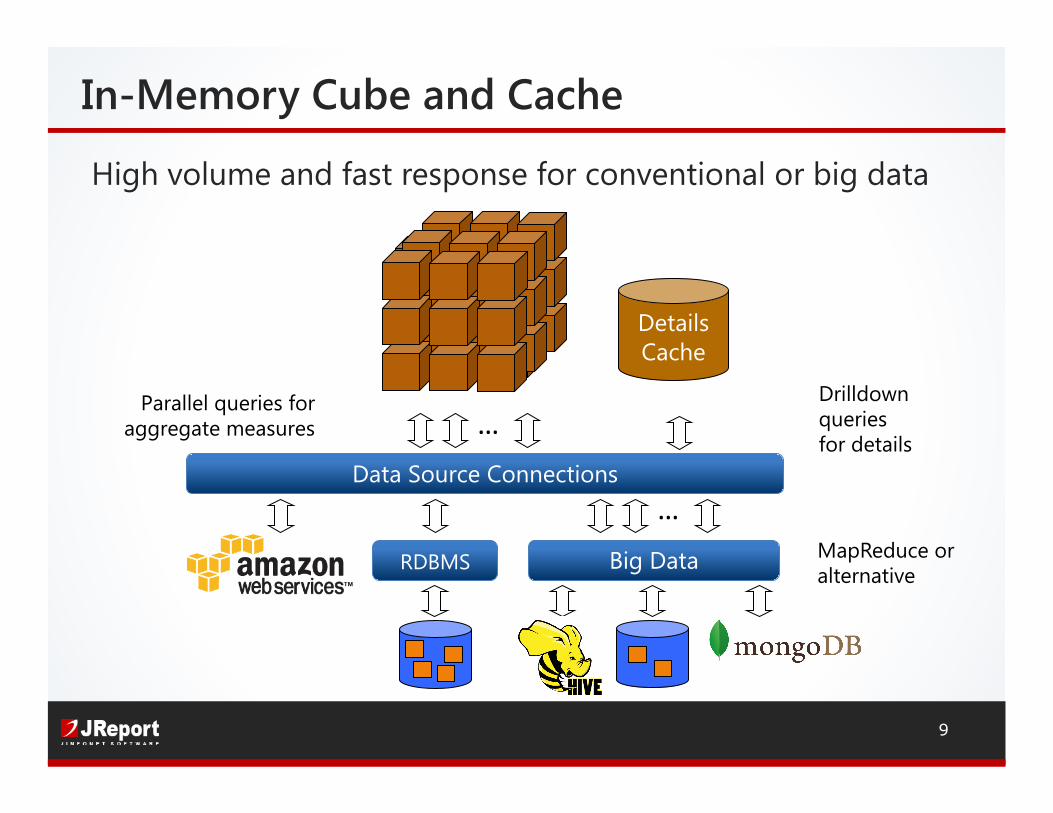
High volume and fast response for conventional or big data
Details Cache
MapReduce or alternative
Drilldown queries for details
…
… Parallel queries for
aggregate measures
Data Source Connections
RDBMS Big Data
In-Memory Cube and Cache
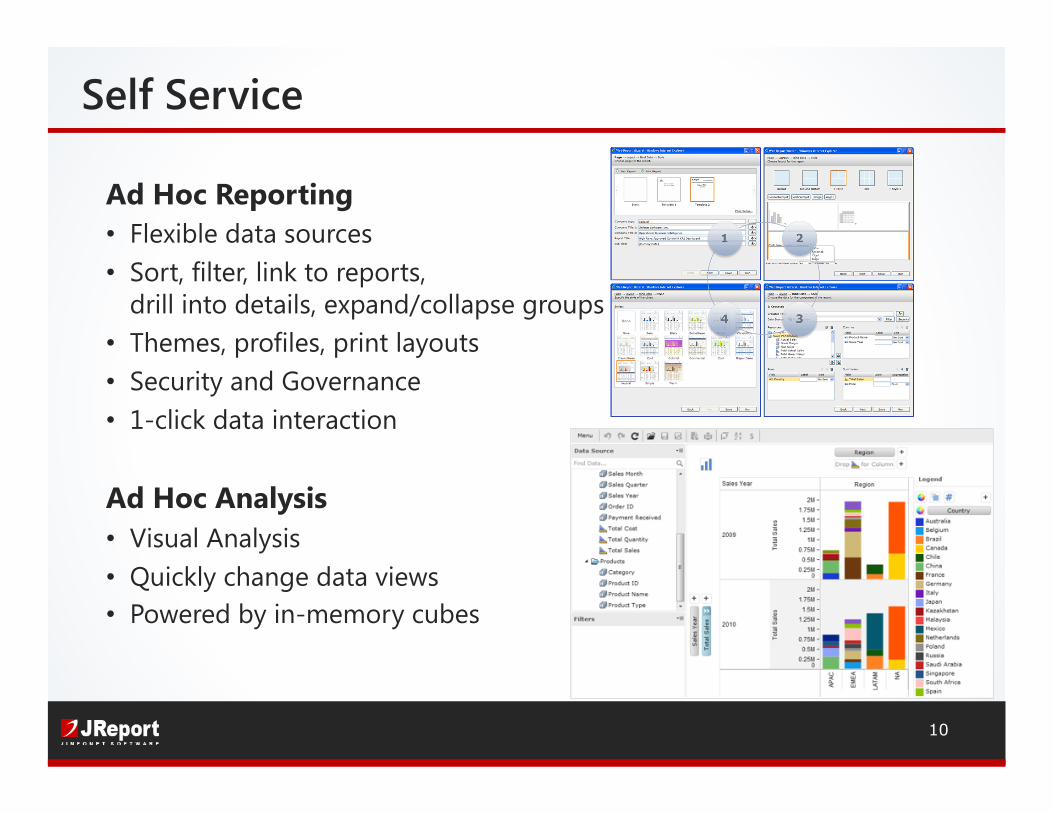
Ad Hoc Reporting • Flexible data sources • Sort, filter, link to reports,
drill into details, expand/collapse groups • Themes, profiles, print layouts • Security and Governance • 1-click data interaction
Ad Hoc Analysis • Visual Analysis • Quickly change data views • Powered by in-memory cubes
10
Self Service
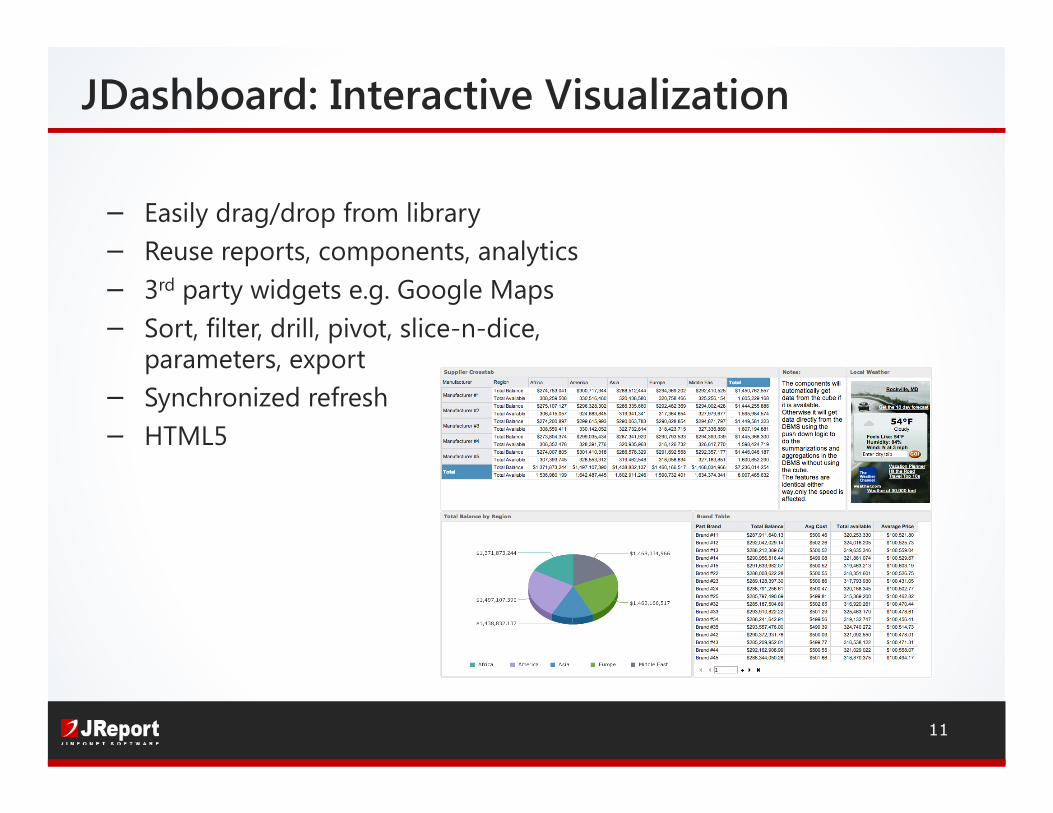
− Easily drag/drop from library − Reuse reports, components, analytics − 3rd party widgets e.g. Google Maps − Sort, filter, drill, pivot, slice-n-dice,
parameters, export − Synchronized refresh − HTML5
11
JDashboard: Interactive Visualization
12
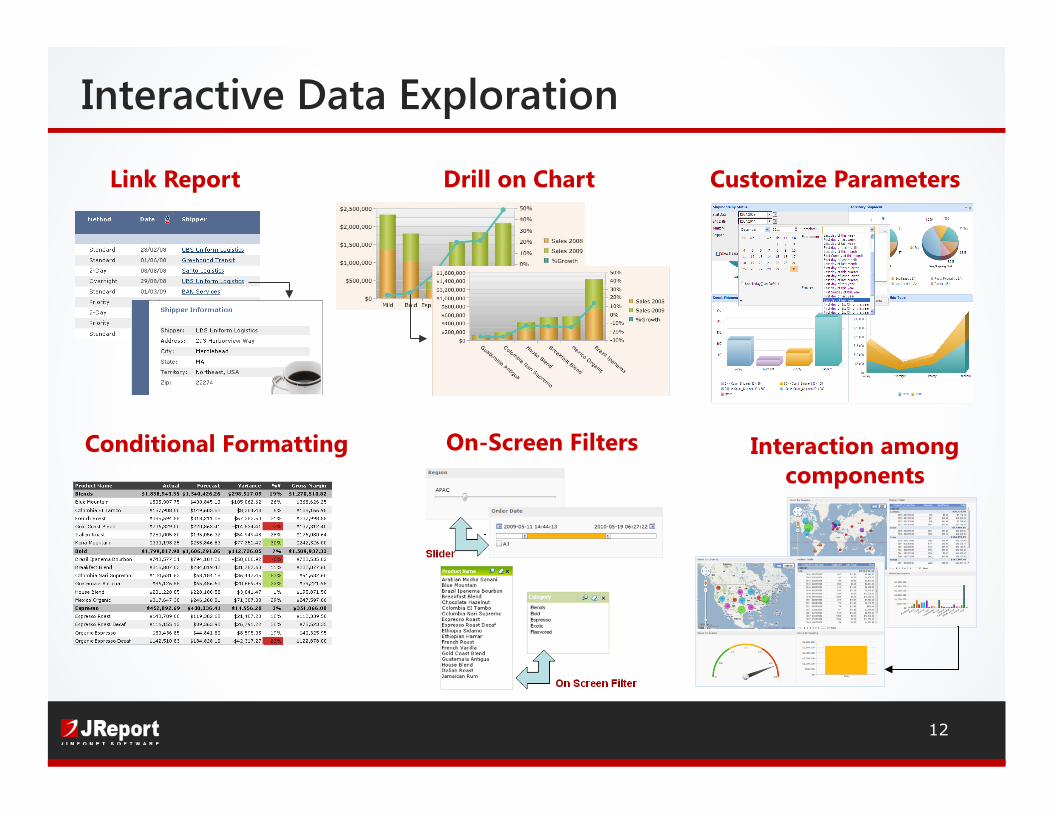
Drill on Chart Link Report Customize Parameters
Conditional Formatting On-Screen Filters Interaction among components
Interactive Data Exploration
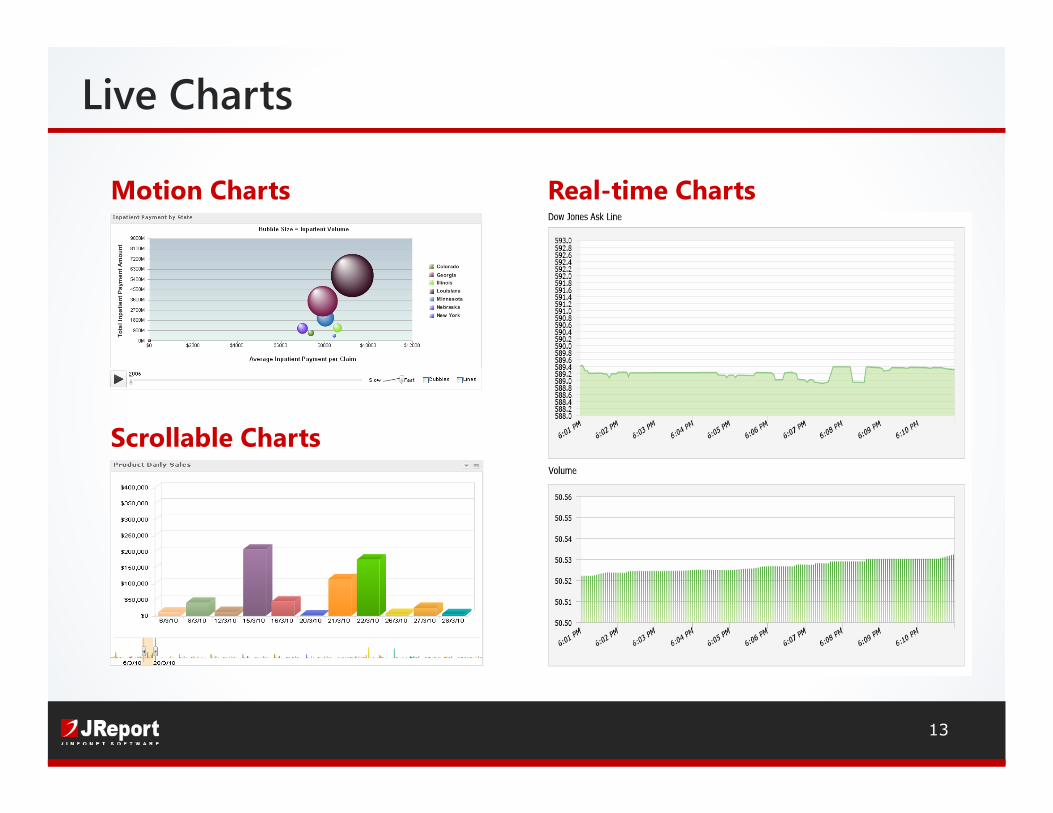
Motion Charts
Scrollable Charts
Real-time Charts
13
Live Charts
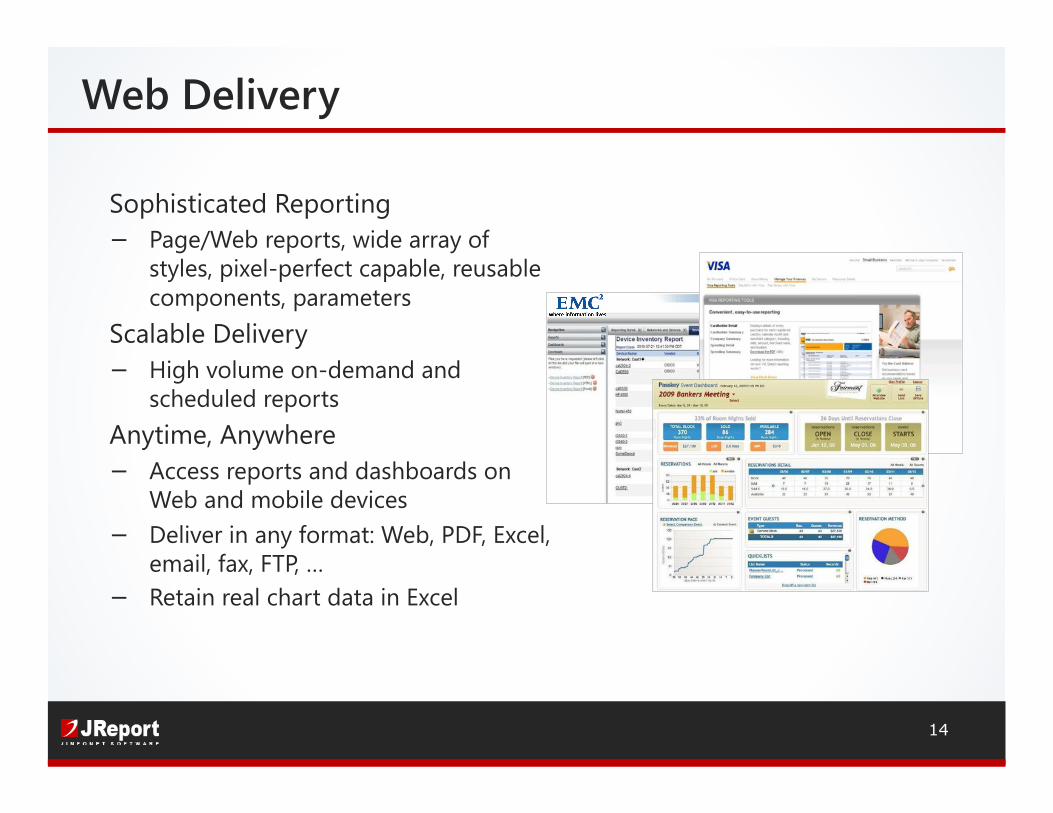
Sophisticated Reporting − Page/Web reports, wide array of
styles, pixel-perfect capable, reusable components, parameters
Scalable Delivery − High volume on-demand and
scheduled reports Anytime, Anywhere − Access reports and dashboards on
Web and mobile devices − Deliver in any format: Web, PDF, Excel,
email, fax, FTP, … − Retain real chart data in Excel
14
Web Delivery
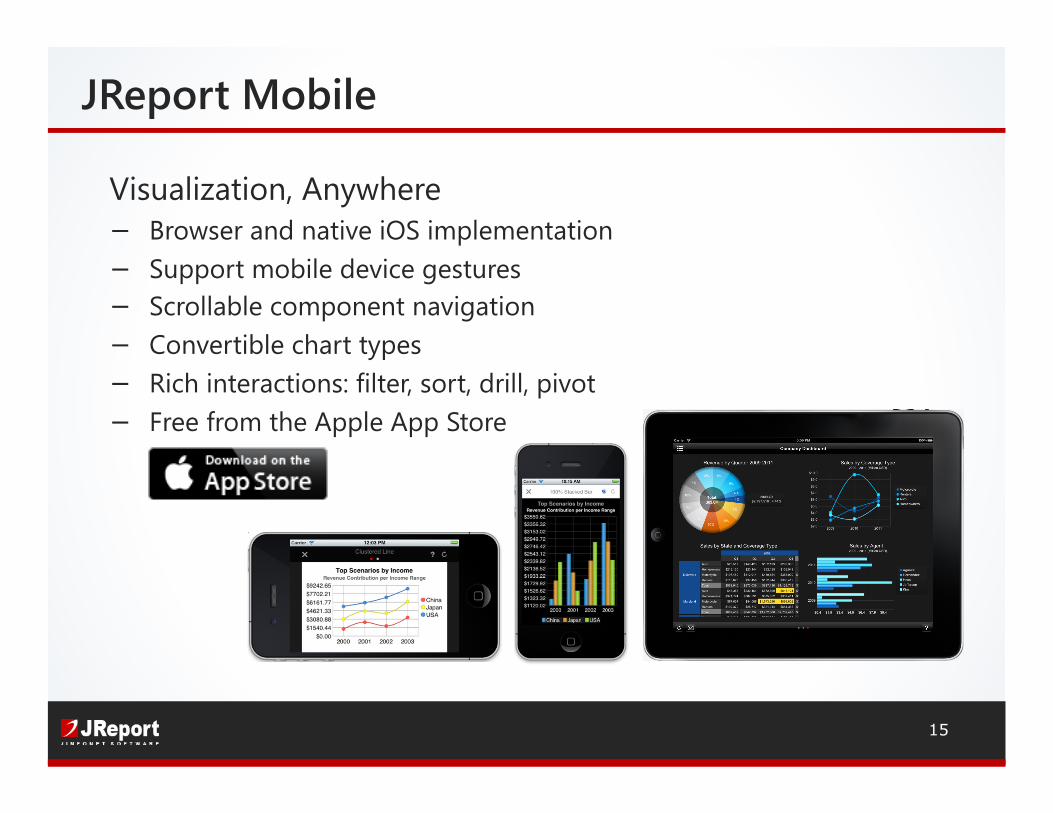
Visualization, Anywhere − Browser and native iOS implementation − Support mobile device gestures − Scrollable component navigation − Convertible chart types − Rich interactions: filter, sort, drill, pivot − Free from the Apple App Store
15
JReport Mobile
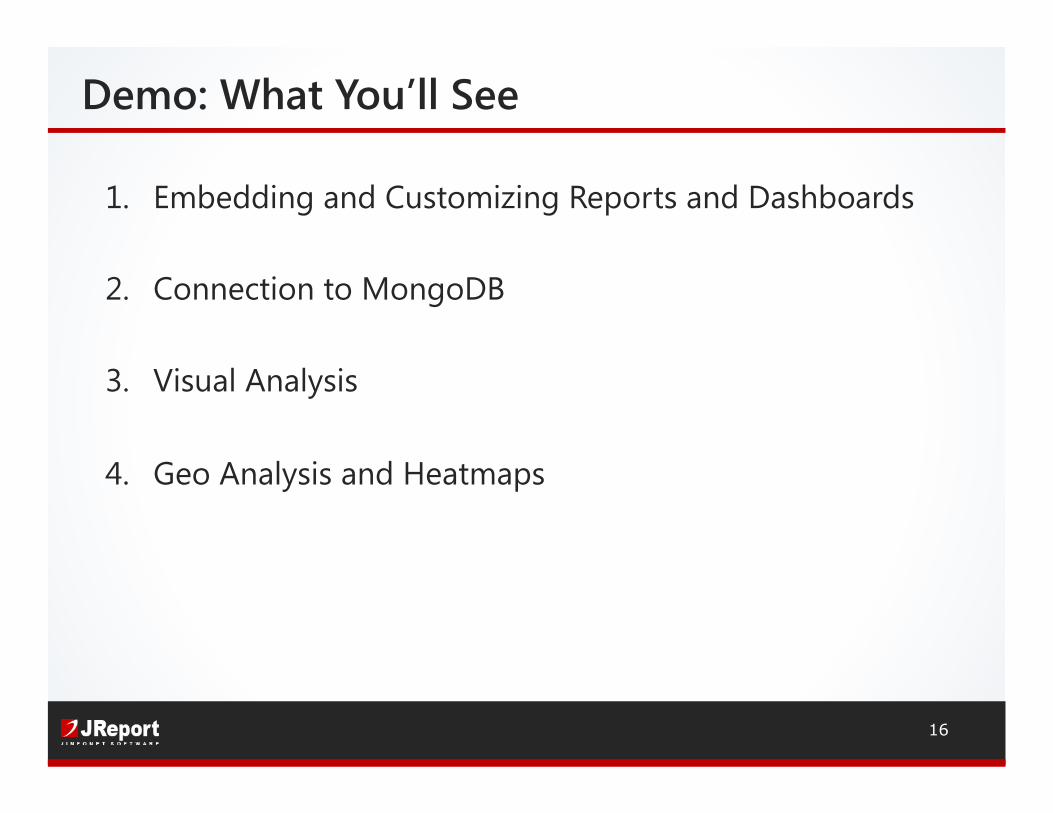
Demo: What You’ll See
16
1. Embedding and Customizing Reports and Dashboards
2. Connection to MongoDB
3. Visual Analysis
4. Geo Analysis and Heatmaps
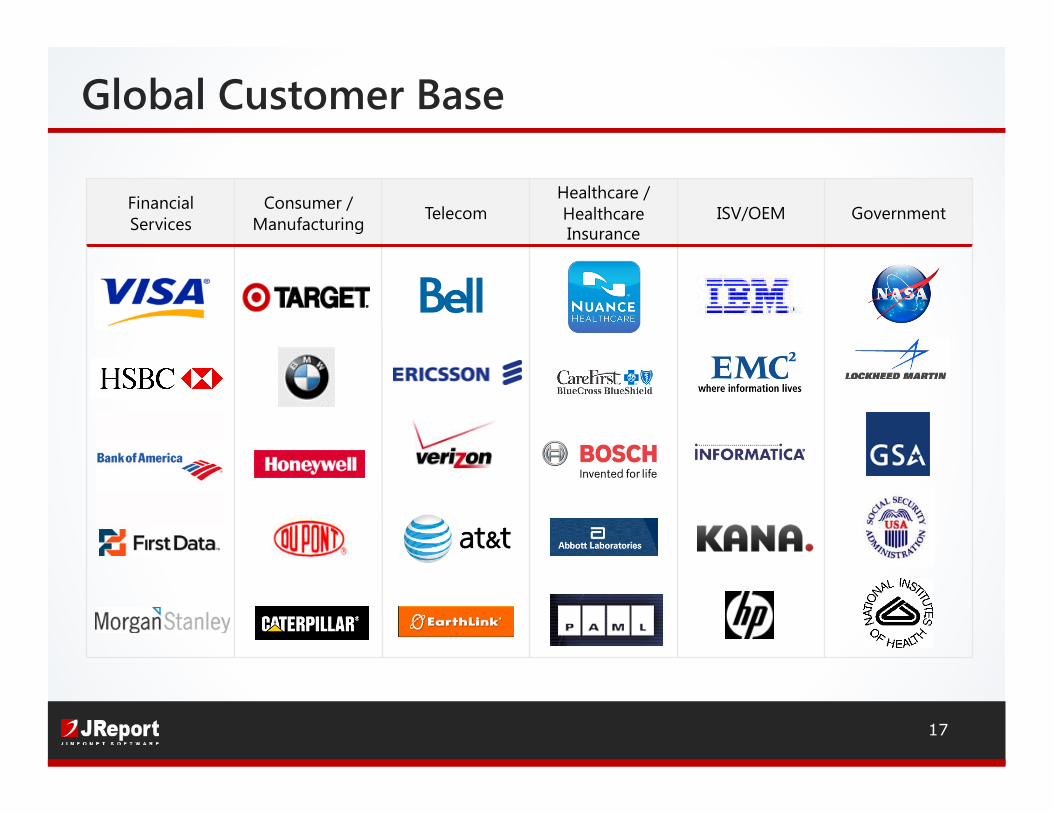
Government ISV/OEM Healthcare / Healthcare Insurance
Telecom Consumer / Manufacturing
Financial Services
Global Customer Base
17
18
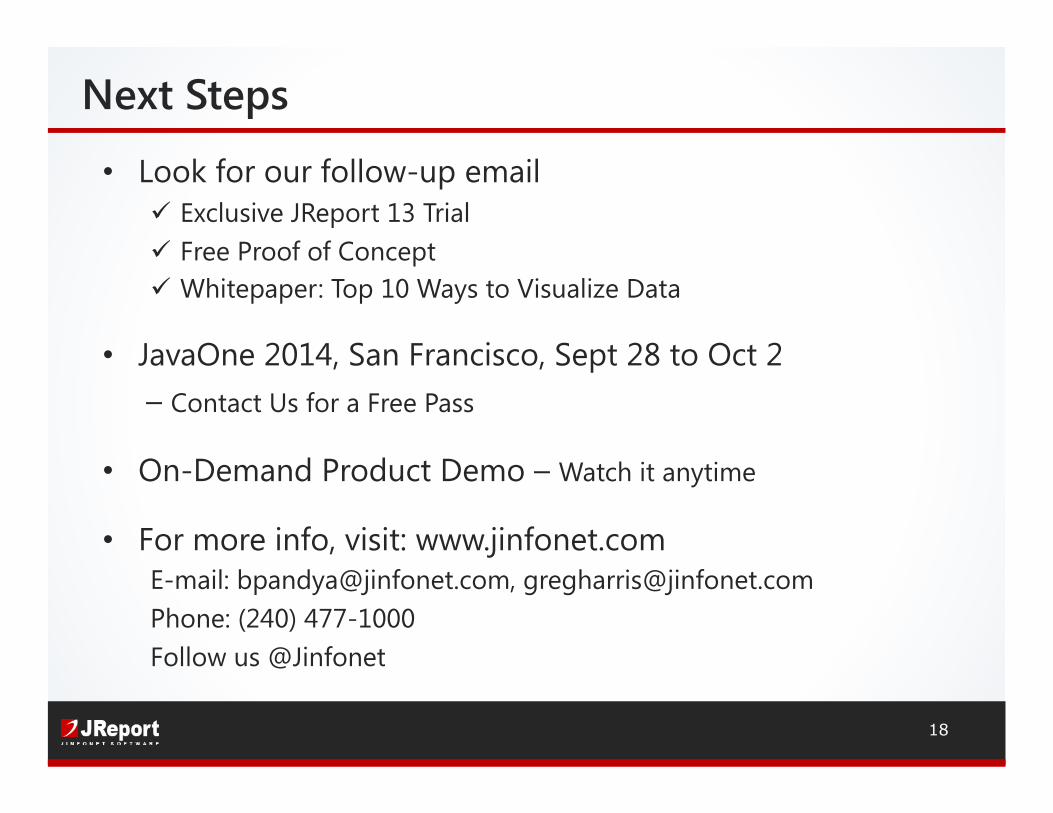
• Look for our follow-up email ! Exclusive JReport 13 Trial ! Free Proof of Concept ! Whitepaper: Top 10 Ways to Visualize Data
• JavaOne 2014, San Francisco, Sept 28 to Oct 2 – Contact Us for a Free Pass
• On-Demand Product Demo – Watch it anytime
• For more info, visit: www.jinfonet.com E-mail: [email protected], [email protected] Phone: (240) 477-1000 Follow us @Jinfonet
Next Steps