elizabeth brown, arely velazquez, and dylan brown rational functions
TRANSCRIPT
Elizabeth Brown, Arely Velazquez, and Dylan Brown
RATIONAL FUNCTIONS
RATIONAL FUNCTIONS
• A rational function is formed when a polynomial is divided by another polynomial
-From this kind of function you can find domain and range, end behavior, vertical, horizontal, and slant asymptotes, zeros (x-intercepts), and y-intercepts
*ex: F(x)=x
DOMAIN AND RANGE
• The domain of a function is the set of all possible x values which will make the function “work” and will output real y-values (most of the time this is written in interval notation)
• To find the domain of a rational function, set the denominator equal to 0 and solve for the variable, that answer will not give you an output, so it is not part of the domain
F(x)=1/2x-5 2x-5=0 x=5/2
(-infinity,5/2)U(5/2,+infinity)
• Once you graph the function, then you can find the range (this is also written in interval notation most of the time)
END BEHAVIOR
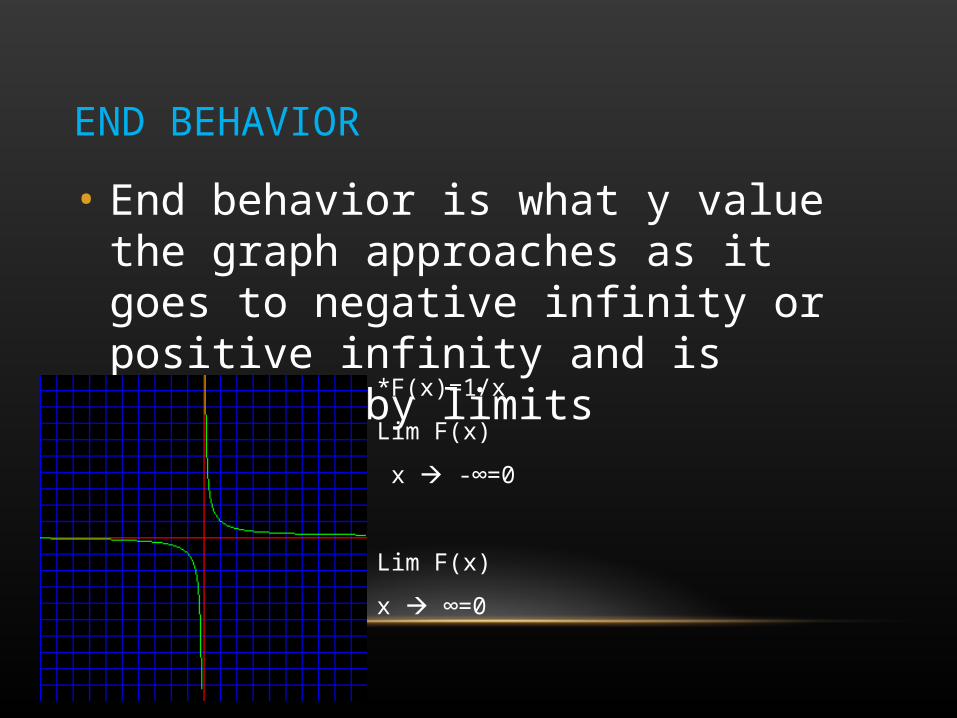
• End behavior is what y value the graph approaches as it goes to negative infinity or positive infinity and is described by limits
*F(x)=1/x
Lim F(x)
x -∞=0
Lim F(x)
x ∞=0
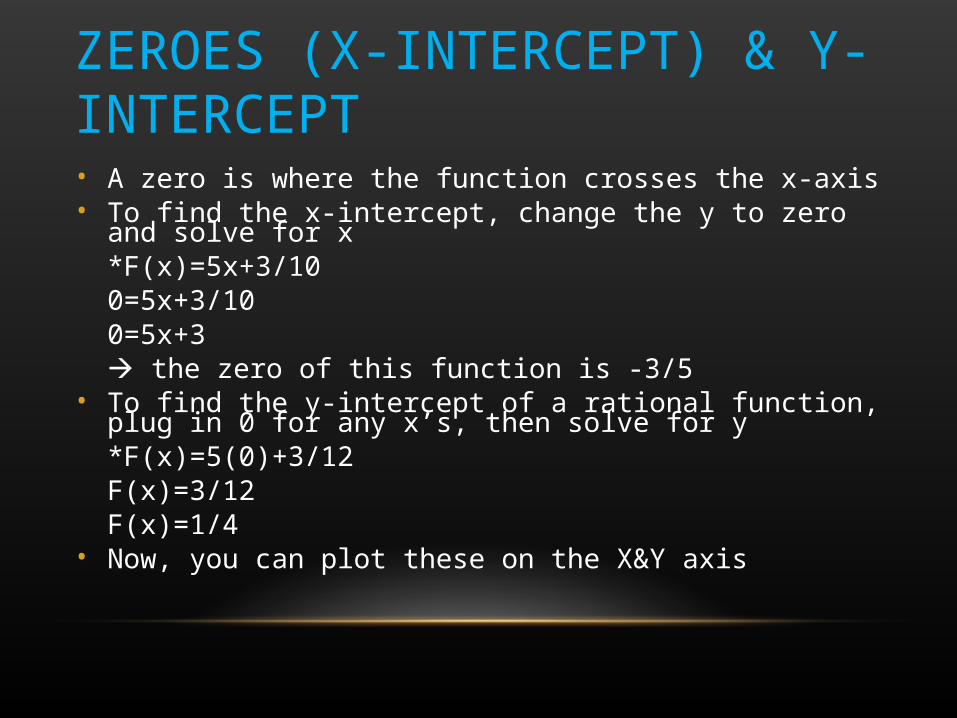
ZEROES (X-INTERCEPT) & Y-INTERCEPT• A zero is where the function crosses the x-axis• To find the x-intercept, change the y to zero and solve for x
*F(x)=5x+3/100=5x+3/100=5x+3 the zero of this function is -3/5
• To find the y-intercept of a rational function, plug in 0 for any x’s, then solve for y*F(x)=5(0)+3/12F(x)=3/12F(x)=1/4
• Now, you can plot these on the X&Y axis
VERTICAL ASYMPTOTES
• A vertical asymptote happens where the zeros occur in the function-this would happen when the denominator equals zero because you cannot divide by zero
• To find the VA, set the bottom equal to zero, and those numbers will be where an asymptote occurs because you can’t divide by 0!
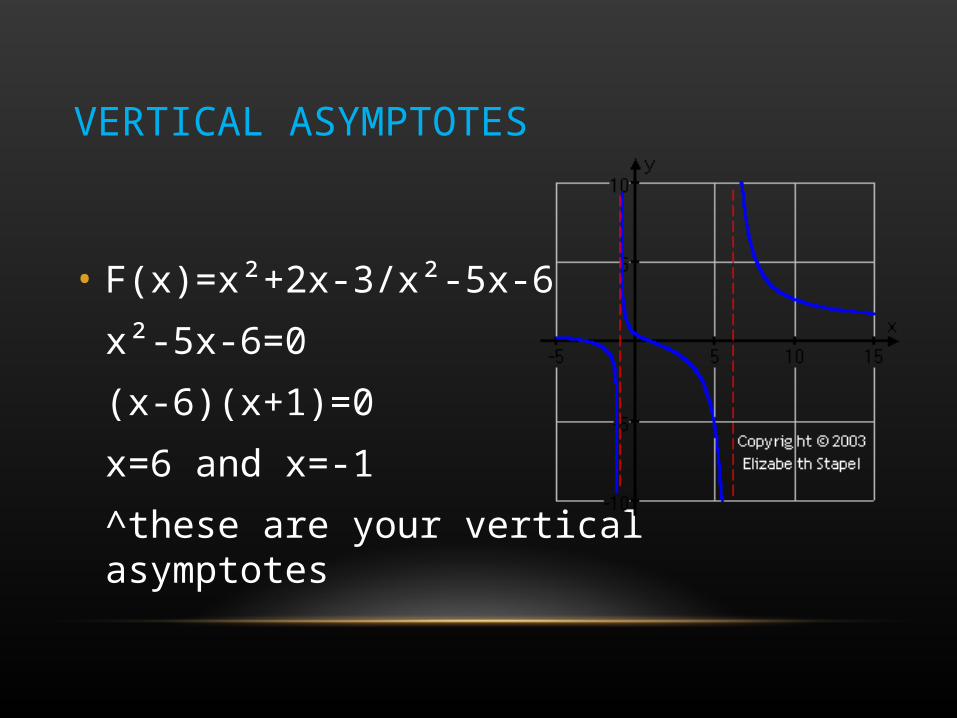
VERTICAL ASYMPTOTES
• F(x)=x²+2x-3/x²-5x-6
x²-5x-6=0
(x-6)(x+1)=0
x=6 and x=-1
^these are your vertical asymptotes
HORIZONTAL ASYMPTOTES (HA)
• HOBO- if the exponent is higher in the denominator, then the HA is 0
• HOT- if the exponent is higher on the top, then there is no HA
• If the exponents are equal, then ratio of the leading terms is the HA
HORIZONTAL ASYMPTOTES
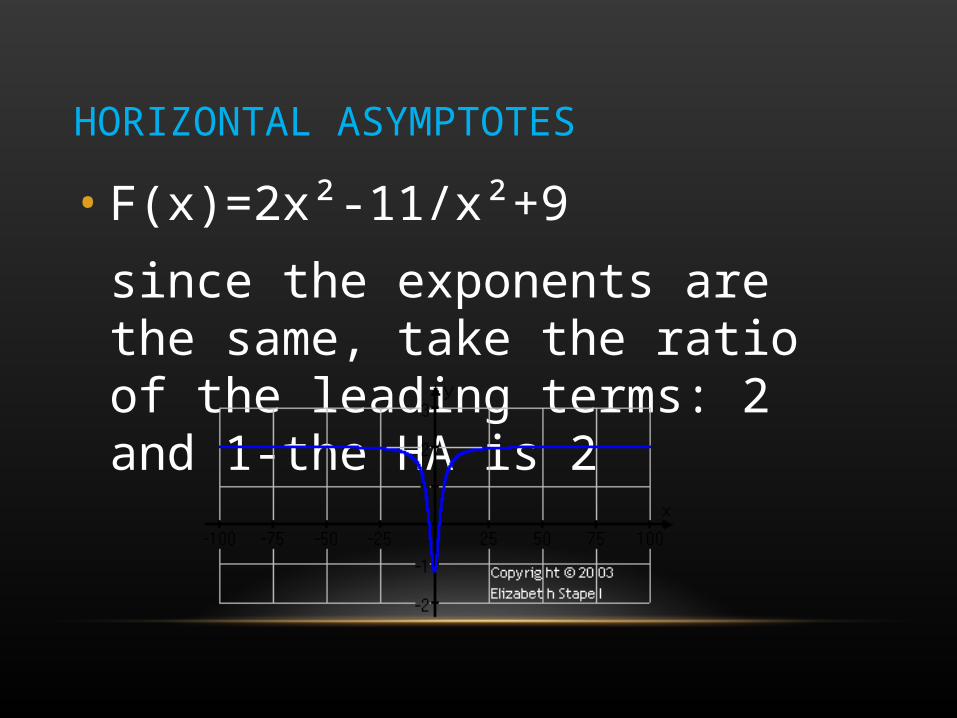
• F(x)=2x²-11/x²+9
since the exponents are the same, take the ratio of the leading terms: 2 and 1-the HA is 2
SLANT ASYMPTOTES
• If there is no HA, then there is a slant asymptote (end behavior asymptote)
• To find this, divide the numerator by the denominator and that equation is the slant asymptote
SLANT ASYMPTOTES
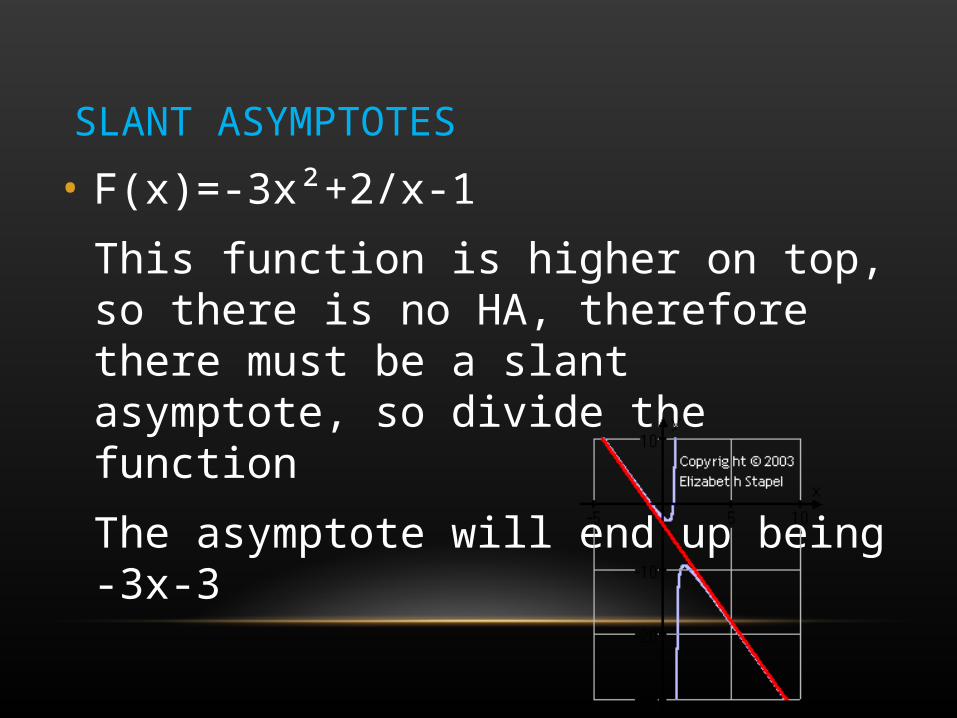
• F(x)=-3x²+2/x-1
This function is higher on top, so there is no HA, therefore there must be a slant asymptote, so divide the function
The asymptote will end up being -3x-3
TABLE OF SIGNS
• Another name for the table of signs is a number line analysis
• Once you have found the zeros and the vertical asymptotes of the function, you can do this analysis to figure out where it will be positive and negative
• F(x)=x²+4x+4/x²-4x-intercept: (-2,0) VA: x=2y-intercept: (0,-1) HA: y=1
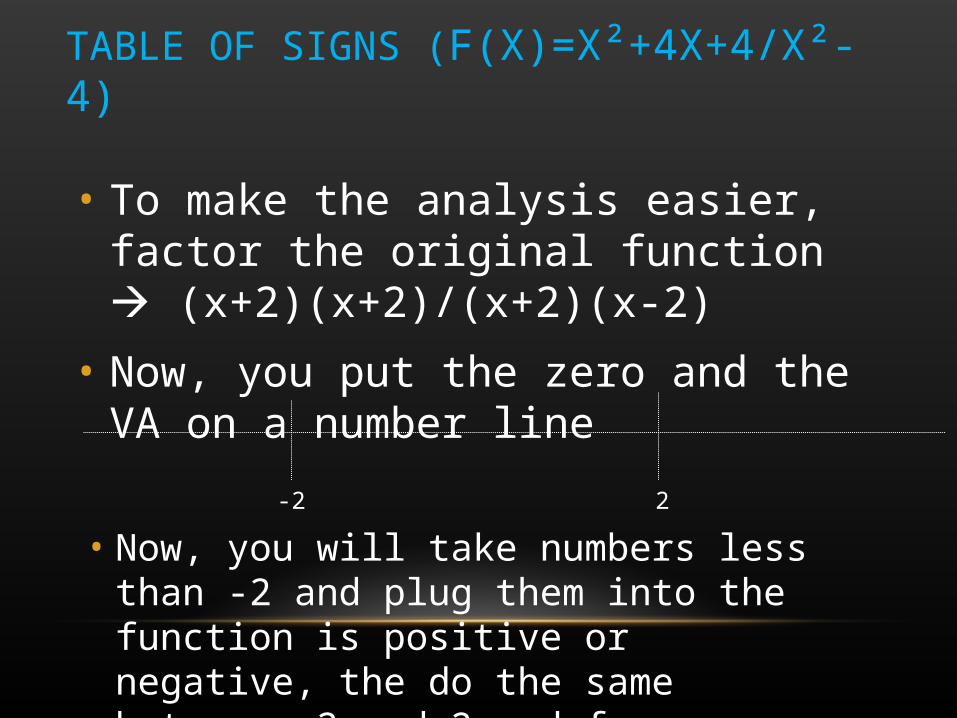
TABLE OF SIGNS (F(X)=X²+4X+4/X²-4)
• To make the analysis easier, factor the original function (x+2)(x+2)/(x+2)(x-2)
• Now, you put the zero and the VA on a number line
-2 2
• Now, you will take numbers less than -2 and plug them into the function is positive or negative, the do the same between -2 and 2 and for numbers greater than 2
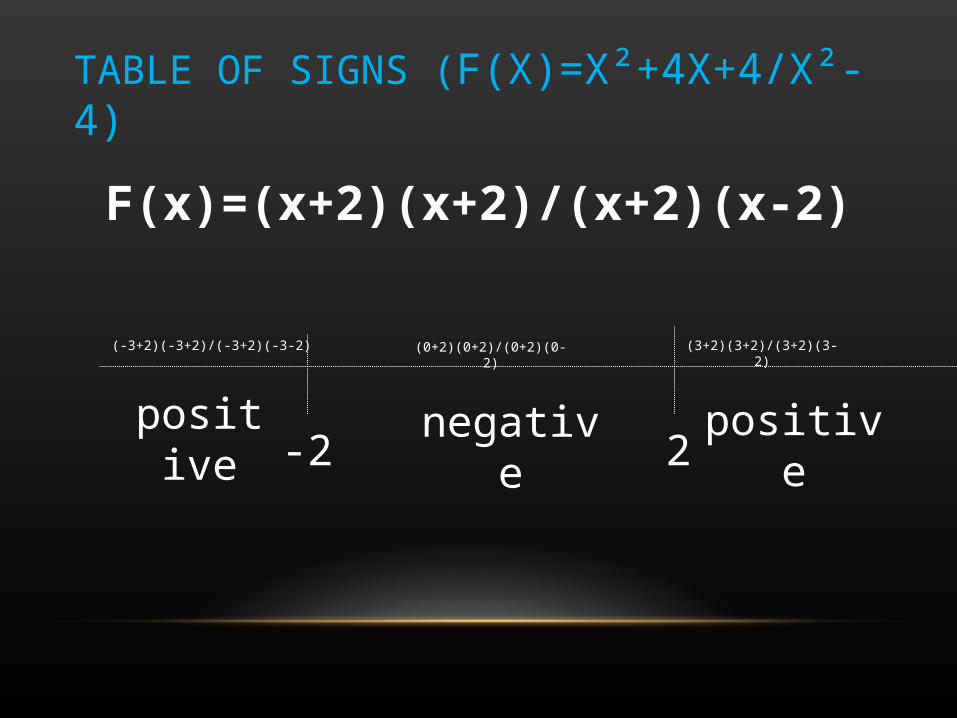
TABLE OF SIGNS (F(X)=X²+4X+4/X²-4)
F(x)=(x+2)(x+2)/(x+2)(x-2)
-2 2
(-3+2)(-3+2)/(-3+2)(-3-2) (0+2)(0+2)/(0+2)(0-2) (3+2)(3+2)/(3+2)(3-2)
positive positivenegative
TABLE OF SIGNS (F(X)=X²+4X+4/X²-4)
• So, now you know that from -∞ to -2 the function is positive; from the x-intercept at -2 to the VA at 2 the function will be negative; from the VA to ∞ the function will be positive
• To help yourself out even more in the graphing process, you can make a table with other X and Y values to guide the graph
X AND Y VALUE TABLE (F(X)=X²+4X+4/X²-4)
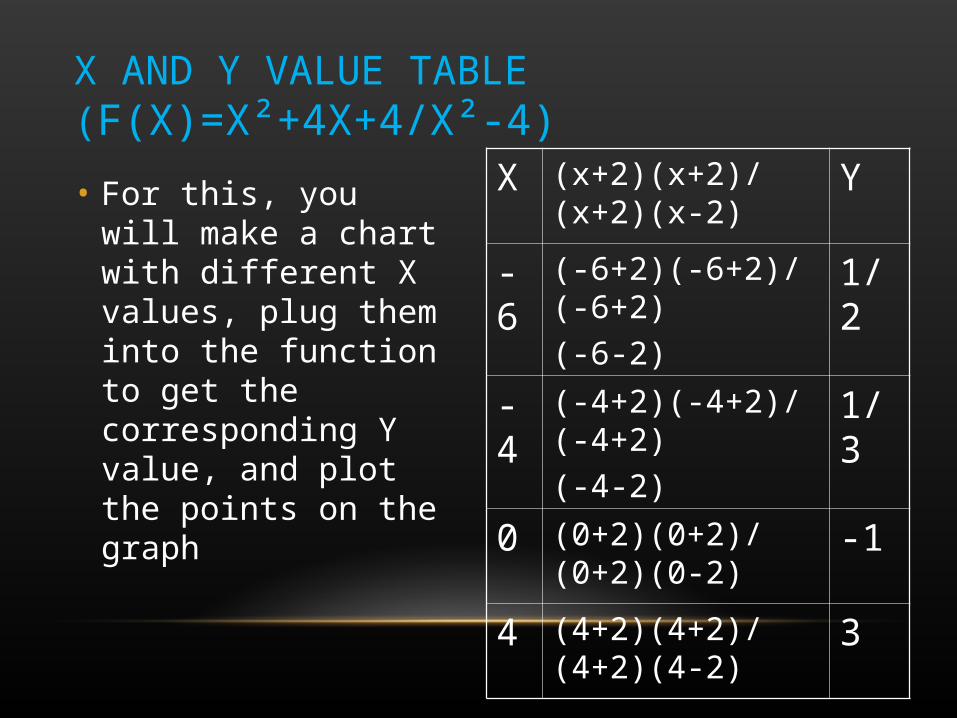
• For this, you will make a chart with different X values, plug them into the function to get the corresponding Y value, and plot the points on the graph
X (x+2)(x+2)/(x+2)(x-2)
Y
-6 (-6+2)(-6+2)/(-6+2)
(-6-2)1/2
-4 (-4+2)(-4+2)/(-4+2)
(-4-2)1/3
0 (0+2)(0+2)/(0+2)(0-2)
-1
4 (4+2)(4+2)/(4+2)(4-2)
3
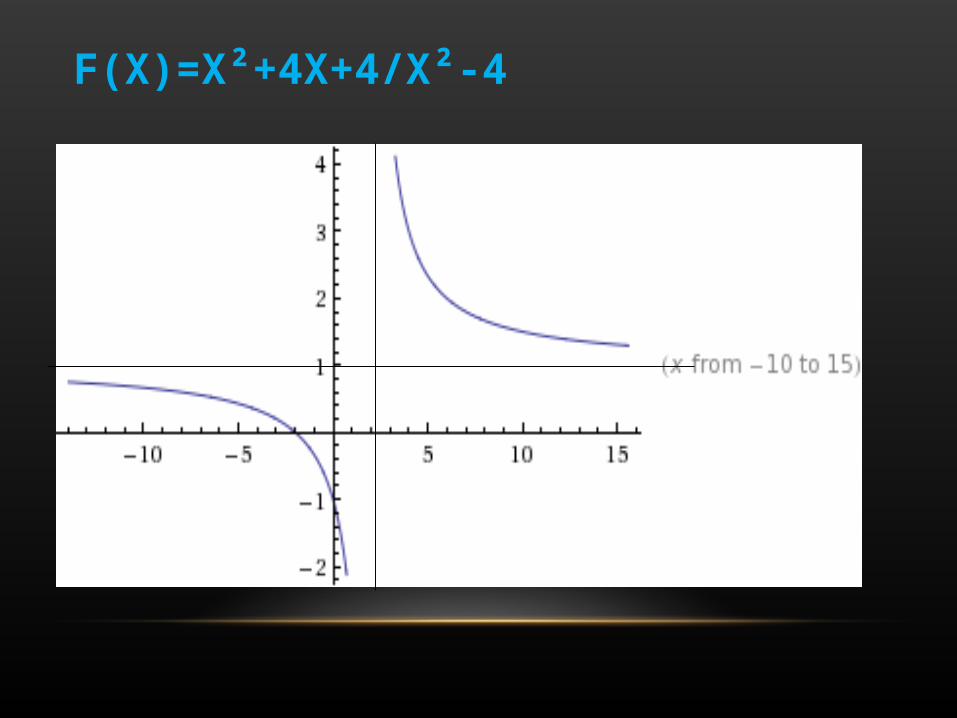
F(X)=X²+4X+4/X²-4
GRAPHING
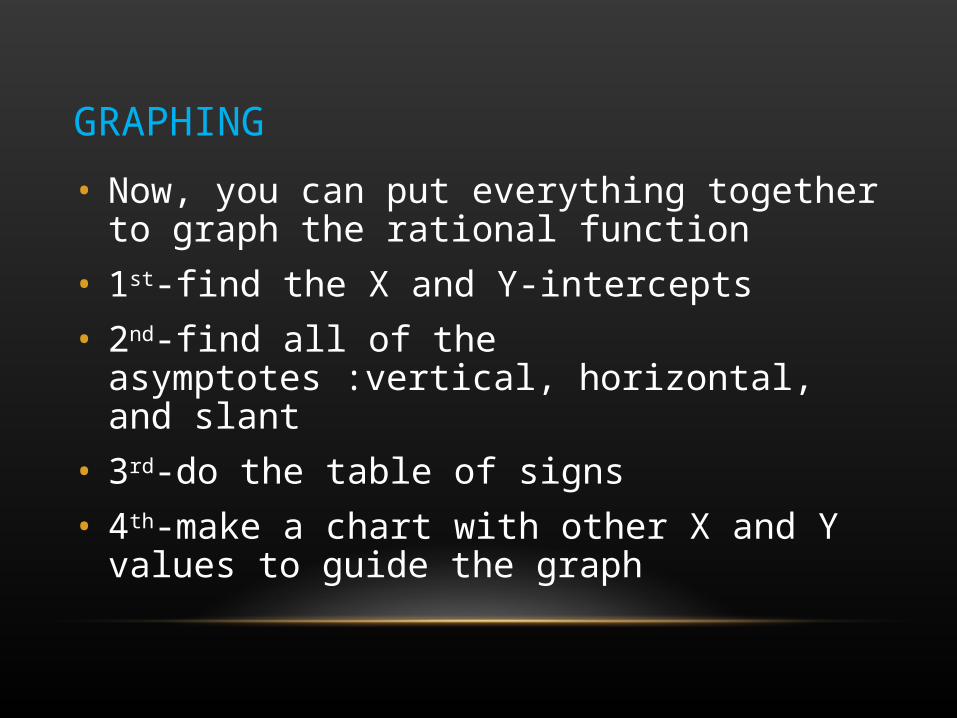
• Now, you can put everything together to graph the rational function
• 1st-find the X and Y-intercepts• 2nd-find all of the asymptotes :vertical, horizontal, and
slant• 3rd-do the table of signs• 4th-make a chart with other X and Y values to guide the
graph
RATIONAL INEQUALITIES
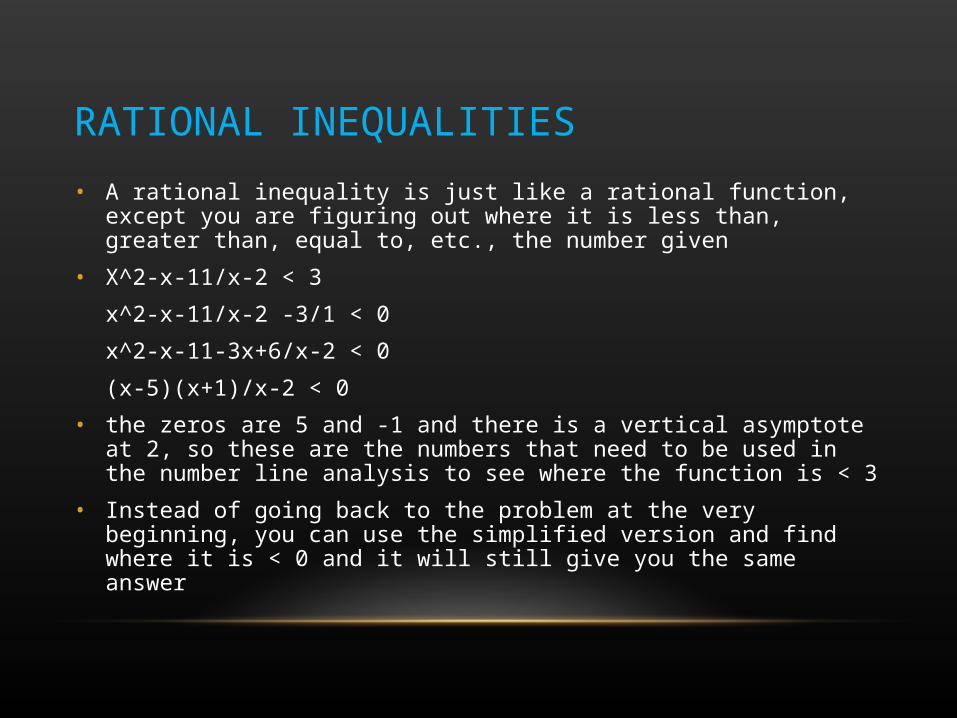
• A rational inequality is just like a rational function, except you are figuring out where it is less than, greater than, equal to, etc., the number given
• X^2-x-11/x-2 < 3
x^2-x-11/x-2 -3/1 < 0
x^2-x-11-3x+6/x-2 < 0
(x-5)(x+1)/x-2 < 0
• the zeros are 5 and -1 and there is a vertical asymptote at 2, so these are the numbers that need to be used in the number line analysis to see where the function is < 3
• Instead of going back to the problem at the very beginning, you can use the simplified version and find where it is < 0 and it will still give you the same answer
RATIONAL INEQUALITIES
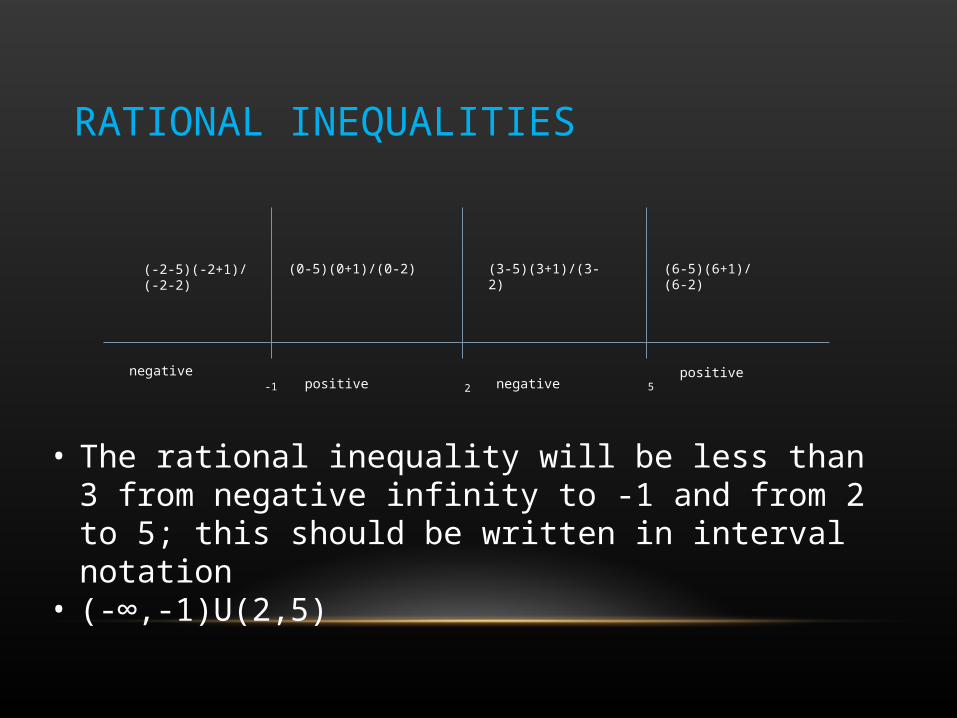
-1 2 5
(-2-5)(-2+1)/(-2-2)
negative
(0-5)(0+1)/(0-2)
positive
(3-5)(3+1)/(3-2)
negative
(6-5)(6+1)/(6-2)
positive
• The rational inequality will be less than 3 from negative infinity to -1 and from 2 to 5; this should be written in interval notation
• (-∞,-1)U(2,5)
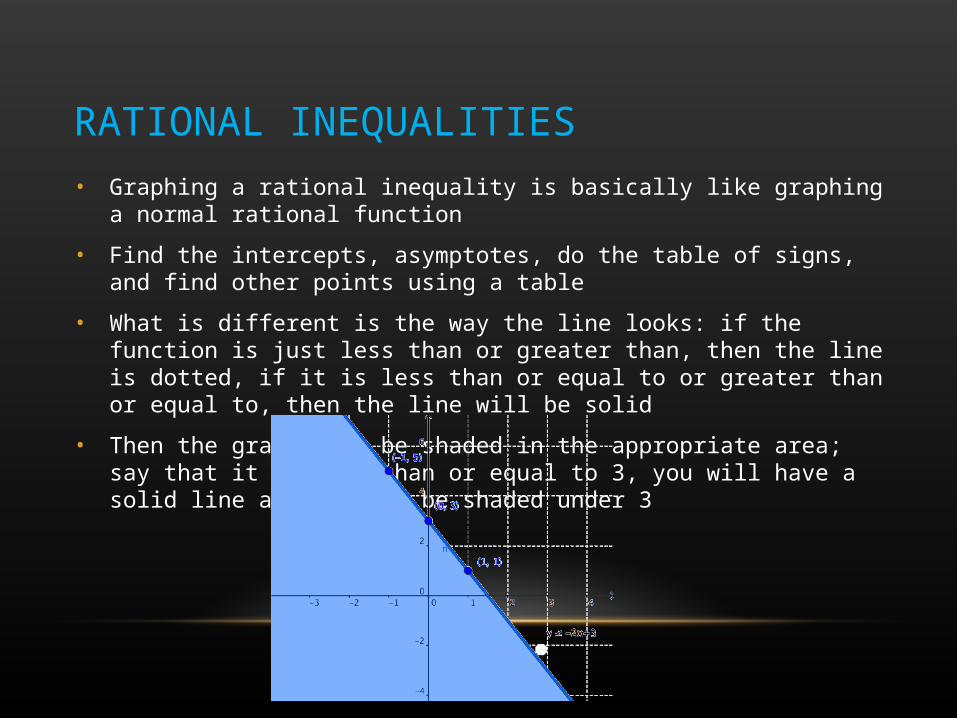
RATIONAL INEQUALITIES• Graphing a rational inequality is basically like graphing a normal rational function
• Find the intercepts, asymptotes, do the table of signs, and find other points using a table
• What is different is the way the line looks: if the function is just less than or greater than, then the line is dotted, if it is less than or equal to or greater than or equal to, then the line will be solid
• Then the graph must be shaded in the appropriate area; say that it is less than or equal to 3, you will have a solid line and it will be shaded under 3
REAL WORLD PROBLEM
• There are many different ways that rational functions are used in the real world-doctors can use them to find the concentration of different drugs in the blood system, they could be used in finances, to find different rates at which things can happen (scientists use them all the time!)
• Say that 4x/.12x²-2.6 will determine the concentration of a certain drug in a patient’s blood stream when the drug is taken each day. Doctors can use this equation to figure out if a dosage needs to be raised or lowered and how it should be helping the patient.
REAL WORLD PROBLEM
• Now, with this graph, doctors can monitor patients and figure out what dosage of certain medicines need to be taken and what might be too much. With this equation you can still find X and Y intercepts, asymptotes, end behavior, and do a number line analysis.
REAL WORLD PROBLEM• X-intercept: (0,0)
• Y-intercept: (0,0)
• Domain: (-∞,-4.6)U(-4.6,4.6)U(4.6,∞)
• Range: (-∞,∞)
• Vertical Asymptotes: x=-4.6 and x=4.6
• Horizontal Asymptote: y=1
• End Behavior: lim F(x)
x -∞ = -1
lim F(x)
x ∞ = 1
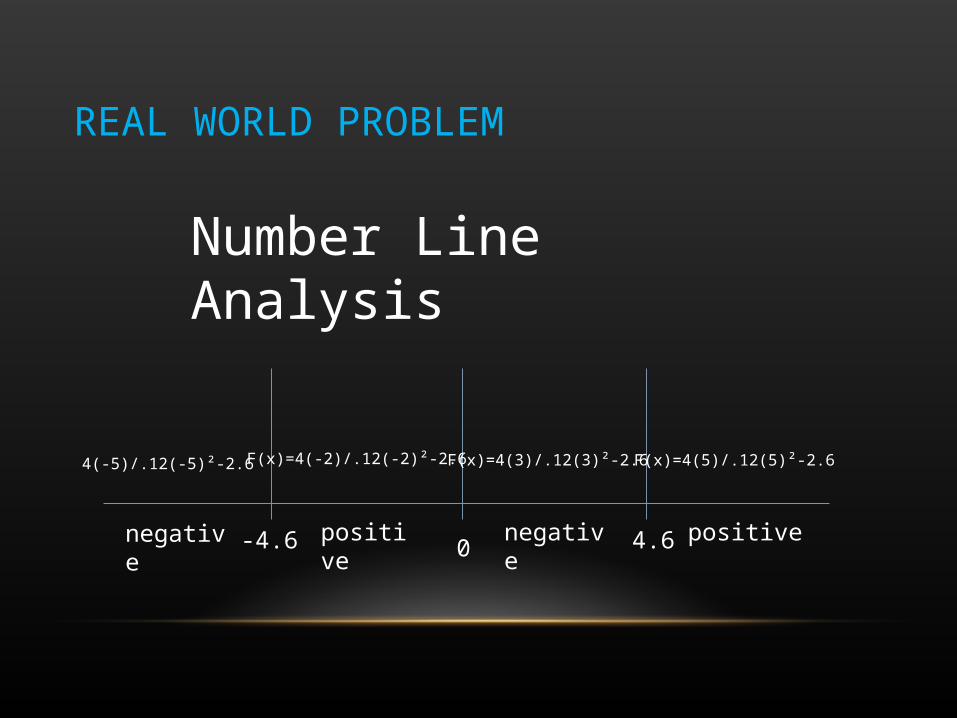
REAL WORLD PROBLEM
-4.6 0 4.6
4(-5)/.12(-5)²-2.6 F(x)=4(-2)/.12(-2)²-2.6 F(x)=4(3)/.12(3)²-2.6 F(x)=4(5)/.12(5)²-2.6
negative negativepositive positive
Number Line Analysis
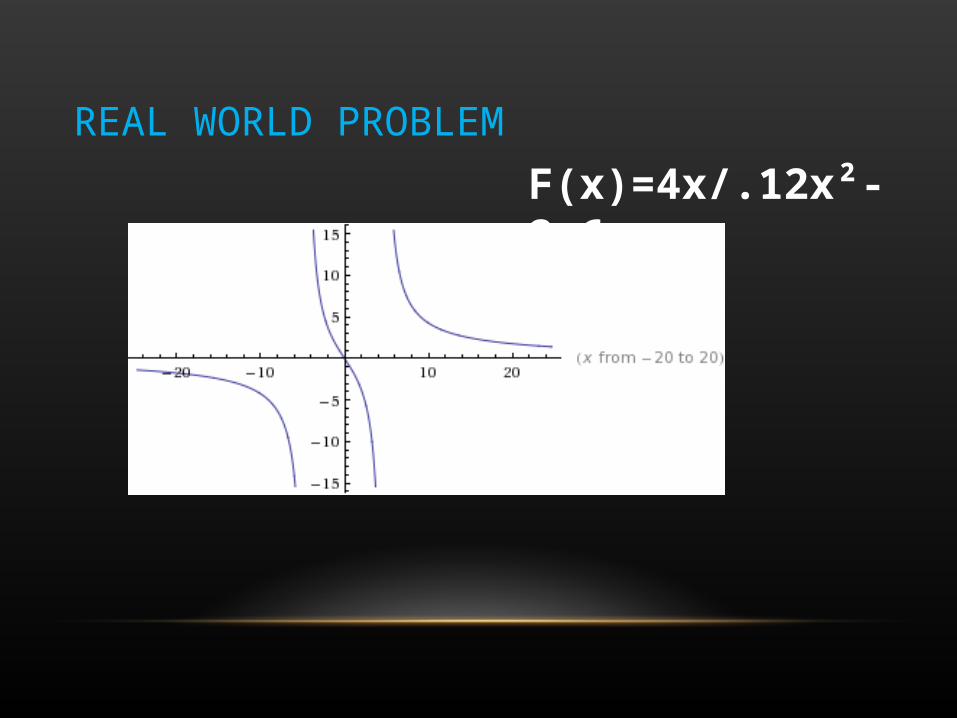
REAL WORLD PROBLEM
F(x)=4x/.12x²-2.6