elixir and phoenix performance - cogini · elixir and phoenix performance elixir taiwan meetup june...
TRANSCRIPT
Agenda
● Architecture● Logging● Metrics● Performance Tuning
Architecture
"We do not have ONE web-server handling 2 millions sessions. We have 2 million webservers handling one session each." - Joe Armstrong
There is no magic:● Find the real system bottlenecks: disk and network I/O, CPU,
RAM● Trade thing you have more of for thing that you do not, e.g.
memory cache for db
Architecture
● Anything shared is a bottleneck● GenServer is a code smell● Shared nothing is the best● "Logical" three tier: libraries for different parts of your app, not
processes● Database is usually the ultimate bottleneck● Lock contention inside the database limits number of
simultaneous requests
ETS is Your Friend
● Elixir data is immutable, ETS is the mechanism for mutability● Typically 1 microsecond to read or write● Useful for caching immutable data● https://dockyard.com/blog/2017/05/19/optimizing-elixir-and-pho
enix-with-ets
Case study: geoip lookups
● Figure out which country IP address is in● 65 MB data file● Started with gen_server, hit bottleneck● Switched to pool of gen_servers, hit bottleneck● Put it in ETS
– Query time now 5 μs, worst case– Added second level "result cache" at 1 μs
● Binary data is shared out of process
Logging is not free
● Can be the most resource intensive thing your app does● Disk I/O and CPU● Serializing your application through the log file, e.g. via a
GenEvent server● Have to store and move logs around● Someone has to look at them = log blindness
Logging is not free
● Processes send messages to the GenServer (GenEvent)● When the GenServer mailbox fills up, your application dies● Erlang disk_log FTW● Separate optimized disk writing process● 100K log records per second● Whatever problem you have, Ericsson had it 20 years ago at
BT

Better Logging
● Targeted logging, e.g. just requests and responses, everything else you can recreate
● Log only when there is a failure● Erlang error logging gives you everything needed to replicate
a problem● Only log actionable information
Log Levels
● Critical: Wake me up in the middle of the night● Error: will look at it first thing tomorrow● Warning: Display in staging environment● Debug: Display on developer's machine
Log Levels
● Error: Something is broken, if it happens too much, monitoring system will tell me
● Warning: Invalid data● Notice: Things that happen on startup or occasionally● Info: A line of data for each request about what the system did● Debug: Useful for developers, too much work for production
We typically run at “notice” level in production, info in test / canary, debug in dev
Metrics
● I don’t care about logs, what I care about is:– How is the system performing?– Where are the problems?– Where are the bottlenecks?– Are we meeting SLAs?– Business level metrics, e.g. signups per hour, orders per hour
● Alert on user visible symptoms, not technical failures
Metrics
● Counters, gauges, durations (histograms)● Average duration vs 99% duration● Every time you write a log message, write a counter to see
how often it happens
Metrics
● Number of requests● Number of errors● Processing duration / latency
USE Method
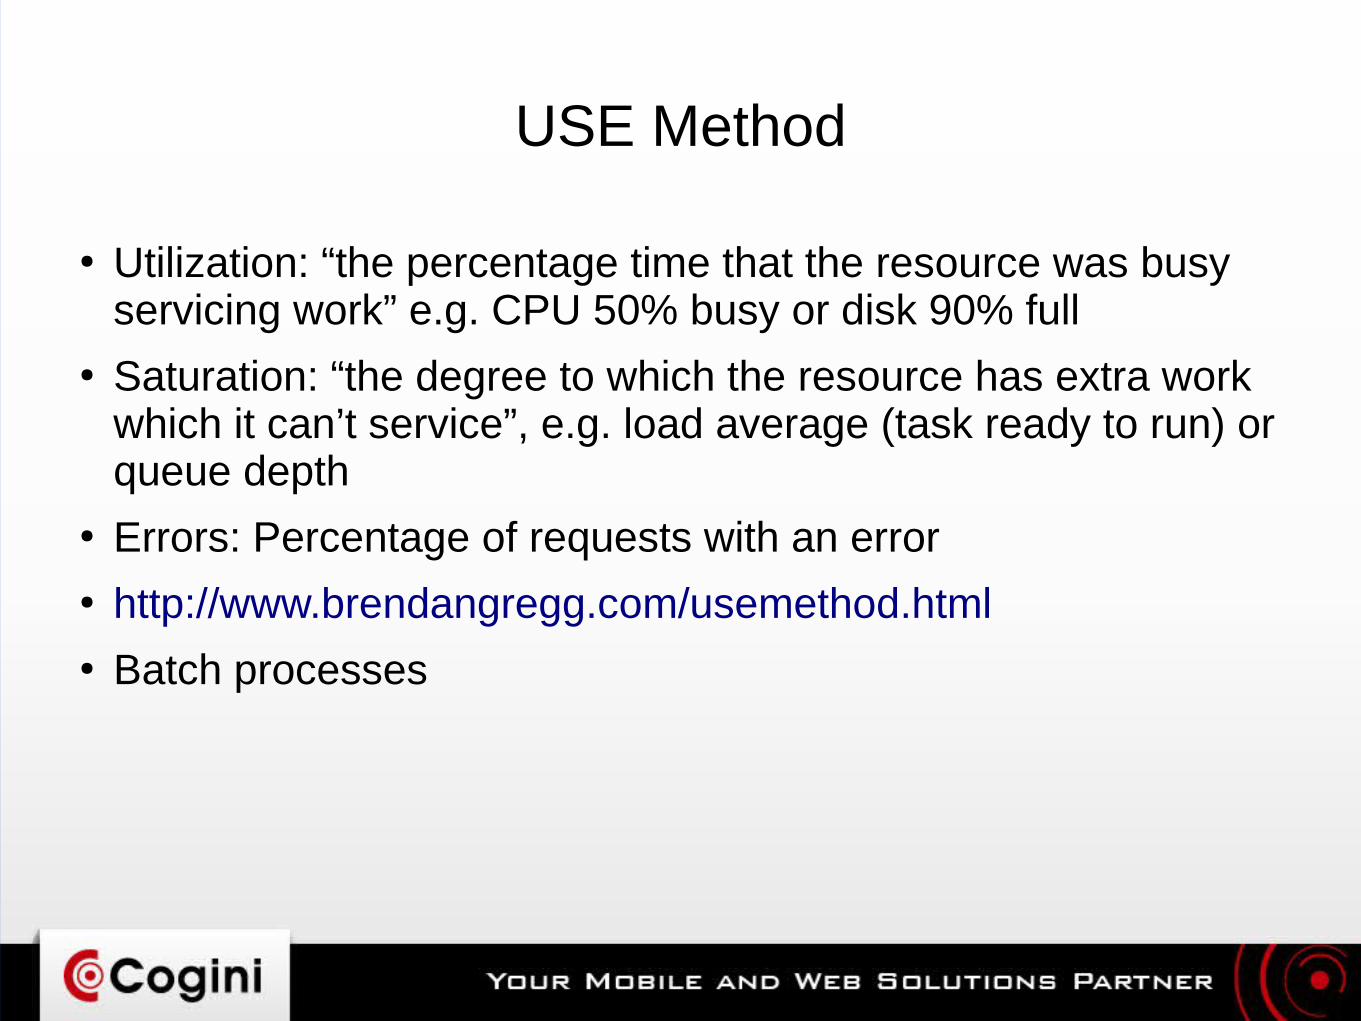
● Utilization: “the percentage time that the resource was busy servicing work” e.g. CPU 50% busy or disk 90% full
● Saturation: “the degree to which the resource has extra work which it can’t service”, e.g. load average (task ready to run) or queue depth
● Errors: Percentage of requests with an error● http://www.brendangregg.com/usemethod.html● Batch processes
Measurement
● Ideally: Measure at the client and on the server● Measure at a lower level than your application
– Cowboy middleware
Tools
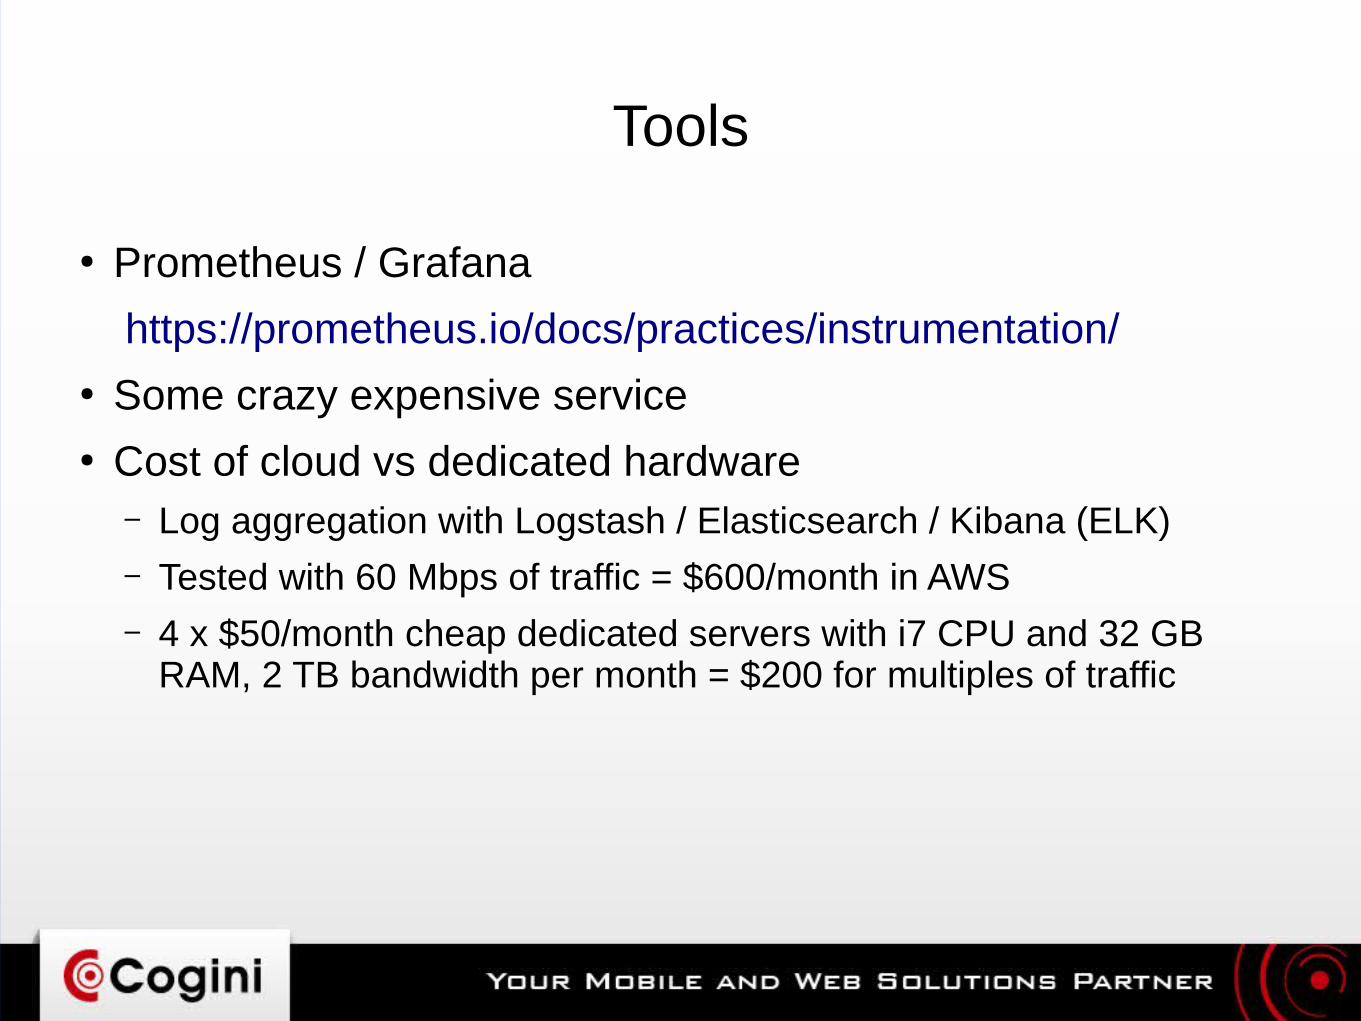
● Prometheus / Grafana
https://prometheus.io/docs/practices/instrumentation/● Some crazy expensive service● Cost of cloud vs dedicated hardware
– Log aggregation with Logstash / Elasticsearch / Kibana (ELK)– Tested with 60 Mbps of traffic = $600/month in AWS– 4 x $50/month cheap dedicated servers with i7 CPU and 32 GB
RAM, 2 TB bandwidth per month = $200 for multiples of traffic

Performance Tuning
Observer
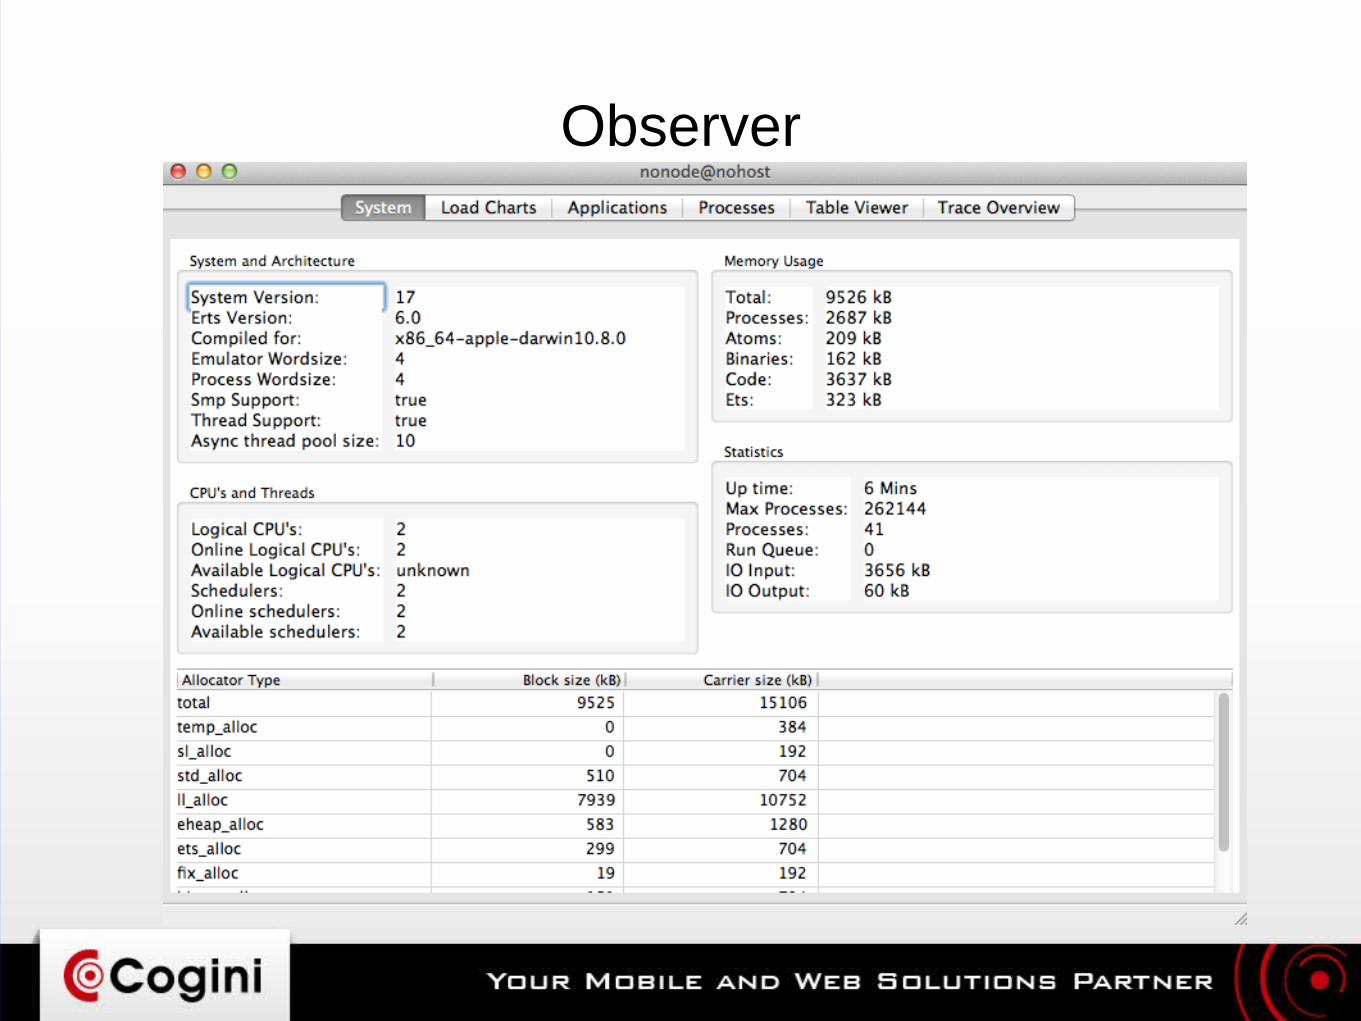
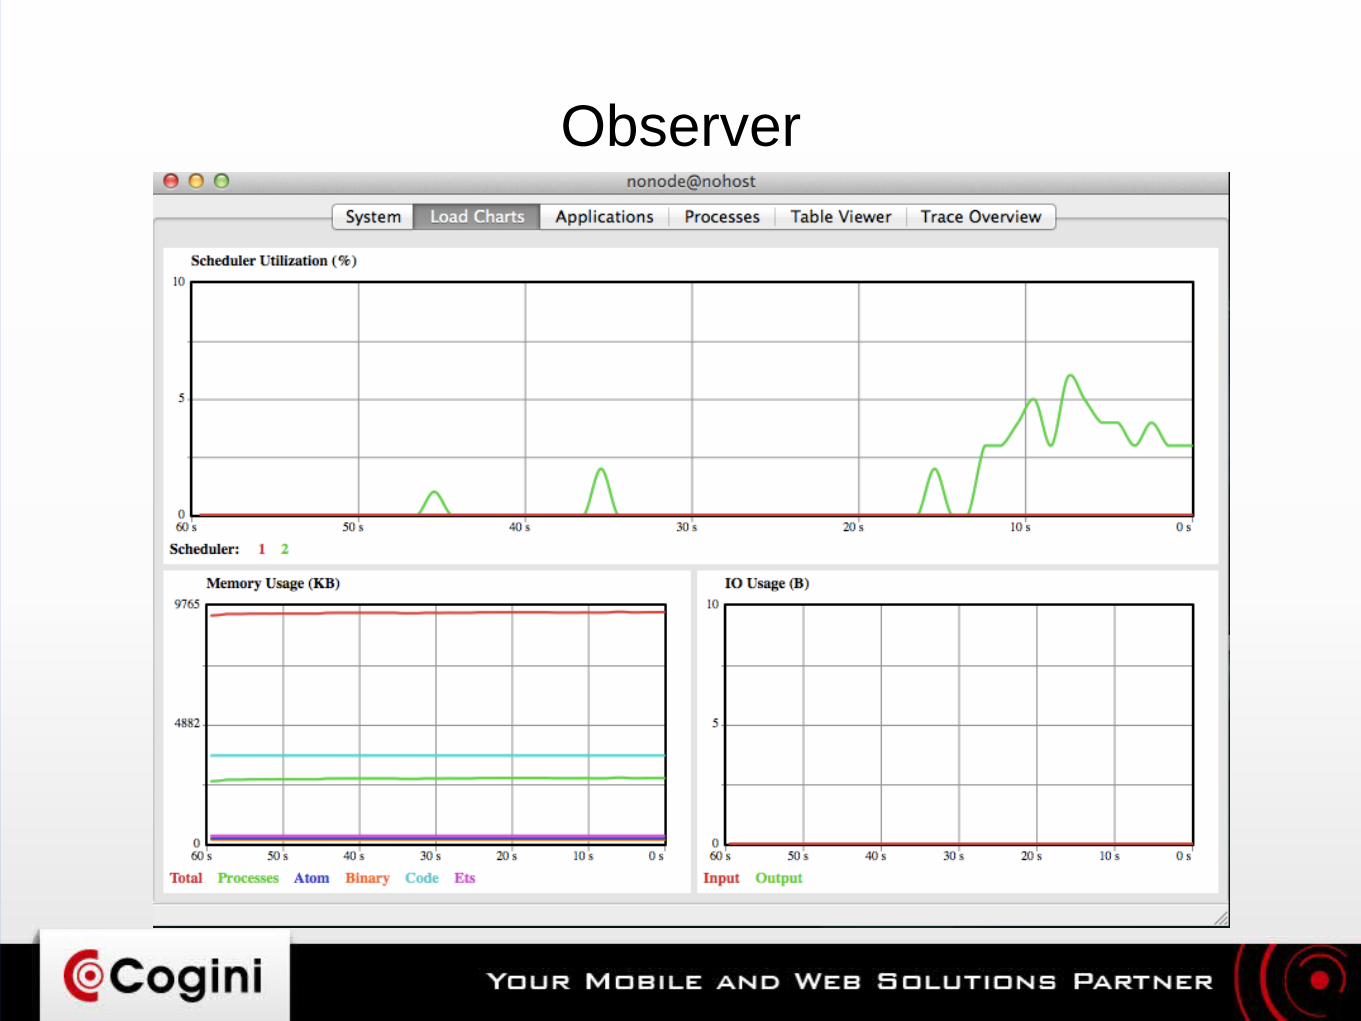
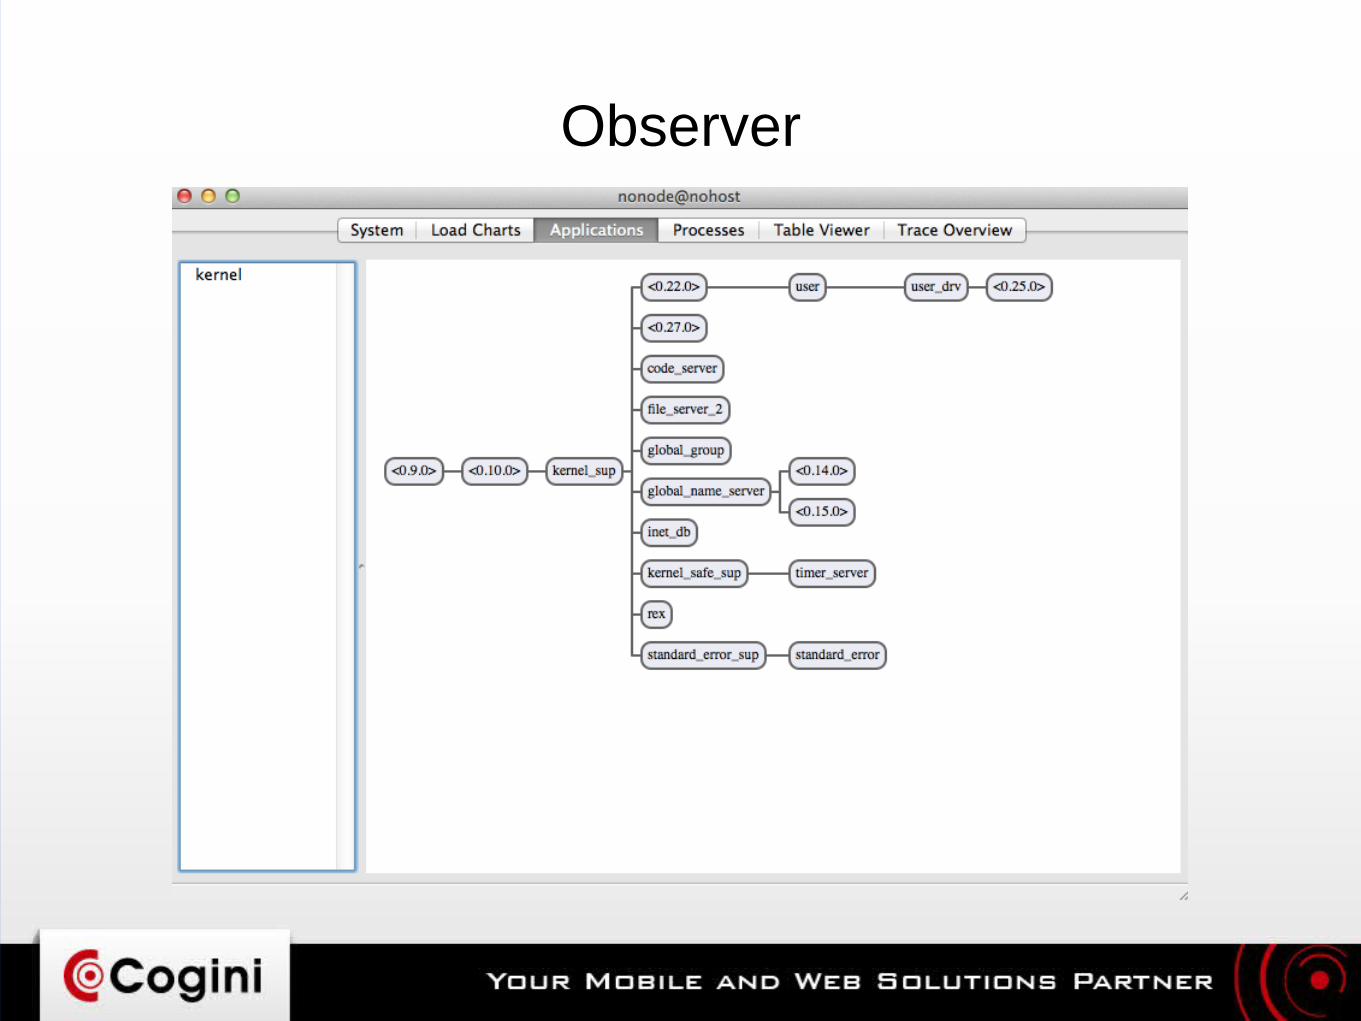
● Good overall view of what your application is doinghttp://erlang.org/doc/apps/observer/– Process structure– Resource usage: CPU, RAM– Mailbox queue size
● Recon: http://ferd.github.io/recon/● observer_cli: https://github.com/zhongwencool/observer_cli
– “top” for Erlang VM
Observer
Observer
Observer
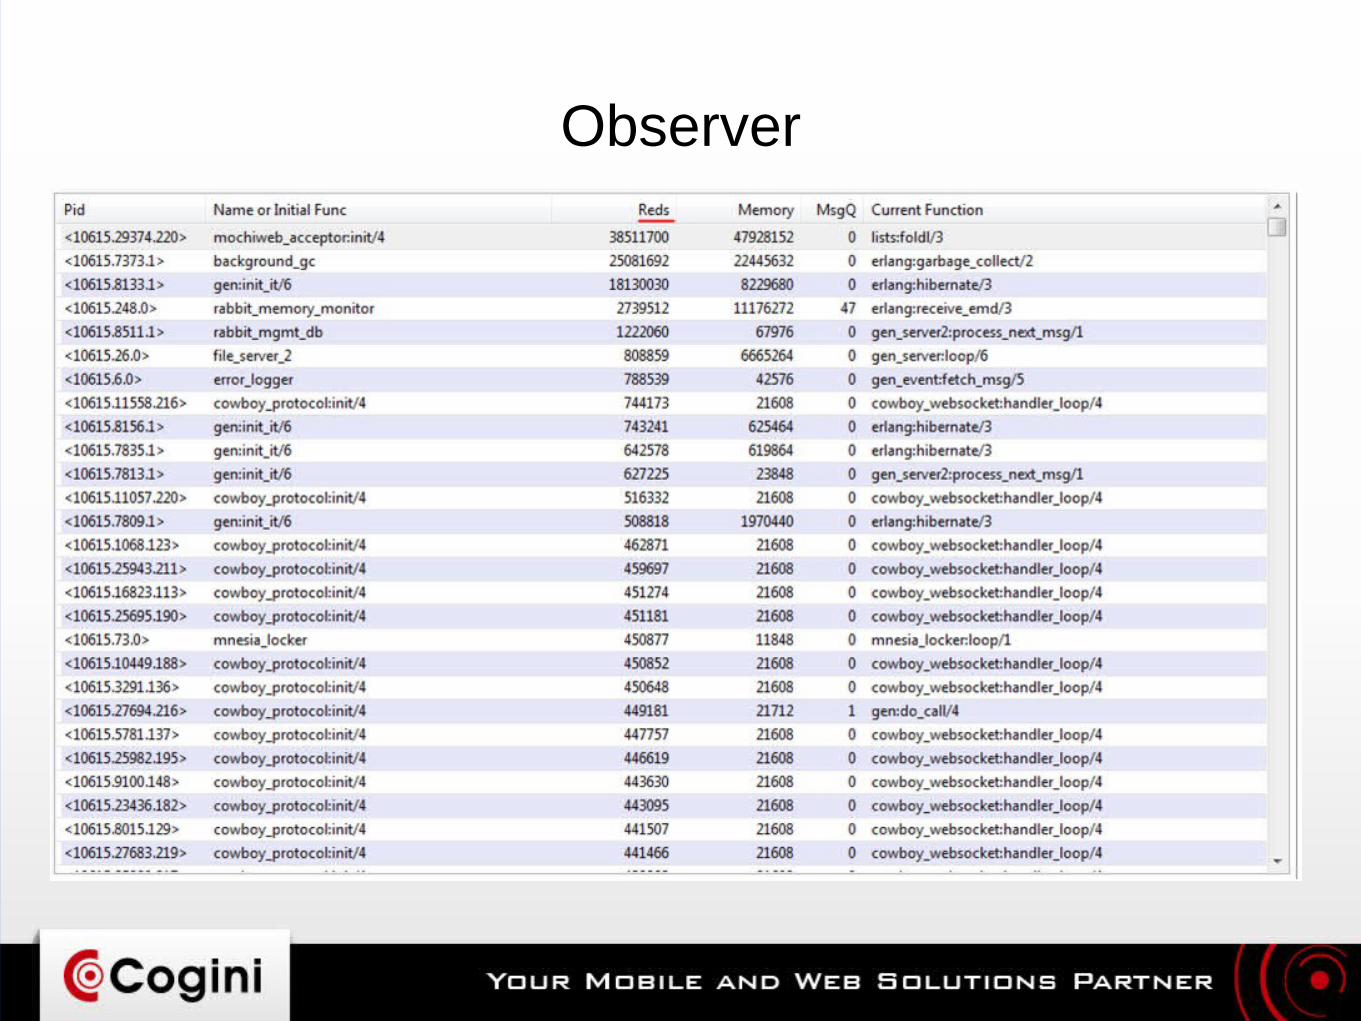
Observer
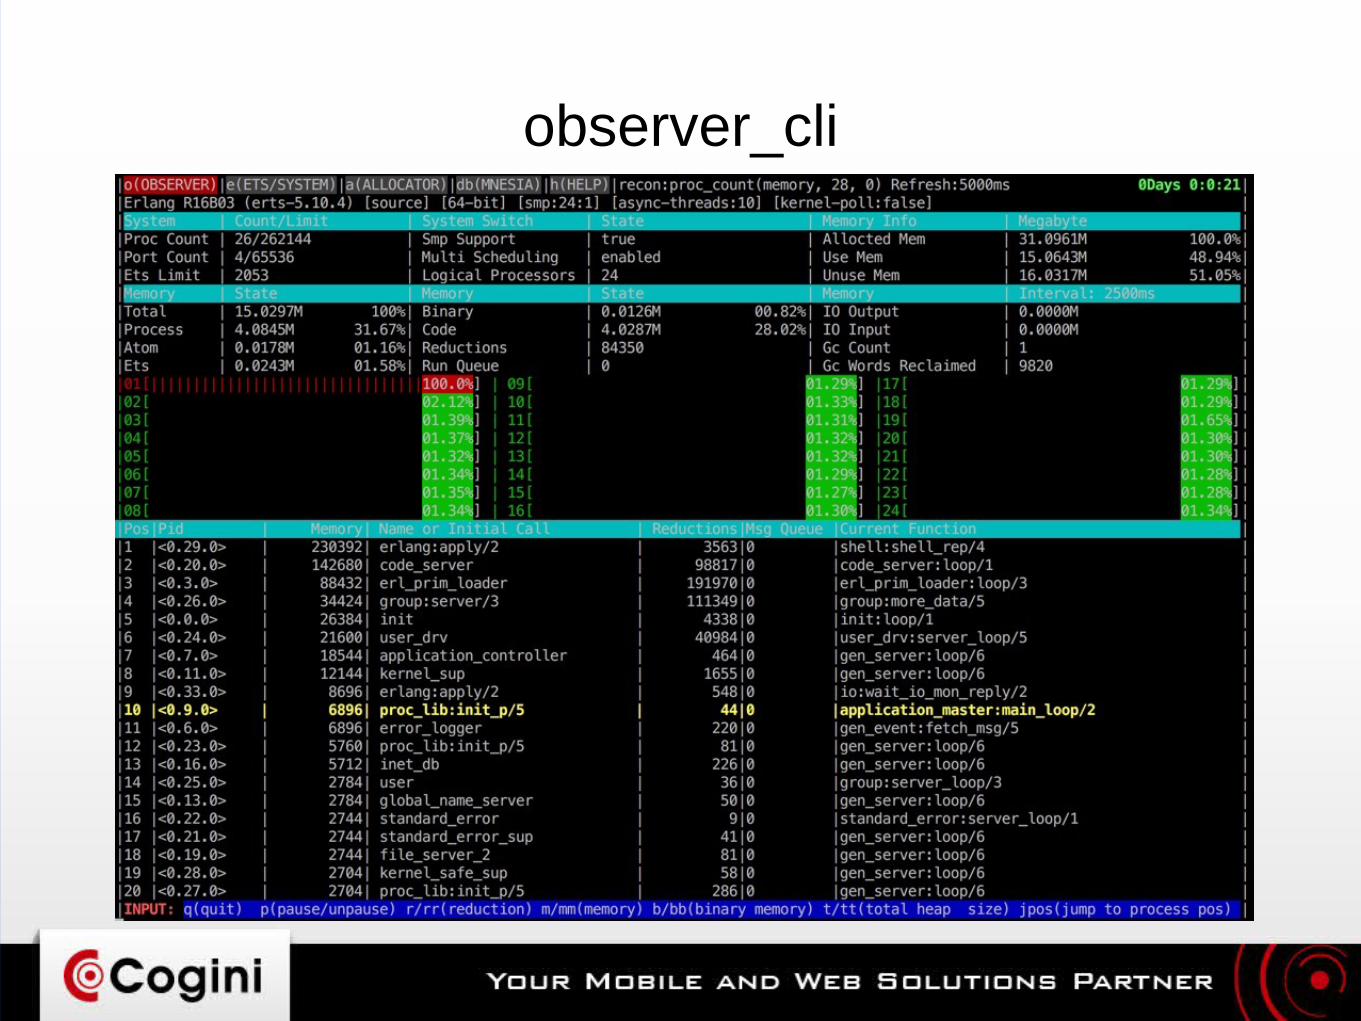
observer_cli
Measure, Don't Guess
● Your intuition may be wrong● Don't optimize things that don't matter● Optimize the hot path● Driver for performance is often abuse use cases, e.g. DDOS
Lots of tools
● http://homeonrails.com/2016/05/profiling-in-erlang/● http://www.snookles.com/erlang/ef2015/slf-presentation.html
Lots of tools
● Micro:– timer:tc– Benchee: https://github.com/PragTob/benchee
● Macro– fprof
● http://erlang.org/doc/man/fprof.html● https://github.com/isacssouza/erlgrind● brew install qcachegrind --with-graphviz
– Flame graphs: https://github.com/slfritchie/eflame
● Tsung for load generation
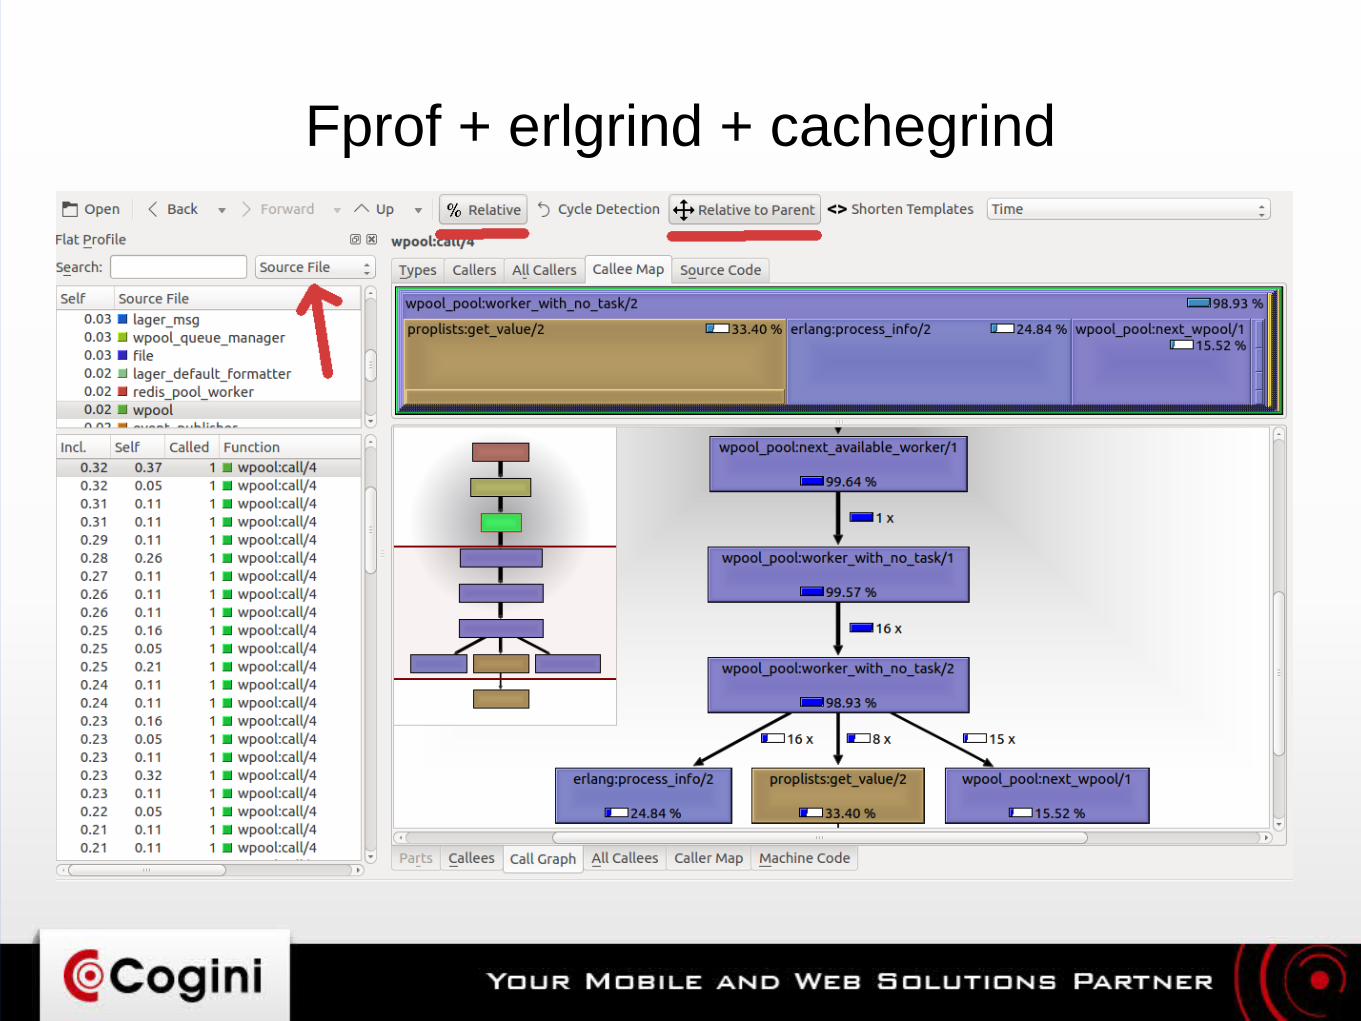
Fprof + erlgrind + cachegrind

Surprising things: inspect
● Does a lot of work to introspect big data structures like conn● Throws it away if debug message in production
Surprising things: uuid generation
● Globally unique request id, e.g. 63edd89e-4f45-11e7-9424-2fc1a54ffaf3
● Depends on MAC address, time, pid, random number● Lists all the network interfaces● Reads the clock● Stateful, by pid: use process dictionary● Time went from worst case of 500 μs down to less than one μs
Surprising things: iolists
● Erlang I/O functions use more efficient OS functions (writev vs write). One reason Phoenix is so fast.
● "foo" <> "bar" vs ["foo", "bar"]● Don't unnecessarily flatten data● Make your APIs iolist friendly● Law of leaky abstractions:
https://www.joelonsoftware.com/2002/11/11/the-law-of-leaky-abstractions/
● https://www.bignerdranch.com/blog/elixir-and-io-lists-part-1-building-output-efficiently/
● http://www.evanmiller.org/elixir-ram-and-the-template-of-doom.html
OS and TCP/IP Tuning: open files
● Increase number of open files for user, for OS as a whole● Starts at 1024, much too small● Ends at 4M :-)
OS and TCP/IP Tuning
● Phoenix behind Nginx● TCP connection is identified by four things
– source ip + source port + destination ip + destination port– 127.0.0.1 + xxx + 127.0.0.1 + 4000– There are 64K ports, 16-bit integer– TCP/IP stack won't reuse a port for 2 x maximum segment lifetime = 2
minutes– 60000 ports / 120 sec = 500 requests per sec max– 1024 / 120 = 8.53 rps with default file handle limit– Symptom: app thinks everything is fine, but you measure latency at Nginx,
you get some requests that take 5 sec waiting for a port
● Add HTTP "Connection: close" header, particularly for abuse
OS and TCP/IP Tuning
● http://theerlangelist.com/article/phoenix_latency● http://www.phoenixframework.org/blog/the-road-to-2-million-w
ebsocket-connections

Erlang VM tuning
● Async threads: set +A parameter to at least 12 threads per core on which your node is deployed on. e.g. 128 on an 8 core
+A 128● kernel-poll = more efficient socket interface
+K true

Questions?