elevated carbon dioxide and solution phosphorus in soil with vesicular-arbuscular mycorrhizal...
TRANSCRIPT
Elevated Carbon Dioxide and Solution Phosphorus in Soil with Vesicular-ArbuscularMycorrhizal Western Wheatgrass
W. G. Knight,* M. F. Alien, J. J. Jurinak, and L. M. Dudley
ABSTRACTPlants infected by mycorrhizae may exhibit increased root/fungal
respiration and elevated concentrations of CO2 in the root zone.Carbon dioxide is a thermodynamically viable calcium phosphateweathering agent in calcareous soils. The weathering of phosphateminerals in soils releases P to the soil solution. This study wasconducted to determine if differences in soil atmosphere CO2, ofconsequence to plant P availability, may exist between mycorrhizaland nonmycorrhizal plants. Western wheatgrass (Agropyron smithiiRydb.) was inoculated with raw soil that contained propagules ofGlomus spp. and grown in prefumigated soil columns in the green-house. Soil atmosphere CO2 levels for inoculated plants averagedtwice those of noninoculated plants in two separate experiments. Themean concentrations of CO2 in the soil atmosphere, measured atdiscrete weekly intervals, ranged between 0.13 and 2.63 kPa forinoculated systems and was significantly higher in 10 of 19 samplingevents than for noninoculated systems (range of 0.05 to 1.02 kPa).Total plant P uptake was also significantly higher for inoculatedcompared with noninoculated plants. Total solution P, measuredmonthly in saturation throughput from experimental columns, wassignificantly higher in three of seven sampling events for inoculatedcompared with noninoculated plant systems. In treatments wherenoninoculated plants were grown under an imposed soil CO2 regime,total solution P was highly correlated with CO2. In soil systemswhere P availability is governed by the solubility of Ca-phosphateminerals, mycorrhizae may contribute to the P nutrition of hostplants via a CO2-enhanced mineral weathering mechanism.
IN CALCAREOUS SOILS with low organic matter andhigh pH, P availability may be limited by the sol-
ubility of calcium phosphate minerals (Lindsay,1979). A number of reports have described the moreefficient use of relatively insoluble rock phosphate(apatite) fertilizers by vesicular-arbuscular mycorrhi-zal (VAM) plants under P-limiting conditions (e.g.,Daft and Nicolson, 1966; Hall, 1975). Mosse et al.(1976) found that the addition of rock phosphate stim-ulated growth of nonmycorrhizal clover (Trifoliumpratense L.) and onion (Allium cepa L. cv. James'Long Keeping) only in acidic soils, whereas mycor-rhizal plants benefited at all pH levels with differencesmost pronounced in alkaline soils. Nauru rock phos-phate was reported by Powell and Daniel (1978) to beunavailable to nonmycorrhizal plants, but was utilizedby mycorrhizal clover and three successive crops ofryegrass (Lolium perenne L. cv. Grasslands Ruanui).Duce (1987) found an increased loss in the "unavail-able" (as per Olsen and Sommers, 1982) inorganic Ppool in pots with VAM Agropyron smithii, relative tothose with nonmycorrhizal plants, suggesting thatW.G. Knight, USDA-ARS, Great Plains Systems Res. 1701 CenterAve., Fort Collins, CO 80526; M.F. Alien, Dep. of Biology andSystems Ecology Res. Group, San Diego State Univ., San Diego,CA 92182; J.J. Jurinak and L.M. Dudley, Dep. of Soil Science andBiometeorology, Utah State Univ., Logan, UT 84322. This workwas supported in total by Grant BSR-8217358 from the Nat. ScienceFoundation. Received 15 July 1988. 'Corresponding author.Published in Soil Sci. Soc. Am. J. 53:1075-1082 (1989).
VAM fungi may enhance the solubilization of mineralP.
The concentration of CO2 in the soil atmosphereinfluences the chemistry of the soil solution, affectingsoil pH (Whitney and Gardner, 1943) and the disso-lution/precipitation of soil minerals (Brown, 1981). Incalcareous soils, elevated CO2 (>0.03 kPa) can havean appreciable effect on P availability by lowering so-lution pH and enhancing dissolution of calcium phos-phate minerals (Jurinak et al., 1986). Root and mi-crobial respiration can result in pronounced CO2differences between the rhizosphere and bulk soil(Barber and Martin, 1976; Buyanovsky and Wagner,1983). Although information is limited on root systemCO2 levels as affected by VAM fungus infection,higher rates of respiration for ectomycorrhizal vs.nonmycorrhizal roots have been reported (Reid,1984). Pang and Paul (1980) found a twofold increasein root respiration in VAM fungus-infected and Rhi-zobium-nodulated fababean (Viciafaba L.) over non-infected roots alone. Paul and Kucey (1981) ascribeda 3% loss of fixed C from the dual symbiont systemto mycorrhizal respiration on a daily basis. In a soy-bean [Glycine max (L.) Merr.]-Rhizobium-Glomusassociation, Harris et al. (1985) found increased be-lowground respiration compared to nodulated soy-bean alone with 5 to 14% of the total tripartite res-piration attributed to VAM respiration.
The prevailing view of mycorrhizae as a more ef-ficient (Cress et al., 1979; Howeler et al., 1982) andadditional surface area for absorption (Sanders andTinker, 1971) may not, in itself, fully explain en-hanced P uptake in soils where P availability is con-strained by mineral or organic sinks (Bolan et al.,1984). Complimentary mechanisms for mycorrhizalenhancement of P availability and uptake include thesynergistic action of P-solubilizing bacteria and my-corrhizae (Azcon et al., 1976), the modification of rhi-zosphere pH via differential absorption of cations andanions by mycorrhizal plants (Buwalda et al., 1983),the action of phosphatase enzymes on organic Psources (Alien et al., 1981; Gianinazzi-Pearson et al.,1981) and the weathering of P-bearing soil mineralsby plant and fungal exudates (Stevenson, 1967). Ox-alic acid of VAM origin has been implicated as a par-ticularly effective mineral-P weathering agent in cold-desert ecosystems (Jurinak et al., 1986).
Johnston and Olsen (1972) found that removal ofCO2 from plant roots grown on a sponge media withadded fluorapatite had no effect on P uptake. Moghimiet al. (1978), citing the work of Johnston and Olsen(1972) and earlier nutrient-solution, variable-CO2 ex-periments by Parker (1924), suggested further inves-tigation of the CO2-mediated release of P from cal-cium-phosphate sources was unwarranted. Thesestudies, however, did not involve mycorrhizae andwere not conducted under P-limiting conditions.
The objectives of these studies were to examine CO2
1075
1076 SOIL SCI. SOC. AM. J., VOL. 53, JULY-AUGUST 1989
levels in soil containing VAM fungus-inoculated ornoninoculated plants, and to evaluate the influence ofenhanced soil atmosphere CO2 on P availability incalcareous soils.
MATERIALS AND METHODSExperimental Treatments, Design, and Systems
Fifteen soil-plant microcosms, representing five treat-ments with three replicates each were employed. The treat-ments were inoculated (I) and noninoculated (III) westernwheatgrass (Agropyron smithii Rydb.), noninoculatedwheatgrass subjected to an imposed soil CO2 regime (V),bare soil (II), and bare soil with an imposed CO2 regime(IV). The indigenous CO2 treatments (1,11, and III) consti-tuted a randomized block experimental design with mea-surements taken over time. At-harvest data were analyzedfor planted treatments (1,111, and V) as a separate random-ized block design.
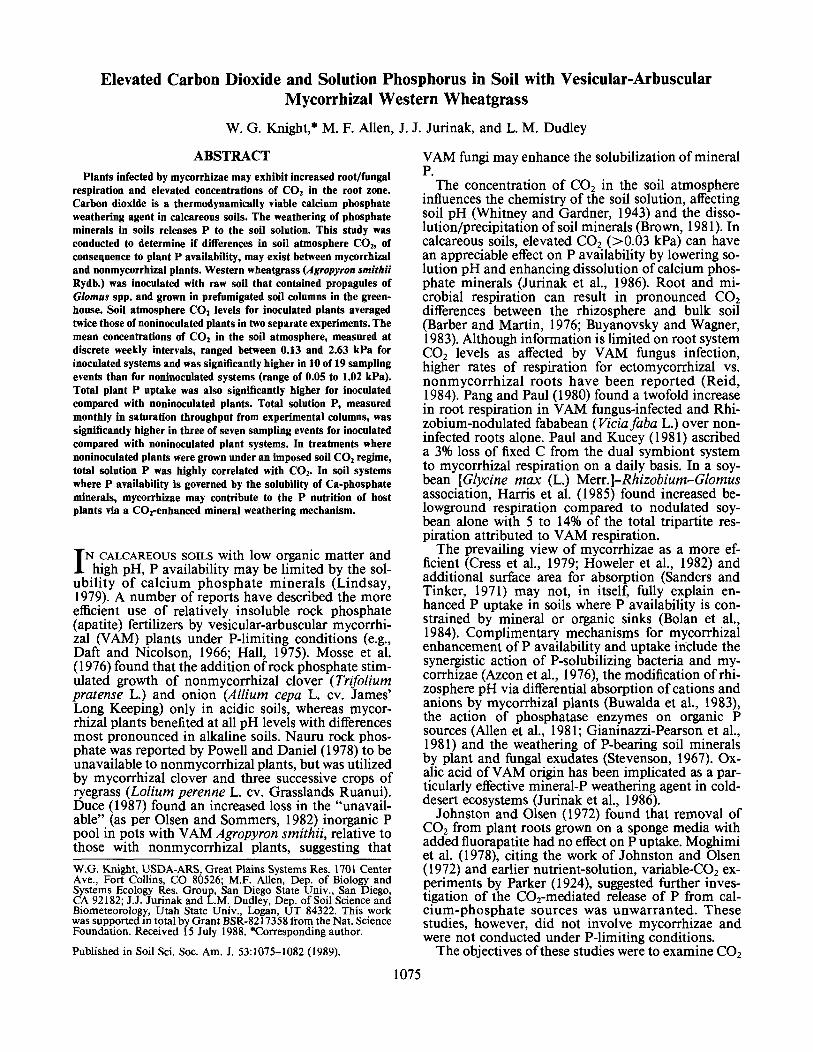
The containers were constructed of white, opaque, poly-vinyl chloride irrigation pipe fitted with two gas samplingports and one soil thermocouple-psychrometer port (Fig. 1).The gas sampling units consisted of porous, ceramic soil-water probes (6.5 cm long by 0.65-cm o.d.), sealed with rub-ber balloon sleeves (no.65-7, San Pievac Co., Long Beach,CA) to prohibit water entry but facilitate gas exchange withthe soil atmosphere (Gary and Holder, 1982). Polypenco®,Nylaflow® pressure tubing (Norton Co., Akron, OH) (1.0-mm i.d. by 3-mm o.d.) was sealed internally with epoxy tothe soil-suction probes. The terminal end of a 15-cm lengthof the pressure tubing was inserted through the septa of fitted8-mL glass serum vials and externally sealed with siliconcaulking. A plastic bottom plate, with five radially symme-tric holes and fitted funnel, was sealed with epoxy to eachcolumn to allow collection of drainage water.
Soil (Typic Argixeroll, fine, mixed) was collected to a
togaschromatograph
hyd ratedair-co2source
Fig. 1. Experimental units.
depth of 45 cm from an undisturbed site at Kemmerer CoalCompany's operations in Lincoln County, Wyoming. Thearea was a mixed shrub-grassland at an elevation of 2.2 kmwith an average annual precipitation of 230 mm. Westernwheatgrass was the only plant at the collection site. Themixed and sieved (0.5-cm mesh) soil had an initial satura-tion extract pH of 8.1, a saturation extract electrical con-ductivity of 1.54 ds nr1, and contained 19.7 g kg-' CaCO3-equivalent carbonates as determined manometrically. Theparticle-size distribution by hydrometer was 21% sand, 40%silt, and 39% clay. Soil organic matter (Walkley and Blackprocedure; Allison, 1965) was 14.3 g kg-', total P (Olsen andDean, 1965) was 835.4 mg kg-', and labile inorganic P (bi-carbonate extractable, Olsen et al., 1954) was 16.14 mg kg-'.Saturation extract elements by atomic absorption spectro-photometry (Perkin-Elmer Model 2380, Perkin-ElmerCorp., Norwalk, CT) or ion analyzer (Wescan Model 215-110 (Wescan Instruments, Santa Clara, CA)) were as followsSO2.-, 0.70; and Cl~, 7.10. In order to evaluate phosphate-SO2,-, 0.70; and Cl~, 7.10. In order to evaluate phosphate-solubility control in these soils, ion activity products forhydroxyapatite, tricalcium phosphate, and brushite were cal-culated using the computer program GEOCHEM (Spositoand Mattigod, 1979). Input data for the calculations con-sisted of postharvest saturation extract concentrations of theions given above plus ortho-P (Watanabe and Olsen, 1962),pH and a partial pressure of CO2 of 0.032 kPa (open systemwith respect to C92).
Soils were sterilized in a vented system by injection of 25mL of chloroform (Exp. 1) or propylene oxide (Exp. 2) tothe bottom of sealed funnels in each soil-loaded column.The liquid completely dissipated within 24 h. Planted treat-ments were seeded with western wheatgrass 1 wk postster-ilization. The inoculated wheatgrass treatment was given a2-cm seedbed of nonsterilized, mixed soil/fine chopped(<5.0 mm) western wheatgrass VAM roots, collected fromthe Kemmerer site at the time of soil sampling. The inoc-ulum was prepared and utilized 9 d following field collectionfrom roots and root-zone soil stored moist at 4 °C. The in-oculum was approximately 25% root material by volumeand contained approximately 8000 spores per column plusan estimated 500 cm of infected root fragments. Microbialbiomass (Jenkinson and Powlson, 1976) of the inoculatedand noninoculated treatments were quantitatively evaluatedpostharvest. The VAM fungi introduced with the inoculumwere predominantly Glomus fasciculatum (Thaxter sensuGerdemann) Gerdemann and Trappe and G. microcarpum(Tul. & Tul.). For a more detailed description of the indig-enous mycorrhizal fungi, see Alien and MacMahon (1985).All seeds were then given a 2-cm top dressing of the Kem-merer soil.
Treatments IV and V were subjected to a variable (estab-lished weekly), but constantly imposed, CO2 regime by flow-metered introduction of a hydrated air/CO2 mixture throughperforated (7-mm spacing), Tygon® "spaghetti" tubing(Norton Co., Akron, OH) (2-mm i.d. by 3-mm o.d.) radiallyarranged at the bottom of the treatment columns (Fig. 1).
Two experiments were conducted in the greenhouse underincident light. The first from 9 Sept. 1985 to 21 Jan. 1986and the second from 16 June to 5 Nov. 1986. Mean irra-diance was approximately 800 W nr2 for Exp. 1 and 1000W nv2 for Exp. 2. Temperatures averaged 17 and 20 °C forExp. 1 and 2, respectively. Each seeded column was thinnedto 14 plants at 4-wk postplanting in Exp. 1 and 30 plants inExp. 2. Increasing plant numbers in the second experimentwas envisioned as a means of accentuating competition forthe P resource.
Sampling and AnalysesThe gas collection vials were retrieved weekly from the
columns and replaced with a replicate set. The collected

KNIGHT ET AL.: ELEVATED CARBON DIOXIDE AND SOLUTION PHOSPHORUS WITH VAM FUNGI 1077
vials were transported immediately to the laboratory wherea 0.5-mL gas sample was removed with a gas tight syringeand analyzed for CO2 via direct injection into a GOW-MACInstrument Co. (Princeton, NJ) series 550-P thermal con-ductivity gas chromatograph fitted with a 3.05-m by 0.32-cm stainless-steel column packed with Carbosieve S-II, 100/120 mesh (GOW-MAC Instrument Co.). Instrument oper-ating conditions were 35, 55, and 105 °C for the injectionport, column, and detector, respectively. Carbon dioxidewas measured at a retention time of 0.19 min with an in-strument attenuation of 32. The working detection rangewas from 0.05 to 101.0 kPa.
The test columns were watered for leachate collection atmonthly intervals via surface application (ponding) of 1.75L of water per column. Total column throughput rangedfrom 246 to 371 mL in the experiments, and averaged 271mL for planted treatments and 315 mL for bare soil treat-ments. Supplemental waterings of 500 mL per planted col-umn were made between saturation waterings, oncemonthly over the course of Exp. 1 and twice monthly overthe course of Exp. 2. Total solution P was determined col-orimetrically (vanadomolybdophosphoric acid method) forthe column throughput samples (APHA, 1980).
Plants were harvested at 20 wk postplanting for Exp. 1and 16 wk postplanting for Exp. 2. Total shoot productionat harvest was clipped and roots were then removed fromthe soil by hand-washing. Total shoot and root mass wereobtained by weighing harvested plant materials followingoven drying at 67 °C for 72 h. Total P in digested plantmaterials (3:1 nitric to perchloric acids) was measured co-lorimetricaly (Watanabe and Olsen, 1962).
Four root subsamples (approximately 3-cm by 0.5-cmareas) were taken at random from each root system and thetotal length of roots measured under a dissecting scope witha calibrated occular scale. Root lengths per gram of oven-dried root were calculated and multiplied (as a mean value)by total root mass and by the percentage of cleared andstained root length with VAM fungi (Kormanick et al.,1980), to yield total length of VAM root per column.
Analysis of variance and linear regressions were accom-plished using General Linear Models procedures. Schefle'smulti-comparison test (P < 0.05) was used for mean sepa-ration (SAS Institute Cary, NC).
RESULTSVesicular-Arbuscular Mycorrhizal Root Length,
Yields, and Microbial BiomassDifferences in VAM root length were observed be-
tween inoculated and noninoculated treatments, butnot between noninoculated treatments with and with-out the imposed CO2 regime in both experiments (Ta-ble 1).
Root mass at harvest (Table 1) was higher for in-oculated wheatgrass than for noninoculated plants inboth experiments. Shoot mass, however, was lower(significant only in Exp. 2) for the inoculated com-pared with noninoculated (without imposed CO2)plants. Root mass (significant in Exp. 1) and shootmass (significant in Exp. 2) were lower for the noni-nocualted, imposed CO2 regime plants than for non-inoculated (without imposed CO2) plants. Mean totalphytomass was significantly greater in both experi-ments for inoculated plants than for noninoculatedplants. Noninoculated plants exposed to the elevatedCO2 regimes had 23% (Exp. 1) and 25% (Exp. 2) less
total phytomass at harvest than noninoculated plantsgrown without imposed CO2.
Microbial biomass for the inoculated and nonino-culated wheatgrass treatments were equal by harvestin both experiments. Mean microbial biomass for allplanted columns at harvest was 84.6 ± 3.56 (SE) mgCO2-C kg;1 soil in Exp. 1 and 105.6 ± 8.23 mg CO2-C kg"1 soil in Exp. 2.
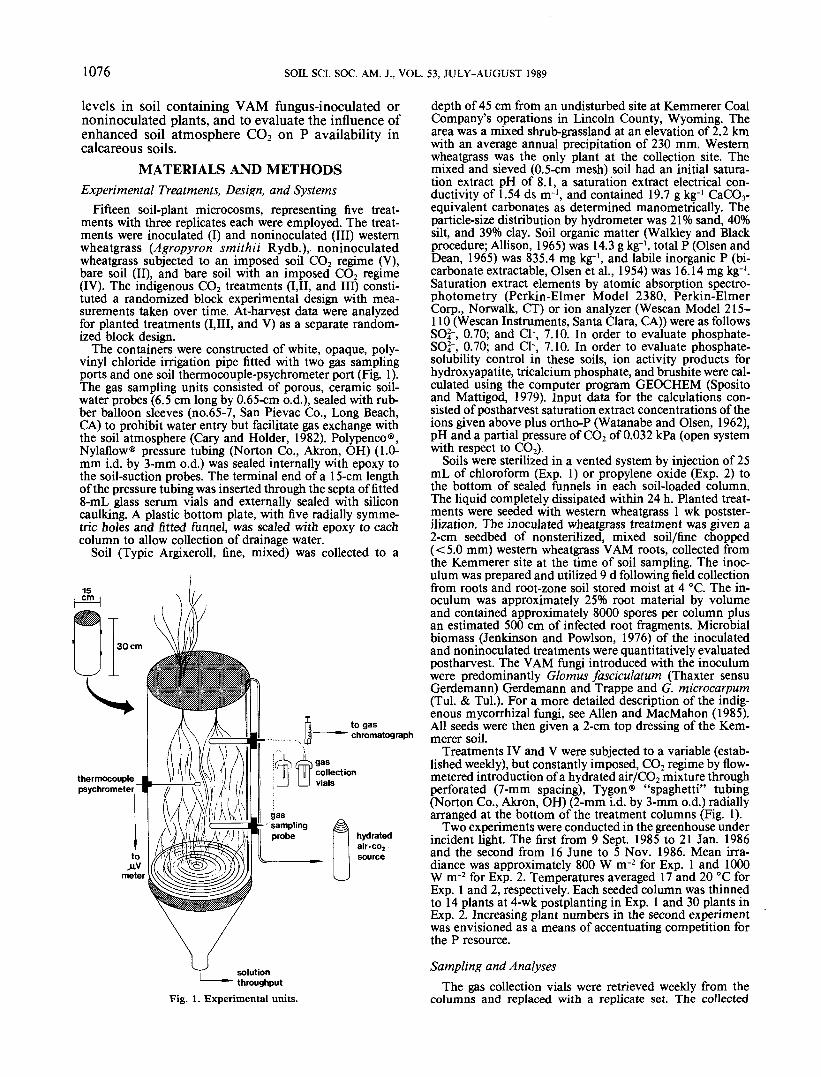
Column Carbon Dioxide LevelsIn Exp. 1, higher column CO2 was noted on four of
the five initial sampling dates, and again at 17 wkpostplanting for inoculated vs. noninoculated wheat-grass treatments (Fig. 2a). Instrument failure pre-vented CO2 analyses from 9 to 15 wk postplanting.For Exp. 2, column CO2 was higher for inoculatedsystems than for noninoculated systems on 5 of the10 samplings (Fig. 2b). When averaged over all sam-pling events, mean column CO2 levels were 2.77 ±0.90 and 1.38 ± 0.21 times higher for the inoculatedthan for the noninoculated treatments in Exp. 1 and2, respectively. The only case in both experimentswhere the mean column CO2 level was significantlyhigher for noninoculated than inoculated systems oc-curred at the termination of Exp. 1 (20 wk postplant-ing, Fig. 2a). It should be noted that qualitative evi-dence of plant senescence as witnessed by leafbrowning and litter deposition was first noted between17 and 18 wk postplanting in Exp. 1.
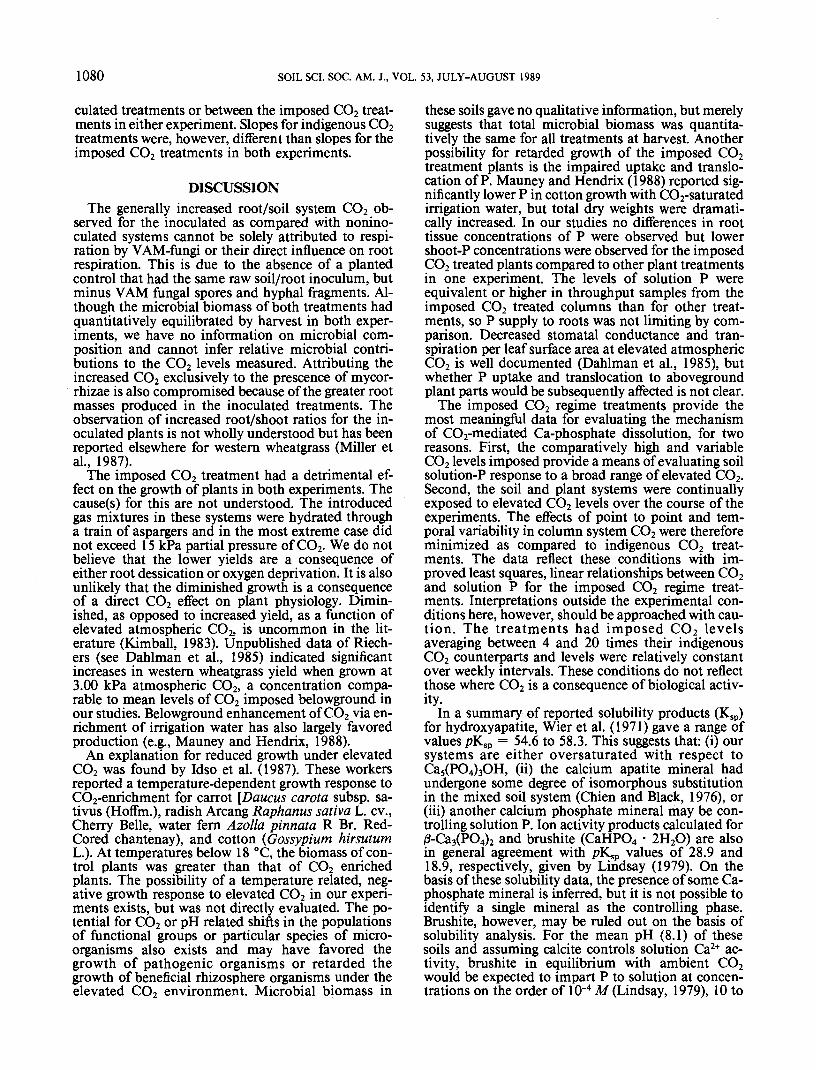
The mean levels of imposed CO2, (Fig. 3) averagedbetween 4 times (bare soil, Exp. 2) and 20 times (baresoil, Exp. 1) the levels measured for their indigenousCO2 counterparts (Fig. 2). The range of imposed CO2in the noninoculated wheatgrass columns was 0.60 to11.39 kPa in Exp. 1 and 1.22 to 8.21 kPa in Exp. 2.For the imposed CO2/bare soil systems, mean columnCO2 ranged from 0.45 to 8.10 kPa in Exp. 1 and from1.22 to 8.21 kPa in Exp. 2. Mean column CO2 wasnot significantly different between the imposed CO2
Table 1. Mean values for VAM root length, yield, and plant tissueP concentrations at harvest.
Treatment
(I)Inoculated(III)Noninoculated(V)Noninoculatedwith imposedCO2 regime
(I)Inoculated(III)Noninoculated(V)Noninoculatedwith imposedCOj regime
Infectedroot length
m column '
15.03af
5.63b
3.95b
20.68a
Ob
0.67b
Rootmass
Shootmass
Exp. 1
3.585a
2.949b
2.182c
Exp. 2
24.939a
17.953b
14.796b
2.062a
2.085a
1.680a
5.750b
7.465a
4.362c
Root P Shoot P
••*e "•&
727.2a 844.7a
552.7a
856.8a
1705.0a
1335.0a
1587.8a
709.2a,b
570.8b
1461.3a
1524.5a
892.8a
f Values within an experiment followed by the same letter are not significantlydifferent from each other as determined by Scheffe's multicomparison test(P < 0.05).

1078 SOIL SCI. SOC. AM. J., VOL. 53, JULY-AUGUST 1989
treatments on any sampling dates in Exp. 1, but wason 10 September, 7 October, and 5 November in Exp.2.
Phosphorus Supply and Plant UptakeMean total solution-P concentration in column
throughput was greater for inoculated wheatgrass thanfor noninoculated wheatgrass on one of the four sam-pling dates in Exp. 1 and two of the three samplingdates in Exp. 2 (Table 2). In two of the three events
where significantly higher solution P was noted for theinoculated systems, there was higher mean columnC02 (Fig. 2).
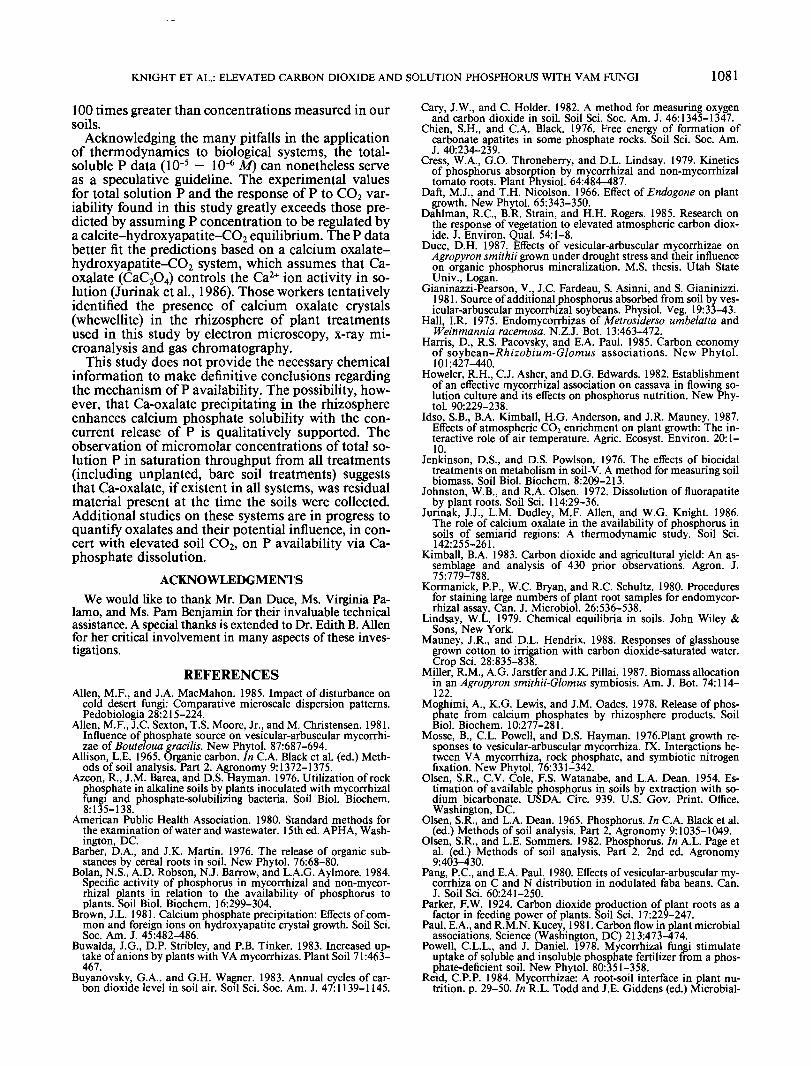
Due, in large part, to the high P levels noted for theimposed CO2 treatments on the final sampling date ofExp. 2 (Fig. 4), mean total P in saturation throughputwas highest overall for the imposed CO2 systems inExp. 2. Mean total solution P concentrations were 1.6times higher for imposed CO2 treatments than fortheir indigenous CO2 counterparts in the first two
o.v/ —
-
1 2'°~~<?oP 1.0—
0.5-
0— ———aab a
5
3.0— |
a a.
6
r— inoculatedwheatgrass
1 2'°~
QO 1.0—
0.5-
n —
— bare soil
<a>
!W
////////
&^yl ... h b h "
7 8 9 ••• 17 18 19 20WEEKS POST -PLANTING
(b)
,— noninoculatedwheatgrass
W/////
///A* b ds ^ ^l a
^ a a ^ b ^ ~I - i|bil|b |b
9 10 11 12 13WEEKS POST-PLANTING
Fig. 2. The mean partial pressure of CO2 in soil columns of indigenous CO2 treatments, (a) Exp. 1, (b) Exp. 2. Differing letters above treatmentmeans indicate significant differences (P < 0.05) via Scheffe's test.
15.0-,
i 10.0—
5.0-2.5
0—l
15.0—,
10.0—
-S.E. (n-3)
10/8/85 10/15/85 10/52/85 10/29/85 TI/5/85SAMPLING DATE
12/31/85 1/7/86 1/14/86 1/21/86
2.5-
O—bare soil••••noninoculated
wheatgrass(b)
i-....,
9/2/86 9/10/86 9/16/86 9/22/86 10/1/86 10/7/86 10/14/86 10/22/86 10/29/86 11/5/86SAMPLING DATE
Fig. 3. The mean partial pressure of CO2 in soil columns of imposed CO2 treatments for Exp. 1 (a) and Exp. 2 (b).

KNIGHT ET AL.: ELEVATED CARBON DIOXIDE AND SOLUTION PHOSPHORUS WITH VAM FUNGI 1079
sampling dates of Exp. 1. Mean solution P, however,was actually lower for imposed CO2 treatments thanfor their indigenous counterparts on the last two sam-pling dates of Exp. 1. This occurred despite a threefoldincrease in mean column CO2 for the imposed CO2regime treatments.
Inoculated plants, in both experiments, removedmore P from the soil than either of the noninoculatedtreatments (Table 1). There were no significant differ-ences in total plant P between the noninoculated andnoninoculated/imposed CO2 regime treatments ineither experiment. Mean total plant P in Exp. 1 was4.34 ± 0.28 mg column"1 for the inoculated plantscompared to 3.11 ± 0.30 and 2.85 ± 0.21 mg col-umn"1 for noninoculated and noninoculated/imposedCO2 plants, respectively. In the second experiment,inoculated plants removed 50.83 ± 3.82 mg P col-umn'1 compared to 35.34 ± 3.59 and 27.34 ± 0.54mg P column-1 for noninoculated and noninoculatedwith imposed CO2 plants, respectively.
Concentrations of P in roots were not different forinoculated plants, as compared to the other planttreatments (Table 1). The mean tissue-P content ofshoot material was, however, higher for the inoculatedas compared to the noninoculated with imposed CO2
Table 2. Mean total P in solution throughput for indigenous CO2treatments.
Exp. 1 Exp. 2
Treatment8 Oct. 5 Nov. 31 Dec. 21 Jan. 2 Sept. 1 Oct. 5 Nov.1985 1985 1985 1986 1986 1986 1986
(I)Inoculated 2.80af 4.84a 5.81a 3.12a 3.01a 4.19a 2.70awheatgrass(II) 2.05a 2.48b 3.98a 2.91a 1.29b 1.14b 1.61aBare soil(III)Noninoculated 0.97a 2.37b 6.13a 3.89a 1.84b 1.93b 2.03awheatgrass
f Values within a sampling date followed by the same letter are not signifi-cantly different from each other as determined by Scheffe's multicomparisontest (P < 0.05).
17.0—,
15.0—
13.0—
^ 7.0
-1 6.0—"5
•3* 4.0—a." JI
2.0—
0.5-
EXPERIMENT1
NONINOCULATED WHEATGRASSBARE SOIL
I 1
J-S.E. (n-3)
10/8/85 H/5/85 12/31/85 1/21/86 9/2/86 10/1/86 11/5/86SAMPLING DATE
Fig. 4. Mean concentration of P in solution throughput from im-posed CO2 treatment columns.
treatment, in Exp. 1 only, with 33% lower mean shootP concentrations observed in plants exposed to theenhanced CO2 regimes. The minimum significant dif-ference (P < 0.05) for shoot-P associated with thetreatment comparisons of Exp. 2 (Table 1) was 996.12mg kg'1.
Solution-Phosphorus Control andCarbon Dioxide Effects
GEOCHEM calculated ion activities of Ca2+ andPO^- for postharvest saturation extracts were used tocalculate hydroxyapatite ion activity products (lAPs)as
IAP = 5p(Ca2+) + 3p(PO34~) + p(OH-) [I]
where parentheses denote activity and p denotes thenegative common logarithm. The IAP for hydroxy-apatite had a mean value of 51.5 ± 0.5. Ion activityproducts were also calculated for tricalcium phosphate[j8-Ca3(PO4)2] and brushite (CaHPO4-H2O) usingequations of a form similar to Eq. [1]. These lAPswere 29.7 ± 1.0 and 21.6 ± 0.5, respectively.
A positive response of solution P to CO2 level wasindicated for all segregated treatment-experimentcases except the bare soil treatment in both experi-ments and the noninoculated (without imposed CO2)treatment in Exp. 2 (Table 3). The relationships ob-served for the bare soil treatment and Treatment II inExp. 2 were very poor and had slopes that were notsignificantly different than zero. Plant and bare soilsystems with the imposed-CO2 treatments yielded thestrongest predictive relationships. In the case of theimposed-CO2 systems in Exp. 2, however, the goodlinear fits (Table 3) were largely a consequence of datagrouping, giving essentially two point relationships.The data were distributed in the CO2 ranges 0.35 to2.77 kPa and 7.28 to 9.90 kPa for the noninoculated,exogenous CO2 system and in the ranges 0.40 to 0.89kPa and 3.13 to 4.13 kPa for the bare soil, imposedCO2 system. Of the indigenous CO2 systems, the in-oculated wheatgrass treatment gave the strongest best-fit linear regression models. There were no significantdifferences between slopes for inoculated vs. nonino-
Table 3. Linear regression models for column CO2 and solutionthroughput phosphorus by treatment and experiment.
Treatment
(I)Inoculatedwheatgrass(II)Bare soil(III)Noninoculatedwheatgrass(IV)Bare soil/Imposed CO2regime(V)NoninoculatedwheatgrassImposed CO2regime
Experi-ment
1212
12
12
1
2
«
129
129
129
119
11
9
Intercept(A>)
2.071-0.324
2.1051.058
1.6611.531
1.1072.397
-1.428
1.173
SlopeG9,)
3.3882.9173.0641.152
4.5130.638
2.1101.507
3.215
1.476
t PR > ITI gives the probability of the slope being equal
R2
0.5710.5860.1610.220
0.3680.303
0.5950.887
0.794
0.825
to zero.
PR > mt(H:A,=0)
0.00450.01620.43840.2032
0.03650.1247
0.00540.0001
0.0002
0.0007
1080 SOIL SCI. SOC. AM. J., VOL. 53, JULY-AUGUST 1989
culated treatments or between the imposed CO2 treat-ments in either experiment. Slopes for indigenous CO2treatments were, however, different than slopes for theimposed CO2 treatments in both experiments.
DISCUSSIONThe generally increased root/soil system CO2 ob-
served for the inoculated as compared with nonino-culated systems cannot be solely attributed to respi-ration by VAM-fungi or their direct influence on rootrespiration. This is due to the absence of a plantedcontrol that had the same raw soil/root inoculum, butminus VAM fungal spores and hyphal fragments. Al-though the microbial biomass of both treatments hadquantitatively equilibrated by harvest in both exper-iments, we have no information on microbial com-position and cannot infer relative microbial contri-butions to the CO2 levels measured. Attributing theincreased CO2 exclusively to the prescence of mycor-rhizae is also compromised because of the greater rootmasses produced in the inoculated treatments. Theobservation of increased root/shoot ratios for the in-oculated plants is not wholly understood but has beenreported elsewhere for western wheatgrass (Miller etal., 1987).
The imposed CO2 treatment had a detrimental ef-fect on the growth of plants in both experiments. Thecause(s) for this are not understood. The introducedgas mixtures in these systems were hydrated througha train of aspargers and in the most extreme case didnot exceed 15 kPa partial pressure of CO2. We do notbelieve that the lower yields are a consequence ofeither root dessication or oxygen deprivation. It is alsounlikely that the diminished growth is a consequenceof a direct CO2 effect on plant physiology. Dimin-ished, as opposed to increased yield, as a function ofelevated atmospheric CO2, is uncommon in the lit-erature (Kimball, 1983). Unpublished data of Riech-ers (see Dahlman et al., 1985) indicated significantincreases in western wheatgrass yield when grown at3.00 kPa atmospheric CO2, a concentration compa-rable to mean levels of CO2 imposed belowground inour studies. Belowground enhancement of CO2 via en-richment of irrigation water has also largely favoredproduction (e.g., Mauney and Hendrix, 1988).
An explanation for reduced growth under elevatedCO2 was found by Idso et al. (1987). These workersreported a temperature-dependent growth response toCO2-enrichment for carrot [Daucus carota subsp. sa-tivus (Hoffm.), radish Arcang Raphanus saliva L. cv.,Cherry Belle, water fern Azolla pinnata R Br. Red-Cored chantenay), and cotton (Gossypium hirsutumL.). At temperatures below 18 °C, the biomass of con-trol plants was greater than that of CO2 enrichedplants. The possibility of a temperature related, neg-ative growth response to elevated CO2 in our experi-ments exists, but was not directly evaluated. The po-tential for CO2 or pH related shifts in the populationsof functional groups or particular species of micro-organisms also exists and may have favored thegrowth of pathogenic organisms or retarded thegrowth of beneficial rhizosphere organisms under theelevated CO2 environment. Microbial biomass in
these soils gave no qualitative information, but merelysuggests that total microbial biomass was quantita-tively the same for all treatments at harvest. Anotherpossibility for retarded growth of the imposed CO2treatment plants is the impaired uptake and translo-cation of P. Mauney and Hendrix (1988) reported sig-nificantly lower P in cotton growth with CO2-saturatedirrigation water, but total dry weights were dramati-cally increased. In our studies no differences in roottissue concentrations of P were observed but lowershoot-P concentrations were observed for the imposedCO2 treated plants compared to other plant treatmentsin one experiment. The levels of solution P wereequivalent or higher in throughput samples from theimposed CO2 treated columns than for other treat-ments, so P supply to roots was not limiting by com-parison. Decreased stomatal conductance and tran-spiration per leaf surface area at elevated atmosphericCO2 is well documented (Dahlman et al., 1985), butwhether P uptake and translocation to abovegroundplant parts would be subsequently affected is not clear.
The imposed CO2 regime treatments provide themost meaningful data for evaluating the mechanismof CO2-mediated Ca-phosphate dissolution, for tworeasons. First, the comparatively high and variableCO2 levels imposed provide a means of evaluating soilsolution-P response to a broad range of elevated CO2.Second, the soil and plant systems were continuallyexposed to elevated CO2 levels over the course of theexperiments. The effects of point to point and tem-poral variability in column system CO2 were thereforeminimized as compared to indigenous CO2 treat-ments. The data reflect these conditions with im-proved least squares, linear relationships between CO2and solution P for the imposed CO2 regime treat-ments. Interpretations outside the experimental con-ditions here, however, should be approached with cau-tion. The treatments had imposed CO2 levelsaveraging between 4 and 20 times their indigenousCO2 counterparts and levels were relatively constantover weekly intervals. These conditions do not reflectthose where CO2 is a consequence of biological activ-ity.
In a summary of reported solubility products (KsP)for hydroxyapatite, Wier et al. (1971) gave a range ofvalues pKsp = 54.6 to 58.3. This suggests that: (i) oursystems are either oversaturated with respect toCa5(PO4)3OH, (ii) the calcium apatite mineral hadundergone some degree of ispmorphous substitutionin the mixed soil system (Chien and Black, 1976), or(iii) another calcium phosphate mineral may be con-trolling solution P. Ion activity products calculated for/3-Ca3(PO4)2 and brushite (CaHPO4 • 2H2O) are alsoin general agreement with />Ksp values of 28.9 and18.9, respectively, given by Lindsay (1979). On thebasis of these solubility data, the presence of some Ca-phosphate mineral is inferred, but it is not possible toidentify a single mineral as the controlling phase.Brushite, however, may be ruled out on the basis ofsolubility analysis. For the mean pH (8.1) of thesesoils and assuming calcite controls solution Ca2+ ac-tivity, brushite in equilibrium with ambient CO2would be expected to impart P to solution at concen-trations on the order of 1Q-4 M (Lindsay, 1979), 10 to
KNIGHT ET AL.: ELEVATED CARBON DIOXIDE AND SOLUTION PHOSPHORUS WITH VAM FUNGI 1081
100 times greater than concentrations measured in oursoils.
Acknowledging the many pitfalls in the applicationof thermodynamics to biological systems, the total-soluble P data (10~5 — 10"6 M) can nonetheless serveas a speculative guideline. The experimental valuesfor total solution P and the response of P to CO2 var-iability found in this study greatly exceeds those pre-dicted by assuming P concentration to be regulated bya calcite-hydroxyapatite-CO2 equilibrium. The P databetter fit the predictions based on a calcium oxalate-hydroxyapatite-CO2 system, which assumes that Ca-oxalate (CaC2O4) controls the Ca2+ ion activity in so-lution (Jurinak et al., 1986). Those workers tentativelyidentified the presence of calcium oxalate crystals(whewellite) in the rhizosphere of plant treatmentsused in this study by electron microscopy, x-ray mi-croanalysis and gas chromatography.
This study does not provide the necessary chemicalinformation to make definitive conclusions regardingthe mechanism of P availability. The possibility, how-ever, that Ca-pxalate precipitating in the rhizosphereenhances calcium phosphate solubility with the con-current release of P is qualitatively supported. Theobservation of micromolar concentrations of total so-lution P in saturation throughput from all treatments(including implanted, bare soil treatments) suggeststhat Ca-oxalate, if existent in all systems, was residualmaterial present at the time the soils were collected.Additional studies on these systems are in progress toquantify oxalates and their potential influence, in con-cert with elevated soil CO2, on P availability via Ca-phosphate dissolution.
ACKNOWLEDGMENTSWe would like to thank Mr. Dan Duce, Ms. Virginia Pa-
lamo, and Ms. Pam Benjamin for their invaluable technicalassistance. A special thanks is extended to Dr. Edith B. Alienfor her critical involvement in many aspects of these inves-tigations.

1082 SOIL SCI. SOC. AM. J., VOL. 53, JULY-AUGUST 1989