elemental analysis using a handheld x-ray fluorescence ... · elemental analysis using a handheld...
TRANSCRIPT
U.S. Department of the InteriorU.S. Geological Survey
Fact Sheet 2016–3043June 2016
Elemental Analysis Using a Handheld X-Ray Fluorescence SpectrometerThe U.S. Geological Survey is collecting geologic samples from
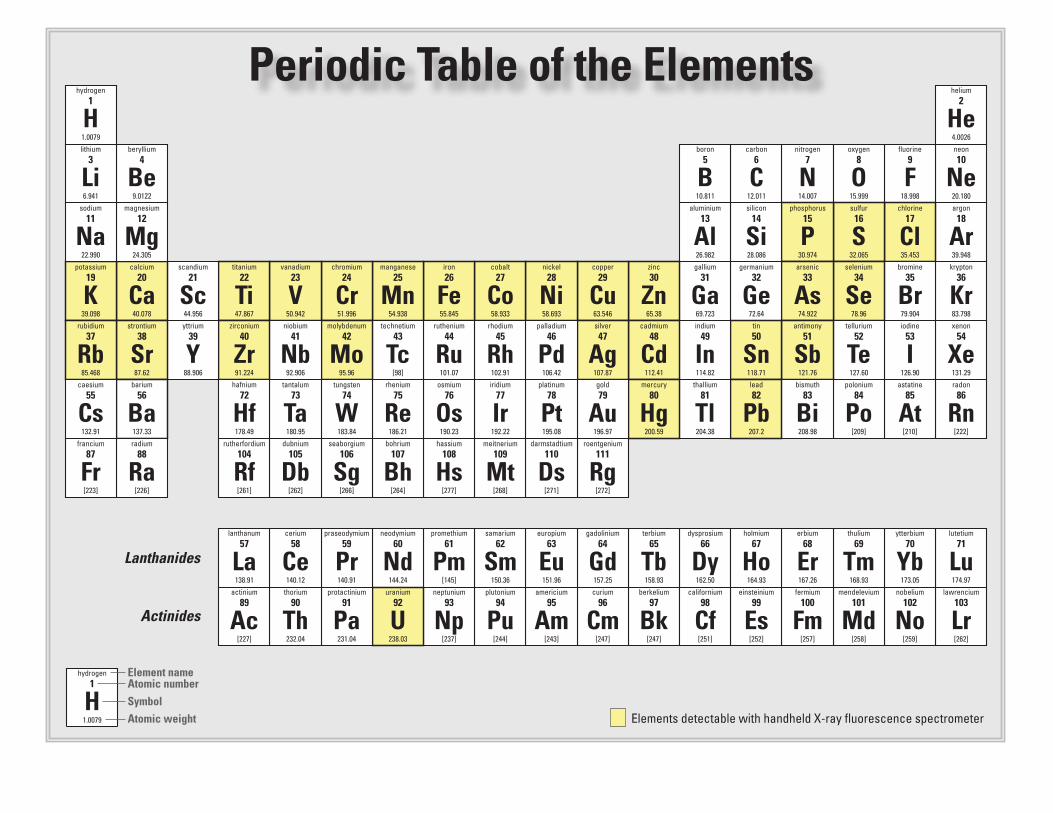
local stream channels, aquifer materials, and rock outcrops for studies of trace elements in the Mojave Desert, southern California. These samples are collected because geologic materials can release a variety of elements to the environment when exposed to water. The samples are to be analyzed with a handheld X-ray fluorescence (XRF) spec-trometer to determine the concentrations of up to 27 elements, includ-ing chromium (see “Periodic Table of the Elements” on back page).
Why are These Data Collected?The purpose of the XRF data is to determine the presence and
concentration of elements in local geologic materials. These data are used for the following purposes:• As a screening tool to guide further data collection and detailed
mineralogic and chemical analyses.
• To evaluate whether the alluvial material composing local aquifers and the trace elements in that material are from a local or more distant source.
• For comparison with the known, average compositions of various soils, alluvium, and rocks to evaluate past and present processes that could act on the alluvium and release trace elements to groundwater.
• For comparison to local and regional water-quality data to deter-mine which of the elements present could be released into ground-water from natural rather than human sources.
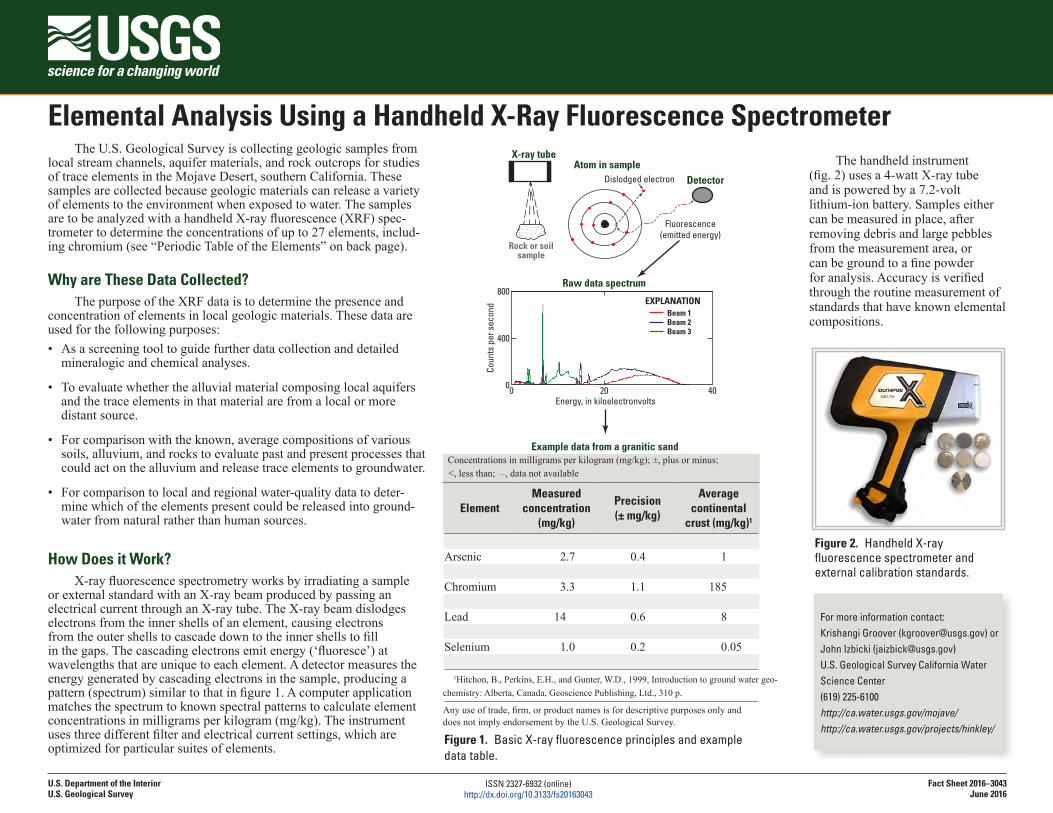
How Does it Work?X-ray fluorescence spectrometry works by irradiating a sample
or external standard with an X-ray beam produced by passing an electrical current through an X-ray tube. The X-ray beam dislodges electrons from the inner shells of an element, causing electrons from the outer shells to cascade down to the inner shells to fill in the gaps. The cascading electrons emit energy (‘fluoresce’) at wavelengths that are unique to each element. A detector measures the energy generated by cascading electrons in the sample, producing a pattern (spectrum) similar to that in figure 1. A computer application matches the spectrum to known spectral patterns to calculate element concentrations in milligrams per kilogram (mg/kg). The instrument uses three different filter and electrical current settings, which are optimized for particular suites of elements.
40200Energy, in kiloelectronvolts
Beam 3Beam 2Beam 1
Raw data spectrum
Example data from a granitic sand
EXPLANATION800
400
0
Coun
ts p
er s
econ
d
Fluorescence(emitted energy)
Dislodged electronAtom in sample
Detector
Rock or soilsample
X-ray tube
Concentrations in milligrams per kilogram (mg/kg); ±, plus or minus; <, less than; –, data not available
ElementMeasured
concentration (mg/kg)
Precision (± mg/kg)
Average continental
crust (mg/kg)1
Antimony <13 – 0.2Arsenic 2.7 0.4 1Calcium 9,320 50 53,000Chromium 3.3 1.1 185Iron 2,980 14 7,060Lead 14 0.6 8Manganese 85 1.7 950Selenium 1.0 0.2 0.05Uranium <2.9 – 2
1Hitchon, B., Perkins, E.H., and Gunter, W.D., 1999, Introduction to ground water geo-chemistry: Alberta, Canada, Geoscience Publishing, Ltd., 310 p.
Any use of trade, firm, or product names is for descriptive purposes only and does not imply endorsement by the U.S. Geological Survey.
Figure 1. Basic X-ray fluorescence principles and example data table.
The handheld instrument (fig. 2) uses a 4-watt X-ray tube and is powered by a 7.2-volt lithium-ion battery. Samples either can be measured in place, after removing debris and large pebbles from the measurement area, or can be ground to a fine powder for analysis. Accuracy is verified through the routine measurement of standards that have known elemental compositions.
Figure 2. Handheld X-ray fluorescence spectrometer and external calibration standards.
For more information contact:Krishangi Groover ([email protected]) or John Izbicki ([email protected])U.S. Geological Survey California Water Science Center(619) 225-6100http://ca.water.usgs.gov/mojave/http://ca.water.usgs.gov/projects/hinkley/
ISSN 2327-6932 (online)http://dx.doi.org/10.3133/fs20163043
nitrogen
14.007
N7
helium
He4.0026
2
neon
Ne20.180
10fluorine
F18.998
9oxygen
O15.999
8carbon
C12.011
6boron
B10.811
5
argon
Ar39.948
18chlorine
Cl35.453
17sulfur
S32.065
16phosphorus
P30.974
15silicon
Si28.086
14aluminium
Al26.982
13
krypton
Kr83.798
36bromine
Br79.904
35selenium
Se78.96
34arsenic
As74.922
33germanium
Ge72.64
32gallium
Ga69.723
31zinc
Zn65.38
30copper
Cu63.546
29nickel
Ni58.693
28cobalt
Co58.933
27iron
Fe55.845
26manganese
Mn54.938
25chromium
Cr51.996
24vanadium
V50.942
23titanium
Ti47.867
22scandium
Sc44.956
21calcium
Ca40.078
20potassium
K39.098
19
magnesium
Mg24.305
12sodium
Na22.990
11
beryllium
Be9.0122
4lithium
Li6.941
3
hydrogen
H1.0079
1
xenon
Xe131.29
54iodine
I126.90
53tellurium
Te127.60
52antimony
Sb121.76
51tin
Sn118.71
50indium
In114.82
49cadmium
Cd112.41
48silver
Ag107.87
47palladium
Pd106.42
46rhodium
Rh102.91
45ruthenium
Ru101.07
44technetium
Tc[98]
43molybdenum
Mo95.96
42niobium
Nb92.906
41zirconium
Zr91.224
40yttrium
Y88.906
39strontium
Sr87.62
38rubidium
Rb85.468
37
radon
Rn[222]
86astatine
At[210]
85polonium
Po[209]
84bismuth
Bi208.98
83lead
Pb207.2
82
dysprosium
Dy162.50
66terbium
Tb158.93
65gadolinium
Gd157.25
64europium
Eu151.96
63samarium
Sm150.36
62promethium
Pm[145]
61neodymium
Nd144.24
60praseodymium
Pr140.91
59cerium
Ce140.12
58lanthanum
La138.91
57
barium
Ba137.33
56caesium
Cs132.91
55
roentgenium
Rg[272]
111darmstadtium
Ds[271]
110meitnerium
Mt[268]
109hassium
Hs[277]
108bohrium
Bh[264]
107seaborgium
Sg[266]
106dubnium
Db[262]
105rutherfordium
Rf[261]
104radium
Ra[226]
88francium
Fr[223]
87
lutetium
Lu174.97
71ytterbium
Yb173.05
70thulium
Tm168.93
69erbium
Er167.26
68holmium
Ho164.93
67
thallium
Tl204.38
81mercury
Hg200.59
80gold
Au196.97
79platinum
Pt195.08
78iridium
Ir192.22
77osmium
Os190.23
76rhenium
Re186.21
75tungsten
W183.84
74tantalum
Ta180.95
73hafnium
Hf178.49
72
berkelium
Bk[247]
97lawrencium
Lr[262]
103nobelium
No[259]
102mendelevium
Md[258]
101fermium
Fm[257]
100einsteinium
Es[252]
99californium
Cf[251]
98curium
Cm[247]
96americium
Am[243]
95plutonium
Pu[244]
94neptunium
Np[237]
93uranium
U238.03
92protactinium
Pa231.04
91thorium
Th232.04
90actinium
Ac[227]
89
Elements detectable with handheld X-ray fluorescence spectrometer
hydrogen
H1.0079
1Element name
SymbolAtomic weight
Atomic number
Lanthanides
Actinides
Periodic Table of the Elements