electron backscatter diffraction (ebsd) in the sem ... · electron backscatter diffraction (ebsd)...
TRANSCRIPT
Electron backscatter diffraction (EBSD) in the SEM: applications to
microstructures in minerals and rocks and recent technological
advancements
Elisabetta Mariani a, D. J. Prior a, D. McNamara a, M. A. Pearce a, N. Seatonb, G.
Sewardc, D. Tatham a and J. Wheeler a
aDepartment of Earth and Ocean Sciences, University of Liverpool, Liverpool L69 3GP, UK bDepartment of Geology and Geophysics, University of Minnesota, Minneapolis, MN 55455, USA cDepartment of Geology, University of California, Santa Barbara, CA 93106-9630 USA
Abstract
Electron backscatter diffraction (EBSD) is based on the principle that a beam of
electrons generated in the scanning electron microscope (SEM) is the source of
randomly scattered electrons in a specimen. The backscattered electrons (BSE) that
escape the sample generate a Kikuchi pattern on a phosphor screen, which is linked to
the specimen crystal structure. Different crystal orientations generate different EBSPs.
EBSD provides orientation, misorientation and boundary measurements from a small
area (>1 μm) in a crystal and automated EBSD analysis is applied to an increasingly
large number of rock-forming minerals. Excellent results are obtained for example on
calcite and quartz and recent achievements include successful automated indexing of low
symmetry minerals such as feldspars and omphacite. The effective application of EBSD
to mineralogy and petrology has increased and includes detailed studies of
microstructures, twin boundaries, deformation mechanisms and metamorphic processes.
A technique for in-situ high temperature tensile deformation of minerals and rocks is
currently being developed.
Elisabetta Mariani et al 8
Introduction
The analysis of 1) crystallographic orientations and misorientations and 2) the
geometry and structure of subgrain and grain boundaries is fundamental to a
comprehensive petrographic study of any rock sample. In the past quantitative
information on 1) and 2) was gathered using the optical microscope combined with the
universal stage. However such measurements were time consuming and limited to a few
crystal symmetries. More recently new techniques have been developed which provide
high resolution (few 10s of nm) qualitative and quantitative 2D and 3D microstructural
data. These include computer-integrated polarization microscopy (CIP) (van Daalen et
al. 1999), electron backscatter diffraction (EBSD) (Prior et al. 1999), serial sectioning
using a focused-ion-beam (FIB) system in the SEM (Groeber et al. 2006) and
synchrotron X-Ray tomography (Mikulik et al. 2003). Of these techniques EBSD is the
more widely used in the Earth Sciences. It is fully automated, fast and allows collection
of accurate, reproducible and statistically meaningful crystallographic orientation data of
minerals belonging to any of the seven crystal systems (from cubic to triclinic). EBSD is
a very important tool to the mineralogist and petrologist as it allows testing of
microstructural models based on the distribution of crystallographic orientations (Prior et
al. 1999).
In this short contribution we review the basic principles of EBSD, analytical
procedures that are specific to mineral and rock samples and some applications to
mineralogy and petrology. Recent progress on in-situ heating and deformation
experiments is also addressed.
Basic principles of EBSD
High energy electrons from an electron beam interact with the target specimen in
many different ways. Broadly we may distinguish between 1) elastic interactions and 2)
inelastic interactions. In 1) the scattered electrons do not loose significant energy
compared to the primary electrons, whilst in 2) considerable energy is lost due to the
activation of a variety of physical processes in the specimen. A thorough review of
specimen-beam interactions is given in the software package MATTER
(www.matter.org.uk). The incident electron beam diameter is always larger than the
atomic spacing, thus, by interaction with a population of nuclei in the specimen, incident
Electron backscatter diffraction (EBSD) in the SEM: applications to microstructures in minerals and rocks and recent technological advancements
9
primary electrons will be scattered within the sample in all directions. High energy
electrons which exit the specimen via the surface of incidence after one or more
scattering events are backscatter electrons. Of these, those that satisfy the Bragg equation
for diffraction describe conical trajectories for each lattice plane. Such diffraction cones
approximate planes and may be imaged on a phosphor screen as sub-parallel diffraction
lines (bands). A network of diffraction lines forms an electron backscatter diffraction
pattern (EBSP) or Kikuchi pattern. Intersecting bands result in bright spots on the EBSP
which correspond to zone axes. Thus elements of symmetry can be recognized in
EBSPs. Kikuchi patterns may be imaged in the transmission electron microscope (TEM)
as well as in the SEM (e.g. by electron channelling (Lloyd et al. 1987). In this
contribution we focus on EBSD in the SEM (Randle 1992 and Prior et al. 1999). The
resolution of EBSD is a function of the accelerating voltage, which controls the depth of
penetration of the electrons in the specimen (activation volume). The smaller the
activation volume, the higher the resolution. Also, an angle of incidence of 70° between
the electron beam and the specimen normal results in a statistically higher number of
BSE emitted from within few tens of nm of the sample surface and thus in a clearer
EBSD signal. In a field emission (FE) SEM, at 70° tilt angle and 20 kV accelerating
voltage the resolution of EBSD is < 1 μm and sometimes as low as 30-100 nm. The
quality of EBSPs is controlled by the beam current (or spot size). A large spot size is
required to obtain sharp EBSPs, however this reduces special resolution. Thorough
descriptions of the principles of EBSD are given by Randle (1992) and Prior et al. 1999.
Problems with resolution and quality of EBSPs mainly due to charging in non-
conductive materials such as rocks and minerals have been largely overcome by coating
with a very thin layer of carbon the specimen surface.
Using EBSD
Sample preparation
The surface of interest must be smooth to avoid shadowing caused by topography.
This can be achieved by mechanical polishing. The amorphous layer produced during
mechanical polishing may be removed using chemo-mechanical polishing. The latter
results in a surface of pristine lattice that is required for orientation analyses by EBSD. A
large number of rock forming minerals can be chemo-mechanically polished
Elisabetta Mariani et al 10
successfully. Nevertheless particular care must be taken when polishing hydrophilic
minerals such as for example NaCl or gypsum. Ion-beam milling techniques may be
explored for polishing phyllosilicates, EBSD analysis of which is currently limited to the
basal planes due to difficulties in achieving satisfactory polishing of any other
orientation.
EBSD geometry
The specimen and the phosphor screen are positioned in the chamber so that a large
(~90°) angular range can be obtained on EBSPs. The projection of the source of BSE on
the phosphor, along a trajectory at 90° to it, generates the patter centre (PC). The closer
the phosphor and the specimen (i.e. the shorter the distance, DD, between the source
point and the pattern centre) the larger the angular range of the EBSP imaged. This
yields better quality pattern images that are then easier to index. A digital camera, with
axis orthogonal to the phosphor screen, is positioned behind the latter.
The positioning of the phosphor is generally restricted by chamber geometry, number
of existing detectors and in-situ experimental requirements. To date only 2 SEMs (at
Liverpool and Montpellier) have been purposely built to optimize EBSD data
acquisition, both standard and during in-situ experiments.
Data acquisition set-up
EBSD data can be acquired using dedicated software packages supplied by Oxford
Instruments HKL and TSL Crystallography.
In order to index EBSPs it is necessary to calculate the solid angle between the cones
that project as bands on the phosphor screen. Thus a calibration of the EBSD geometry is
needed where the position of the pattern centre and the detector distance may be
obtained from the EBSP image of a known material (e.g. Si) in a known orientation.
Refinement of the initial calibration should be performed before any manual or
automated EBSD work is carried out.
The polychromatic component of electron scattering generates a background signal
that affects the quality of EBSPs. Correction for the background signal can be applied
within the dedicated software packages. This involves collecting the signal at very low
Electron backscatter diffraction (EBSD) in the SEM: applications to microstructures in minerals and rocks and recent technological advancements
11
magnification in scanning mode and then averaging and subtracting it from the EBSP
signal.
Indexing an EBSP involves calculating the position and orientation of bands with
respect to the PC thus obtaining the specimen crystallographic orientation at the source
point. Indexing algorithms require knowledge of the crystal symmetry, the lattice
parameters and the number of lattice planes that give bands on EBSPs (refractors).
Correct indexing by the software can be assessed by rigorous comparison of the
simulation bands with the live EBSP bands (Winkelmann et al. 2007). Whilst interactive
(manual) indexing is available in the software, fully automated EBSD (e.g. Juul Jensen
and Schmidt 1990) has become common practice on a large number of rock forming
minerals. Very recent advancement in the EBSD detector and software technology allow
faster data collection than was ever possible before, at top speeds of 600 data points per
second. Additionally combined acquisition of EBSD and EDS data is now possible,
although this hampers the speed of the acquisition.
EBSD provides us with orientation and misorientation distribution datasets for a
given crystalline material (Wheeler et al 2001). Knowledge of the relationship between
the specimen surface and the microscope, kinematic and geographic reference frames
allows interpretation of data from rock samples at the regional scale. Also, information
on the 2D geometry of grain boundaries can be obtained from EBSD data. Recently
developed non-standard data processing analysis enables calculation of the distribution
of grain boundary planes from EBSD data in cubic materials (Randle 2006).
Applications of EBSD in mineralogy and petrology
A comprehensive review of a number of different applications of the EBSD
technique in petrology is given by Prior et al. 1999. Since then significant progress in
sample preparation and in both EBSD hardware and software technology has occurred
and the effective application of EBSD to mineralogy and petrology has increased
exponentially (e.g. Storey and Prior 2005, Halfpenny et al. 2006, Pennock et al. 2006,
Barrie et al. 2007). Excellent to satisfactory EBSD datasets (depending on the quality of
polishing, material characteristics and working conditions) can be acquired from a large
Elisabetta Mariani et al 12
number of rock forming minerals of different crystal symmetry including calcite, quartz,
feldspars, pyroxenes, amphiboles and many others.
The good EBSD results obtained for calcite and quartz (>78% successful indexing
and statistical significance resulting from full automation) have allowed focussing on the
detailed study of microstructural features and dauphine twin boundaries in quartz and
curved twin boundary in calcite that cannot be recognised using the optical microscope.
A case study is reported below.
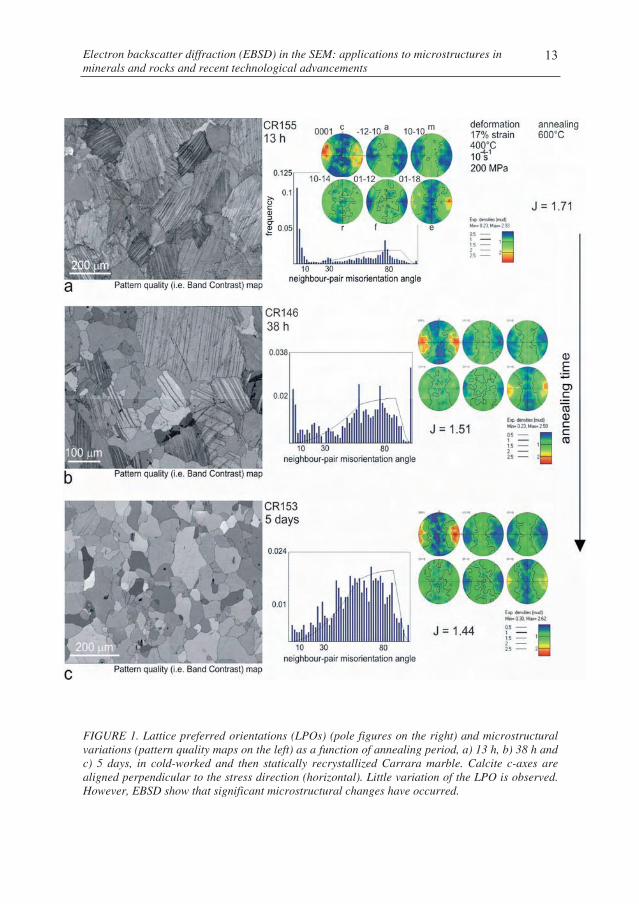
Detailed EBSD analyses of cold-worked and then statically recrystallized Carrara
marble show that, although little or no variation of the lattice preferred orientation (LPO)
is observed throughout a wide range of testing conditions, significant microstructural
changes have occurred (see pattern quality maps and pole figures in Fig. 1 a, b and c)
(Mariani work in progress). In order to reconcile these observations we investigate
textural evolution locally, within the microstructure. Strain free, incipient lattice nuclei
form during the initial deformation and subsequently develop, during annealing,
predominantly along existing grain boundaries and deformation twin lamellae. The
newly formed grains preserve LPOs similar to those of the pre-existing grains. They also
show high angle misorientation relationships to their parent grains and twin lamellae.
Recurrent misorientation angles of ~ 30°, 60° and 90° are interpreted to be generated by
initial subgrain rotation recrystallization, followed by grain boundary migration, of both
parent and deformation twin grain boundaries. Thus twin boundaries play an important
role in both the static and dynamic recrystallization behaviour of some rock-forming
minerals and should be accounted for in microphysical models of recrystallization.
Electron backscatter diffraction (EBSD) in the SEM: applications to microstructures in minerals and rocks and recent technological advancements
13
FIGURE 1. Lattice preferred orientations (LPOs) (pole figures on the right) and microstructural variations (pattern quality maps on the left) as a function of annealing period, a) 13 h, b) 38 h and c) 5 days, in cold-worked and then statically recrystallized Carrara marble. Calcite c-axes are aligned perpendicular to the stress direction (horizontal). Little variation of the LPO is observed. However, EBSD show that significant microstructural changes have occurred.
Elisabetta Mariani et al 14
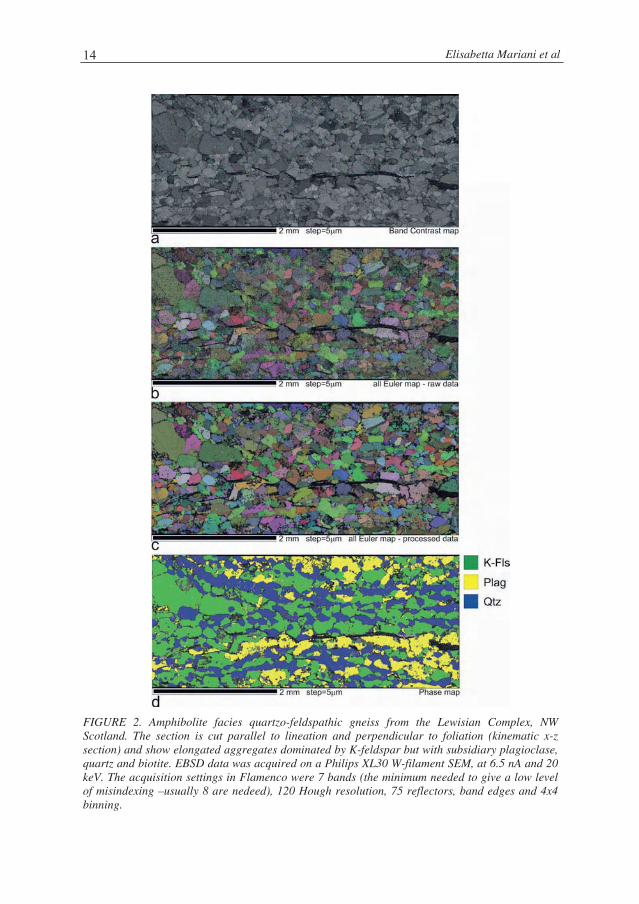
FIGURE 2. Amphibolite facies quartzo-feldspathic gneiss from the Lewisian Complex, NW Scotland. The section is cut parallel to lineation and perpendicular to foliation (kinematic x-z section) and show elongated aggregates dominated by K-feldspar but with subsidiary plagioclase, quartz and biotite. EBSD data was acquired on a Philips XL30 W-filament SEM, at 6.5 nA and 20 keV. The acquisition settings in Flamenco were 7 bands (the minimum needed to give a low level of misindexing –usually 8 are nedeed), 120 Hough resolution, 75 reflectors, band edges and 4x4 binning.

Electron backscatter diffraction (EBSD) in the SEM: applications to microstructures in minerals and rocks and recent technological advancements
15
One of the recent achievements in EBSD is successful automated analysis of very
low symmetry minerals (triclinic and monoclinic) such as feldspars and some pyroxenes
(e.g. omphacite). In Fig. 2 we report an EBSD case study of an amphibolite facies
quartzo-feldspathic gneiss from the Lewisian Complex, NW Scotland (Pearce work in
progress). In this specimen elongated aggregates dominated by K-feldspar with
subsidiary plagioclase, quartz and biotite can be observed in the ‘tails’ of large
porphyroclasts. Both K-feldspar and plagioclase were indexed using triclinic crystal
symmetry. Lattice parameters for the two minerals are very similar only differing
significantly in the angle. However this appears to be enough for the software to
distinguish between the minerals in a statistically significant number of cases (Fig. 3). It
is observed that misindexing in feldspars is more common than in other minerals.
Orientations that are misoriented by 180° (pericline and albite twin laws) have very
similar patterns that may differ only by one band. Thus certain orientations may be
significantly affected by systematic misindexing problems. Some phase misidentification
may also occur in feldspars. Misidentification and misindexing can be carefully
processed out of the dataset in the post-processing stage thus allowing LPOs and
boundary analysis for the whole mineral assemblage and interpretation the
deformation/recrystallization mechanisms.
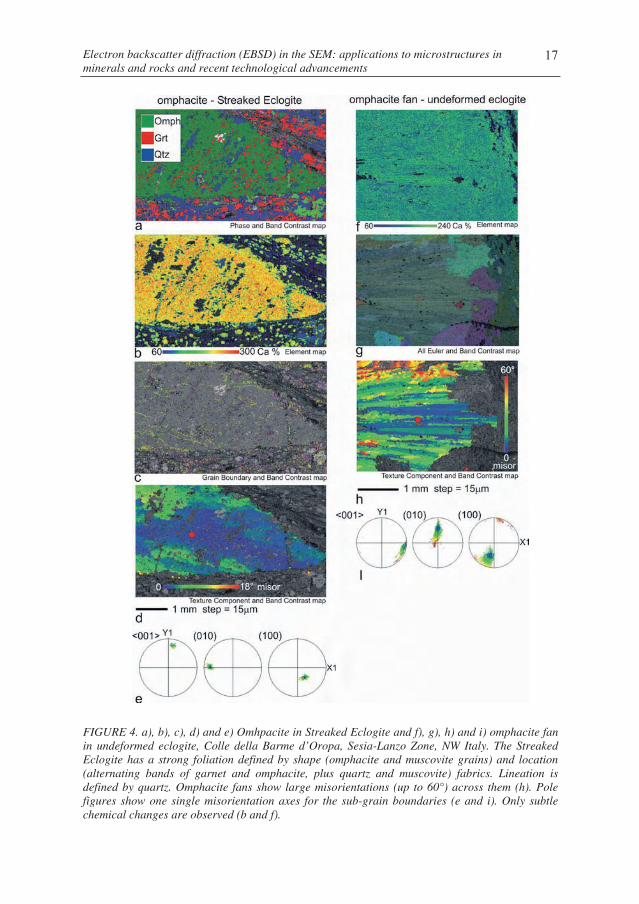
EBSD combined with chemical analysis of omphacite from the Streaked Eclogite,
Sesia-Lanzo Zone, NW Italian Alps, is a key tool to understanding how this mineral
forms strong LPOs and what is the role of mechanisms such as dislocation creep,
pressure solution and grain growth (McNamara work in progress) (Fig. 4). Comparison
of the EBSD and EDS results on the omphacite from the Streaked Eclogite with results
from omphacite fans growing in an undeformed eclogite from the same locality, suggest
that the pronounced subgrain structure observed may originate during grain growth and
not during deformation. Chemical analysis show subtle or no chemical variations in the
omphacite (Fig 4).

Elisabetta Mariani et al 16
FIGURE 3. Three feldspar patterns, a), b) and c) from a perthite grain indexed manually using Channel 5 Flamenco. Plagioclase 1 and K-Feldspar are the same orientation, plagioclase 2 exhibits an albite twin relationship with plagioclase 1 (180 around [201]). Also shown are the key differences from plagioclase 1 (on the right). Bands highlighted on plagioclase 1 are those that are not present in K-feldspar (green dashed) and plagioclase 2 (yellow dashed).
Electron backscatter diffraction (EBSD) in the SEM: applications to microstructures in minerals and rocks and recent technological advancements
17
FIGURE 4. a), b), c), d) and e) Omhpacite in Streaked Eclogite and f), g), h) and i) omphacite fan in undeformed eclogite, Colle della Barme d’Oropa, Sesia-Lanzo Zone, NW Italy. The Streaked Eclogite has a strong foliation defined by shape (omphacite and muscovite grains) and location (alternating bands of garnet and omphacite, plus quartz and muscovite) fabrics. Lineation is defined by quartz. Omphacite fans show large misorientations (up to 60°) across them (h). Pole figures show one single misorientation axes for the sub-grain boundaries (e and i). Only subtle chemical changes are observed (b and f).
Elisabetta Mariani et al 18
In-situ heating and deformation experiments
Static in-situ high-temperature EBSD and SEM imaging experiments on metals and
rock-forming minerals have proved successful in the observation and quantification of
recrystallization and phase transformations up to ~1000oC (e.g. Seward et al. 2004 and
Bestmann et al. 2005). The range of samples that can be analysed is somewhat limited
by the material properties and the operating conditions of the SEM. An interplay exist
between 1) the attainment of temperatures suitable for studying recrystallization
processes on experimental timescales, 2) preserving the integrity of lattice structure at
temperature, and 3) avoiding sample deterioration by heating (e.g. calcite) or reduced
grain boundary mobility (e.g. quartz) at reduced pressure conditions in the SEM.
A custom-designed sample stage for the CamScan X500 FEG-SEM at Liverpool
incorporates a high-temperature heating system with a deformation rig, permitting
simultaneous heating and tensile deformation of samples with real-time EBSD analysis
and conventional SEM imaging (Tatham work in progress). Although the deformation
stage is undergoing significant hardware and software development in order to optimise
the assembly for crystal-plastic deformation of geological materials, preliminary
deformation experiments on copper samples have provided useful results and are
promising for future work.
Summary
Electron backscatter diffraction is now a commonly used analytical tool in the Earth
Sciences. It provides a measure of the full crystallographic orientation of crystalline
materials > 1 μm in size and fully automated EBSD can be successfully applied to a
large number of rock-forming minerals. In-situ high temperature tensile deformation
capability for rocks and minerals is being developed at Liverpool.
References Barrie, C. D., Boyle, A.P. et al. (2007). Jour. Structural Geol., 29, 1494-1511. Bestmann M., Piazolo, S. et al. (2005). Jour. Structural Geol. 27, 447-457. Groeber, M. A., Haley, B.K. et al. (2006). Materials Characterization 57(4-5), 259-273. Halfpenny, A., Prior, D.J. et al. (2006). Tectonophysics 427(1-4), 3-14.
Electron backscatter diffraction (EBSD) in the SEM: applications to microstructures in minerals and rocks and recent technological advancements
19
Juul Jensen,D. and Schmidt, N.H. (1990). An automatic on-line technique for determination of crystallographic orientation by EBSP. In P. Chandra, Ed., Proceedings, Recrystallization 90. 219-224.
Lloyd, G. E., C. C. Ferguson, et al. (1987). Tectonophysics,135, 243-249. Mikulik, P., Lubbert, D. et al. (2003). Jour. Physics D-Appl. Physics, 36(10A), A74-
A78. Pennock, G. M., Drury, M.R. et al. (2006). Jour. Structural Geol., 28(4),588-601. Prior, D. J., Boyle, A.P. et al. (1999). Amer. Mineral., 84, 1741-1759. Randle, V. (1992). Microtexture determination and its applications. London, The
Institute of Materials. pp 174. Randle, V. (2006). Jour. Microscopy 222, 69-75. Seward, G. G. E., Celotto, S. et al. (2004). Acta Materialia 52(4), 821-832. Storey, C. D. and Prior, D.J. (2005). Jour. Petrol. 46(12), 2593-2613. van Daalen, M., Heilbronner, R. et al. (1999). Tectonophysics 303(1-4), 83-107. Wheeler J, Prior D.J. et al. (2001). Contrib. Mineral. Petrol., 141 (1) 102-124. Winkelmann, A., Trager-Cowan, C. et al. (2007). Ultramicroscopy. 107, 414-421.