electrolytic conductivity of semiarid soils (southeastern spain) in relation to ion composition
TRANSCRIPT
This article was downloaded by: [University of Auckland Library]On: 19 November 2014, At: 17:54Publisher: Taylor & FrancisInforma Ltd Registered in England and Wales Registered Number: 1072954 Registeredoffice: Mortimer House, 37-41 Mortimer Street, London W1T 3JH, UK
Arid Land Research and ManagementPublication details, including instructions for authors andsubscription information:http://www.tandfonline.com/loi/uasr20
Electrolytic Conductivity of SemiaridSoils (Southeastern Spain) in Relation toIon CompositionJ. A. Hernández Bastida a , N. Vela De Oro a & R. Ortiz Silla aa Department of Agricultural Chemistry , Murcia, SpainPublished online: 17 Aug 2010.
To cite this article: J. A. Hernández Bastida , N. Vela De Oro & R. Ortiz Silla (2004) ElectrolyticConductivity of Semiarid Soils (Southeastern Spain) in Relation to Ion Composition, Arid Land Researchand Management, 18:3, 265-281, DOI: 10.1080/15324980490451348
To link to this article: http://dx.doi.org/10.1080/15324980490451348
PLEASE SCROLL DOWN FOR ARTICLE
Taylor & Francis makes every effort to ensure the accuracy of all the information (the“Content”) contained in the publications on our platform. However, Taylor & Francis,our agents, and our licensors make no representations or warranties whatsoever as tothe accuracy, completeness, or suitability for any purpose of the Content. Any opinionsand views expressed in this publication are the opinions and views of the authors,and are not the views of or endorsed by Taylor & Francis. The accuracy of the Contentshould not be relied upon and should be independently verified with primary sourcesof information. Taylor and Francis shall not be liable for any losses, actions, claims,proceedings, demands, costs, expenses, damages, and other liabilities whatsoever orhowsoever caused arising directly or indirectly in connection with, in relation to or arisingout of the use of the Content.
This article may be used for research, teaching, and private study purposes. Anysubstantial or systematic reproduction, redistribution, reselling, loan, sub-licensing,systematic supply, or distribution in any form to anyone is expressly forbidden. Terms &Conditions of access and use can be found at http://www.tandfonline.com/page/terms-and-conditions

Electrolytic Conductivity of Semiarid Soils(Southeastern Spain) in Relation to
Ion Composition
J. A. HERNANDEZ BASTIDAN. VELA DE OROR. ORTIZ SILLA
Department of Agricultural ChemistryGeology and PedologyUniversity of MurciaMurcia, Spain
Salt-affected soils are frequent in arid and semiarid regions, where the resulting ill-effects on plant growth and the difficulties for proper soil management makeknowledge of the total soil salt content essential. In this study, the relation betweenthe electrolytic conductivity (EC) soil saturation and the 1:1 soil:solution extracts,the salt content, and various saline parameters were analyzed. Ionic characterizationdata referring to agricultural soils from a semiarid zone (Murcia, southeasternSpain) were used to study the relationship between EC and ion composition. Sixtysamples per depth (0–30 cm, 30–60 cm and 60–90 cm) were taken in two years. EC,and Naþ , Kþ, Ca2þ , Mg2þ, Cl�, NO3
�and SO42�concentrations were measured in
both extracts. Total dissolved salts (TDS), sodium adsorption ratio (SAR), andtotal anions and cations were calculated from the relevant data to determine anycorrespondences among them using Spearman rank correlations. The mean ECvalues ranged from 0.56 to 0.93 S m�1 and the TDS values from 173 mmolc L
�1 to288 mmolc L
�1 in the soil saturation extract and from 0.49 to 0.75 S m�1 and 153 to233 mmolc L�1, respectively, in the 1:1 soil extract. The correlation coefficientbetween EC and NO3
�, Kþ and Ca2þ (r< 0.70) was lower than between EC andNaþ, Mg 2þ , Cl�, and SO4
2�(r > 0.85) in the saturation extract, in which a stronginfluence of the ionic ratios (SO4
2�=Cl�, Ca2þ=Naþ and Mg 2þ=Naþ) were evi-dent. Increased concentrations of Mg2þ, Ca 2þ and SO4
2�were not always matchedby increases in EC values, suggesting that the measurement of EC in the saturationextract was a good saline content indicator only when the salt content was low, butwas less suitable in the presence of high Cl�or Naþ concentrations. The behavior ofthe ions in the 1:1 soil:solution extract was the same. The best correlation modelbetween the EC values measured in the saturation and 1:1 extracts was a third orderpolynomial, although good results were obtained with linear and quadratic models.
Keywords correlation model, EC modeling, salt affected soils, saturationextract, sodium adsorption ratio, total dissolved salts
Received 21 April 2003; accepted 26 January 2004.Address correspondence to Dr. J. A. Hernandez Bastida, Department of Agricultural
Chemistry, Geology and Pedology, University of Murcia, Campus Universitario deEspinardo, 30.100 Espinardo, Murcia, Spain. E-mail: [email protected]
Arid Land Research and Management 18: 265–281, 2004
Copyright # Taylor & Francis
ISSN: 1532-4982 print/1532-4990 online
DOI: 10.1080=15324980490451348
265
Dow
nloa
ded
by [
Uni
vers
ity o
f A
uckl
and
Lib
rary
] at
17:
54 1
9 N
ovem
ber
2014
Agricultural development in arid and semiarid areas is often related to theinstallation of irrigation systems, although the benefits derived from such agri-cultural practices are not always sustainable. The limited adequate water supplywater has led to the use of lower quality and less desirable irrigation water inmany areas throughout the world, giving rise, in many cases, to salinizationproblems.
Natural (saline parent material, depressed topographical position, poordrainage, etc.) and anthropogenic (use of low quality water, excess of fertilizers,unsuitable irrigation systems, etc.) causes provoke an accumulation of salts in thesoil (Hernandez & Faz, 1993; Kuchanwar et al., 1999; Pla-Sentıs, 1997; Rhoadeset al., 1999; Sharma et al., 2000; Toth & Blasco, 1998; Vairagade et al., 2002;Wienhold & Trooien, 1998). Salinization leads to a partial or total loss of theproductive capacity of a soil because it causes a degradation of its chemical andphysical properties. Worldwide, the productive capacity of 1.5 million ha ofirrigated soils has decreased by 25 to 50% due to salinity problems (Pla-Sentıs,1997).
The management of irrigated soils often requires the frequent monitoring ofchanges in soil salinity status, while the dynamics of soluble salts, which is the mostcharacteristic feature of salt-affected soils, depends on the amount and type ofsoluble salts concerned. The predominant salt type is important because of the effectof individual ions on the soil properties and the possibility that they may be toxic toplants.
Many authors have studied the possible relationship between electrolyticconductivity (EC) and the salt concentration of a soil in an attempt to assess thevalidity of this parameter as an indicator of soil salinity. Richards (1974) estab-lished a lineal relationship between EC and total dissolved salts (TDS), while otherauthors have demonstrated that a lineal correlation does not always exist betweenthe EC and the corresponding ionic species (Alvarez et al., 1997; Chang et al.,1983; Darab et al., 1980; Rhoades et al., 1989; Simon et al., 1994). The formationof ionic pairs, mainly Ca2þ , Mg2 and SO4
2� ions (Alzubaidi & Webster, 1983;Timpson & Richardson, 1986), in highly saline solutions is the main cause of thisanomaly, because ion mobility in the extract is decreased (Csillag et al., 1995;Darab et al., 1980; Marion & Babcock, 1976; Sposito, 1984). Therefore, the typesof soluble salt and their concentration levels will directly influence the correlationmodel. For this reason, it is difficult to find a general equation to relate EC andTDS in all cases.
In recent years numerous methods for the in situ measurement of soil salinity(soil extract, suction probe, four electrodes sensor, or electromagnetic sensor) havebeen used because of the need to establish operative programs of diagnosis andcontrol of salinization processes in the soils (Aragues et al., 1986). The most widelyused parameter to evaluate soil salinity is EC of the saturation extract (Bower &Wilcox, 1965). From this extract, the different ionic species and other salineparameters, such as TDS, sodium adsorption ratio (SAR), and total cations andanions, can be obtained, thus providing a complete definition of soil salinity.However, because of the difficulties and the time required to obtain soil saturationextract, other soil:water relations are commonly used, such as 1:1, 1:2, 1:5 and 1:10,although these solutions do not provide such a precise picture of the properties of asaline soil (Rhoades, 1978).
The purpose of this study was to establish possible correlations between thesoil salt content and some ion concentrations in the saturation extract when theelectrolytic conductivity (EC) is higher than 1 S m�1, because such correlations arenormally poor in these conditions. In addition, correlations between EC of the soilsaturation extract and of the 1:1 soil:solution extract are compared because thesecond method is more rapid and easier to apply.
266 J. A. Hernandez Bastida et al.
Dow
nloa
ded
by [
Uni
vers
ity o
f A
uckl
and
Lib
rary
] at
17:
54 1
9 N
ovem
ber
2014
Materials andMethods
Area Description
The study was carried out in an area of the Guadalentın Valley (Murcia, SE Spain)limited by the coordinates 37� 420 3800 to 37� 500 000 N and 1� 220 1000 to 1� 300 200 Wand with an approximate surface area of 100 km2. This area is part of an alluvialplain originated by the Guadalentın River, which passes through a tectonicdepression. The plain was gradually filled by sediments during the late Quaternaryand has a slight slope, resulting in material being transported from nearby hillslopesto more depressed zones, where the salts dissolved from the saline material and fromsoil fertilization practices are accumulated.
The study area has a Mediterranean climate, annual evapotranspiration ofabout 870mm, a mean annual rainfall of about 300mm, falling mainly in autumnand spring, and a mean annual temperature of above 17�C.
The moisture regime of these soils is aridic and the temperature regime is thermic(Soil Survey Staff, 1999). Their main use is agricultural, although dryland crops havegradually been replaced by horticultural crops, in spite of the water deficit. The soilsdeveloped in these conditions from silty sediments of the valley are mostly gypsiri-endosalic or gypsiri-hiposalic Fluvisols and sodic, gypsic, or haplic Solontchaks(FAO - ISRIC - ISSS, 1998). Sodic, calcic, or haplic Gypsisols are also represented inthe study area (Vela, 2002).
Sixty sampling points from the arable layer (0–30 cm), 30–60 cm and 60–90 cmwere taken in autumn (rainfall period) according to a regular sampling grid of1.5 km2 in 1996 and 1998 (n ¼ 360). The sampling points coincided with thoseestablished in 1990 to draw up the soil map (Alıas et al., 1992).
Methods
Electrolytical conductivity (EC) was measured in the soil saturation extractsaccording to the method proposed by Bower and Wilcox (1965) and in the 1:1 soilsolution extract using a Crison-micro CM2110 conductivimeter; the results wereexpressed in S m�1 at 25�C. The 1:1 soil extract was determined only in the secondsampling (1998). The ions in the extracts were determined as follows: Cl�, NO3
�
and SO42� in a Dionex DX500 Ionic Chromatograph with ED40 detector, GP46
pump, and AS14 column for anions; cations in a Perkin-Elmer 1100B AtomicAbsorption Spectrophotometer, Ca2þ and Mg2þ by flame and Naþ and Kþ byemission spectroscopies (results expressed in mmol L�1 in the extracts). TDS, totalanions and cations were obtained by summation of the anions and cations. SARvalues were calculated from the relevant data according to Richards (1974).
Correlation analyses (Spearman rank correlations) were made to ascertain therelationship between the concentrations of the different ions, the saline parametersand EC (saturation and 1:1 soil extracts), and the concentration of each ion, totaldissolved solids (TDS), total anions and cations versus EC were plotted. The cor-relation (r) and determination (R2) coefficients, standard errors of estimation, andregression equations were obtained from samples with EC values ranging from 0.2 to4 S m�1. In addition, the Ca2þ=Naþ , Mg2þ=Naþ and SO4
2�=Cl� ratios werecalculated to quantify variations in the soil’s ionic balance. SPSS# Inc. 11.0,SIGMASTAT# SPSS Inc. 2.0, and SIGMAPLOT# SPSS Inc. 5.0 for Windowswere the programs used.
Results and Discussion
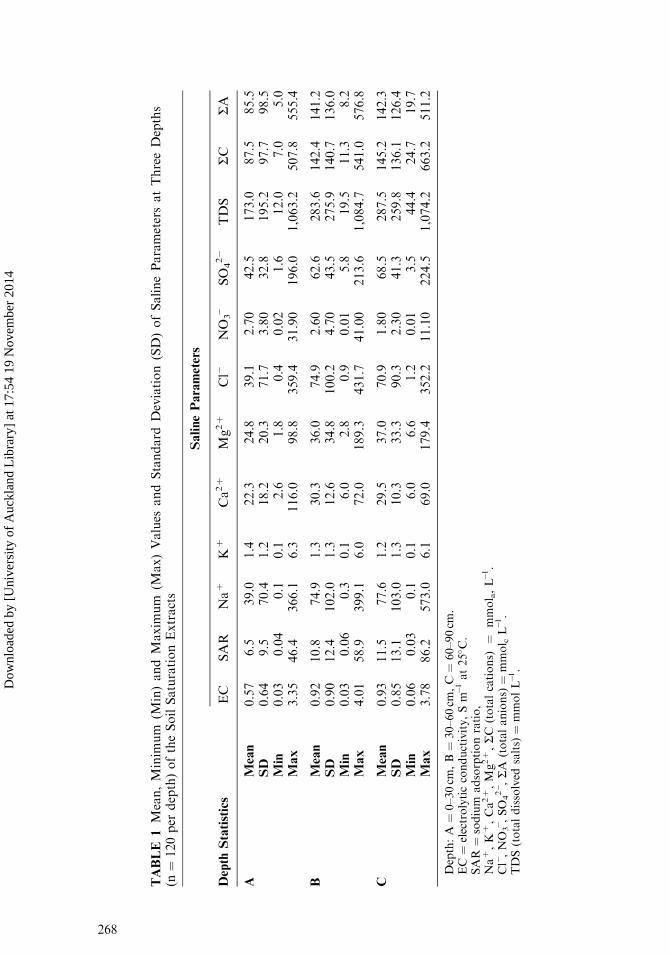
The mean EC and TDS values (Table 1) of the second soil layer (b) are higherthan those of the arable layer (a) and similar to those shown by the lowest layer
Electrolytic Conductivity of Semiarid Soils 267
Dow
nloa
ded
by [
Uni
vers
ity o
f A
uckl
and
Lib
rary
] at
17:
54 1
9 N
ovem
ber
2014
TABLE
1Mean,Minim
um
(Min)andMaxim
um
(Max)Values
andStandard
Deviation(SD)ofSalineParametersatThreeDepths
(n¼
120per
depth)oftheSoilSaturationExtracts
SalineParameters
Depth
Statistics
EC
SAR
Naþ
Kþ
Ca2þ
Mg2þ
Cl�
NO
3�SO
42�
TDS
SC
SA
AMean
0.57
6.5
39.0
1.4
22.3
24.8
39.1
2.70
42.5
173.0
87.5
85.5
SD
0.64
9.5
70.4
1.2
18.2
20.3
71.7
3.80
32.8
195.2
97.7
98.5
Min
0.03
0.04
0.1
0.1
2.6
1.8
0.4
0.02
1.6
12.0
7.0
5.0
Max
3.35
46.4
366.1
6.3
116.0
98.8
359.4
31.90
196.0
1,063.2
507.8
555.4
BMean
0.92
10.8
74.9
1.3
30.3
36.0
74.9
2.60
62.6
283.6
142.4
141.2
SD
0.90
12.4
102.0
1.3
12.6
34.8
100.2
4.70
43.5
275.9
140.7
136.0
Min
0.03
0.06
0.3
0.1
6.0
2.8
0.9
0.01
5.8
19.5
11.3
8.2
Max
4.01
58.9
399.1
6.0
72.0
189.3
431.7
41.00
213.6
1,084.7
541.0
576.8
CMean
0.93
11.5
77.6
1.2
29.5
37.0
70.9
1.80
68.5
287.5
145.2
142.3
SD
0.85
13.1
103.0
1.3
10.3
33.3
90.3
2.30
41.3
259.8
136.1
126.4
Min
0.06
0.03
0.1
0.1
6.0
6.6
1.2
0.01
3.5
44.4
24.7
19.7
Max
3.78
86.2
573.0
6.1
69.0
179.4
352.2
11.10
224.5
1,074.2
663.2
511.2
Depth:A
¼0–30cm
,B¼
30–60cm
,C¼
60–90cm
.EC¼
electrolyticconductivity,Sm�1
at25� C
.SAR
¼sodium
adsorptionratio,
Naþ,K
þ,Ca2þ,Mg2þ,SC
(totalcations)
¼mmol a,L�1.
Cl�,NO
3� ,SO
42� ,
SA
(totalanions)¼
mmol cL�1.
TDS(totaldissolved
salts)¼
mmolL�1.
268
Dow
nloa
ded
by [
Uni
vers
ity o
f A
uckl
and
Lib
rary
] at
17:
54 1
9 N
ovem
ber
2014
(c): 0.57 S m�1 in (a), 0.92 S m�1 in (b) and 0.93 S m�1 in (c); 173 mmolc L�1in (a),
284 mmolc L�1 in (b) and 287 mmolc L
�1 in (c).These results reflect a displacement and accumulation of salts from the soil
surface towards lower zones. It is known that factors such as soil porosity, quantityof percolation water, nature of the ions present, and so for the determine themobility of different ions and their differential spatial behavior (Hernandez et al.,2002; Vela et al., 2004). For example, the two lower layers showed higher con-centrations of Naþ , Mg2þ , Cl� and SO4
2� than the top layer, while the concentra-tions of Ca2þ , Kþ and NO3
�were similar at all three depths. The mean SAR valuesshowed an identical distribution pattern to the mean EC values due to the closecorrelation between both parameters (Alvarez et al., 1997; Csillag et al., 1995; Darabet al., 1980; McNeal et al., 1970; Robbins, 1993; Robbins & Meyer, 1990; Simonet al., 1994). Maximum mean SAR values (>11) were observed at 60–90 cm.
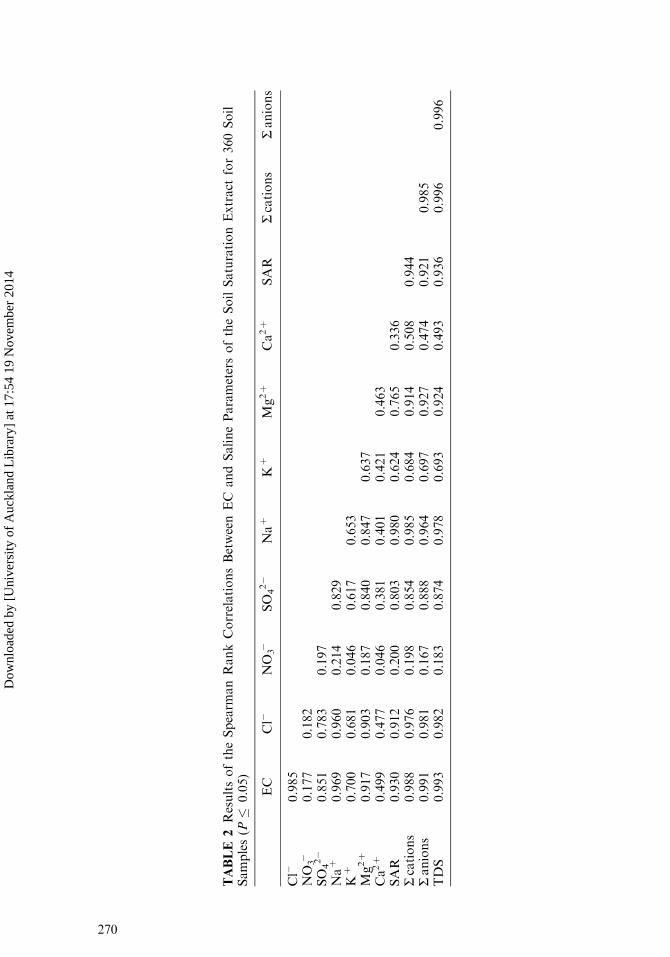
Based on the analytical data shown in Table 1, and considering the total numberof analyzed samples, the different saline parameters were correlated in an attempt toestablish any relationship between different salts measured in the soil saturationextract and their influence on the EC values (Table 2).
The results show that some ions, especially Mg2þ , Ca2þ and SO42�, did not
demonstrate a linear behavior, the points being widely dispersed (Figure 1) for ECvalues above 1 S m�1: correlation coefficients of 0.917 (Mg2þ), 0.499 (Ca2þ), and0.851 (SO4
2�), respectively. A higher linearity for Cl� (r ¼ 0.985) and Naþ(r ¼ 0.969)was observed. Good correlation for SAR, TDS, total anions and cations wasobtained in all cases (r > 0.988).
These results demonstrate that, of all the ions, Cl� and Naþ have the greatestinfluence on EC. In Figure 1, it can be seen that, when the SO4
2�=Cl� (II),Ca2þ=Naþ (IV) and Mg2þ=Naþ (V) ratios calculated for points 1 (EC � 1 S m-1), 2(1<EC � 2 S m�1) and 3 (2<EC � 4 S m�1), the increase in Naþ and Cl� con-centrations is much greater than the corresponding increases in SO4
2�, Ca2þ , andMg2þ concentrations for the same increase in EC. This is especially true at ECvalues above 1 S m�1, resulting in a greater dispersion of the points and a corre-sponding loss in linearity between the different parameters. Such behavior seems tobe related with the formation of ionic pairs on the part of Ca2þ , Mg2þ and SO4
2�,unlike Cl� and Naþ , which lower the EC value (Alzubaidi & Webster, 1983;Timpson & Richardson, 1986). The intensity of this ionic pair formation seems to belinked with the characteristics of the ions themselves (charge and size) and theproperties of the soil solution, but especially with the nature and concentration of thedifferent ions present (Darab et al., 1980). The same behavior would also explainthe loss of linearity with SAR observed at EC values > 2 S m�1 (Table 3). Accordingto Darab et al. (1980), the value of this parameter increases with the ionic content ofthe soil solution and with increasing variations in the exchange cations in favour ofNaþ . This fact was also noted by Simon et al. (1994), who established that Cl�
contributed five hundred times more than SO42� and Naþ to EC, and up to seven
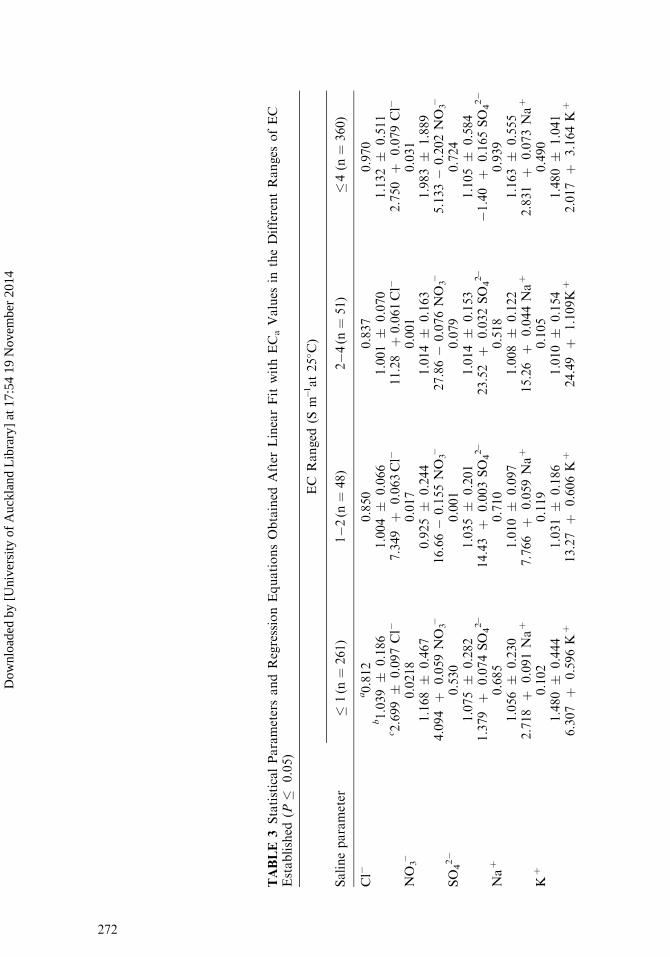
hundred times more than Mg2þ .Different levels of EC (�1, 1–2 and 2–4 S m�1) were established to study the
behavior of the different saline parameters related to EC. Regression lines wereobtained (Table 3), from which the estimated EC (ECe) values were calculated. Thesewere divided by the measured values (ECm), thus providing a mean correlationfactor (F) (Equation 1). The adjusted EC (ECa) values were obtained using thisfactor (Equation 2), providing new regression lines for the different variables.
F ¼ ECe
ECm; ð1Þ
ECa ¼aþ b� saline parameter
F: ð2Þ
Electrolytic Conductivity of Semiarid Soils 269
Dow
nloa
ded
by [
Uni
vers
ity o
f A
uckl
and
Lib
rary
] at
17:
54 1
9 N
ovem
ber
2014
TABLE
2ResultsoftheSpearm
anRankCorrelationsBetweenEC
andSalineParametersoftheSoilSaturationExtract
for360Soil
Samples(P
�0.05)
EC
Cl�
NO
3�SO
42�
Naþ
Kþ
Mg2þ
Ca2þ
SAR
Scations
Sanions
Cl�
0.985
NO
3�0.177
0.182
SO
42�
0.851
0.783
0.197
Naþ
0.969
0.960
0.214
0.829
Kþ
0.700
0.681
0.046
0.617
0.653
Mg2þ
0.917
0.903
0.187
0.840
0.847
0.637
Ca2þ
0.499
0.477
0.046
0.381
0.401
0.421
0.463
SAR
0.930
0.912
0.200
0.803
0.980
0.624
0.765
0.336
Scations
0.988
0.976
0.198
0.854
0.985
0.684
0.914
0.508
0.944
Sanions
0.991
0.981
0.167
0.888
0.964
0.697
0.927
0.474
0.921
0.985
TDS
0.993
0.982
0.183
0.874
0.978
0.693
0.924
0.493
0.936
0.996
0.996
270
Dow
nloa
ded
by [
Uni
vers
ity o
f A
uckl
and
Lib
rary
] at
17:
54 1
9 N
ovem
ber
2014
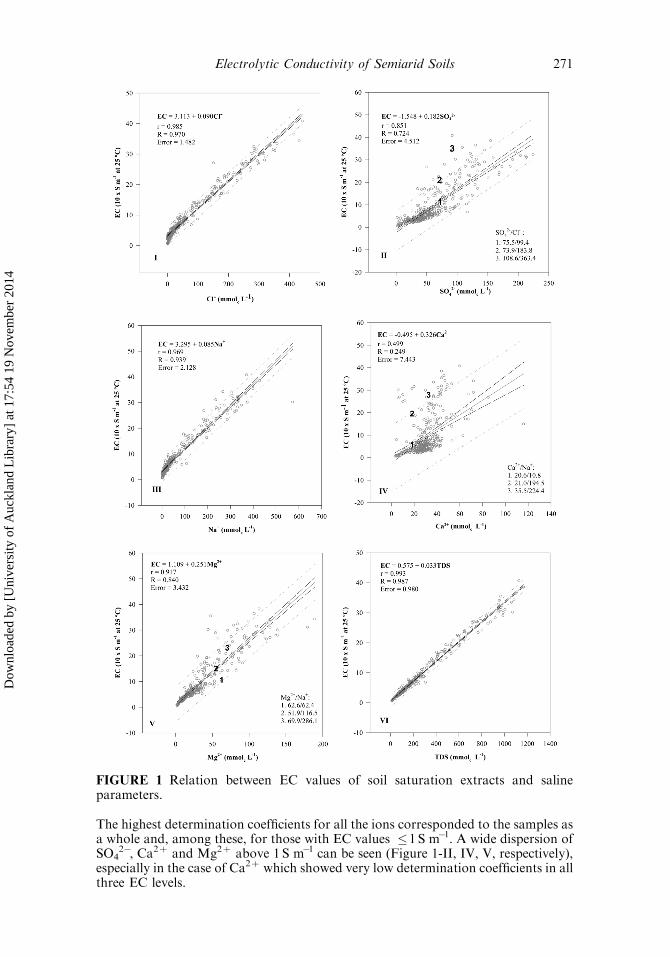
The highest determination coefficients for all the ions corresponded to the samples asa whole and, among these, for those with EC values �1 S m�1. A wide dispersion ofSO4
2�, Ca2þ and Mg2þ above 1 S m�1 can be seen (Figure 1-II, IV, V, respectively),especially in the case of Ca2þ which showed very low determination coefficients in allthree EC levels.
FIGURE 1 Relation between EC values of soil saturation extracts and salineparameters.
Electrolytic Conductivity of Semiarid Soils 271
Dow
nloa
ded
by [
Uni
vers
ity o
f A
uckl
and
Lib
rary
] at
17:
54 1
9 N
ovem
ber
2014
TABLE
3StatisticalParametersandRegressionEquationsObtained
After
LinearFitwithECaValues
intheDifferentRanges
ofEC
Established
(P�
0.05)
EC
Ranged
(Sm�1at25� C
)
Salineparameter
�1(n
¼261)
1�2(n
¼48)
2�4(n
¼51)
�4(n
¼360)
Cl�
a0.812
0.850
0.837
0.970
b1.039
�0.186
1.004
�0.066
1.001
�0.070
1.132
�0.511
c2.699
�0.097Cl�
7.349
þ0.063Cl�
11.28
þ0.061Cl�
2.750
þ0.079Cl�
NO
3�0.0218
0.017
0.001
0.031
1.168
�0.467
0.925
�0.244
1.014
�0.163
1.983
�1.889
4.094
þ0.059NO
3�16.66�
0.155NO
3�27.86�
0.076NO
3�5.133�
0.202NO
3�
SO
42�
0.530
0.001
0.079
0.724
1.075
�0.282
1.035
�0.201
1.014
�0.153
1.105
�0.584
1.379
þ0.074SO
42�
14.43
þ0.003SO
42�
23.52
þ0.032SO
42�
�1.40
þ0.165SO
42�
Naþ
0.685
0.710
0.518
0.939
1.056
�0.230
1.010
�0.097
1.008
�0.122
1.163
�0.555
2.718
þ0.091Naþ
7.766
þ0.059Naþ
15.26
þ0.044Naþ
2.831
þ0.073Naþ
Kþ
0.102
0.119
0.105
0.490
1.480
�0.444
1.031
�0.186
1.010
�0.154
1.480
�1.041
6.307
þ0.596K
þ13.27
þ0.606K
þ24.49
þ1.109K
þ2.017
þ3.164K
þ
272
Dow
nloa
ded
by [
Uni
vers
ity o
f A
uckl
and
Lib
rary
] at
17:
54 1
9 N
ovem
ber
2014
Mgþ2
0.782
0.100
0.206
0.840
1.040
�0.175
1.031
�0.190
1.012
�0.154
1.122
�0.286
1.688
þ0.168Mg2þ
12.29
þ0.049Mg2þ
21.30
þ0.068Mg2þ
0.988
þ0.224Mg2þ
Caþ2
0.291
0.072
0.033
0.249
1.115
�0.371
0.962
�0.178
1.014
�0.163
1.512
�0.781
1.223
þ0.118Ca2þ
13.99
þ0.045Ca2þ
25.88
þ0.049Ca2þ
�0.327
þ0.216Ca2þ
SAR
0.504
0.457
0.189
0.886
1.084
�0.304
1.019
�0.140
1.013
�0.145
1.170
�0.534
2.775
þ0.411SAR
9.268
þ0.297SAR
21.38
þ0.180SAR
2.118
þ0.555SAR
Scations
0.894
0.754
0.734
0.977
1.084
�0.123
1.009
�0.090
1.005
�0.086
1.044
�0.151
0.550
þ0.063Scat
4.974
þ0.047Scat
7.794
þ0.047Scat
0.689
þ0.061Scat
Sanions
0.878
0.849
0.842
0.983
1.021
�0.126
1.006
�0.074
1.001
�0.624
1.129
�0.179
0.947
þ0.057Sani
2.271
þ0.062Sani
6.662
þ0.521Sani
0.511
þ0.059Sani
TDS
0.923
0.839
0.864
0.987
1.014
�0.103
1.007
�0.074
1.003
�0.061
1.029
�0.117
0.585
þ0.032TDS
3.122
þ0.028TDS
5.180
þ0.027TDS
0.559
þ0.032TDS
aDeterminationcoefficient,R
2.
bF¼
ECe/ECm�SD.
cAdjusted
regressionequation,ECa¼
aþ
bsalineparameter.
273
Dow
nloa
ded
by [
Uni
vers
ity o
f A
uckl
and
Lib
rary
] at
17:
54 1
9 N
ovem
ber
2014
A multiple regression equation including all the ions measured in the soilsaturation extract (Table 1) was obtained by eliminating Cl�, SO4
2�, Naþ and Mg2þ
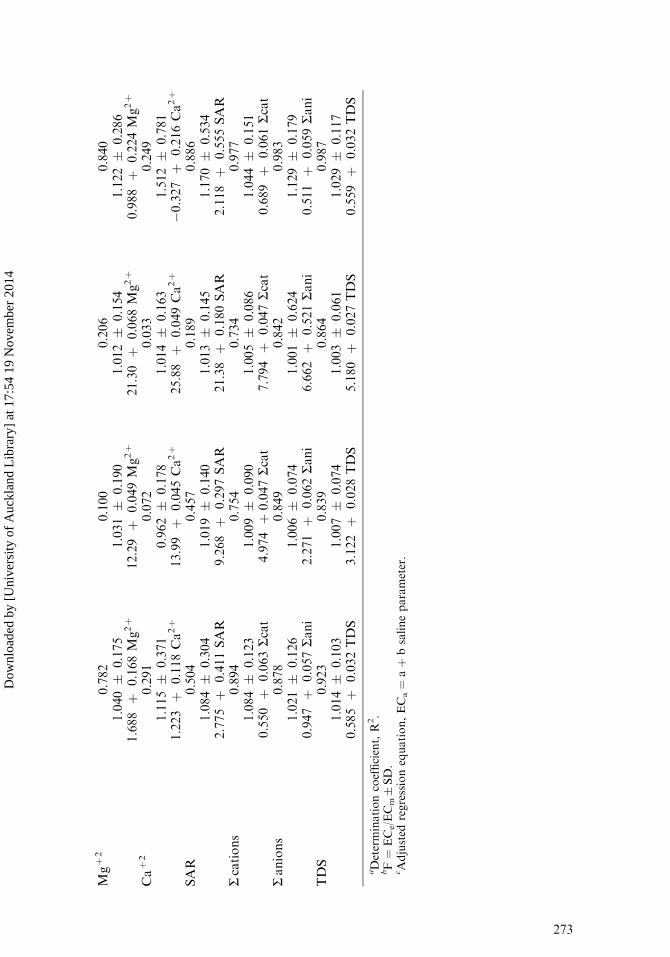
as variables due to multilinearity phenomena. These ions are strongly related with ECand the redundancy of the information leads the model to reject them. The variablesthat seemed to provide least information concerning the EC value can be used toestablish a lineal model (n ¼ 360) with a fit of 56.7% (r ¼ 0.753), which, althoughlow, substantially improves individual correlations. The regression equationobtained is the following:
EC ¼ �0:05� 0:4NO�3 þ 3:9Kþ þ 0:2Ca2þ: ð3Þ
Improved correlations between salt concentrations and EC were obtained(Alvarez, 1997) by using linear models and transforming the data logarithmically.McNeal et al. (1970) also obtained good models using polynomic regressions of adifferent order, although these depended on the quantity of salts present in the soil.
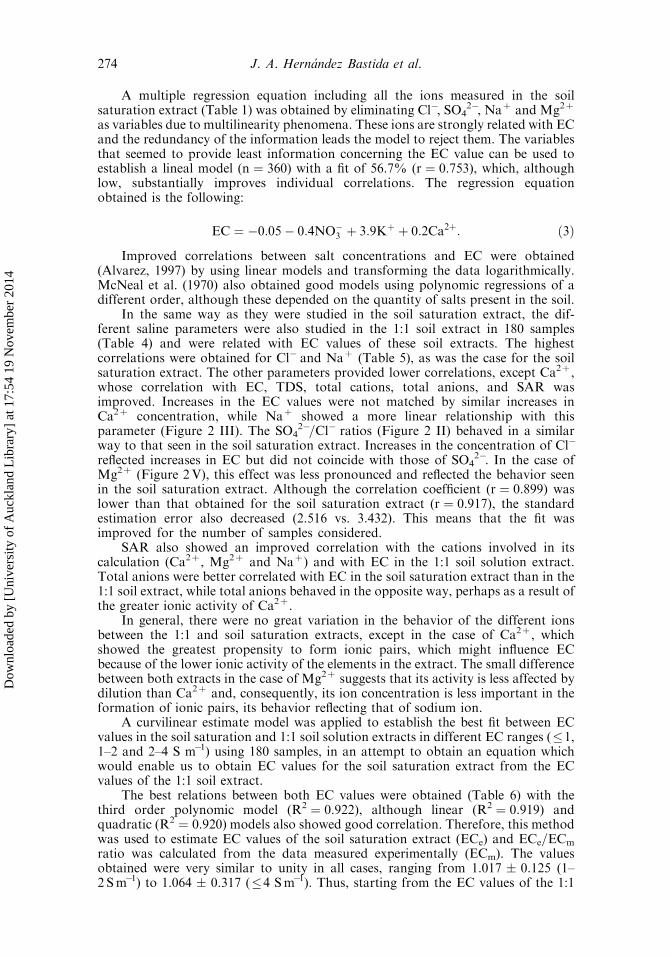
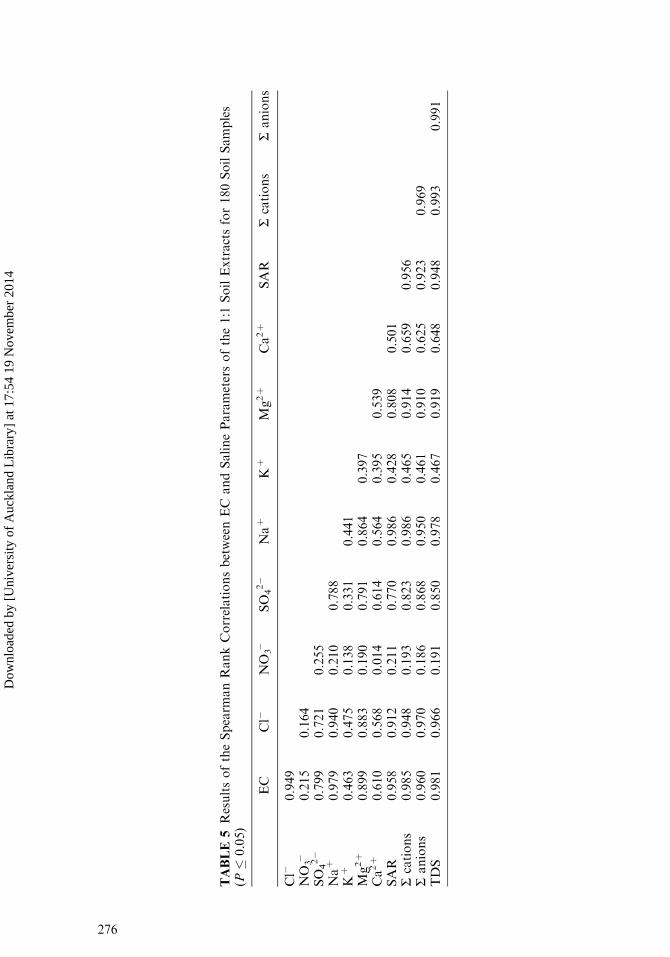
In the same way as they were studied in the soil saturation extract, the dif-ferent saline parameters were also studied in the 1:1 soil extract in 180 samples(Table 4) and were related with EC values of these soil extracts. The highestcorrelations were obtained for Cl� and Naþ (Table 5), as was the case for the soilsaturation extract. The other parameters provided lower correlations, except Ca2þ ,whose correlation with EC, TDS, total cations, total anions, and SAR wasimproved. Increases in the EC values were not matched by similar increases inCa2þ concentration, while Naþ showed a more linear relationship with thisparameter (Figure 2 III). The SO4
2�=Cl� ratios (Figure 2 II) behaved in a similarway to that seen in the soil saturation extract. Increases in the concentration of Cl�
reflected increases in EC but did not coincide with those of SO42�. In the case of
Mg2þ (Figure 2V), this effect was less pronounced and reflected the behavior seenin the soil saturation extract. Although the correlation coefficient (r ¼ 0.899) waslower than that obtained for the soil saturation extract (r ¼ 0.917), the standardestimation error also decreased (2.516 vs. 3.432). This means that the fit wasimproved for the number of samples considered.
SAR also showed an improved correlation with the cations involved in itscalculation (Ca2þ , Mg2þ and Naþ) and with EC in the 1:1 soil solution extract.Total anions were better correlated with EC in the soil saturation extract than in the1:1 soil extract, while total anions behaved in the opposite way, perhaps as a result ofthe greater ionic activity of Ca2þ .
In general, there were no great variation in the behavior of the different ionsbetween the 1:1 and soil saturation extracts, except in the case of Ca2þ , whichshowed the greatest propensity to form ionic pairs, which might influence ECbecause of the lower ionic activity of the elements in the extract. The small differencebetween both extracts in the case of Mg2þ suggests that its activity is less affected bydilution than Ca2þ and, consequently, its ion concentration is less important in theformation of ionic pairs, its behavior reflecting that of sodium ion.
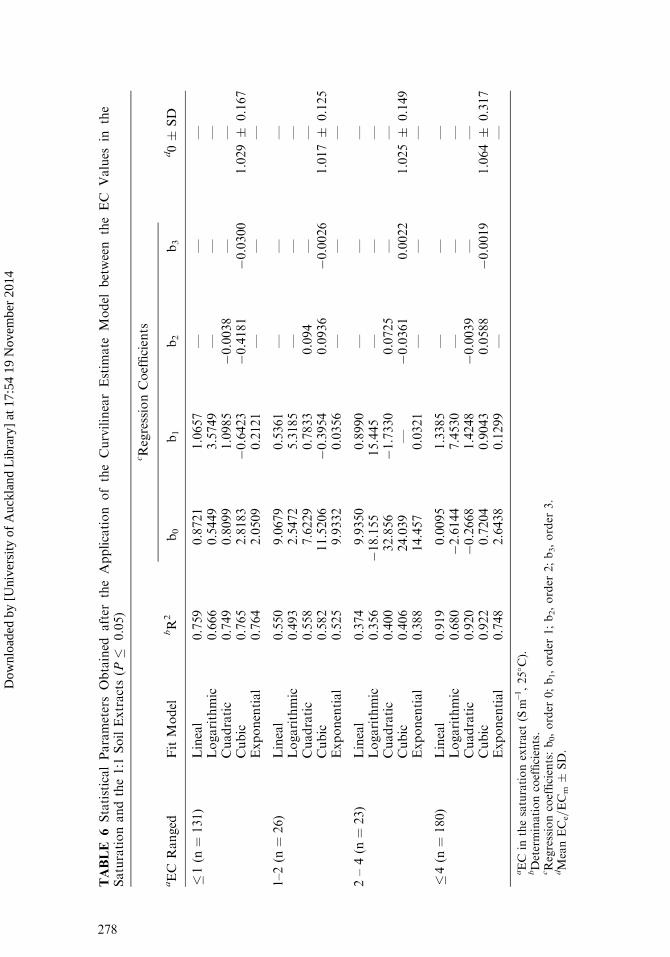
A curvilinear estimate model was applied to establish the best fit between ECvalues in the soil saturation and 1:1 soil solution extracts in different EC ranges (�1,1–2 and 2–4 S m�1) using 180 samples, in an attempt to obtain an equation whichwould enable us to obtain EC values for the soil saturation extract from the ECvalues of the 1:1 soil extract.
The best relations between both EC values were obtained (Table 6) with thethird order polynomic model (R2 ¼ 0.922), although linear (R2 ¼ 0.919) andquadratic (R2 ¼ 0.920) models also showed good correlation. Therefore, this methodwas used to estimate EC values of the soil saturation extract (ECe) and ECe=ECm
ratio was calculated from the data measured experimentally (ECm). The valuesobtained were very similar to unity in all cases, ranging from 1.017 � 0.125 (1–2 Sm�1) to 1.064 � 0.317 (�4 Sm�1). Thus, starting from the EC values of the 1:1
274 J. A. Hernandez Bastida et al.
Dow
nloa
ded
by [
Uni
vers
ity o
f A
uckl
and
Lib
rary
] at
17:
54 1
9 N
ovem
ber
2014

TABLE
4Mean,Minim
um
(Min)andMaxim
um
(Max)Values
andStandard
Deviation(SD)ofSalineParametersatThreeDepths
(n¼
120per
depth)ofthe1:1
SoilExtracts
SalineParameters
Depth
Statistics
EC
SAR
Naþ
Kþ
Ca2þ
Mg2þ
Cl�
NO
3�SO
42�
TDS
SC
SA
AMean
0.50
5.6
30.7
1.4
16.9
27.8
30.1
2.20
41.0
152.5
76.8
75.8
SD
0.46
6.0
44.9
1.1
15.8
14.7
51.8
1.90
22.4
133.6
69.3
65.9
Min
0.04
0.3
1.3
0.4
2.6
5.5
1.2
0.01
4.7
26.5
13.6
11.8
Max
2.44
25.9
213.0
6.3
82.3
83.5
238.6
8.20
106.9
670.3
352.1
318.2
BMean
0.74
9.9
61.9
0.8
29.0
29.5
46.3
1.30
60.6
231.3
121.2
110.1
SD
0.64
9.8
73.5
0.7
20.8
10.6
57.4
1.50
28.1
180.3
99.7
81.2
Min
0.03
1.6
6.6
0.2
2.6
3.3
3.7
0.01
8.7
28.5
14.0
14.5
Max
2.27
35.5
243.5
3.7
89.7
66.0
198.1
7.40
130.8
690.0
358.9
331.1
CMean
0.75
9.9
61.6
0.8
29.8
31.0
45.3
1.00
62.3
233.4
123.2
110.2
SD
062
9.7
71.2
0.6
20.5
10.0
54.5
1.20
26.3
171.6
95.7
77.5
Min
0.03
0.8
3.5
0.1
3.5
9.4
2.14
0.01
15.3
50.1
24.5
25.6
Max
2.36
34.7
243.5
3.1
94.7
68.50
207.8
4.00
135.2
715.4
374.9
340.5
Depth:A
¼0–30cm
,B¼
30–60cm
,C¼
60–90cm
.EC
¼electrolyticconductivity,Sm�1
at25� C
.SAR
¼sodium
adsorptionratio.
Naþ,K
þ,Ca2þ,Mg2þ,SC
(totalcations)¼
mmol cL�1.
Cl�,NO
3� ,SO
42� ,
SA
(totalanions)¼
mmol aL�1.
TDS(totaldissolved
salts)¼
mmolL�1.
275
Dow
nloa
ded
by [
Uni
vers
ity o
f A
uckl
and
Lib
rary
] at
17:
54 1
9 N
ovem
ber
2014
TABLE
5ResultsoftheSpearm
anRankCorrelationsbetweenEC
andSalineParametersofthe1:1
SoilExtractsfor180SoilSamples
(P�
0.05)
EC
Cl�
NO
3�SO
42�
Naþ
Kþ
Mg2þ
Ca2þ
SAR
Scations
Sanions
Cl�
0.949
NO
3�0.215
0.164
SO
42�
0.799
0.721
0.255
Naþ
0.979
0.940
0.210
0.788
Kþ
0.463
0.475
0.138
0.331
0.441
Mg2þ
0.899
0.883
0.190
0.791
0.864
0.397
Ca2þ
0.610
0.568
0.014
0.614
0.564
0.395
0.539
SAR
0.958
0.912
0.211
0.770
0.986
0.428
0.808
0.501
Scations
0.985
0.948
0.193
0.823
0.986
0.465
0.914
0.659
0.956
Sanions
0.960
0.970
0.186
0.868
0.950
0.461
0.910
0.625
0.923
0.969
TDS
0.981
0.966
0.191
0.850
0.978
0.467
0.919
0.648
0.948
0.993
0.991
276
Dow
nloa
ded
by [
Uni
vers
ity o
f A
uckl
and
Lib
rary
] at
17:
54 1
9 N
ovem
ber
2014
soil solution extract, the corresponding EC of the soil saturation extract could becalculated with a high degree of reliability.
The range of EC values that provided the lowest deviation between the estimatedvalues and the real values calculated from the proposed models was 1–2 Sm�1,although the determination coefficient obtained means that fitting must be ruled out.
FIGURE 2 Relation between EC values of 1:1 (soil:water) extract and salineparameters.
Electrolytic Conductivity of Semiarid Soils 277
Dow
nloa
ded
by [
Uni
vers
ity o
f A
uckl
and
Lib
rary
] at
17:
54 1
9 N
ovem
ber
2014
TABLE
6StatisticalParametersObtained
after
theApplication
oftheCurvilinearEstim
ate
Model
between
theEC
Values
inthe
Saturationandthe1:1
SoilExtracts(P
�0.05)
c RegressionCoefficients
aEC
Ranged
FitModel
bR
2b0
b1
b2
b3
d0�
SD
�1(n
¼131)
Lineal
0.759
0.8721
1.0657
——
—Logarithmic
0.666
0.5449
3.5749
——
—Cuadratic
0.749
0.8099
1.0985
�0.0038
——
Cubic
0.765
2.8183
�0.6423
�0.4181
�0.0300
1.029
�0.167
Exponential
0.764
2.0509
0.2121
——
—
1–2(n
¼26)
Lineal
0.550
9.0679
0.5361
——
—Logarithmic
0.493
2.5472
5.3185
——
—Cuadratic
0.558
7.6229
0.7833
0.094
——
Cubic
0.582
11.5206
�0.3954
0.0936
�0.0026
1.017
�0.125
Exponential
0.525
9.9332
0.0356
——
—
2–4(n
¼23)
Lineal
0.374
9.9350
0.8990
——
—Logarithmic
0.356
�18.155
15.445
——
—Cuadratic
0.400
32.856
�1.7330
0.0725
——
Cubic
0.406
24.039
—�0.0361
0.0022
1.025
�0.149
Exponential
0.388
14.457
0.0321
——
—
��
4(n
¼180)
Lineal
0.919
0.0095
1.3385
——
—Logarithmic
0.680
�2.6144
7.4530
——
—Cuadratic
0.920
�0.2668
1.4248
�0.0039
——
Cubic
0.922
0.7204
0.9043
0.0588
�0.0019
1.064
�0.317
Exponential
0.748
2.6438
0.1299
——
aEC
inthesaturationextract
(Sm�1,25� C
).bDeterminationcoefficients.
cRegressioncoefficients:b0,order
0;b1,order
1;b2,order
2;b3,order
3.
dMeanECe=ECm�
SD.
278
Dow
nloa
ded
by [
Uni
vers
ity o
f A
uckl
and
Lib
rary
] at
17:
54 1
9 N
ovem
ber
2014
The same applies to the other EC ranges, so that the best model that can be usedwith these two parameters is that which includes all the EC values.
Conclusions
The already known close correlation between EC and the salt content in thesaturation and 1:1 soil solution extract of the soil samples is manifested in the resultsof this study. Our results suggest that the EC measured in the saturation extract isnot the most valid parameter for analyzing the salt concentration of a soil when ECexceeds 1 Sm�1. In such a case, the most reliable estimation of the total salt contentcan be made from the measures of Cl� and Naþ , when these are the principal ions.That is to say, the use of one parameter or the other in relation with the salt contentseems to be closely linked to the nature and composition of the ions of the saturationextract, the relation being that much closer as the SO4
2�=Cl� and Ca2þ=Naþ ratiosfall.
The behavior of the ions in the 1:1 soil extract is similar to that observed inthe saturation extract. Although the decrease in salts brought about by thedilution leads to a lower EC value being obtained, this decrease is not, in general,sufficient to significantly alter the different ionic relations with the overall level ofsalinity. Among all these, only the Ca2þ ion substantially improves its correlationwith EC in the 1:1 soil solution extract, demonstrating the great influence of theionic concentration of the solution in the ionic activity and, in the case of thiselement, in the formation of ionic pairs. In the case of Mg2þ this factor does notseem to be so important, which would explain the similar correlation in bothextracts.
The best model between the EC values of the saturation and 1:1 soil extracts is athird order polynomial, although good results can also be obtained with linearregressions.
References
Alıas, L. J., R. Ortız, A. Sanchez, P. Linares, M. J. Martınez, and P. Marın. 1992. ProyectoLUCDEME. Mapa de Suelos y Memoria. Escala 1:100.000. Totana (954). Ministerio deAgricultura, Pesca y Alimentacion (I.C.O.N.A.) y Universidad de Murcia, Madrid.
Alvarez, J. 1997. Relaciones suelo-vegetacion en saladares del Sureste de Espana. Ph. D. Thesis.
Universidad de Murcia. Murcia, Spain.Alvarez, J., J. A. Hernandez, and R. Ortiz. 1997. Patterns of spatial and temporal variations in
soil salinity: Example of a salt marsh in a semiarid climate. Arid Soil Research and
Rehabilitation 11:315–329.Alzubaidi, A. and G. R. Webster. 1983. Ion pairs in a Solonetz soil. Canadian Journal of Soil
Science, 63:479–484.
Aragues, R., M. Millan, D. Quilez, and M. Fernandez. 1986.Metodos de medida de la salinidadde suelos. I y II. Instituto Nacional de Investigaciones Agrarias. Madrid.
Bower, C. A. and L. V. Wilcox. 1965. Soluble salts, pp. 933–940, in C. A. Black ed., Methods
of soil analysis, part 2. American Society of Agronomy, Madison, Wisconsin, USA.Chang, C., T. G. Sommerfeldt, J. M. Carefoot, and G. B. Schaalje. 1983. Relationships of
electrical conductivity with total dissolved salts and cation concentrations of sulfatedominant soil extracts. Canadian Journal of Soil Science 63:79–86.
Csillag, J., T. Toth, and M. Redly. 1995. Relationships between soil solution composition andsoil water content of Hungarian salt-affected soils. Arid Soil Research and Rehabilitation9:245–260.
Darab, K., J. Csillag, and I. Pinter. 1980. Studies on the ion composition of salt solutions andof saturation extracts of salt-affected soils. Geoderma 23:95–111.
Electrolytic Conductivity of Semiarid Soils 279
Dow
nloa
ded
by [
Uni
vers
ity o
f A
uckl
and
Lib
rary
] at
17:
54 1
9 N
ovem
ber
2014
FAO - ISRIC - ISSS. 1998. World references base for soil resources. FAO, Rome.Hernandez, J. A. and A. Faz. 1993. Salinizacion en suelos de la Canada de Veas (Murcia), pp.
497–506, in R. Ortiz, ed., Problematica geoambiental y desarrollo. Campobell, Murcia,Spain.
Hernandez, J. A., A. Faz, P. Marın, N. Vela, and R. Ortiz. 2002. Salt affected Fluvisols in theGuadalentin Valley (Murcia, SE Spain), pp. 1573–1584, in J. L. Rubio, R. P. C. Morgan,S. Asins, and V. Andreu, eds., Man and soil at the third millennium. Geoforma Publishers,
Logrono, Spain.Kuchanwar, O. D., C. K. Kale, and V. P. Deshpande. 1999. Irrigation water quality and farm
management decisions. Water Science Technology 40:97–103.
Marion G. M. and K. L. Babcock. 1976. Predicting specific conductance and salt con-centration in dilute aqueous solutions. Soil Science 122:181–187.
McNeal, B. L., J. D. Oster, and J. T. Hatcher. 1970. Calculation of electrical conductivity
from solution composition data as an aid to in-situ estimation of soil salinity. Soil Science110:405–414.
Pla-Sentıs, I. 1997. Evaluacion de los procesos de salinizacion de suelos bajo riego, pp. 241–267, in SECS, 50 Aniversario, Ponencias, Madrid, Spain.
Ramadan, H. M., N. F. Kandil, M. A. Sinna, M. E. El-Fayoumy, and S. A. Hassanien. 2000.Environmental assessment of soil and water table quality under different farming practicesfor sustainable agriculture at west Nubaria Region, Egypt. I - Numerical and geostatistical
analysis of soil salinity and water table regime. Alexandria Science Exchange 21:409–411.Rhoades, J. D. 1978. Monitoring soil salinity: a review of methods. Proc. Series Am. Water
Resources Association. 150–165.
Rhoades, J. D., D. L. Corwin, and S. M. Lesch. 1999. Geospatial measurements of soilelectrical conductivity to assess soil salinity and diffuse salt loading from irrigation.Geophysics Monographs 108:197–215.
Rhoades, J. D., N. A. Manteghi, P. J. Shouse, and W. J. Alves. 1989. Estimating soil salinity
from saturated soil-paste electrical conductivity. Soil Science Society of America Journal53:428–433.
Richards, L. A. 1974. Diagnostico y rehabilitacion de suelos salinos y sodicos. Limusa, Mexico.
Robbins, C. W. 1993. Coefficients for estimating SAR from soil pH and EC data and cal-culating pH from SAR and EC values in salinity models. Arid Soil Research and Rehabi-litation 7:29–38.
Robbins, C. W. and W. S. Meyer. 1990. Calculating pH from EC and SAR values in salinitymodels and SAR from soil and bore water pH and EC data. Australian Journal of SoilResearch 28:1001–1011.
Sharma, D. P., K. Singh, and K. V. G. K. Rao. 2000. Subsurface drainage for rehabilitation ofwaterlogged saline lands: Example of a soil in semiarid climate. Arid Soil Research andRehabilitation 14:373–386.
Simon, M., I. Cabezas, and P. Martinez. 1994.A new method for estimate of dissolved salts in
saturation extracts of soil from electrical conductivity. European Journal of Soil Science45:153–157.
Soil Survey Staff. 1999. Soil Taxonomy. A basic system of soil classification for making and
interpreting soil surveys. Agriculture Handbook n�436. U.S. Department of Agriculture,Natural Resources Conservation Service. Washington, DC, USA.
Sposito, G. 1984. The future of an illusion: Ion activities in soil solutions. Soil Science Society
of America Journal 48:531–536.Timpson, M. E. and J. I. Richardson. 1986. Ionic composition and distribution in saline seeps
of southwestern North Dakota, U.S.A. Geoderma 37:295–305.Toth, T. and L. Blasko. 1998. Secondary salinization caused by irrigation, pp. 229–253, in
A. Rodrıguez, C. C. Jimenez, and M. L. Tejedor, eds., The soil as a strategic resource:Degradation processes and conservation measures. Publishers Geoforma, Logrono, Spain.
Vairagade, D. M., H. D. Juneja, R. T. Jadhav, and L. J. Paliwal. 2002. Water quality of the
Kolar River basin. Asian Journal of Chemistry 12:101–116.
280 J. A. Hernandez Bastida et al.
Dow
nloa
ded
by [
Uni
vers
ity o
f A
uckl
and
Lib
rary
] at
17:
54 1
9 N
ovem
ber
2014

Vela, N. 2002. Estudio de los Procesos de Salinizacion en Suelos del Valle del Guadalentın(Murcia). Ph. D. Thesis. Universidad de Murcia. Murcia, Spain.
Vela, N., J. A. Hernandez, and R. Ortiz. 2004. Spatial variations of salinity in agricultural soilsin semiarid regions (Murcia, SE Spain). Catena. (Submitted)
Wienhold, B. J. and T. P. Trooien. 1998. Irrigation water effects on infiltration rate in thenorthern Great Plains. Soil Science 163:853–858.
Electrolytic Conductivity of Semiarid Soils 281
Dow
nloa
ded
by [
Uni
vers
ity o
f A
uckl
and
Lib
rary
] at
17:
54 1
9 N
ovem
ber
2014