electrogenerated chemiluminescence. 55. emission from...
TRANSCRIPT

Langmuir 1994,10,2409-2414 2409
Electrogenerated Chemiluminescence. 55. Emission from Adsorbed Ru(bpy)a2+ on Graphite, Platinum, and Gold
Xiao-Hong Xu and Allen J. Bard*
Department of Chemistry and Biochemistry, The University of Texas at Austin, Austin, Texas 78712
Received November 23,1993. In Final Form: April 7, 1994@
The electrogenerated chemiluminescence (ECL) that arises upon sweeping or stepping the potential of a highly oriented pyrolytic graphite (HOPG) electrode to positive potentials in a solution containing tripropylamine after immersion of the HOPG in Ru(bpy)s2+ solutions followed by thorough washing is ascribed to strong adsorption of Ru(bpy)s2+ on the graphite surface. The dependence of the observed ECL emission on R~(bpy)3~+ concentration (over a range of 60-300 nM) was used to find the adsorption isotherm. Similar adsorption and ECL was found with platinum and gold electrodes.
Introduction We describe here the electrogenerated chemilumines-
cence (ECL) of R~(bpy)3~+ adsorbed at monolayer levels on electrode surfaces. Most of the previous studies of ECL1p2 have involved reaction of dissolved precursors in solution with emission from excited states produced in an electron-transfer reaction near an electrode surface. For example, the R~(bpy)3~+-oxalate system3 is based on oxidation of the Ru species at an anode, followed by the following proposed sequence of reactions to produce an emitting state:
c,o,'- - CO, + c0;- (3)
(5)
There have been reports of ECL of layers constrained to electrode surfaces, e.g., Langmuir-Blodgett4 or self- assembled5 layers of R~(bpy)3~+ attached to long hydro- carbon chains, or polymer e.g., of Ru(bpy)g2+ in a micrometer-thick Nafion layer. However, the direct adsorption of Ru(bpy)Q2+ itself and its ECL has not been described before.
ECL of monolayer amounts of adsorbates is of interest in connection with analysis of very small amounts of E C E emitter-labeled species, where preconcentration of the material on the electrode surface greatly enhances the sensitivity of the method. Indeed, this is the basis of recent commercial instrumentsg for diagnostic systems (e.g., for DNA or antibodies), where preconcentration is accom-
@ Abstract published in Advance ACS Abstracts, May 15,1994. (1) Faulkner, L. R.; Bard, A. J. InEZectroanaZyticaZ Chemistry; Bard,
A. J., Ed.; Marcel Dekker: New York, 1977; Vol. 10, pp 1-95. (2) Hercules, D. M. Acc. Chem. Res 1969,2, 301. (3) Rubinstein, I.; Bard, A. J. J. Am. Chem. Soc. 1981,103, 512. (4) Zhang, X.; Bard, A. J. J. Phys. Chem. 1988,92,5566. ( 5 ) Obeng, Y. S.; Bard, A. J. Lungmuir 1991, 7, 195. (6) Fan, F.-R. F.; Mau, A.; Bard, A. J. Chem. Phys. Lett. 1985,116,
(7)Abruiia, H. D.; Bard, A. J. J. Am. Chem. Soc. 1982,104,2641. (8) Rubinstein, I.; Bard, A. J. J. Am. Chem. Soc. 1981,103,5007; J.
(9) Blackburn, G. F.; Shah, H. P.; Kenten, J. H.; Leland, J. K. CZin.
400.
Am. Chem. SOC. 1980,102,6641.
Chem. 1991,37,1534.
0743-7463/94/2410-2409$04.50/0
5 rc,
f
C R
I'
Figure 1. Schematic diagram of the cell used for ECL and electrochemical measurements designed so that the edges of the electrode are not exposed to the solution: (a) Plexiglas sheet; (b) working electrode; (c) 0-ring(O.6 cm diameter); (d) Plexiglas cell; (e) hole exposing the working electrode to the solution; (f) screw holes; (g) copper wire.
plished through the use of emitter-bearing magnetic beads brought to the electrode surface. Moreover, as we demonstrate here, ECL can be a convenient probe of adsorption of monolayer amounts on small area (-cm2) electrodes, either through emission from the absorbed layer itself or by ECL analysis of dilute (-nM) solutions before and after exposure to the adsorbing surface. Finally, the detection of emission from an adsorbed species bears on the nature of quenching of excited states by conductor surfaces.1°-12
Experimental Section Apparatus. The Plexiglas cell designed for ECL and elec-
trochemical studies of highly oriented pyrolytic graphite (HOPG), platinum, and gold sheet electrodes (1 x 1 cm2), which would not expose the edges of the electrodes to the solution, is shown in Figure 1. The electrode contacted the solution through a hole in the side wall of the cell and was sealed against the wall with an O-ring, which defined the area exposed to the solution as 0.3 cm2. A sheet of the Plexiglas held by two screws (that did not contact the solution in the cell) secured the electrode to the cell
(lO)Kahn, H. J. Chem. Phys. 1970,53,101. (ll)Chance, R. R.; Prock, A; Silbey, R. J . Chem. Phys. 1974, 60,
(12) Chance, R. R.; Miller, A. H.; Prock, A.; Silbey, R. Chem. Phys. 2744.
Lett. 1975,33,590.
0 1994 American Chemical Society
2410 Langmuir, Vol. 10, No. 7, 1994
wall. A copper wire inserted between the electrode and the Plexiglas sheet formed the contact to the electrode. A saturated calomel reference electrode (SCE) and a platinum wire counter electrode, held outside the field ofview ofthe test electrode, were used for all measurements. Cyclic voltammetry was performed with a Bioanalytical Systems (West Lafayette, IN) Model BAS- 100 electrochemical analyzer. The electrochemical measure- ments coupled with ECL experiments were carried out with a Model 175 universal programmer, a Model 173 protentiostat (Princeton Applied Research, Princeton, NJ), and an Omnigraphic 2000 x-y recorder (Houston Instruments, Austin, TX). The ECL emission was imaged on a CCD camera (Model CH210, Photo- metrics, Ltd., Tucson, AZ) cooled to -90 "C. The ECL emission- time transient was determined by a Model C1230 single-photon- counting system (Hamamatsu Corp., Bridgewater, NJ) utilizing a Hamamatsu R928P photomultiplier tube cooled to -20 "C in a Model TE 308 TSRF cooler controller (Products for Research, Inc., Danvers, MA). The meter output was fed into the y-axis of the x-y recorder, and the signal from the potentiostat was fed into the x-axis to afford ECL intensity versus bias potential displays. An Origen I analyzer (IGEN, Inc., Rockville, MD) controlled by an IBM PS/2 computer was used to study the adsorption of Ru(bpy)~~+ on the Pt and Au. Solution analysis by ECL was carried out with a QPCR analyzer (Perkin-Elmer, Norwalk, CT). Both the IGEN and Perkin-Elmer systems are computer-controlled, automated flow injection analyzers utilizing a thin-layer electrochemical flow cell.
Chemicals and Materials. HOPG (between A and B grade) was a gift from Dr. Arthur Moore (Union Carbide) and was made into squares (1.2 x 1.2 cm2) ca. 1 mm thick. The 0.25-mm-thick gold (99.9%) and platinum (99.9%) sheets were purchased from Aldrich and were cut into 1- x 1-cm pieces. Ru(bpy)&lp6H20 (Strem), HPLC grade MeCN (Fisher), tripropylamine (TPrA) (Aldrich), and Na2SO4 (Baker) were used as received. All solutions were prepared with deionized water from a Millipore Milli-Q system. Solution I was 0.5 M Na2S04 with 1 M H2S04 added to adjust the solution to pH 5. Solution I1 contained 0.13 M TPrA and 0.19 M phosphate buffer, prepared by dissolving "F'rA into a NaHzP04 solution and adjusting the pH to 7 with 1 M NaOH. Assay buffer I11 containing 0.1 M TPrA and 0.05% sodium azide, pH 7.68, was used as received from Perkin-Elmer.
Preparation of Electrodes. A fresh surface on the HOPG electrode was produced by peeling off a surface layer with sticky tape immediately before the adsorption measurement. The platinum and gold electrodes were cleaned with a hot chromic acid (saturated &Cr207 in 90% HzS04) solution for ca. 20 s and then rinsed with copious amounts of water. This process was repeated until the surface contact angle between the water and the Pt or Au was less than 15". The HOPG, Pt, or Au electrode was then immersed in a Ru(bpy)32+ solution for either 10 min or 6 h with stirring and then rinsed with copious amounts of deionized water. These washed HOPG, Pt, and Au sheets were then employed as the working electrodes for the electrochemical and ECL measurements and are designated HoPG/R~(bpy)3~+, etc.
Xu and Bard
Results and Discussion
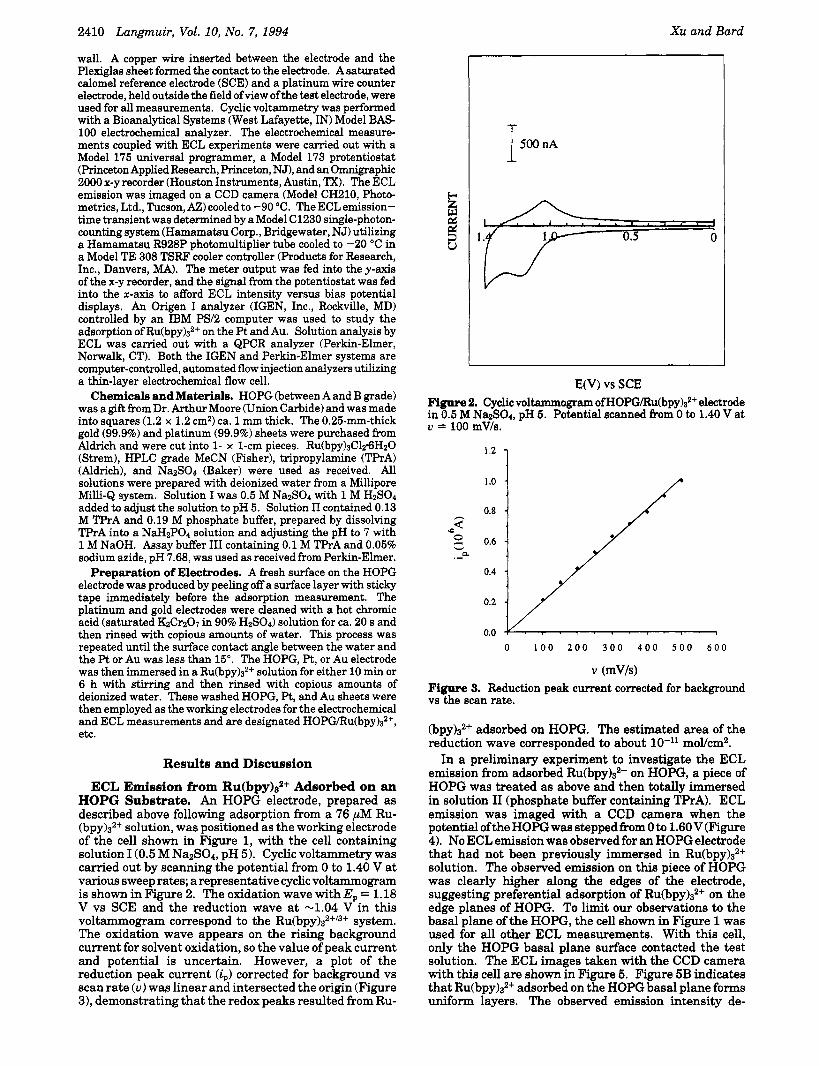
ECL Emission from Ru(bpy)s2+ Adsorbed on an HOPG Substrate. An HOPG electrode, prepared as described above following adsorption from a 76 pM Ru- (bpy)s2+ solution, was positioned as the working electrode of the cell shown in Figure 1, with the cell containing solution I(0.5 M Na~S04, pH 5). Cyclic voltammetry was carried out by scanning the potential from 0 to 1.40 V at various sweep rates; a representative cyclic voltammogram is shown in Figure 2. The oxidation wave with Ep = 1.18 V vs SCE and the reduction wave at -1.04 V in this voltammogram correspond to the R~(bpy)3~+"+ system. The oxidation wave appears on the rising background current for solvent oxidation, so the value of peak current and potential is uncertain. However, a plot of the reduction peak current (i,) corrected for background vs scan rate ( u ) was linear and intersected the origin (Figure 3), demonstrating that the redox peaks resulted from Ru-
C I I
I
E(V) vs SCE Figure 2. Cyclic voltammogram of HOPG/Ru(bpy)s2+ electrode in 0.5 M Na&304, pH 5. Potential scanned from 0 to 1.40 V at u = 100 mV/s.
1'2 1 0.8
h
o.2 1 / O . O L / ' , ' I ' 1 ' I ' f ' 1
0 1 0 0 2 0 0 300 4 0 0 5 0 0 600
v (mV/s) Figure 3. Reduction peak current corrected for background vs the scan rate.
( b p ~ ) 3 ~ + adsorbed on HOPG. The estimated area of the reduction wave corresponded to about 10-l' mol/cm2.
In a preliminary experiment to investigate the ECL emission from adsorbed R~(bpy)3~+ on HOPG, a piece of HOPG was treated as above and then totally immersed in solution I1 (phosphate buffer containing TPrA). ECL emission was imaged with a CCD camera when the potential of the HOPG was stepped from 0 to 1.60 V (Figure 4). No ECL emission was observed for an HOPG electrode that had not been previously immersed in Ru(bpy)S2+ solution. The observed emission on this piece of HOPG was clearly higher along the edges of the electrode, suggesting preferential adsorption of Ru(bpy)a2+ on the edge planes of HOPG. To limit our observations to the basal plane of the HOPG, the cell shown in Figure 1 was used for all other ECL measurements. With this cell, only the HOPG basal plane surface contacted the test solution. The ECL images taken with the CCD camera with this cell are shown in Figure 5. Figure 5B indicates that R~(bpy)3~+ adsorbed on the HOPG basal plane forms uniform layers. The observed emission intensity de-

Electrogenerated Chemiluminescence Langmuir, Vol. 10, No. 7, 1994 2411
Figure 4. ECL of an HoPG/R~(bpy)3~+ electrode in 0.19 M phosphate bufferl0.13 M TPrA, pH 7, imaged with the CCD camera. The electrode was prepared as described in the text with immersion in a 0.89 pM R~(bpy)3~+ solution for -6 h. The potential was stepped from 0 to 1.60 V, and the exposure time was 60 s.
A
B
Figure 5. (A) Photograph of the cell under external illumina- tion taken just prior to ECL measurement. (B) ECL of the HoPG/R~(bpy)3~+ electrode in the cell shown in part A (diagrammed in Figure 1) imaged with the CCD camera. Experimental conditions as in Figure 4.
creased with successive potential steps. Typically, the ECL emission from the HoPG/R~(bpy)3~+ could not be detected with the CCD camera after the third potential step from 0 to 1.60 V, suggesting that the adsorbed Ru- (bpy)s2+ was lost from the HOPG surface during the potential step.
The decay of the light intensity (I) as a function of time (t) was also investigated with the single-photon-counting system. The light intensity detected by the photomulti- plier tube, when the potential was stepped from 0 to 1.60 V, decreased with time (Figure 6). A typical current-
I T
"IME(s) Figure 6. Emission-time transient for the HoPG/R~(bpy)3~+ electrode obtained with the single-photon-counting system. Experimental conditions were as in Figure 4.
a
b
500 8.u. I
500 8.u. I C
t 1 1 1 1 1 1 1 1 1
1.6 I .2 0.8 0.4 0
E (V) vs SCE Figure 7. (a) Cyclic voltammogram and (b) emission-potential transient of HOPG/Ru(bpy)s2+ electrode in 0.19 M phosphate buffed0.13 M TPrA, pH 7. The electrode was prepared as described in the text with immersion in a 243 nM Ru(bpy)s2+ solution for -6 h. (c) Emission-potential transient of bare HOPG electrode in the same solution. In each case, the potential was scanned from 0 to 1.60 V at u = 50 mV/s.
time (i- t) transient during the potential step was similar to the emission-time transient in Figure 6. Again, the I-t and i-t transients suggest loss of R~(bpy)3~+ from the HOPG surface. Similar results were obtained with potential sweeps, i.e., determination of Z and i as func- tions of potential (E) as it was swept from 0 to 1.60 V (Figure 7). A large and broad oxidation wave with E,, near 1.4 V, attributed to the oxidation of the TPrA at the HOPG, appeared. The oxidation wave of adsorbed Ru- ( b ~ y ) 3 ~ + on HOPG was too small to be observed in this voltammogram and was masked by the large oxidation current from the TPrA. ECL emission took place at the same potentials as those of the oxidation wave. A similar ECL experiment conducted with a bare HOPG electrode showed only weak background ECL emission (Figure 7c). Low backgrounds in ECL experiments have been at-

2412 Langmuir, Vol. 10, No. 7, 1994
4.0 -
3.0 - h
-E 3
2
0 2.0 -
CI
v
L 1.0 -
Xu and Bard
1.2
x .=: 1 0.8 el z: '0 w .d .ra
0.4 n"
0
t I
( 1 ' I
t
0 200 400 600 800
c (nM) Figure 8. Normalized ECL intensity vs Ru(bpy)P concentra- tion.
tributed to oxidation of trace impurities in the s ~ l u t i o n ~ ~ ' ~ or to inverse photoemission from the electrode.14J6
The observed ECL emission, after immersingthe HOPG in a Ru(bpy)s2+ solution followed by washing and then transfer $0 a solution containing TPrA, demonstrates strong adsorption of Ru(bpy)s2+. The mechanism of emission under these conditions can be attributed to the following reaction sequence, based on previous solution phase ~tudies, '~J' although detailed mechanistic studies of TPrA oxidation have not yet been carried ou t
Ru(bpy),2f(ads) - e- - Ru(bpy)? (6)
CH,CH,CH,mr, - e- - CH3CH2CH2fiPr2+
[at electrode or via reaction with Ru(bpy)?l
(7)
CH,CH,CH,&Pr,+ - CH,CH,CHNF'r, + H+ (8)
Ru(bpy)? + CH,CH,CHNPr, - Ru(bpy)t+* + CH3CH2CHNPr2+ (9)
The decay of intensity with time suggests desorption of R ~ ( b p y ) ~ ~ + from the electrode surface and diffusion into the bulk solution.
Concentration Dependence of ECL Emission. To obtain the adsorption isotherm for Ru(bpy)P on HOPG, we investigated the relationship between the ECL in- tensity and Ru(bpy)s2+ concentration. In these experi- ments, the HOPG was immersed in solutions of Ru(bpy)s2+ of different concentrations for -6 h and again rinsed with copious amounts of deionized water followed by observa- tion of the ECL emission during a potential sweep from 0 to 1.60 V. The ECL peak emission was normalized with respect to the largest emission observed with a series of concentrations after subtraction of background emission. A plot of the normalized ECL emission vs the R~(bpy)3~+ concentration is presented in Figure 8. The observed
(13) Ege, D.; Becker, W. G.; Bard, A. J . h L Chem. 1984,56,2413. (14) McIntyre, R.; Sass, J. K. J . Electroaml. C h m . 1986,196,199. (15) McCord, P.; Bard, A. J. Unpublished experiments. (16) Leland, J. IC;Powell,M. J. J . E h t m h e m . Soc. 1990,137,3127. (17) Nofsinger, J. B.; Danielson, N. D. Anal. Chem. 1987, 59, 865.
I 0 1 I I I I I I
0 200 400 600 800
c (nM) Figure 9. Surface concentration of Ru(bpy)a2+ on HOPG (r) vs solution concentration of Ru(bpy)a2+.
response is roughly consistent with that expected for Ru- (bpy)s2+ adsorption, with the ECL emission increasing with increasing Ru(bpy)g2+ concentration and reaching saturation a t a concentration of about 0.5 pM.
An alternative approach to a determination of the concentration dependence of Ru(bpy)s2+ adsorbed on HOPG was based on the decrease in the Ru(bpy)s2+ concentration of a solution following immersion of HOPG in the solution. In these experiments, the edges of the HOPG electrode were sealed with five-minute epoxy cement (Devcon) to prevent Ru(bpy)s2+ from adsorbing on the edges. To obtain significant concentration changes on adsorption, dilute (60-300 nM) solutions of Ru(bpy)s2+ were used. The HOPG (exposed surface area, 2 cm2) was soaked in 10 mL of solution for -6 h. The solution concentrations before and after immersion of HOPG were determined from the ECL emission utilizing the Perkin- Elmer QPCR analyzer. The solutions for analysis were prepared by diluting 1 mL of each solution to 25 mL with assay buffer I11 to adjust the Ru(bpy)s2+ concentration to the linear range of the analyzer. A plot of the surface concentration of adsorbed Ru(bpy)s2+ (r) on HOPG vs the solution concentration is shown in Figure 9. A control experiment with a piece of Si totally covered with epoxy cement to yield the same area as that ofthe exposed HOPG immersed in 243 nM Ru(bpy)gP+ showed a negligible (<0.3%) change in the ECL signal, demonstrating that Ru(bpy)s2+ does not adsorb on the cement itself. Satura- tion is again seen at a Ru(bpy)s2+ solution concentration of -0.5 pM, with r,, = 2.5 x mol/cm2. Given experimental uncertainties, this is close to that expected for a close-packed monolayer for Ru(bpy)g2+, estimated as -1 x 10-lo mol/cm2.Is The experimental results indicate that monolayer amounts ofRu(bpy)s2+ adsorb on the basal plane of HOPG and that ECL emission results from this adsorbed Ru(bpy)s2+ upon oxidation in a solution contain- ing tripropylamine.
ECL Emission with Platinum and Gold Sub- strates. Similar adsorption and ECL emission were found with Pt and Au electrodes. Effects of this adsorption were clearly seen in experiments in thin-layer cells with either Au or Pt electrodes in the IGEN flow injection analyzer. In this experiment, the thin-layer cell was first cleaned with NaOH cell cleaner and assay buffer I11 was pumped
(18) Kim, Y.-T.; McCarley, R. L.; Bard, A. J. J . Phys. Chem. 1992, 96, 7416.

Electrogenerated Chemiluminescence
3
A C
b
a " 1 I I I I I I I I I
0 0.4 0.8 1.2 1.6
E (V) vs SCE Figure 10. Emission-potential transients at a 2.9-mm- diameter Pt electrode in assay buffer I11 obtained with the IGEN flow injection analyzer: (a) clean Pt electrode; (b and c) Pt electrode soaked in 234 nM Ru(bpy)s2+ solution for -10 and 20 min, respectively, and then washed by passing deionized water through the cell for 30 min.
C
b
0 0.4 0.8 1.2 1.6
E (V) vs SCE Figure 11. Emission-potential transients at a 2.9-mm- diameter Au electrode in assay buffer I11 obtained with the IGEN flow injection analyzer: (a) clean Au electrode; (b and c) Au electrode soaked in 234 nM R~(bpy)3~+ solution for -10 and 20 min, respectively, and then washed by passing deionized water through the cell for 30 min.
into the cell. Background ECL emission was recorded when the potential was scanned from 0 to 1.60 V, as shown in Figures 10a (Pt) and l l a (Au). Deionized water was then passed through the cell for -10 min, followed by a 234 nM Ru(bpy)s2+ solution which remained in the cell in contact with the Pt or Au electrodes for 10 and 20 min. The cell was then washed by passing deionized water through the cell for -30 min, followed by assay buffer I11 for 5 min. Typical ECL emission-potential transients
Langmuir, Vol. 10, No. 7, 1994 2413
4 a 1mA I
C
I 500 a.u.
I 500 a.u.
1 - 1 I I r I I I I 1.6 1.2 0.8 0.4 0
E (V) vs SCE Figure 12. (a) Cyclic voltammogram and (b and c) emission- potential transients of FWR~(bpy)3~+ electrode in 0.19 M phosphate buffed0.13 M TPrA, pH 7. The electrode was prepared as described in the text with immersion in a 243 nM Ru(bpy)g2+ solution for -6 h. Potentials were scanned from 0 to 1.60 V at u = 50 mV/s. (b) First potential scan. (c) Second potential scan.
found on sweeping the potential from 0 to 1.60 V are shown in Figures 10b,c (Pt) and l lb,c (Au). Again, there is clear evidence for adsorption of R~(bpy)3~+ on the Pt and Au electrodes and ECL emission resulting from the adsorbed species, with the emission from Au significantly more intense than that from Pt.
Experiments similar to those carried out with HOPG sheet electrodes in the cell in Figure 1 were also performed with Au and Pt foil. In these experiments, freshly cleaned Pt and Au foils were immersed in 243 nM Ru(bpy)~~+ solutions for -6 h and then rinsed with copious amounts of deionized water. The Pt and Au substrates were then used as working electrodes in the cell in Figure 1 containing 0.19 M phosphate buffed0.13 M TPrA, pH 7, and ECL measurements were made with the single- photon-counting system. The observed ECL emission with Pt and Au was similar to that found with HOPG as shown in Figures 12 (Pt) and 13 (Au). No, or very low, ECL emission was observed with freshly cleaned Pt and Au surfaces that had not contacted R~(bpy)3~+ solutions. As shown in Figures 12 and 13, ECL emission decreased strongly on successive scans.
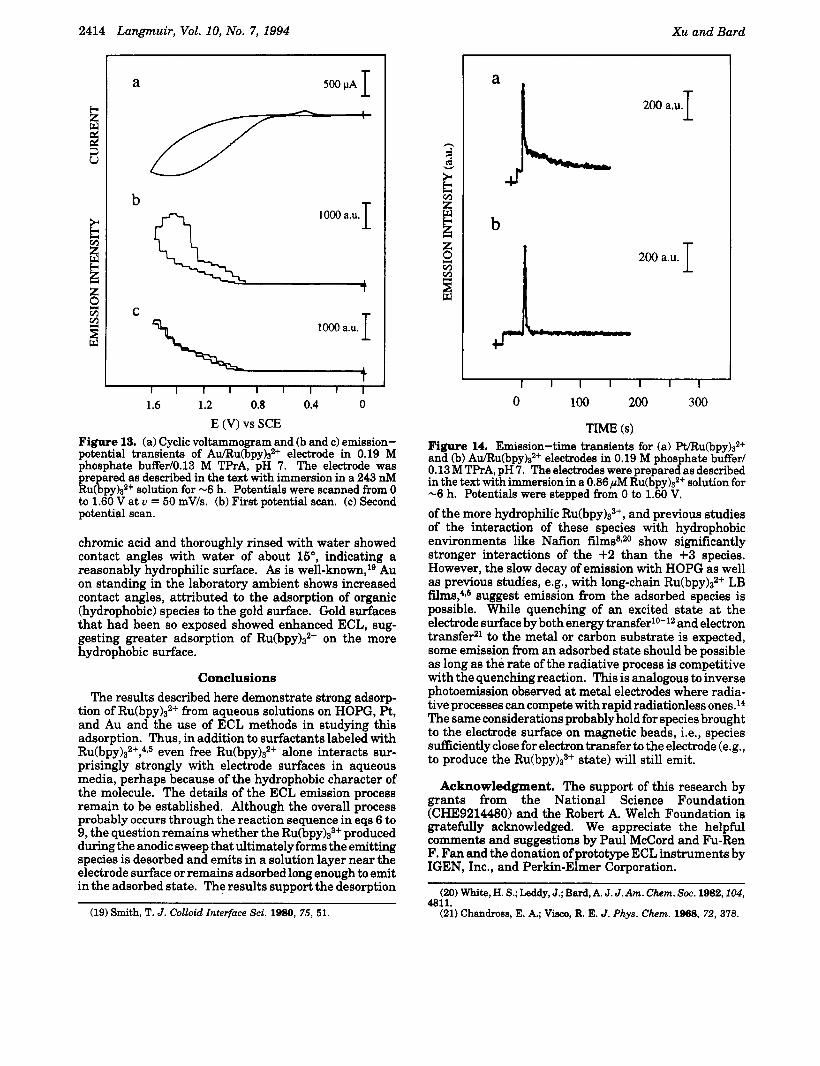
Although the ECL intensity shown on a single scan with Pt and Au was of the order of that found with HOPG when using single-photon-counting detection, ECL emis- sion from Pt and Au could not be imaged with the CCD camera. Because the emission intensity decayed very rapidly with Au and Pt, integration of emission for a sufficient time to obtain an image was not possible. Typical ECL transients for potential steps to 1.60 V at Pt and Au (single-photon-counting detection) are shown in Figure 14. Note the rapid decay of the Pt and Au transients compared with those seen with HOPG (Figure 6). The ECL found with these metals also depended upon the pretreatment of the Au or Pt before immersion in the Ru(bpy)s2+ solution. For example, Au treated with hot
2414 Langmuir, Vol. 10, No. 7, 1994 Xu and Bard
a
b I IO00 a.u.
C lo00 a.u.
1 1 1 1 1 1 1 1 1
1.6 1.2 0.8 0.4 0
E (V) vs SCE Flgure 13. (a) Cyclic voltammogram and (b and c) emission- potential transients of Au/Ru(bpy)s2+ electrode in 0.19 M phosphate buffer/O.l3 M TPrA, pH 7. The electrode was prepared as described in the text with immersion in a 243 nM Ru(bpy)s2+ solution for -6 h. Potentials were scanned from 0 to 1.60 V at u = 50 mV/s. (b) First potential scan. (c) Second potential scan.
chromic acid and thoroughly rinsed with water showed contact angles with water of about 15", indicating a reasonably hydrophilic surface. As is w e l l - k n o ~ n , ~ ~ Au on standing in the laboratory ambient shows increased contact angles, attributed to the adsorption of organic (hydrophobic) species to the gold surface. Gold surfaces that had been so exposed showed enhanced ECL, sug- gesting greater adsorption of Ru(bpy)sZ+ on the more hydrophobic surface.
Conclusions The results described here demonstrate strong adsorp-
tion of Ru(bp~)3~+ from aqueous solutions on HOPG, Pt, and Au and the use of ECL methods in studying this adsorption. Thus, in addition to surfactants labeled with R~(bpy)3~+,4.~ even free Ru(bpy)p2+ alone interacts sur- prisingly strongly with electrode surfaces in aqueous media, perhaps because of the hydrophobic character of the molecule. The details of the ECL emission process remain to be established. Although the overall process probably occurs through the reaction sequence in eqs 6 to 9, the question remains whether the Ru(bpy)s3+ produced during the anodic sweep that ultimately forms the emitting species is desorbed and emits in a solution layer near the electrode surface or remains adsorbed long enough to emit in the adsorbed state. The results support the desorption
(19) Smith, T. J. Colloid Interface Sci. 1980, 75, 51.
I 200 a.u.
b
I 200 a.u.
I I I I I I I
0 100 200 300
TrhJl.E 6) Figure 14. Emission-time transients for (a) Pt/Ru(bpy)s2+ and (b) Au/Ru(bpy)s2+ electrodes in 0.19 M phosphate buffer/ 0.13 M TPrA, pH 7. The electrodes were prepared as described in the text with immersion in a 0.86 ,uM Ru(bpy)S2+ solution for -6 h. Potentials were stepped from 0 to 1.60 V.
of the more hydrophilic Ru(bpy)s3+, and previous studies of the interaction of these species with hydrophobic environments like Nafion films8P2O show significantly stronger interactions of the +2 than the +3 species. However, the slow decay of emission with HOPG as well as previous studies, e.g., with long-chain Ru(bpy)s2+ LB films,4P6 suggest emission from the adsorbed species is possible. While quenching of an excited state at the electrode surface by both energy transferl0-l2 and electron transferz1 to the metal or carbon substrate is expected, some emission from an adsorbed state should be possible as long as the rate of the radiative process is competitive with the quenching reaction. This is analogous to inverse photoemission observed at metal electrodes where radia- tive processes can compete with rapid radiationless ones.14 The same considerations probably hold for species brought to the electrode surface on magnetic beads, i.e., species sufficiently close for electron transfer to the electrode (e.g., to produce the Ru(bpy)s3+ state) will still emit.
Acknowledgment. The support of this research by grants from the National Science Foundation (CHE9214480) and the Robert A. Welch Foundation is gratefully acknowledged. We appreciate the helpful comments and suggestions by Paul McCord and Fu-Ren F. Fan and the donation of prototype ECL instruments by IGEN, Inc., and Perkin-Elmer Corporation.
4811. (20) White, H. 5.; Leddy, J.; Bard, A. J. J.Am. Chem. Soc. 1982,104,
(21) Chandroes, E. A,; Visco, R. E. J . Phys. Chem. 1968, 72, 378.