electrochemical immunosensors and peptide self …tesi.cab.unipd.it/26611/1/solda_tesi.pdf ·...
TRANSCRIPT
UNIVERSITÀ DEGLI STUDI DI PADOVA
Facoltà di Scienze MM. FF. NN.
Dipartimento di Scienze Chimiche
Tesi di Laurea Magistrale in Chimica
Electrochemical Immunosensors and Peptide Self-Assembled Monolayers
for Cancer Biomarker Protein Detection
Relatore: Prof. Flavio Maran
Correlatore: Prof. James F. Rusling (University of Connecticut, USA)
Controrelatore: Prof. Fabrizio Mancin
Laureando: Alice Soldà
Anno Accademico 2009-2010

2

3
“Non basta guardare,
occorre guardare con occhi che vogliono vedere, e che credono in quello che vedono.”
(Galileo Galilei)

4

5
Acknowledgments
I would like to thank Prof. Flavio Maran for believing in me since the first
time. He gave me the opportunity to complete my Thesis work in the University
of Connecticut (UCONN, Storrs, CT). Most importantly, I would like to thanks
him for his moral and financial support, and for the thousands of good advice that
helped me to grow professionally and temperamentally in these months.
I would like to thank Prof. James Rusling, (Department of Chemistry of
the University of the Connecticut – UCONN, Storrs, CT) for his great hospitality,
the financial support and the opportunity that he gave me to work in his research
group: in those months, I learnt many things about the immunosensors’ world.
I would like also to thanks Dr. Dharamainder Chaudary (UCONN Health
Center, Farmington, CT) to provide me Nanog biomarker samples and the relative
antibodies and Prof. Edward Samulski (Department of Chemistry, University of
North Carolina, Chapel Hill, NC) for clearing to all my doubts about IRRAS
investigation, even though he did not know me directly.
I am grateful to all members of Prof. Maran’s group: from Dr. Sabrina
Antonello, who constantly helped and supported me even in the most critical
moments with good advices, to Martina for her friendship and for making more
pleasant the hard lab’s days with her songs and Ivan, for providing me all
peptides, even in relatively short times. A special thank is addressed to
Pierangelo, which initially convinced me to take this road and after passed me his
knowledge about SAMs’ procedure ... (lo ringrazio un po’ meno per le costanti
battutine a doppio senso con cui mi perseguitava ogni giorno).
I am grateful also to all members of Prof. Rusling’s group that followed
and helped me during the period that I spent there. In particular Bhaskara, for
teaching me everything I know now about the biosensors (although sometimes the
experiments followed more a mystical way, that a scientific one with all those
“Abrakadabra”), and Ruchika for her support and advices. I would say also
thanks to Ahbay, Danuka, Vigneshwaran, Alex, Linlin, Collen, Sadagopan,
Niamesh, Shenmin, and the others.

6
7
Index
Chapter 1. Introduction .............................................................................. 9
1.1 Biosensors ........................................................................................ 9
1.1.1 Electrochemical Immunosensors ............................................. 11
1.1.2 Microfluidic Electrochemical Device for High Sensitivity
Biosensing ............................................................................... 13
1.1.3 Nanog Protein as Biomarker of Cancer .................................. 14
1.2 Self-Assembled Monolayers (SAMs) as a Platform for
Biosensors ..................................................................................... 16
1.2.1 Electron Transfer through SAMs ............................................ 17
1.2.2 Self-Assembled Monolayer .................................................... 19
1.2.3 Types of Substrates and Characterization of SAMs ................ 21
1.2.4 Nature of the Metal-SAM Interface ......................................... 23
1.2.5 Organization of the Organic Layer .......................................... 25
1.3 Gold Electrochemical Biosensors ............................................ 27
1.4 α-Aminoisobutyric Acid 310-Helices as Adsorbate for
SAMs............................................................................................... 28
1.4.1 Characteristic of the Investigated Aib-Homopeptides ............. 33
1.5 Purposes of the Thesis ................................................................ 36
Chapter 2. Experimental .......................................................................... 38
2.1 Chemicals ....................................................................................... 38
2.2 Preparation of HRP Single Electrodes .................................... 38
2.3 Fabrication of the Microfluidic Device and Preparation of
Eight-Electrode Array ................................................................. 42
8
2.4 Gold Preparation and SAM Formation .................................. 44
2.5 Instruments .................................................................................... 46
2.5.1 Electrochemistry ...................................................................... 46
2.5.2 IRRAS ..................................................................................... 46
Chapter 3. Results and Discussion .................................................... 47
3.1 Electrochemical Immunosensors ............................................. 47
3.1.1 Characterization of AuNP Platform ....................................... 47
3.1.2 Electrochemistry Immunosensors ........................................... 50
3.1.3 Analysis of the Immunosensors’ Performance........................ 53
3.2 IRRAS Characterization of Peptide SAM ............................. 69
3.2.1 The Metal-Surface Selection Rule .......................................... 70
3.2.2 Characterization of Aib-Homopetides .................................... 74
3.2.3 Characterization of Aib-Homopeptide SAMs ......................... 79
3.2.4 Determination of the Orientation of Adsorbed Molecules ...... 93
3.2.5 Determination of the Thickness of the Monolayer ................ 100
Chapter 4. Conclusions ......................................................................... 103
Chapter 5. References ............................................................................ 107

9

10
11
1. Introduction
1.1 Biosensors
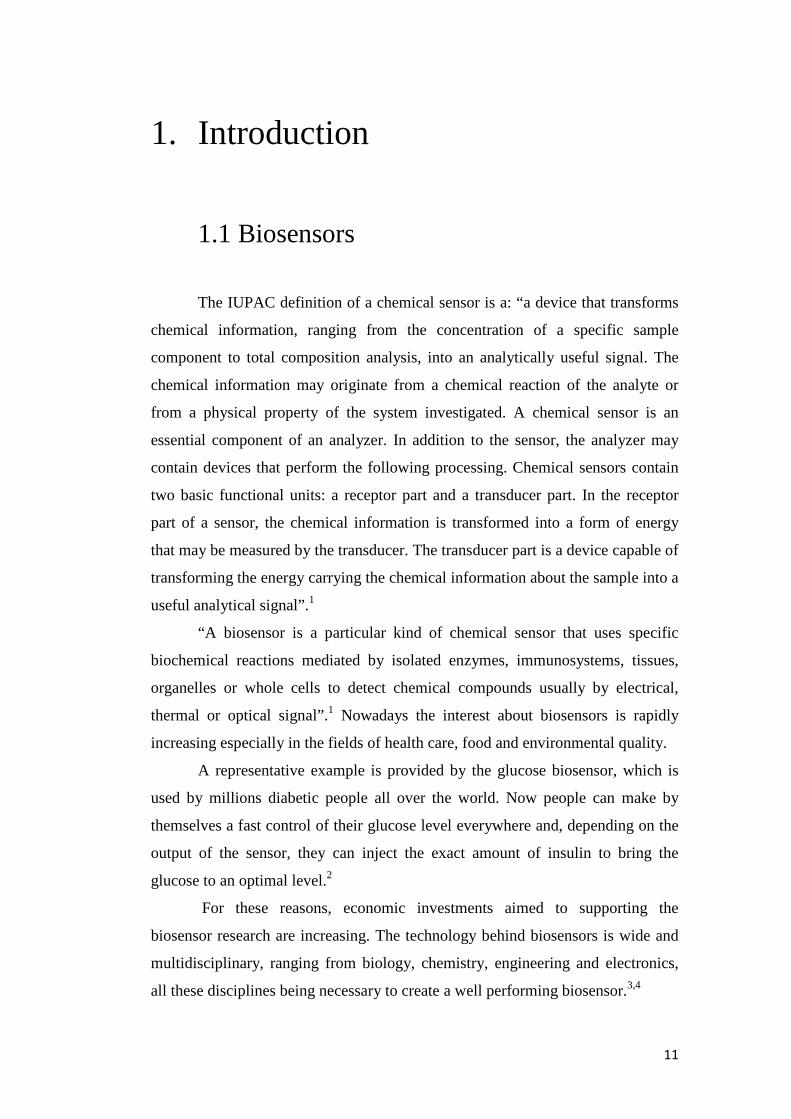
The IUPAC definition of a chemical sensor is a: “a device that transforms
chemical information, ranging from the concentration of a specific sample
component to total composition analysis, into an analytically useful signal. The
chemical information may originate from a chemical reaction of the analyte or
from a physical property of the system investigated. A chemical sensor is an
essential component of an analyzer. In addition to the sensor, the analyzer may
contain devices that perform the following processing. Chemical sensors contain
two basic functional units: a receptor part and a transducer part. In the receptor
part of a sensor, the chemical information is transformed into a form of energy
that may be measured by the transducer. The transducer part is a device capable of
transforming the energy carrying the chemical information about the sample into a
useful analytical signal”.1
“A biosensor is a particular kind of chemical sensor that uses specific
biochemical reactions mediated by isolated enzymes, immunosystems, tissues,
organelles or whole cells to detect chemical compounds usually by electrical,
thermal or optical signal”.1 Nowadays the interest about biosensors is rapidly
increasing especially in the fields of health care, food and environmental quality.
A representative example is provided by the glucose biosensor, which is
used by millions diabetic people all over the world. Now people can make by
themselves a fast control of their glucose level everywhere and, depending on the
output of the sensor, they can inject the exact amount of insulin to bring the
glucose to an optimal level.2
For these reasons, economic investments aimed to supporting the
biosensor research are increasing. The technology behind biosensors is wide and
multidisciplinary, ranging from biology, chemistry, engineering and electronics,
all these disciplines being necessary to create a well performing biosensor.3,4

12
A biosensor is made by two essential components integrated: a bioreceptor
and a transducer. The first one is a biological molecule that can specifically
interact and recognize the molecules present in the sample analyte, for example
proteins, DNA, enzymes, but also a whole cell. The second component is an
electrochemical or optical device that converts the recognition event into a
measurable signal (Figure 1).
Figure 1. General biosensor scheme.
The outcome is both qualitative and quantitative because while the
specificity of the signal is guaranteed by the bioreceptor, the intensity is most
often related to the concentration of the analyte. From these considerations, we
infer the most important features that a good biosensor should possess:
I. The bioreceptor must have a very high specificity toward the analyte, a
good stability under different experimental conditions, and a good
reproducibility;
II. The transducer must have good properties as either an electron transfer
mediator or an optical device, and it should be stable and easily modified
or functionalized;
III. To allow for a fast and easy utilization, the pre-treatment phase should be
minimal. It also is important to keep at minimum the number of
parameters that could influence the performance of the measurement;
IV. The output should be accurate, easily understandable, reproducible, free of
background noise, and in the range of interest;
V. It should be cheap and user friendly.
13
Based on the position of the transducer, there are three main types of
biosensors; the products of the reactions diffuse to the transducer causing an
electrical signal; the products of the reactions are identified by a mediator that
interacts with the transducer to generate the signal; the reaction itself is
recognized by the transducer. The transducer can then be classified according to
the mechanism of analyte recognition. Electrochemical, optical, and thermal
biosensors can be identified based on the type of signal used for gathering
information about the analyte.5
Electrochemical biosensors can be classified according to the specific
electrochemical method employed. A potentiometric biosensor is based on the
measurement of variations of the electrode potential with respect to a reference
electrode, or the potential difference between two references electrodes separated
by a permeoselective membrane.6 An amperometric biosensor measures the
current generated by an applied potential between two electrodes.
Optical biosensors are based on surface plasmon resonance, and they have
recently received considerable attention owing to their high accuracy and
reliability. They measure the different ways by which materials or molecule may
interact with the light (absorbance of the light, the reflected light, the light output
by a luminescent reaction, etc.). One of the most popular materials used in this
field is gold nanoparticles of suitable size.7
Thermal (calorimetric) biosensors measure the difference of temperature
before and after the reaction. In fact, the majority of the enzymes catalyze
exothermic reactions and thus the heat generated can be measured.8
1.1.1 Electrochemical Immunosensors
Sensitive quantitative detection of protein biomarkers is critical to many
areas of biomedical research and diagnostics, systems biology, and proteomics.
Biomarker levels in serum can detect and monitor diseases such as cancer. In this
context, sensors need to be simple operationally, capable of rapid multiplexed
detection, inexpensive, and must display sufficiently good sensitivity and
detection limits to address the levels of the biomarkers in both normal and cancer
patient serum.9
14
Conventional ways of measuring proteins include enzyme-linked
immunosorbent assays (ELISA), radioimmunoassay (RIA), electrophoretic
immunoassay, and mass spectroscopy-based proteomics. These techniques often
involve sophisticated instrumentation, significant sample volumes, limited
sensitivity and clinically unrealistic expense and time. ELISA-like approaches
have been successfully adapted to immunoarrays systems. These ultrasensitive
multilayer arrays, relying on optical or electrical detection, have considerable
promise for achieving point-of-care measurement.9
Immunosensors are biosensors based on the antigen-antibody interaction,
which is responsible for eventually generating the actual signal. This type of
biosensors has, in principle, high specificity and low limit of detection thanks to
the extreme affinity that antibodies have for their antigen. Whereas antibodies are
proteins produced by the immune system, antigens can be a variety of different
molecules, from protein to DNA, lipids, etc. 10 In the following, we provide a brief
description of the structure of antibodies to appreciate better how they work and
can be used in biosensors.
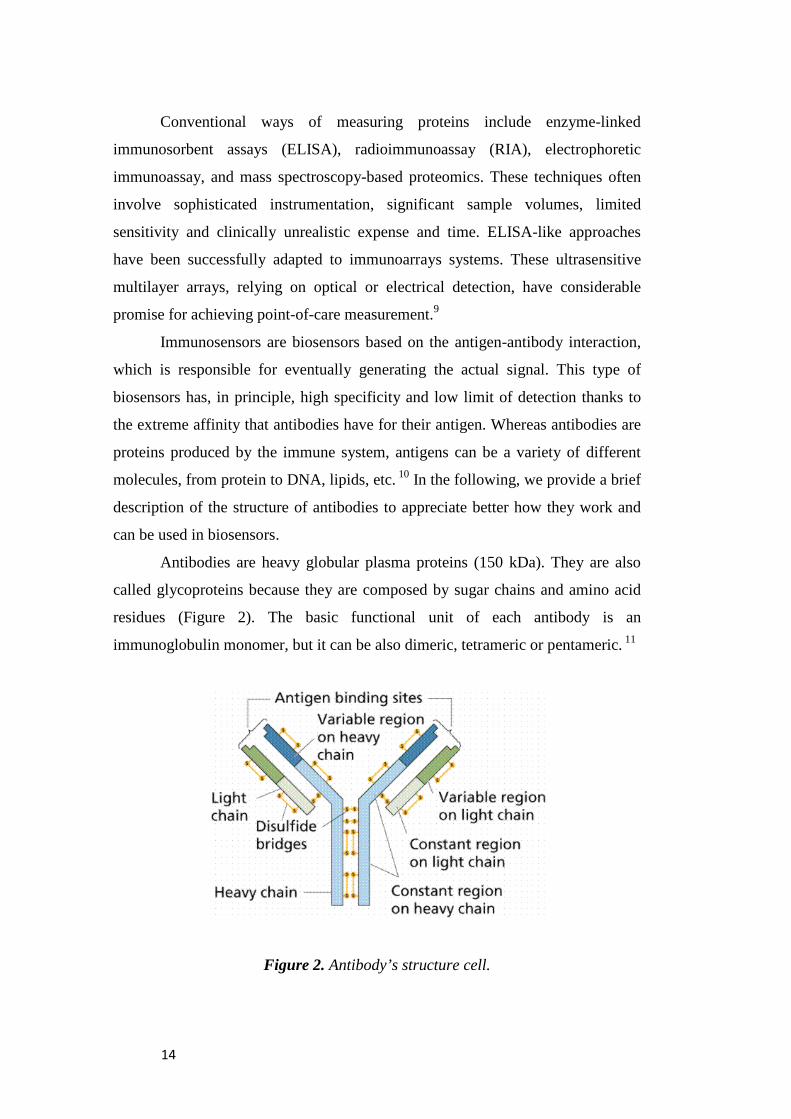
Antibodies are heavy globular plasma proteins (150 kDa). They are also
called glycoproteins because they are composed by sugar chains and amino acid
residues (Figure 2). The basic functional unit of each antibody is an
immunoglobulin monomer, but it can be also dimeric, tetrameric or pentameric. 11
Figure 2. Antibody’s structure cell.
15
The monomer has a “Y” form, which is made of 4 chains: two identical
light and two identical heavy chains. These chains are connected by disulfide
bonds. Both chains are also divided in two regions: one constant and one variable.
The variable regions of both the heavy and of the light chains interact to form the
antigen binding site, and thus each monomer has two sites with the same
specificity to recognize and link the antigen. The constant region of the heavy
chains determines the function of the antibody.11
Immunosensors are most often optical or electrical and therefore antigens
and antibodies themselves are not sufficient to generate a sizeable detection
signal. For this reason, to permit the transfer of the signal it is necessary to
conjugate a label molecule or a material to the first antibody; gold nanoparticles
are often used for their particular properties. The chemical groups of the antibody
used for conjugations are mainly amine (-NH2), thiol (-SH), or hydroxyl (-OH)
groups.12-13
Of particular relevance to the work carried out during this Laurea
Magistrale thesis, which based on electrochemical biosensors, is the presence of a
redox enzyme. To increase the electric signal, a secondary antibody (Ab2) is often
added. Its function is to bind both to the analyte protein/s and to the redox
enzyme, such as horseradish peroxidase (HRP). Rusling and co-workers found
that, there are 14-16 HRP units per secondary antibody.9 On the other hand, the
same authors found that sensitivity is greatly amplified by using magnetic beads
bioconjugated with HRP labels, the number of active HRP per nanoparticle being
estimated to be 7500.9
1.1.2 Microfluidic Electrochemical Device for High
Sensitivity Biosensing
Another aspect relevant to my Thesis concerns microfluidic devices. The
latter have the ability to analyze very small quantities of sample, to limit the
reagent use, and to carry out analyses at high resolution and sensitivity, low cost,
and in short time. Microfluidic devices have applications in biology, chemistry
and medicine, including measurement of diffusion coefficient, fluid viscosity, and
16
binding constant, as well as DNA analysis, cell separation, cell pattering, capillary
electrophoresis and immunoassays. Implementing biosensors in microfluidic
format provides a potentially more efficient approach to control and automate
sample introduction and steps such as washing and reagent addition. By coupling
with microfluidics, immunoassay procedures could potentially be made fast
enough for point-of-care without sacrificing sensitivity.14
Microfluidics devices are commonly fabricated in glass, silicon, or
polymers, with polymers finding considerable recent attention.
Poly(dimethylsiloxane) (PDMS) is used extensively to fabricate these
microfluidic devices using photolithography or more simply by polymer
deposition onto molds. The work carried out in the Rusling group at the
University of Connecticut, and relevant to this Thesis research, relies on an
electrochemical sensor constructed by integrating injection-molded electrodes into
a polystyrene micro-flow channel.14 A simple microfluidic device was used for
electrochemical biosensing, fabricated by mold deposition and validated by
sensitive detection of hydrogen peroxide. The device features a single
microfluidic channel made from PDMS coupled to a fixed volume injector, and
incorporates a biocatalytic sensing electrode, a reference electrode and a counter-
electrode. PDMS was chosen because it is easily moldable, soft and readily
integrated with outside components, and effective protocols exist to inhibit
biomolecular contamination. Whereas the detection limits of biomarkers in a
microfluidic biosensor are usually better than those obtained with a simple
rotating-disk electrode in a conventional electrochemical cell, the sensitivity is
comparable between the two systems. The improvement of detection limit may be
related to a better control of mass transport in the microfluidic system compared
to the rotating-disc electrode system, leading to better signal-to-noise.14
1.1.3 Nanog Protein as Biomarker of Cancer
A few words about the specific biomarker protein used in my Thesis work
are necessary. The stem-cell-abundant protein Nanog is highly expressed in
undifferentiated embryonic stem (ES) cells and regulates stem-cell differentiation.
Nanog is a unique homeobox transcription factor and has a homeodomain with
17
homology to members of the natural killer gene family; indeed it has a similar
critical role in regulating the cell fate of the pluripotent ICM (inner cell mass)
during embryonic development, maintaining the pluripotency epiblast and
preventing differentiation.15
This protein may play a role in carcinogenesis of embryonic cancer,
gliomas, liver cancer, gastric cancer, and other cancers. The role of Nanog in the
transformation of cervical epithelial cells carcinoma, and the occurrence and
development of cervical carcinoma have not been investigated in detail. The
expression of Nanog in cervical epithelia lesions of varying severity and in
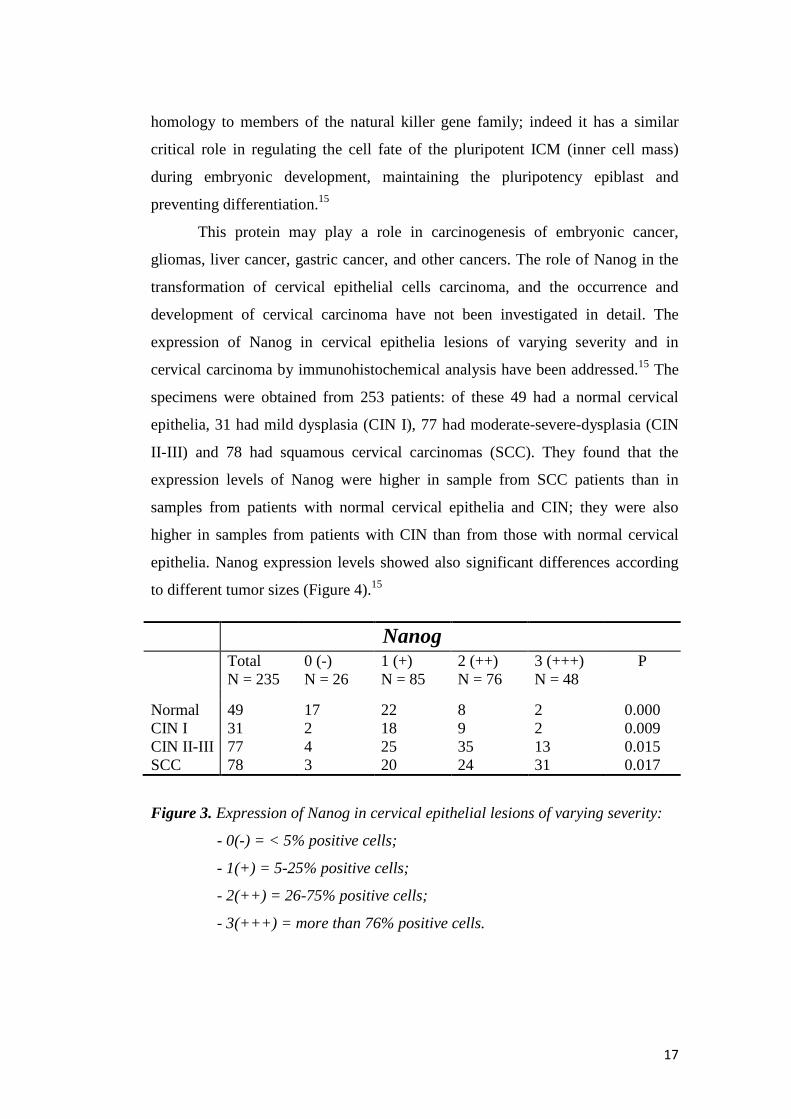
cervical carcinoma by immunohistochemical analysis have been addressed.15 The
specimens were obtained from 253 patients: of these 49 had a normal cervical
epithelia, 31 had mild dysplasia (CIN I), 77 had moderate-severe-dysplasia (CIN
II-III) and 78 had squamous cervical carcinomas (SCC). They found that the
expression levels of Nanog were higher in sample from SCC patients than in
samples from patients with normal cervical epithelia and CIN; they were also
higher in samples from patients with CIN than from those with normal cervical
epithelia. Nanog expression levels showed also significant differences according
to different tumor sizes (Figure 4).15
Nanog
Total N = 235
0 (-) N = 26
1 (+) N = 85
2 (++) N = 76
3 (+++) N = 48
P
Normal 49 17 22 8 2 0.000 CIN I 31 2 18 9 2 0.009 CIN II-III SCC
77 78
4 3
25 20
35 24
13 31
0.015 0.017
Figure 3. Expression of Nanog in cervical epithelial lesions of varying severity:
- 0(-) = < 5% positive cells;
- 1(+) = 5-25% positive cells;
- 2(++) = 26-75% positive cells;
- 3(+++) = more than 76% positive cells.

18
Figure 4. Nanog expression and localization in (A) normal cervical epithelial
cells; (B) CIN I cells; (C) CIN II-III cells; (D) SCC cells. The distinct brown color
indicative of Nanog was detected in the cytoplasm of the positive cells.
1.2 Self-Assembled Monolayers (SAMs) as
Platforms for Biosensors
The building of biochemical sensors and, particularly, electrochemical
biosensors based on the deposition of functionalized layers on solid substrates is
gaining increasing importance.16 Making surfaces that can be used for biosensing
involves surface modifications aimed at specifically changing the way they
interact with the environment, usually a solution. Biosensors are devised to bind
the analyte and transduce the binding event to a sizeable output signal, whether
optical or electrochemical, that can be used for quantification. The nature of the
surface is of paramount importance to determine the performance of the device or
sensor. In electrochemical biosensors, where detection is associated with the onset
of a reduction or an oxidation current, the second important ingredient for
devising a well-performing system is the efficiency of electron transfer (ET).
Understanding and controlling electron conduction through the monolayer (or
multilayer) interposed between the underlying conducting substrate and solution
species diffusing in proximity of the outer monolayer interphase is indeed
essential for transducing the biomolecule recognition into a significantly large
19
electrochemical current. In recent years, several groups have been studying ET
reactions through metal electrode – organic monolayer systems, particularly those
based on self-assembled monolayers (SAMs) obtained by spontaneous adsorption
of thiolated molecules or disulfides onto gold substrates.16b,17 Main factors
affecting the ET rate through SAMs are the monolayer thickness, the structure and
orbitals of the adsorbed thiols, the presence of ionic or pH-sensitive terminal
groups on the solution side, and further factors related to the solution.
1.2.1 Electron Transfer through SAMs
Understanding the mechanisms of ET reactions is a fundamental challenge
in a variety of areas of chemistry and biochemistry.18-21 Considerable
achievements in this direction have been gathered by studying long-range electron
or hole transfers in proteins20a and DNA.21a Long-range ET reactions are
intrinsically nonadiabatic and may proceed by different mechanisms. One
important path for long-range ET is provided by the superexchange mechanism,
where the electron tunneling is mediated by the bridge separating the donor and
the acceptor but without transient occupation of the bridge electronic states.19a,22
The ET rate constant depends on the electronic coupling between the reactant and
product states at the transition state and is proportional to exp(−βdDA), where dDA
is the donor-acceptor distance and β is the exponential factor describing the falloff
rate through the specific bridge. Alternatively, the bridge may provide localized or
partially delocalized electronic states where electrons may hop by an incoherent
mechanism.21a,23 Because electron injection into the first bridge unit is the slow
step, the ET rate is mildly dependent on the increase of bridge units. Sequential
electron hopping may become more efficient than superexchange when the bridge
is made sufficiently long. Such a competitive-reaction scheme has received a
general consensus for charge transfer across DNA strands,21a,23a but it has not been
clearly assessed whether this scheme can be extended to proteins and thus
peptides,24 unless suitable amino-acid side-chain groups are present along the
peptide chain.25
Long-range ETs have been extensively studied, using freely diffusing
donor – molecular bridge – acceptor systems (with either outer-sphere19a or
20
dissociative-type acceptors26), electrode – molecular bridge – electrode
junctions,27 and electrode – SAM – redox moiety, where the latter (e.g., a
ferrocenyl group or a redox protein) is covalently or electrostatically bounded to
the solution side of the SAM’s adsorbate/s.17a,17b,17e,28-32 The distance dependence
of the ET rate and thus the observed β factor depend on the actual molecule
forming the monolayer and thus the nature of the bonds of the bridge separating
donor and acceptor. With alkanethiol ferrocene-terminated SAMs, where only
saturated C-C bonds are present, the dependence is exponential, in agreement with
the superexchange mechanism.28 On the other hand, different outcomes have been
reported for peptide SAMs decorated by ferrocene moieties. Whereas some
peptide SAMs display a simple exponential dependence, though with β values
remarkably smaller than for hydrocarbon chains, there are reports of the
observation of very mild distance dependences of the ET rate (β < 0.1 Å-1) that
were interpreted as due to a hopping ET mechanism or to the dynamics of the of
α- or β-amino acid peptide chain.29,30a,33
The number of ET studies based on the determination of ET rate constants
between SAM-modified electrodes and freely diffusing solution species is more
limited31a,34-39 and, in fact, no study has been yet reported for peptide SAMs.
Indeed, the use of soluble redox probes is often employed to test how tight and
blocking is a given SAM. Generally, the use of solution redox probes is affected
by problems in assessing and controlling the quality and packing of the SAMs
(see below), which implies a possible penetration of the redox species through the
SAM defects and thus an apparent increase of the ET rate. The effect of having
charges on the SAM periphery or different pH values and electrolytes is solution
has been addressed. Electrostatic repulsion between charged head groups in the
outer monolayer periphery and charged probes influences the ET rate quite
significantly. For example, alkanethiols with positive terminal functionalized
groups and self-assembled on gold can block ET between the substrate and a
positively charged electroactive species dissolved in the electrolyte solution.40
Most studies, however, have been carried out with uncharged monolayers and
constant solvent/electrolyte conditions, and thus imply no coulombic corrections
in the definition of the ET rate constant.
21
Beside intrinsic factors directly related to the chemical nature of the
molecules forming the SAM, there are important issues concerning the dynamics
of the SAM41 and the quality of the latter. Indeed, although making SAMs
involves relatively simple chemistry, the resulting modified surfaces are affected
by heterogeneity in coverage and this may affect signal transduction in
electrochemical sensors. For example, by using a fluorescence-microscopy
electrochemical method, Bizzotto and co-workers studied the potential-dependent
desorption of alkanethiolate and DNA SAMs on gold surfaces, and concluded that
heterogeneity in surface coverage may be stronger than expected.42 Indeed, the
main reason why long-range ET through SAMs has been studied mostly by using
redox groups linked to the end of the monolayer adsorbate is that this strategy
helps minimizing the problem of defects, as the presence of the latter should not
affect (at least for sufficiently well-packed SAMs) the main electron tunneling
pathway, i.e., through bonds. On the other hand, transduction in sensors involves
detection of redox species dissolved in solution and thus a preliminary screening
of the ET mediating property of a given SAM needs to be based on the
observation of the electrochemical behavior of a freely diffusing redox probe. ET
occurs by electron tunneling through the SAM but also through pinholes and other
defects. The observed ET rate constant is thus generally the result of a
combination of contributions and discerning between them is a difficult
task.34,43,44
1.2.2 Self-Assembled Monolayer
SAM form from spontaneous adsorption of a molecular layer onto a
substrate. Bare surfaces of metals and metal oxides tend to accidentally adsorb
organic materials readily because these adsorbates lower the free energy of the
interface between the metal or metal oxide and the environment. These adsorbates
also alter interfacial properties and can have a significant influence on the stability
of nanostructures of metals and metal oxides. The organic material can act as a
physical or electrostatic barrier against aggregation, decreasing the reactivity of
the surface atoms, or act as an electrically insulating film. Surfaces coated with
these materials, however, are not well defined as do not present specific chemical
22
functionalities and do not have reproducible physical properties (e.g.,
conductivity, wettability, or corrosion resistance). Nevertheless, SAMs provide a
convenient, flexible, and simple system with which to tailor the interfacial
properties of metals, metal oxides, and semiconductors.45-55
SAMs form by the adsorption of molecular constituents from solution or
gas phase onto the surface of solids. The adsorbates organize spontaneous into
crystalline or semicrystalline structures.56 The molecules (or ligands) that form
SAMs have a chemical functionality, or “head group”, with a specific affinity for
a substrate. There are a number of head groups that bind to specific metals, metal
oxides, and semiconductors, but the most extensively studied class of SAMs is
derived from the adsorption of alkanthiols on gold. The high affinity of thiols for
the surfaces of noble and coinage metals makes it possible to generate well-
defined organic surfaces with useful and highly alterable chemical functionalities
displayed at the exposed interface. SAMs are therefore nanostructures with a
number of useful properties. The composition of the molecular components of the
SAM determines the atomic composition of the SAM covering the surface. This
characteristic makes it possible to use organic synthesis to tailor organic and
organometallic structures at the surface with positional control approaching ~0.1
nm. SAMs can be fabricated into patterns having 10-100 nm scale dimensions
parallel to the surface. SAMs are well-suited for studies in nanoscience and
technology because of the following characteristics:
1) They are easy to prepare, that is, they do not require ultrahigh vacuum
(UHV) or other specialized equipment (e.g. Langmuir-Blodgett (LB) troughs) in
their preparation.
2) They form on objects of all sizes and are critical components for
stabilizing and adding function to preformed, nanometer-scale objects (for
example, thin films, nanowires, colloids, and other nanostructures, they are also
suitable for biomolecules immobilization).
3) They can couple the external environment to the electronic (current-
voltage responses, electrochemistry) and optical (local refractive index, surface
plasmon frequency) properties of metallic structures.
4) They link molecular-level structures to macroscopic interfacial
phenomena, such as wetting, adhesion, and friction.
23
5) Flexibility to design the head group of SAM with various functional
groups in order to accomplish hydrophobic or hydrophilic surface as per the
requirements.
6) Ability to unravel molecular level information about phenomena such as
protein adsorption, DNA hybridization, antigen-antibody interaction etc. using
surface sensitive techniques such as scanning probe microscopies.5
1.2.3 Types of Substrates and Characterization of SAMs
The substrate is the surface on which a SAM forms. Types of substrates
range from planar surfaces (glass or silicon labs supporting thin films of metal,
metal foils, single crystals) to highly curved nanostructures (colloids,
nanocrystals, nanorods). Planar substrates are widely used for characterizing the
structure-property relationships of SAMs because they are easy to prepare and
compatible with a number of techniques for surface analysis and physicochemical
characterization such as cyclic voltammetry, scanning probe microscopies,
infrared reflectance absorption spectroscopy (IRRAS), Raman spectroscopy, X-
ray photoelectron spectroscopy (XPS), near edge X-ray absorption fine structure
spectroscopy, contact angle goniometry, optical ellipsometry, surface plasmon
resonance spectroscopy, and mass spectrometry. Other metallic nanostructures,
such as nanoparticles, can also support SAMs, and these systems can be
characterized by many other techniques.
The structures of SAMs and the mechanisms by which they assemble are
topics that have evolved considerably over the past two decades, particularly
because there have been substantial advances made in methods suitable for
characterizing them. The development of scanning probe microscopies provided
powerful new capacities to study both the structural organization of SAMs and the
assembly process at a molecular level. These techniques have greatly extended the
initial structural understandings derived mainly from spectroscopic techniques
(IRRAS, XPS, ellipsometry, etc.) and physical methods (principally studies of
wetting). The extensive literature on SAMs has established a common point of
view that SAMs naturally exhibit a high degree of structural order after assembly
and, therefore, form well-defined phases of organic groups organized in precisely

24
understood lateral organizations on the underlying substrate. In fact, SAMs are
dynamic materials that include significant forms of structural complexities,
especially when immersed in fluids. As a rule, SAMs embed intrinsic and
extrinsic defects because they adopt adsorbed structures that are directed by the
thermodynamics of a reasonably complex chemisorption process.
Figure 5. Schematic illustration of some of the intrinsic and extrinsic defects
found in SAMs formed on polycrystalline substrates.
The cartoon of Figure 5 shows how SAMs can be substantially more
complex than the highly ordered arrangements that are commonly assumed. The
causes of defects in SAMs are both intrinsic and extrinsic. Examples of external
factors include cleanliness of the substrate, the methods for preparing the substrate
and the purity of the solution of adsorbate. On the other hand, these defects can be
eliminated by proper control of the experimental conditions. Examples of intrinsic
factors are the many structural defects that the substrate has itself and the complex
phase behaviors due to the dynamic system of the SAMs. These defects can be
minimized but never completely eliminated.
The assembly process involves a thermodynamic equilibrium between
adsorbates on the surface and their precursors free in solution. Although these
SAMs may be kinetically stable in the absence of a flux of adsorbate, the high
coverage of the adsorbate present in the SAM is, in fact, thermodynamically
unstable. Only in a case where the rate of desorption is rigorously zero would the
SAM be expected to exist for an indeterminate period outside the solution used to
prepare it.

25
1.2.4 Nature of the Metal-SAM Interface
Most SAMs of practical interest are formed at reactive interfaces. The
adsorbate and the substrate are both transformed to some degree by the reactions
that lead to the formation of the SAM itself. The chemistry involved for the
chemisorption of thiols on gold is in principle the most straightforward, but it
probably remains as the most enigmatic. Because gold does not form a surface
oxide (as, for example, does silver), the formation of SAMs from thiols is not
complicated by chemistry that might be required to displace or reduce surface
oxides. On the other hand the details regarding the nature of the metal-sulfur bond
and the spatial arrangement of the sulfur groups on the underlying gold lattice are
still controversial.
The formation of a thiolate requires the chemical activation of the S-H
bond of the thiol (or the S-S bond of the disulfide). It is established that the
adsorption of dimethyl disulfide on Au(111) occurs dissociatively.57 The reaction
is reversible, and recombinative desorption of the disulfide is an activated process
with a barrier of ca. 30 kcal/mol. This energy suggests that a fairly significant
degree of charge transfer to sulfur must occur in the thiolates.58 Of particular
interest was the estimation that the barrier for the bimolecular recombinative
desorption of an alkanethiolate from a SAM on gold in the form of a dialkyl
disulfide is ~15 kcal/mol.59 This value is approximately a factor of 2 less than that
deduced in the gas-phase studies. We note here, though, that the two energies are
not directly comparable given that one also contains contributions from the heats
of dissolution of the adsorbate as well as the heat of immersion of the substrate in
the solvent. In this context, the range of reported values appears to be one that
follows directly from the different forms of the measurements used to assess the
strength of the Au-S bonding interaction. As the vacuum measurements are most
easily interpreted, it is reasonable to conclude that the Au-S bond that anchors the
SAM is, in fact, a reasonably strong one (a homolytic Au-S bond strength on the
order of ca. -50 kcal/mol) based on the known S-S homolytic bond strength of a
typical dialkyl disulfide (~62 kcal/mol).60
The fate of the hydrogen of the S-H groups still has not been determined
unambiguously. It seems probable that adsorption in a vacuum leads to loss of the

26
hydrogen in the form of molecular hydrogen. The reductive elimination of H2
from Au(111) is a weakly activated process. In aqueous solution, another
possibility exists. If the thiol hydrogen is not lost in the form of H2, the presence
of oxygen in the reaction medium might also lead to its oxidative conversion to
water. In either case, the Au-S bonding interaction in the thiolate is sufficient to
retain the chains at the surface in a durable fashion and preclude a recombinative
desorption of a disulfide product at room temperature.
The central bonding habit of the high-coverage alkanethiol phases on
Au(111) is generally accepted to be based on a (√3x√3)R30° overlayer (R=
rotated).61-75 Figure 6 shows this structure schematically. The SAMs formed by n-
alkanethiols are usually described as simple thiolate adlayers (chemisorbed
structures formed by the activation of the S-H bond at the gold surface).66-67
Within this model there has been considerable discussion of the surface sites
involved in this bonding. Most studies of SAMs on gold have employed substrates
presenting a strong (111) texture to support the monolayer. Other studies have
been directed at different crystallographic textures, although the structural
literature available in these cases is far more limited.65,68
Figure 6. Schematic diagram depicting the arrangement of decanethiolates on
Au(111) lattice when maximum coverage of the thiolates is attained. (a) The
arrangement shows a (√3x√3)R30° structure where the sulfur atoms (dark gray
circles) are positioned in the 3-fold hollows of the gold lattice (white circles). The
light gray circles with the dashed lines indicate the approximate projected surface
area occupied by each alkane chain; the dark wedges indicate the projection of
the CCC plane of the alkane chain onto the surface. The alkane chains tilt in the
direction of their next-nearest neighbors; (b) Cross-section of the SAM.
27
1.2.5 Organization of the Organic Layer
The geometric arrangement of the sulfur moieties on the surface and the
nearest-neighbor distances between the metal atoms at the surface are factors that
determine the upper limit on the density of molecules on the surface. This two-
dimensional density of molecules may not correspond, however, to the density
that the same molecules could attain in a crystalline form. The arrangement of
molecules that is dictated by the placement of the sulfur moieties on the surface
may not maximize the lateral interactions between the organic components of the
SAMs. To minimize the free energy of the organic layer, the molecules adopt
conformations that allow high degrees of Van der Waals interactions and, for
some molecules such as peptides, hydrogen bonds with the neighboring
molecules; these arrangements yield a secondary level of organization in the
monolayer that is important in determining macroscopic materials properties, such
as wetting and conductivity of the SAMs.
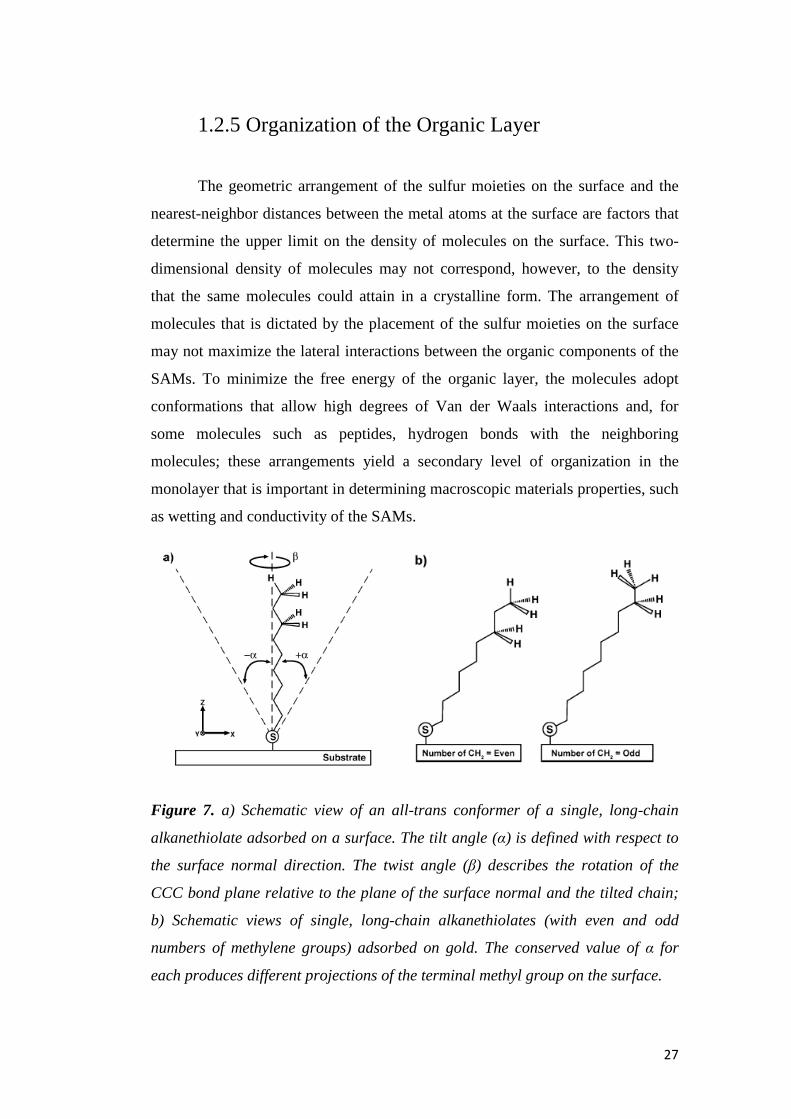
Figure 7. a) Schematic view of an all-trans conformer of a single, long-chain
alkanethiolate adsorbed on a surface. The tilt angle (α) is defined with respect to
the surface normal direction. The twist angle (β) describes the rotation of the
CCC bond plane relative to the plane of the surface normal and the tilted chain;
b) Schematic views of single, long-chain alkanethiolates (with even and odd
numbers of methylene groups) adsorbed on gold. The conserved value of α for
each produces different projections of the terminal methyl group on the surface.
28
A simple single-chain model is sufficient to facilitate comparisons of the
organization adopted by different organosolfur compounds with (mostly) linear
conformations on different types of substrates (Figure 7a). Two parameters
describe the variations in the orientation of the organic molecules in the SAM: the
angle of tilt for the linear backbone of the molecule away from the surface normal
(α) and the angle of rotation about the long axis of the molecule (β). As defined in
Figure 7, α can assume both positive and negative values; values of β range from
0° to 90°. For SAMs formed from n-alkanethiols on gold, palladium, silver,
copper, mercury, platinum, and other metals, the alkane chains adopt a quasi-
crystalline structure where the chains are fully extended in a nearly all-trans
conformation. The tilts of these chains vary for the various metals: the largest
cants (α, with an absolute value near 30°) are found on gold, while the structures
most highly oriented along the surface normal direction arise on silver (α ~10°)
and mercury (α ~0°). The average β for gold lies near 50°, while for other metals,
the data, where available, indicates values generally clustered near 45°. These data
are consistent with space-filling models involving (at least for the case of gold)
chain tilts lying along the direction of the next-nearest neighbor, i.e., an ordered
structure involving a hexagonal arrangement of the sulfur atoms. These
assumptions have been confirmed by the results of diffraction studies.69,70
Not all thiolated molecules adopt the same orientations as n-alkanethiols.
For cases where the steric requirements of the adsorbate preclude the ordering
found for the n-alkanethiolate structures, evidence of other organizations has been
detected. The values of α for SAMs formed by n-alkanethiols on Au(111) appear
to be unique. The tilt of the chain projects an orientation of the average chain in
which the sign of the tilt angle is conserved regardless of the number of carbons in
the alkane chain. All available data suggest that the structures exhibited by
thiolate SAMs on gold adopt a value of α ~ +30°. This feature of the assembly
leads to very different surface projections of the methyl groups for SAMs with
odd and even numbers of methylene groups (Figure 7b) and correlates strongly
with the unique wetting behaviors of SAMs on gold; SAMs of thiolates with an
odd number of methylene groups produce surfaces whose free energies are
systematically slightly larger than those with an even number of methylenes.
29
1.3 Gold in Electrochemical Biosensors
There are five characteristics of gold that make it a good choice as a
substrate for studying SAMs. First, gold is easy to obtain, both as a thin film and
as a colloid. It is straightforward to prepare thin films of gold by physical vapor
deposition, sputtering, or electrodeposition. Although expensive and not essential
to most studies of SAMs, single crystals are available commercially. Second, gold
is exceptionally easy to pattern by a combination of lithographic tools
(photolithography, micromachining, etc.) and chemical etchants. Third, gold is a
reasonably inert metal: it does not oxidize at temperatures below its melting point;
it does not react with atmospheric O2 and it does not react with most chemicals.
These properties make it possible to handle and manipulate samples under
atmospheric conditions instead of under UHV. Gold binds thiols with high
affinity, and it does not undergo any unusual reactions with them. Four, thin films
of gold are common substrates used for a number of existing spectroscopies and
other analytical techniques. This characteristic is particularly useful for
applications of SAMs as interfaces for studies in biology. Five, gold is compatible
with cells. SAMs formed from thiols on gold are stable for periods of days to
weeks when in contact with the complex liquid media required for cell studies.
The properties of gold nanoparticles (AuNPs), such as light absorption and
their excellent electroactivity, are bringing interesting immunosensing
alternatives. Particular emphasis is given to the different optical71 and
electrochemical72,73 detection methodologies where NPs show significant impact.
In certain cases, assays based on nanomaterials have offered significant
advantages over conventional diagnostic systems with regard to assay sensitivity,
selectivity, and practicatility.74 AuNPs are so small that they exhibit
characteristics that are often not observed in the bulk materials. This is due to the
quantum size effect that leads to unique optical, electronic, and catalytic
properties.75 AuNPs are also fully compatible with biomolecules, when decorated
with thin organic coatings. This has resulted in their use in sensors for DNA,
proteins, organic analytes, and metal ion. The use of thiol groups for their
functionalization is a good way to control the direction of the bond between the
30
label and the biomolecule. NPs’ involvement in DNA, protein and even cell
sensing systems, have recently been the most important topics in
nanobiotechnology.75
The electroactivity of AuNPs allows the use of both electrical and
electrochemical techniques for their detection, which allowed to detect low
concentrations of proteins.76 NPs can be directly detected due to their own redox
properties or indirectly due to their electrocatalytic properties toward other
species, such as silver ion reduction.
It is also worth mentioning that their large surface coupled with an easy
bioconjugation make NPs excellent carriers of other electroactive labels in
immunoassay.75 Nanoscale structures of AuNPs on conductive surface combined
with high electrical conductivity can facilitate fast ET to and from redox enzymes,
for examples horseradish peroxidase, providing a sensitive platform for
biosensors. AuNPs have been employed as nanoelectrode relay units transporting
electrons efficiently and activating enzyme bioelectrocatalysis.9 The introduction
of NPs into the traducing platform is commonly achieved by their adsorption onto
conventional electrode surfaces in various forms, including that of a composite.75
To summarize, modified AuNPs electrodes have very large surface areas,
are simple to fabricate and functionalized, retain metallic conductivity, and have
facile biomolecule attachment.9
1.4 α-Aminoisobutyric Acid 310-Helices as
Adsorbate for SAMs
The nature, stability and, for electrochemical biosensors, the electron
transfer properties of the SAM are of paramount importance to determine the
performance of a device or sensor. A question now arises: which are the
molecules of choice to make robust and performing SAM-based electrochemical
devices? SAMs should be sufficiently chemically and electrochemically stable,
well organized, and based on easily tunable molecules. The latter aspect includes
the ease by which the length (which implies modulating the SAM thickness) and
functionalization (with suitable groups on the molecule end facing the solution) of
31
the thiolated molecule can be controlled. The presence of further specific
structural features is also useful, such as the presence of intermolecular hydrogen
bonds between adsorbate molecules (such as C=O⋅⋅⋅H–N hydrogen-bonds
between embedded amide groups) which increases the SAM robustness. The
molecules that conveniently collect all these features, including their particular
compatibility with biomolecules, are peptides. The following question now is:
among all possible systems, which peptides are likely to provide particularly
suitable systems?
In this Thesis research, we also describe some self-assembly features of
thiolated α-aminoisobutyric (Aib) acid homooligomers on activated Au surfaces.
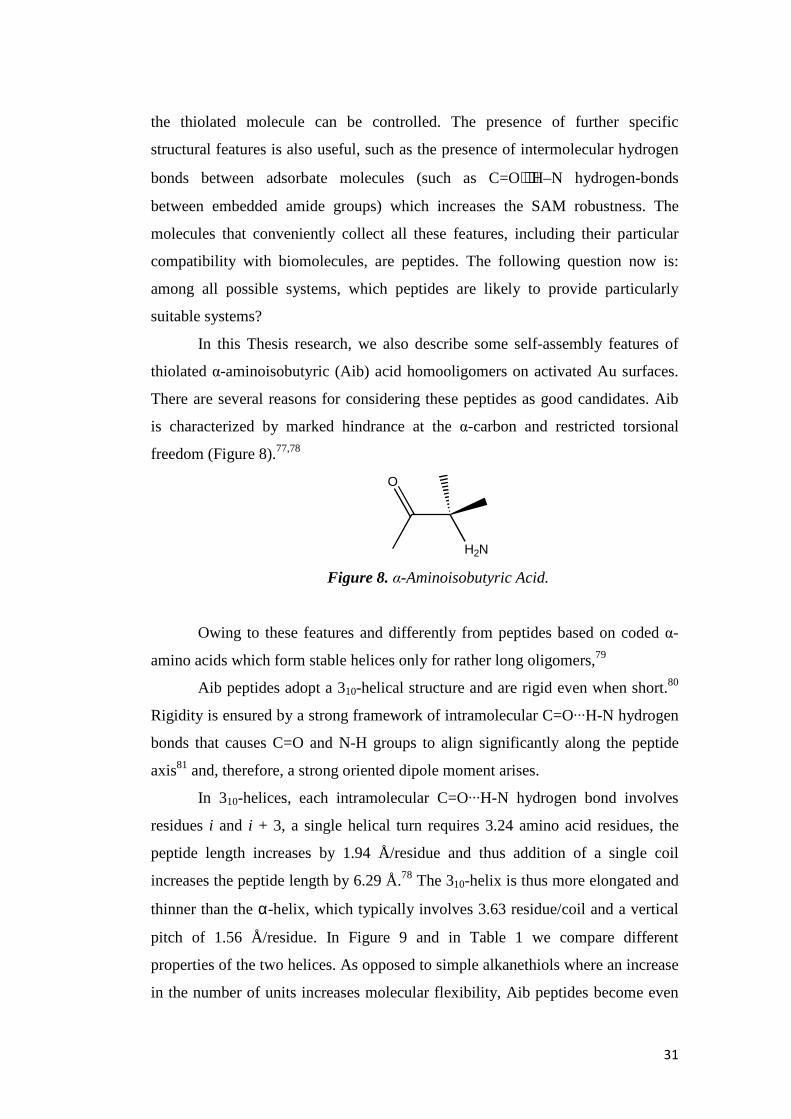
There are several reasons for considering these peptides as good candidates. Aib
is characterized by marked hindrance at the α-carbon and restricted torsional
freedom (Figure 8).77,78
H2N
O
Figure 8. α-Aminoisobutyric Acid.
Owing to these features and differently from peptides based on coded α-
amino acids which form stable helices only for rather long oligomers,79
Aib peptides adopt a 310-helical structure and are rigid even when short.80
Rigidity is ensured by a strong framework of intramolecular C=O···H-N hydrogen
bonds that causes C=O and N-H groups to align significantly along the peptide
axis81 and, therefore, a strong oriented dipole moment arises.
In 310-helices, each intramolecular C=O···H-N hydrogen bond involves
residues i and i + 3, a single helical turn requires 3.24 amino acid residues, the
peptide length increases by 1.94 Å/residue and thus addition of a single coil
increases the peptide length by 6.29 Å.78 The 310-helix is thus more elongated and
thinner than the α-helix, which typically involves 3.63 residue/coil and a vertical
pitch of 1.56 Å/residue. In Figure 9 and in Table 1 we compare different
properties of the two helices. As opposed to simple alkanethiols where an increase
in the number of units increases molecular flexibility, Aib peptides become even
32
stiffer as the number of residues, and thus of intramolecular hydrogen bonds,
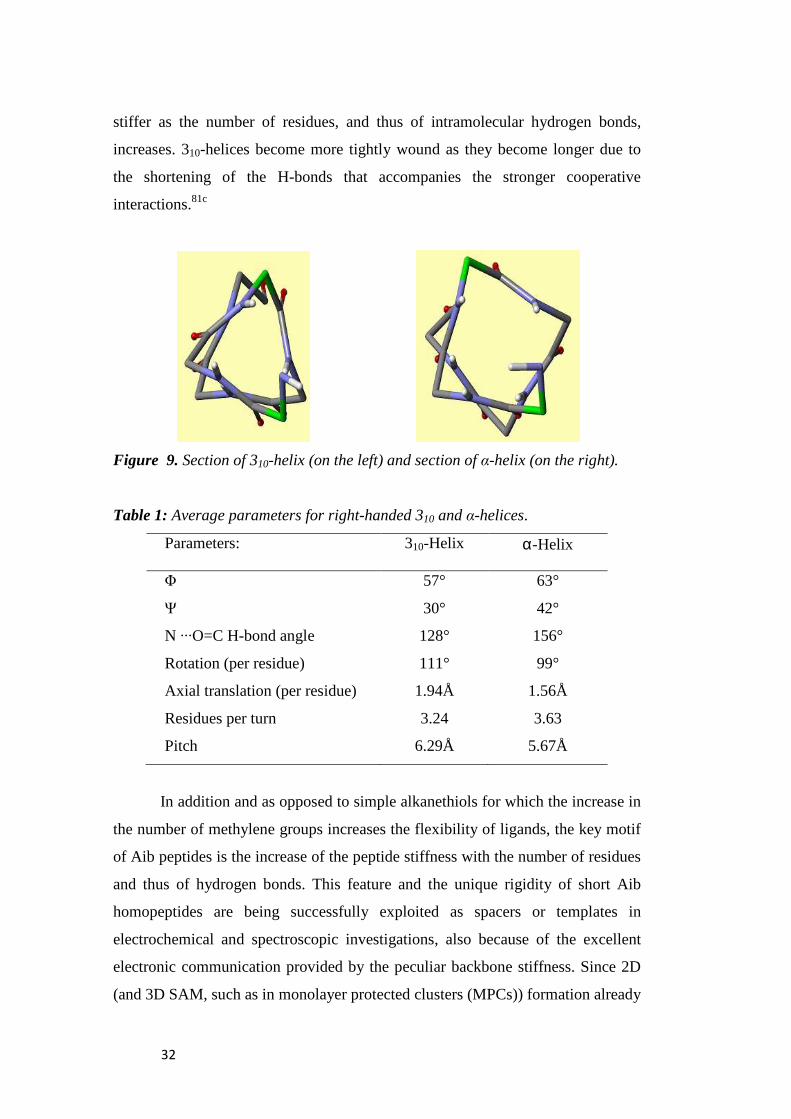
increases. 310-helices become more tightly wound as they become longer due to
the shortening of the H-bonds that accompanies the stronger cooperative
interactions.81c
Figure 9. Section of 310-helix (on the left) and section of α-helix (on the right).
Table 1: Average parameters for right-handed 310 and α-helices.
Parameters:
310-Helix α-Helix
Φ 57° 63°
Ψ 30° 42°
N ···O=C H-bond angle 128° 156°
Rotation (per residue) 111° 99°
Axial translation (per residue) 1.94Å 1.56Å
Residues per turn 3.24 3.63
Pitch 6.29Å 5.67Å
In addition and as opposed to simple alkanethiols for which the increase in
the number of methylene groups increases the flexibility of ligands, the key motif
of Aib peptides is the increase of the peptide stiffness with the number of residues
and thus of hydrogen bonds. This feature and the unique rigidity of short Aib
homopeptides are being successfully exploited as spacers or templates in
electrochemical and spectroscopic investigations, also because of the excellent
electronic communication provided by the peculiar backbone stiffness. Since 2D
(and 3D SAM, such as in monolayer protected clusters (MPCs)) formation already

33
causes the conformational freedom of alkanethiols to decrease dramatically, Aib
peptides are expected to behave as even more rigid adsorbates.
The 310-helix helical structure is stable both in the solid state and in
solution.78,80,82 It is also kept unaltered when thiolated Aib peptides are self-
assembled on 1-2 nm gold nanoclusters.83 With nanoparticles, compelling
evidence showed that these peptides also form interchain hydrogen bonds,
resulting in the formation of strong molecular networks. Insights into this
experimental observation were obtained by a multilevel molecular modeling
study.84 A previous analysis of the amide I and amide II regions of IRRAS spectra
of thiolated Aib hexapeptide SAMs on extended gold surfaces also pointed to the
presence of helices.85
The Maran group has previously studied ET reactions across Aib homo-
oligopeptides using donor-peptide-acceptor systems in solution.86 Evidence was
obtained for a mild distance dependence of the ET rate and even an increase of the
rate at a certain peptide length. This outcome was rationalized by considering that
while addition of a new α-amino acid unit increases the donor-acceptor distance,
it also introduces new intramolecular hydrogen bonds that act as efficient ET
shortcuts, thereby counteracting the usually observed exponential drop of the ET
rate with distance. Theoretical studies supported the general features of this
experimental finding.87 These results suggested us that Aib peptides may indeed
furnish ideal molecular bridges for making robust SAMs (molecular rigidity,
interchain network) for electrochemical biosensoring and other
nanobiotechnological applications. Based on the outcome of the solution studies,
efficient electron conduction through Aib-peptide SAMs was conceivably
expected, with useful consequences for detection of analytes through observation
of high redox currents when the SAM is the central part of a transducing
electrochemical platform. Very recently some thiolated Aib-peptides on mercury
electrodes and found that tight SAMs form.88 Although the main target of that
study was to estimate the surface dipole potential of the Aib-peptide SAMs, it was
also observed that the kinetics of the voltammetric reduction of Eu(III) was not
severely slowed by the presence of the peptide film: this also concurred to suggest
that Aib chains may mediate electron tunneling very efficiently. For peptides
thiolated on the nitrogen terminus, where the negative pole of the peptide dipole is
34
located, it was observed that the negatively polarized electrode produces an
interfacial electric field liable of orienting the peptide dipole even against its
“natural” dipole moment.
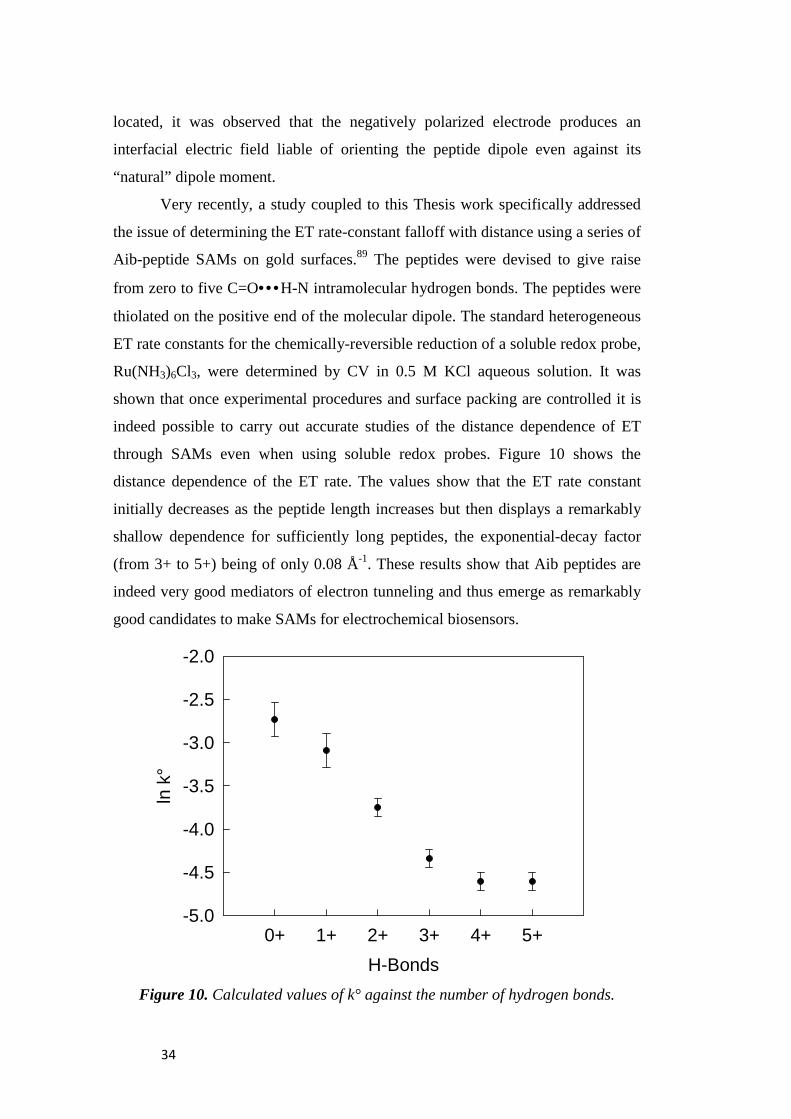
Very recently, a study coupled to this Thesis work specifically addressed
the issue of determining the ET rate-constant falloff with distance using a series of
Aib-peptide SAMs on gold surfaces.89 The peptides were devised to give raise
from zero to five C=O•••H-N intramolecular hydrogen bonds. The peptides were
thiolated on the positive end of the molecular dipole. The standard heterogeneous
ET rate constants for the chemically-reversible reduction of a soluble redox probe,
Ru(NH3)6Cl3, were determined by CV in 0.5 M KCl aqueous solution. It was
shown that once experimental procedures and surface packing are controlled it is
indeed possible to carry out accurate studies of the distance dependence of ET
through SAMs even when using soluble redox probes. Figure 10 shows the
distance dependence of the ET rate. The values show that the ET rate constant
initially decreases as the peptide length increases but then displays a remarkably
shallow dependence for sufficiently long peptides, the exponential-decay factor
(from 3+ to 5+) being of only 0.08 Å-1. These results show that Aib peptides are
indeed very good mediators of electron tunneling and thus emerge as remarkably
good candidates to make SAMs for electrochemical biosensors.
Figure 10. Calculated values of k° against the number of hydrogen bonds.
H-Bonds
0+ 1+ 2+ 3+ 4+ 5+
ln k
°
-5.0
-4.5
-4.0
-3.5
-3.0
-2.5
-2.0

35
1.4.1 Characteristics of the Investigated Aib-
Homopeptides
Two series of peptides were synthesized, differing in the direction of the
dipole moment: a plus series with the positive pole of the dipole moment oriented
toward sulfur and a minus series where the dipole moment is reversed. The name
of each peptide is given as composed by a number, which refers to the number of
intramolecular hydrogen bonds, and a plus or minus sign, which refers to the
orientation of the dipole moment.
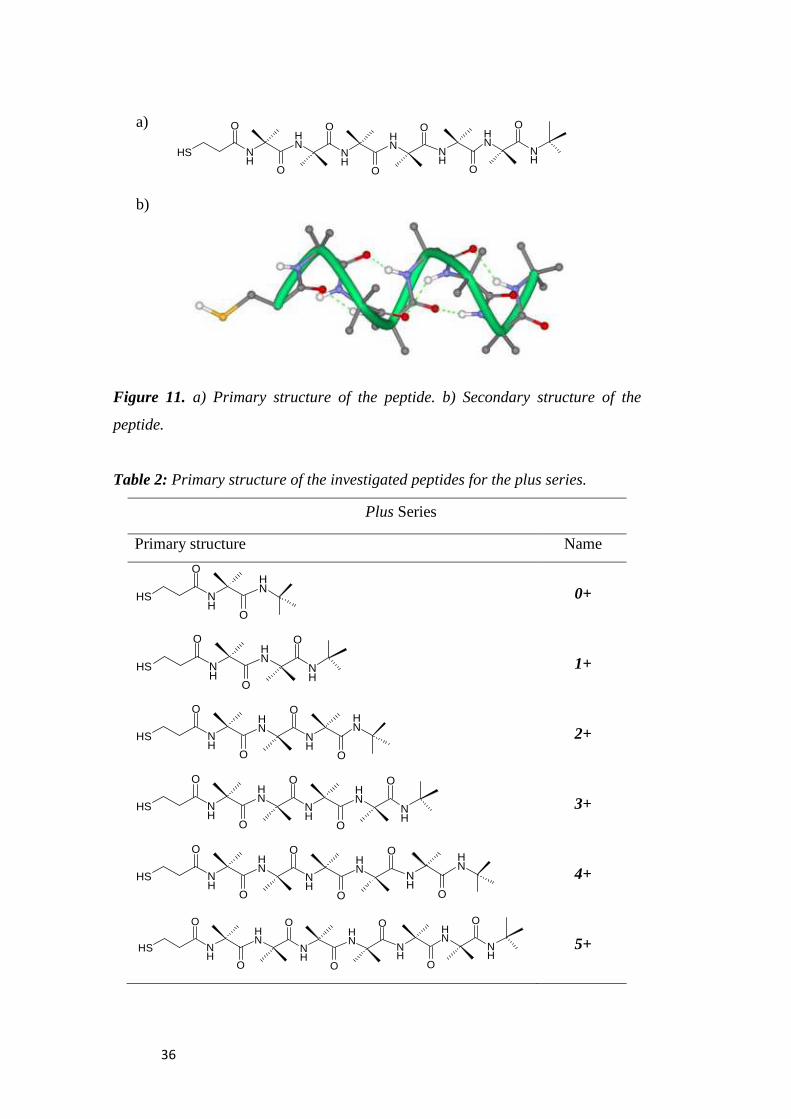
Figure 11 shows the primary and secondary structure of peptide 5+. This
peptide is used in the following discussion to explain the general design of our
systems. The head of our system is represented by the –SH. This group allows the
peptide to be attached to the gold surface. Between sulfur and the α-amino acid
chain there is a -CH2-CH2- spacer meant to facilitate the coordination to the
surface, which otherwise would be hindered by the strong steric hindrance of the
310-helix. On the other terminus, there is a t-butyl group. Figures 11a and 11b help
to understand better the orientation of the dipole. The helicity of the system infers
a particular orientation to the Aib residues, orienting all C=O groups toward the C
terminus and all N-H groups toward sulfur. Accordingly, the dipole moment (in
the plus series) has the plus pole by the thiol group. Table 2 shows the primary
structures for all the peptides belonging to the plus series.
For the minus series three peptides were synthesized (1-, 3- and 5-), to
investigate the effect of reversing the dipole moment and to compare the results
with the plus series, which is our reference series. In the minus series the
characteristics of the design are the same, but while the SH group is now attached
to the C terminus that now becomes the head of the peptide, the t-butyl group is
on the other terminus that becomes the tail. Figure 12 shows the primary (a) and
secondary structure (b) of 5-. From the 3D structure we can notice that the C=O
groups are now oriented toward SH, while the NH groups are oriented toward the
tail of the peptide. Consequently, the negative pole of the dipole moment is by the
thiol group. Table 3 shows the primary structures for all the peptides belonging to
the minus series.
36
a)
b)
Figure 11. a) Primary structure of the peptide. b) Secondary structure of the
peptide.
Table 2: Primary structure of the investigated peptides for the plus series.
Plus Series
Primary structure Name
SH
O
NH
O
NH
0+
NH
SH
O
NH
O
NH
O
1+
SH
O
NH
O
NH
O
NH
O
NH
2+
NH
SH
O
NH
O
NH
O
NH
O
NH
O
3+
SH
O
NH
O
NH
O
NH
O
NH
O
NH
O
NH
4+
SH
O
NH
O
NH
O
NH
O
NH
O
NH
O
NH
NH
O
5+
SH
O
NH
O
NH
O
NH
O
NH
O
NH
O
NH
NH
O

37
a)
NH
O
NH
O
NH
O
NH
O
NH
O
NH
NH
OO
SH
b)
Figure 12. a) Primary structure of the peptide. b) Secondary structure of the
peptide.
Table 3: Primary structure of the investigated peptides for the minus series.
Minus Series
Primary structure Name
NH
SHNH
O
NH
OO
1-
NH
SHNH
O
NH
O
NH
O
NH
OO
3-
NH
O
NH
O
NH
O
NH
O
NH
O
NH
NH
OO
SH
5-
38
1.5 Purposes of the Thesis
This Thesis concerns the development of a very efficient immunosensor
electrochemical device for detecting cancer biomarker proteins, and possible ways
to improve its efficiency by modifying parts of the system that are relevant to
improve stability and ET through the modified electrode surface.
For the part concerning the study of the ultrasensitive electrochemical
immunosensor (Figure 13) for early cancer biomarkers detection, I worked with
the research group of Prof. James F. Rusling (Department of Chemistry,
University of Connecticut, Storrs, CT, USA). The research associated with the
study of the stability and structure of Aib-peptide self-assembled monolayers to
be used for improving the sensor performance was carried out in the group of
Prof. Flavio Maran. The two topics are related because these peptides will be used
to anchor the antibody onto AuNPs. This, however, is an aspect that for time
limitations could not be covered during my Thesis work. Details on the Thesis
scope and structure are as follows.
We focused our attention on Nanog detection. Nanog is a protein that may
be involved in carcinogenesis of cervix and progression of cervical carcinoma.
Nowadays, the researchers still do not know the detection limit of this biomarker
and the difference of concentration between healthy individuals and patients with
cancer. Therefore, we aimed at making an electrochemical sensor capable of
displaying very high-sensitivity immunoarrays and low detection limit. Sensors
were prepared and, particularly, several conditions to make Nanog-based
electrodes were essayed. Eventually, we could optimize the conditions and obtain
a nice calibration plot (Amperometric current versus Nanog concentration). Most
of the initial work was carried out using the sample handling technology, but then
we integrated the system into a microfluidic device, the goal being to automate the
method as much as possible.
To improve the efficiency, we are about to further optimize the
immunosensor by changing some elements of the transducer, particularly by using
a SAM formed by peptides allowing very fast ET (see below) and by increasing

the active superficial area thanks to nanostructured gold electrodes
alternative to a bed of
Figure 13. AuNP immunosensor with Ab
from a sample after treating with Ab
enzyme labels for each Nanog. The detection step involves immersing the sensor
into buffer containing mediator, applying voltage, and injecting H
We carried out an investigation of related issues by using SAMs formed
with thiolated Aib peptides of different lengths. The effect of the orientation of the
peptide dipole moment was studied by a
nitrogen or carbon terminus. The stability and conformational properties of such
SAMs were assessed by
the IR absorption spectroscopy of the free peptides
these SAMs Aib peptides form 3
bonds, and pack tightly, the surface coverage depending on both the peptide
length and orientation. We also found that short peptides may undergo helix
disruption, with formation of structures where the n umber of inter
interactions increases. The results nicely support
concerning the chemical and electrochemical stability of these SAMs as well as
the efficiency of ET through t
know which peptides should provide the best transducer substrate supporting the
actual Nanog-sensor architecture.
the active superficial area thanks to nanostructured gold electrodes
to a bed of AuNPs.
AuNP immunosensor with Ab1 attached that has captured an antigen
from a sample after treating with Ab2-magnetic-bead-HRP providing multiple
enzyme labels for each Nanog. The detection step involves immersing the sensor
containing mediator, applying voltage, and injecting H
We carried out an investigation of related issues by using SAMs formed
with thiolated Aib peptides of different lengths. The effect of the orientation of the
peptide dipole moment was studied by attaching the thiolated moiety to either the
nitrogen or carbon terminus. The stability and conformational properties of such
SAMs were assessed by an extensive IRRAS investigation, in comparison with
the IR absorption spectroscopy of the free peptides. This study showed that in
these SAMs Aib peptides form 310-helices, form interchain C=O••
bonds, and pack tightly, the surface coverage depending on both the peptide
length and orientation. We also found that short peptides may undergo helix
disruption, with formation of structures where the n umber of inter
interactions increases. The results nicely supported what recently found
chemical and electrochemical stability of these SAMs as well as
the efficiency of ET through them. Main outcome of this study is that we now
know which peptides should provide the best transducer substrate supporting the
sensor architecture.
39
the active superficial area thanks to nanostructured gold electrodes as an
attached that has captured an antigen
HRP providing multiple
enzyme labels for each Nanog. The detection step involves immersing the sensor
containing mediator, applying voltage, and injecting H2O2.
We carried out an investigation of related issues by using SAMs formed
with thiolated Aib peptides of different lengths. The effect of the orientation of the
ttaching the thiolated moiety to either the
nitrogen or carbon terminus. The stability and conformational properties of such
investigation, in comparison with
s study showed that in
••H-N hydrogen
bonds, and pack tightly, the surface coverage depending on both the peptide
length and orientation. We also found that short peptides may undergo helix
disruption, with formation of structures where the n umber of inter-chain
what recently found
chemical and electrochemical stability of these SAMs as well as
Main outcome of this study is that we now
know which peptides should provide the best transducer substrate supporting the
40
2. Experimental
2.1 Chemicals
Immunosensor. Polydiallyldimethylammonium chloride (PDDA), L-
gluthathione reduced (99%), gold (III) chloride trihydrate (99.9%), 2,2’-azino-
bis(3-ehtylbenzthiazoline-6-sulfonic acid), horseradish peroxidase (HRP, MW
44000), 1-ethyl-3-(3-dimethylaminopropyl) carbodiimide (EDC), N-
hydroxysulfosuccinimide ester (NHSS) and Lyophilized 99% bovine serum
albumin (BSA), and Ru(NH3)6Cl3 (98%) were purchased from Sigma-Aldrich.
The primary antibody (Ab1), the secondary antibody (Biotin-Ab2), and the Nanog
antigen were obtained from Dr. Dharamainder Chaudary UCONN Health Center
(Farmington, CT). Immunoreagents were dissolved in a pH 7.0 phosphate saline
(PBS) buffer (0.01 M in phosphate, 0.14M NaCl, 2.7mM KCl). Carboxyl
functionalized magnetic beads were obtain from Polysciences, Inc. The
poly(dimethoxy)silane (PDMS) kit was from Dow Corning. Hydroquinone (HQ)
and hydrogen peroxidase (H2O2, 30%) were from Fisher. Water was deionized.
SAMs. Ethanol (HPLC grade, ≥99.8%), hydrogen peroxide 30%, and
sodium hydroxide monohydrate (≥99.9995%) were purchased from Fluka.
Sulfuric acid 98% (Aristar Grade) was purchased from BDH. Low conductivity
water was Water pro analysis obtained from Merck.
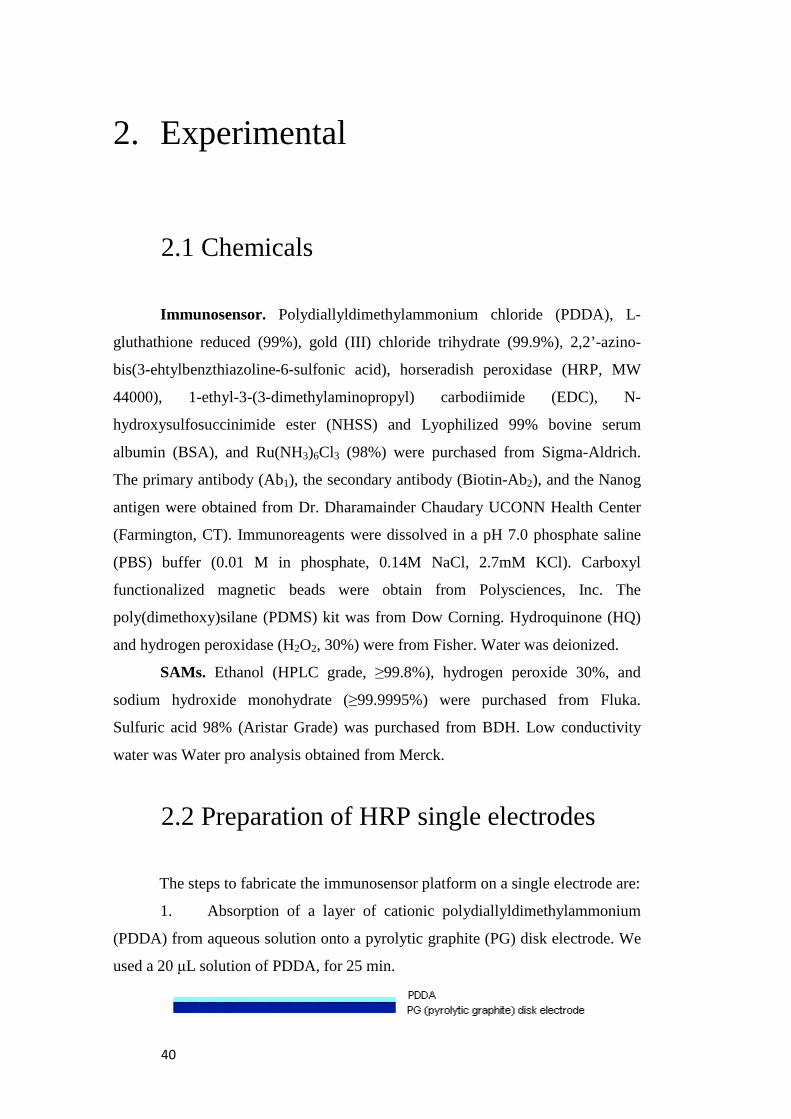
2.2 Preparation of HRP single electrodes
The steps to fabricate the immunosensor platform on a single electrode are:
1. Absorption of a layer of cationic polydiallyldimethylammonium
(PDDA) from aqueous solution onto a pyrolytic graphite (PG) disk electrode. We
used a 20 µL solution of PDDA, for 25 min.
41
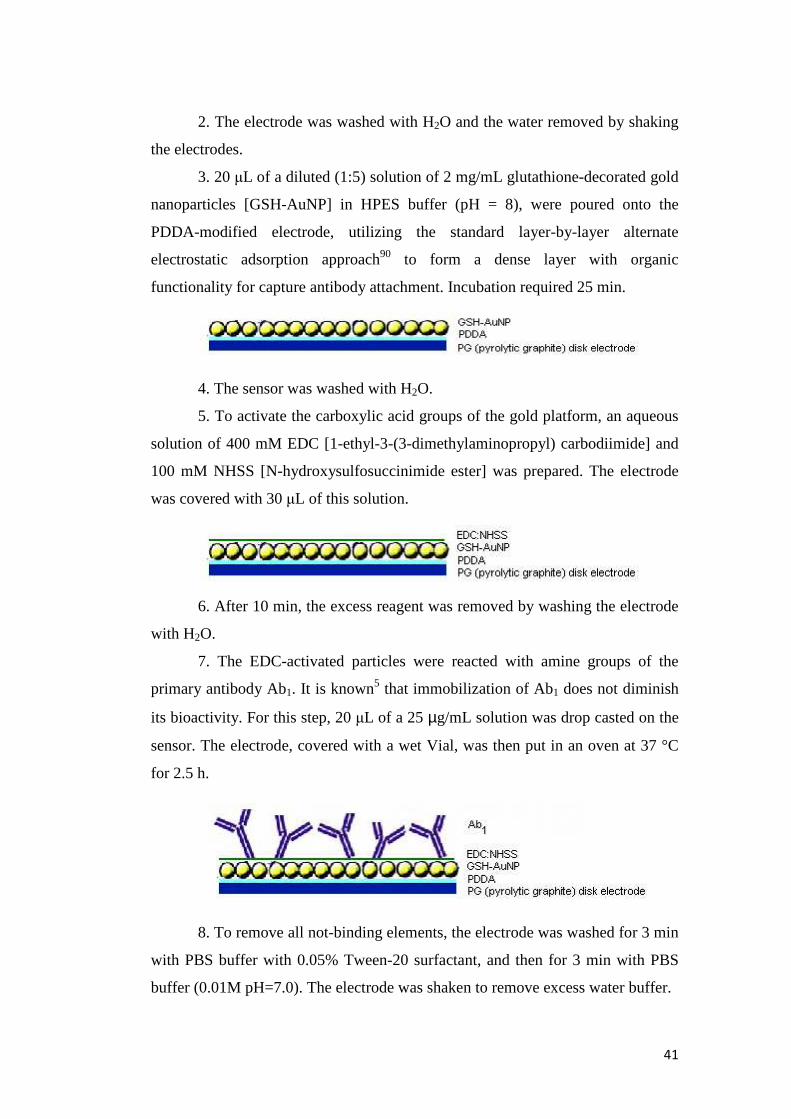
2. The electrode was washed with H2O and the water removed by shaking
the electrodes.
3. 20 µL of a diluted (1:5) solution of 2 mg/mL glutathione-decorated gold
nanoparticles [GSH-AuNP] in HPES buffer (pH = 8), were poured onto the
PDDA-modified electrode, utilizing the standard layer-by-layer alternate
electrostatic adsorption approach90 to form a dense layer with organic
functionality for capture antibody attachment. Incubation required 25 min.
4. The sensor was washed with H2O.
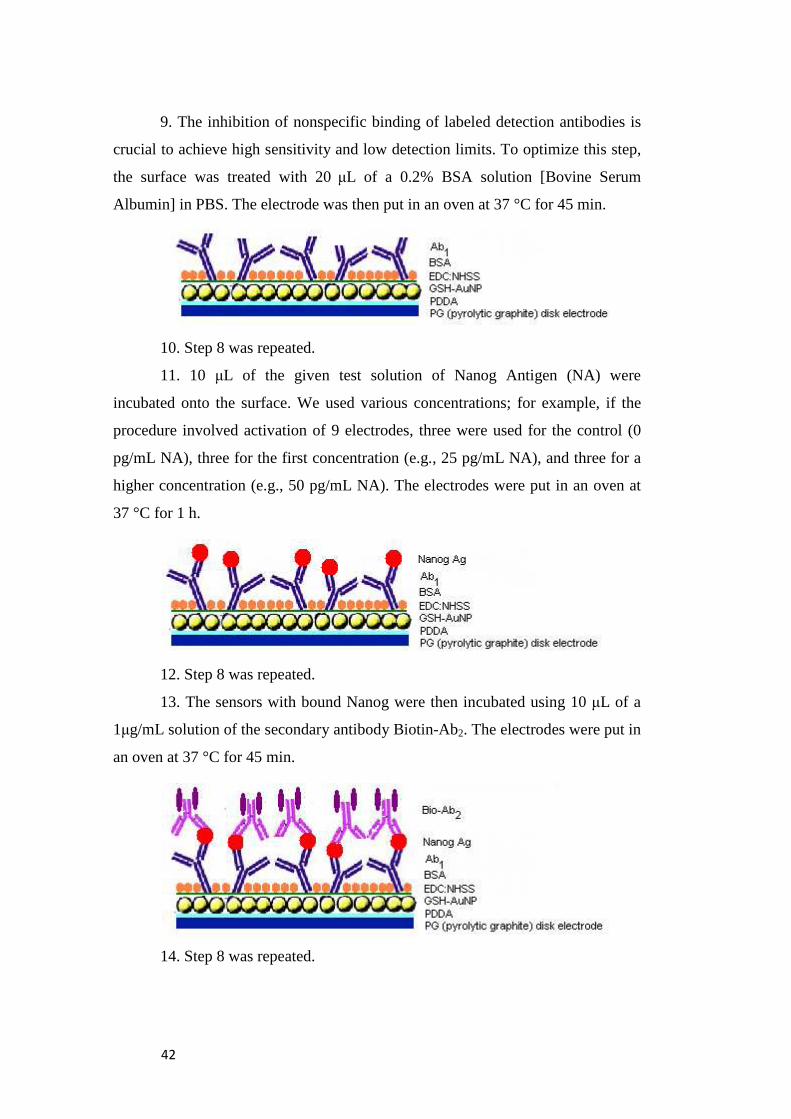
5. To activate the carboxylic acid groups of the gold platform, an aqueous
solution of 400 mM EDC [1-ethyl-3-(3-dimethylaminopropyl) carbodiimide] and
100 mM NHSS [N-hydroxysulfosuccinimide ester] was prepared. The electrode
was covered with 30 µL of this solution.
6. After 10 min, the excess reagent was removed by washing the electrode
with H2O.
7. The EDC-activated particles were reacted with amine groups of the
primary antibody Ab1. It is known5 that immobilization of Ab1 does not diminish
its bioactivity. For this step, 20 µL of a 25 µg/mL solution was drop casted on the
sensor. The electrode, covered with a wet Vial, was then put in an oven at 37 °C
for 2.5 h.
8. To remove all not-binding elements, the electrode was washed for 3 min
with PBS buffer with 0.05% Tween-20 surfactant, and then for 3 min with PBS
buffer (0.01M pH=7.0). The electrode was shaken to remove excess water buffer.
42
9. The inhibition of nonspecific binding of labeled detection antibodies is
crucial to achieve high sensitivity and low detection limits. To optimize this step,
the surface was treated with 20 µL of a 0.2% BSA solution [Bovine Serum
Albumin] in PBS. The electrode was then put in an oven at 37 °C for 45 min.
10. Step 8 was repeated.
11. 10 µL of the given test solution of Nanog Antigen (NA) were
incubated onto the surface. We used various concentrations; for example, if the
procedure involved activation of 9 electrodes, three were used for the control (0
pg/mL NA), three for the first concentration (e.g., 25 pg/mL NA), and three for a
higher concentration (e.g., 50 pg/mL NA). The electrodes were put in an oven at
37 °C for 1 h.
12. Step 8 was repeated.
13. The sensors with bound Nanog were then incubated using 10 µL of a
1µg/mL solution of the secondary antibody Biotin-Ab2. The electrodes were put in
an oven at 37 °C for 45 min.
14. Step 8 was repeated.
43
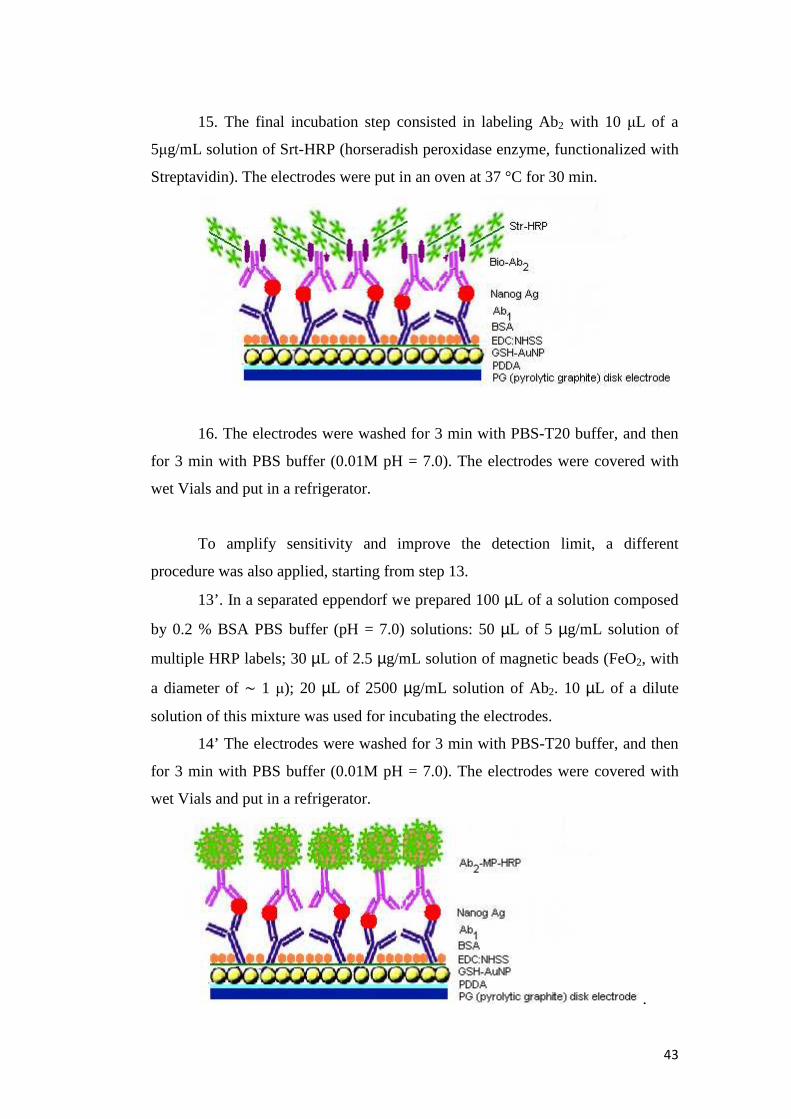
15. The final incubation step consisted in labeling Ab2 with 10 µL of a
5µg/mL solution of Srt-HRP (horseradish peroxidase enzyme, functionalized with
Streptavidin). The electrodes were put in an oven at 37 °C for 30 min.
16. The electrodes were washed for 3 min with PBS-T20 buffer, and then
for 3 min with PBS buffer (0.01M pH = 7.0). The electrodes were covered with
wet Vials and put in a refrigerator.
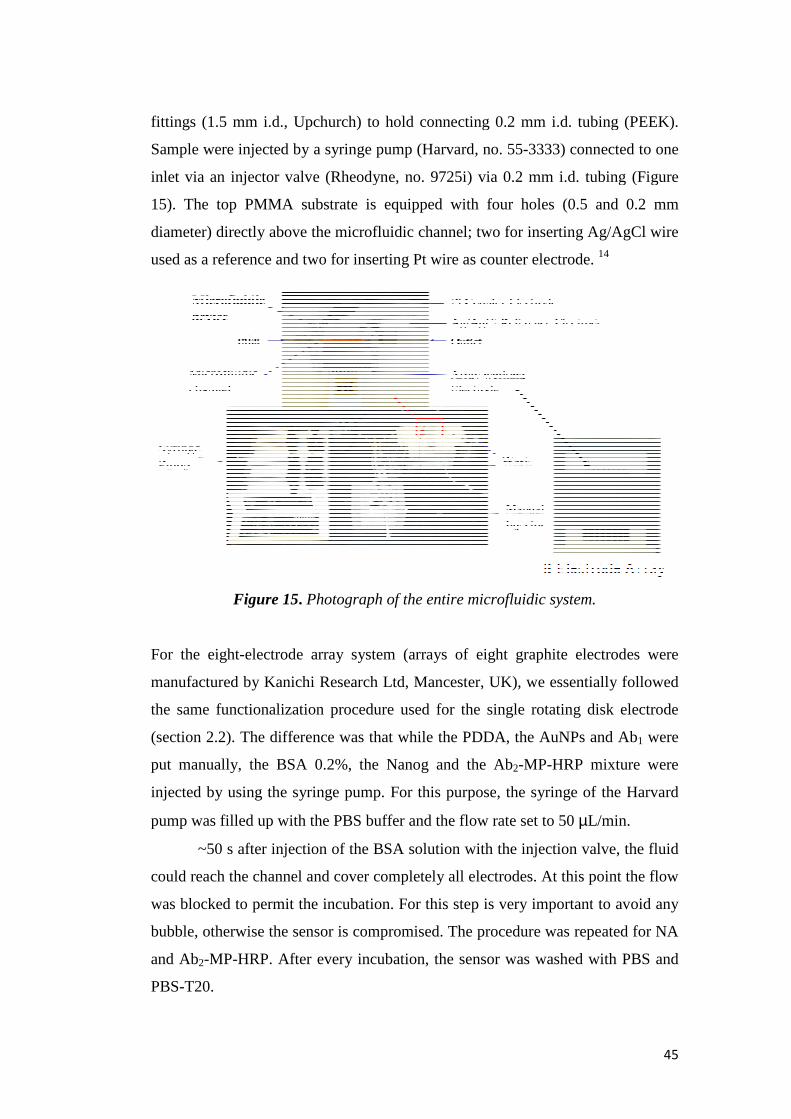
To amplify sensitivity and improve the detection limit, a different
procedure was also applied, starting from step 13.
13’. In a separated eppendorf we prepared 100 µL of a solution composed
by 0.2 % BSA PBS buffer (pH = 7.0) solutions: 50 µL of 5 µg/mL solution of
multiple HRP labels; 30 µL of 2.5 µg/mL solution of magnetic beads (FeO2, with
a diameter of ∼ 1 µ); 20 µL of 2500 µg/mL solution of Ab2. 10 µL of a dilute
solution of this mixture was used for incubating the electrodes.
14’ The electrodes were washed for 3 min with PBS-T20 buffer, and then
for 3 min with PBS buffer (0.01M pH = 7.0). The electrodes were covered with
wet Vials and put in a refrigerator.
.

44
2.3 Fabrication of the Microfluidic D
and Preparation of Eight
To prepare the microfluidic channel
base and curing agent were mixed in 10:1 ratio, stirred vigorously for 5 min, and
then degassed for 30 min under dynamic vacuum to remove all air bubbles. The
clear solution was poured onto a negative mold and heated at 85°C
After cooling, the linear
placed between two flat and machined poly(methylmethacrylate) (PMMA) plates
to provide a microfluidic channel (Figure 14).
a)
b)
Figure 14. a) Photographs of the PMMA device and
photograph of the entire microfluidic device; c) photograph of the molds for the
PDMS channel.
The channel is ~1 mm wide
volume. The top PMMA plate was mac
equipped with female ports (4
Fabrication of the Microfluidic Device
Preparation of Eight-Electrode
To prepare the microfluidic channel, the PDMS kit was used:
base and curing agent were mixed in 10:1 ratio, stirred vigorously for 5 min, and
then degassed for 30 min under dynamic vacuum to remove all air bubbles. The
clear solution was poured onto a negative mold and heated at 85°C for 2.5
, the linear-shape PDMS was pealed off the mold, then
placed between two flat and machined poly(methylmethacrylate) (PMMA) plates
to provide a microfluidic channel (Figure 14).14
c)
a) Photographs of the PMMA device and the PDMS channel; b)
photograph of the entire microfluidic device; c) photograph of the molds for the
The channel is ~1 mm wide, ~2 mm thick, 27 mm long and carries ~54
volume. The top PMMA plate was machined with one inlets and one outle
equipped with female ports (4 mm diameter) for screwing in standard plastic
evice
Array
the PDMS
base and curing agent were mixed in 10:1 ratio, stirred vigorously for 5 min, and
then degassed for 30 min under dynamic vacuum to remove all air bubbles. The
for 2.5 h.14
shape PDMS was pealed off the mold, then
placed between two flat and machined poly(methylmethacrylate) (PMMA) plates
the PDMS channel; b)
photograph of the entire microfluidic device; c) photograph of the molds for the
hick, 27 mm long and carries ~54 µL
hined with one inlets and one outlet and
mm diameter) for screwing in standard plastic
fittings (1.5 mm i.d., Upchurch) to hold connecting 0.2
Sample were injected by a syringe pump (Harvard, no.
inlet via an injector valve (Rheodyne, no.
15). The top PMMA substrate is equipped with four holes (0.5 and 0.2
diameter) directly above the microfluidic channel; two for inserting Ag/AgCl wire
used as a reference and two for inserting Pt wire as counter electrode.
Figure 15
For the eight-electrode array system (
manufactured by Kanichi Research Ltd, Mancester, UK), we essentially followed
the same functionalization procedure used for the single rotati
(section 2.2). The difference was that while the PDDA,
put manually, the BSA 0.2%, the Nanog
injected by using the syringe pump. For this purpose
pump was filled up with the PBS buffer and the flow
~50 s after injection of the BSA solution with the injection valve, the fluid
could reach the channel and cover completely all electrodes.
was blocked to permit th
bubble, otherwise the sensor is compromised.
and Ab2-MP-HRP. After every incubation, the sensor was washed with PBS and
PBS-T20.
mm i.d., Upchurch) to hold connecting 0.2 mm i.d. tubing (PEEK).
Sample were injected by a syringe pump (Harvard, no. 55-3333) connected to one
ector valve (Rheodyne, no. 9725i) via 0.2 mm i.d. tubing (Figure
). The top PMMA substrate is equipped with four holes (0.5 and 0.2
diameter) directly above the microfluidic channel; two for inserting Ag/AgCl wire
used as a reference and two for inserting Pt wire as counter electrode.
Figure 15. Photograph of the entire microfluidic system.
electrode array system (arrays of eight graphite electrodes were
by Kanichi Research Ltd, Mancester, UK), we essentially followed
the same functionalization procedure used for the single rotating disk electrode
). The difference was that while the PDDA, the AuNPs and Ab
the BSA 0.2%, the Nanog and the Ab2-MP-HRP
injected by using the syringe pump. For this purpose, the syringe of the Harvard
pump was filled up with the PBS buffer and the flow rate set to 50
s after injection of the BSA solution with the injection valve, the fluid
could reach the channel and cover completely all electrodes. At this point the flow
was blocked to permit the incubation. For this step is very important
ise the sensor is compromised. The procedure was
HRP. After every incubation, the sensor was washed with PBS and
45
mm i.d. tubing (PEEK).
3333) connected to one
i.d. tubing (Figure
). The top PMMA substrate is equipped with four holes (0.5 and 0.2 mm
diameter) directly above the microfluidic channel; two for inserting Ag/AgCl wire
used as a reference and two for inserting Pt wire as counter electrode. 14
Photograph of the entire microfluidic system.
arrays of eight graphite electrodes were
by Kanichi Research Ltd, Mancester, UK), we essentially followed
ng disk electrode
the AuNPs and Ab1 were
HRP mixture were
the syringe of the Harvard
50 µL/min.
s after injection of the BSA solution with the injection valve, the fluid
At this point the flow
important to avoid any
repeated for NA
HRP. After every incubation, the sensor was washed with PBS and

46
2.4 Gold Preparation and SAM formation
Formation of reproducible and well-packed Aib-based peptide SAMs is
very sensitive to the cleaning – activation procedure. After trying different
procedures, SAM formation was optimized by careful application of the following
protocol leading to very reproducible results. For all experiments we used 11 x 11
mm ArrandeeTM gold plates, which consist of a borosilicate glass substrate
(thickness 0.7 ± 0.1 mm), a thin chromium interlayer (2.5 ± 1.5 nm), and a gold
layer (250 ± 50 nm). We used a new Au plate for each experiment.
The plates were first immersed in ethanol for 5 min, dried in vacuum for
30 min, immersed for 5 min in a freshly prepared but already cold piraña solution
(3:1 v/v solution of concentrated sulfuric acid and hydrogen peroxide. Extreme
caution must be exercised when using piraña solution, as it is a very strong
oxidant and reacts violently with organic matter), and then carefully washed with
a stream of water (deionized and then distilled from potassium permanganate).
After washing, the plates were immersed in water for 5 min, and the procedure
repeated three times. The plates were then dipped into ethanol for 5 min and dried
in a desiccator under vacuum for 30 min. Annealing was carried out using a
butane torch for soldering electronics, in a slightly darkened room. The flame was
set for conical blue (reducing flame) and first allowed to touch obliquely the
borders of the gold surface, and then moved steadily inward in a square fashion:
annealing eventually caused appearance of a dark red glow on the gold surface.
After waiting a few seconds to allow the surface to cool down, the same sequence
step was repeated for an overall 3 min. The plates were left to cool down for 30
min, under a protecting glass cap. The annealing/cooling procedure was repeated
three times. The plates were then immersed in water, ethanol, and finally either
immersed into the peptide-containing ethanol solution or dried under vacuum.
Some experiments were specifically carried out to analyze the condition of
the gold surface. Thus, after annealing and washing, the plates were dried in a
desiccator under argon for 1 h and then either studied by scanning tunneling
microscopy (STM: PicoSPM, Molecular Imaging) or cyclic voltammetry (CV).
STM analysis of the so-prepared plates were carried out at room temperature
47
under ambient conditions using Pt/Ir (80:20, 0.25 mm diameter, Veeco) tips. The
images were recorded in constant current mode and the typical conditions for the
imaging of Au(111) terraces were VT= 200 mV, iT= 100 pA. This technique
revealed that the Au surface displayed a preferred (111) orientation with terraces
as large as ~100 nm that were atomically flat and separated by monoatomic steps
(0.24nm). To further test the outcome of the annealing procedure, we carried out
CV experiments in 0.5 M H2SO4 and potential cycling was performed to include
both the double-layer and the oxide regions of gold. The CV curves largely
showed the pattern expected for the underpotential deposition of oxygen onto a
clean Au electrode, mostly Au(111), in a contaminant-free solution,91 thereby
confirming both the quality and dominant orientation of the annealed surface.
We also calculated the roughness factor of the so-obtained Au plates. The
roughness factor is the ratio between the electrochemical and the geometrical
areas. For these electrochemical experiments, the Au plates were clamped to a
small gold alligator and most of the electrode surface was wrapped with a very
thin Teflon tape. The geometrical areas were calculated by integration, using
pictures of the exposed electrode surface in comparison with area standards. The
determination of the electrochemical area was carried out on the (naked) Au plates
obtained after full reductive desorption of the peptide SAM.89
CV experiments were run at 0.1 – 1 V s-1 in 0.5 M KCl containing
Ru(NH3)6Cl3, whose diffusion coefficient is 6.84 ± 0.06 × 10⁻⁶ cm2 s-1.89 The
electrochemical (= active) area could be calculated from the peak current values,
using the equation valid for a reversible ET.92 The average roughness factor was
found to be 1.16 ± 0.08.
After annealing and washing, the freshly prepared gold plates were
immersed for 48 h in a 0.5 mM ethanol solution of the peptide of choice. To
carefully remove any trace of the incubation solution and loose molecules
adsorbed on the monolayer, the gold plates were washed with a stream of ethanol
and then immersed in ethanol for 5 min; these washing steps were repeated three
times. The plates were finally dried under vacuum for 30 min. The
cleaning/activation/incubation procedure was applied just before carrying out the
IRRAS measurements.
48
2.5 Instrumentation and procedures
2.5.1 Electrochemistry
Rotating-Disk Electrode Approach. A CHI 660 electrochemical
workstation was used for cyclic voltammetry and amperometry at ambient
temperature (22 ± 2°C) in a three-electrode cell. Amperometry was carried out at -
0.3 V against the standard saturated calomel electrode (SCE), using a pyrolytic
graphite (PG) working electrode (rotated at 3000 rpm for optimum sensitivity),
and a platinum wire counter-electrode.
Microfluidic Setup. The experiments were performed using a CHI 1010A
eight-channel potentiostat allowing to simultaneously measuring the current
flowing at the eight electrodes inserted in the microfluidic channel. Amperometry
was carried out at -0.2 V vs the Ag/AgCl reference electrode, and using a
platinum wire as the counter-electrode. For cyclic voltammetry experiments, the
flow rate was set a zero, while for the amperometric detection the flow rate was
100 µL/min using 100 µL injector sample loop. Buffer and hydrogen peroxide
solutions were deoxygenized with nitrogen.
2.5.2 IRRAS
FT-IR reflection absorption spectroscopy measurements were carried out
using a Nicolet Nexus Fourier Transform Infrared Spectrometer equipped with a
liquid nitrogen cooled mercury-cadmium-tellurium (MCT) detector. The
measurements were carried out with the grazing angle set at 80°, with a resolution
of 2 cm-1, and each spectrum was the result of an average of 1000 scans. The
optical path was purged with nitrogen before and during the measurements. To
keep the measuring chamber constantly under an inert atmosphere, we set up a
little dry-box containing the entire optical path. The sample and the blank (an
otherwise identical Arrandee gold plate, but with no SAM) were inserted in the
dry-box. Before measurements, the system was purged for 1 h with nitrogen dried
by flowing through a column filled with CaCl2 and silica gel.
49
3. Results and Discussion
3.1 Electrochemical Immunosensors
Electrochemical detection combined with nanoparticle amplification offers
potentially low-cost, high-through put solutions for detection of clinically
significant proteins that have yet to be fully realized. Amperometric sensors, field
effect transistors, and impedance methods are among the approaches being
explored. The sensitivity of an electrochemical sensors can be improved by using
nanostructured electrodes, such as those based on carbon nanotubes or gold
nanoparticles. In the electrochemical detection of proteins on these specific
electrode surfaces by immunoassay protocols, appropriate functional groups on
the nanoparticle facilitate high concentrations of chemically linked capture
antibodies. In this approach, antibodies on the electrode capture analyte proteins
from the sample, the surface is then be treated with an enzyme-labeled secondary
antibody, and the enzyme label is detected electrochemically.
3.1.1 Characterization of AuNP platform
Glutathione-protected gold nanoparticles (GHS-AuNP) were prepared by a
reported method9 and characterized by Transmission Electron Microscopy (TEM),
UV-Vis and Infrared Spectroscopy.
The glutathione protected gold nanoparticle dispersion was analyzed for
core dimensions and size distribution by TEM. Figure 16a shows that all particles
are spherical and are well separated from each other. The size histogram obtained
from analysis of the TEM images revealed that the average diameter of GHS-
AuNP was 5.1 ± 1.4 nm, a relatively narrow size distribution.
Particle size was confirmed by visible absorption spectroscopy band for
the GHS-AuNP dispersion at 508 nm indicating diameter ~ 5 nm (Figure 16c).
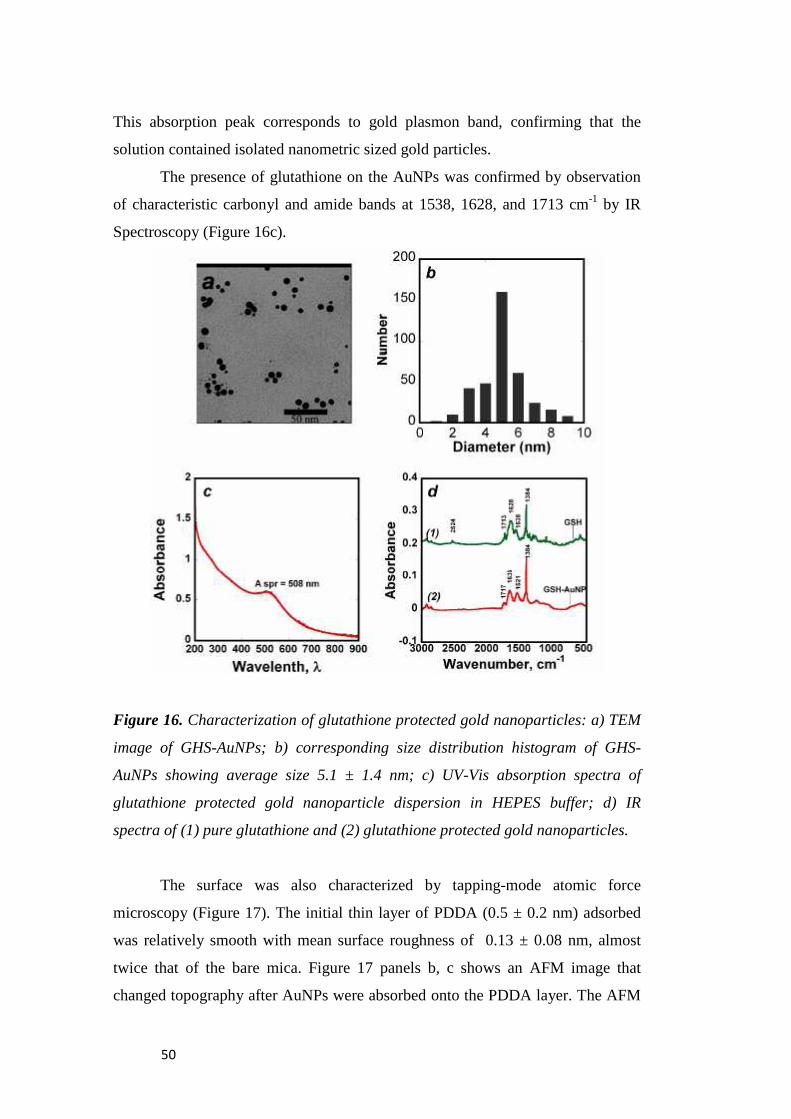
50
This absorption peak corresponds to gold plasmon band, confirming that the
solution contained isolated nanometric sized gold particles.
The presence of glutathione on the AuNPs was confirmed by observation
of characteristic carbonyl and amide bands at 1538, 1628, and 1713 cm-1 by IR
Spectroscopy (Figure 16c).
Figure 16. Characterization of glutathione protected gold nanoparticles: a) TEM
image of GHS-AuNPs; b) corresponding size distribution histogram of GHS-
AuNPs showing average size 5.1 ± 1.4 nm; c) UV-Vis absorption spectra of
glutathione protected gold nanoparticle dispersion in HEPES buffer; d) IR
spectra of (1) pure glutathione and (2) glutathione protected gold nanoparticles.
The surface was also characterized by tapping-mode atomic force
microscopy (Figure 17). The initial thin layer of PDDA (0.5 ± 0.2 nm) adsorbed
was relatively smooth with mean surface roughness of 0.13 ± 0.08 nm, almost
twice that of the bare mica. Figure 17 panels b, c shows an AFM image that
changed topography after AuNPs were absorbed onto the PDDA layer. The AFM
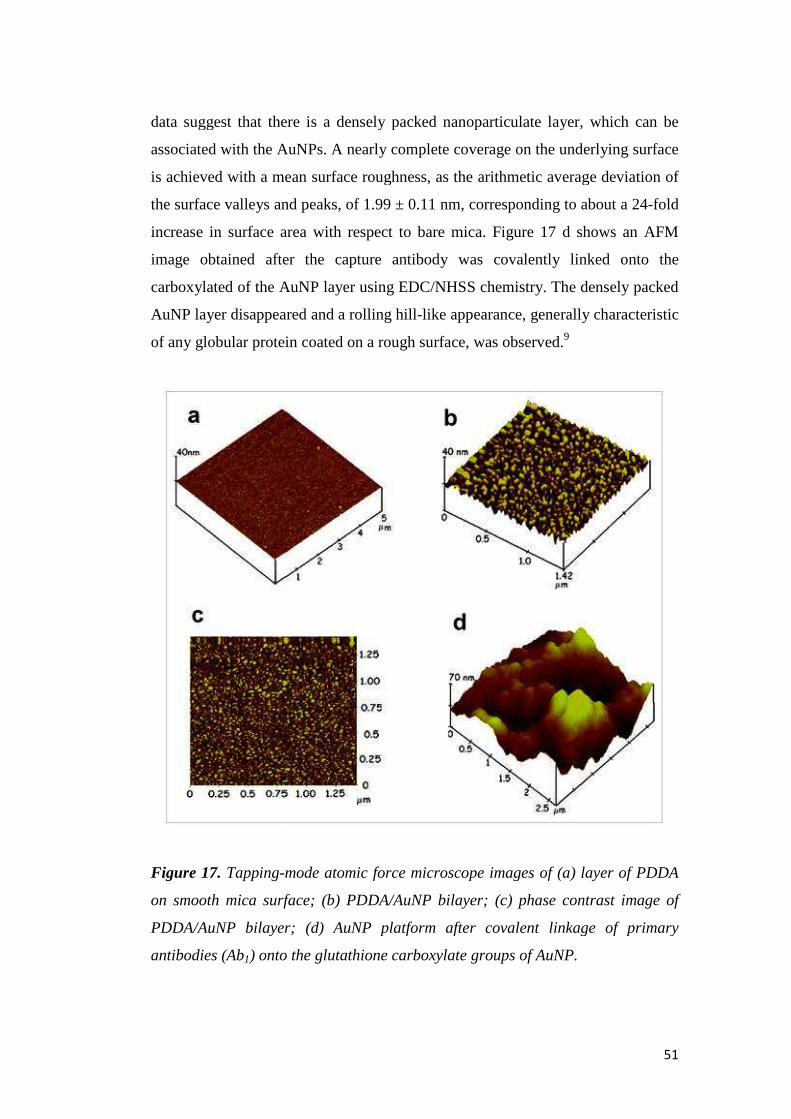
data suggest that there is a densely packed nanoparticulate layer, whi
associated with the A
is achieved with a mean surface roughness
the surface valleys and peaks,
increase in surface area with respect to
image obtained after the capture antibody was covalently linked onto the
carboxylated of the AuNP layer using EDC/NHSS chemistry. The densely packed
AuNP layer disappeared and a ro
of any globular protein coated on a
Figure 17. Tapping-mode atomic force microscope images of (a) layer of PDDA
on smooth mica surface; (b) PDDA/AuNP bilayer; (c) phase
PDDA/AuNP bilayer; (d) AuNP platform after covalent linkage of primary
antibodies (Ab1) onto the glutathione carboxylate groups of AuNP.
data suggest that there is a densely packed nanoparticulate layer, whi
d with the AuNPs. A nearly complete coverage on the underlying surface
mean surface roughness, as the arithmetic average deviation of
the surface valleys and peaks, of 1.99 ± 0.11 nm, corresponding to
ncrease in surface area with respect to bare mica. Figure 17 d shows an AFM
after the capture antibody was covalently linked onto the
carboxylated of the AuNP layer using EDC/NHSS chemistry. The densely packed
AuNP layer disappeared and a rolling hill-like appearance, generally characteristic
of any globular protein coated on a rough surface, was observed.9
mode atomic force microscope images of (a) layer of PDDA
on smooth mica surface; (b) PDDA/AuNP bilayer; (c) phase contrast image of
PDDA/AuNP bilayer; (d) AuNP platform after covalent linkage of primary
) onto the glutathione carboxylate groups of AuNP.
51
data suggest that there is a densely packed nanoparticulate layer, which can be
nearly complete coverage on the underlying surface
the arithmetic average deviation of
corresponding to about a 24-fold
Figure 17 d shows an AFM
after the capture antibody was covalently linked onto the
carboxylated of the AuNP layer using EDC/NHSS chemistry. The densely packed
generally characteristic
mode atomic force microscope images of (a) layer of PDDA
contrast image of
PDDA/AuNP bilayer; (d) AuNP platform after covalent linkage of primary
) onto the glutathione carboxylate groups of AuNP.
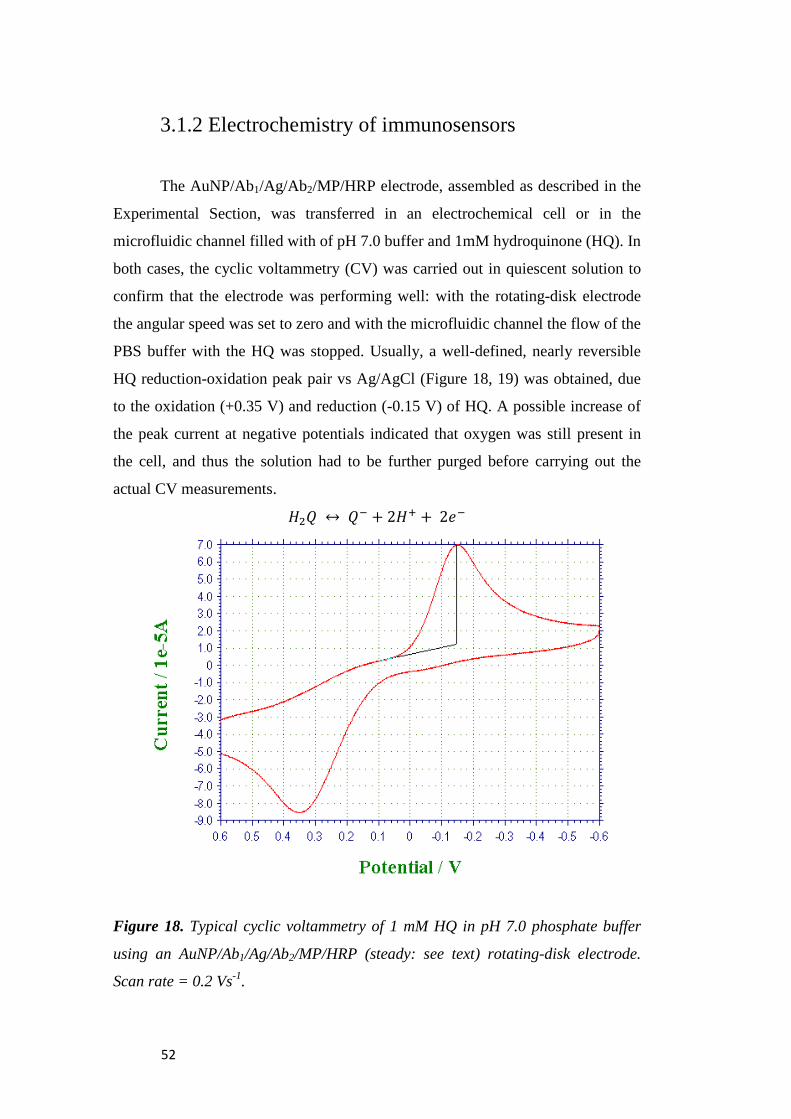
52
3.1.2 Electrochemistry of immunosensors
The AuNP/Ab1/Ag/Ab2/MP/HRP electrode, assembled as described in the
Experimental Section, was transferred in an electrochemical cell or in the
microfluidic channel filled with of pH 7.0 buffer and 1mM hydroquinone (HQ). In
both cases, the cyclic voltammetry (CV) was carried out in quiescent solution to
confirm that the electrode was performing well: with the rotating-disk electrode
the angular speed was set to zero and with the microfluidic channel the flow of the
PBS buffer with the HQ was stopped. Usually, a well-defined, nearly reversible
HQ reduction-oxidation peak pair vs Ag/AgCl (Figure 18, 19) was obtained, due
to the oxidation (+0.35 V) and reduction (-0.15 V) of HQ. A possible increase of
the peak current at negative potentials indicated that oxygen was still present in
the cell, and thus the solution had to be further purged before carrying out the
actual CV measurements. ��� � �� � 2� � 2��
Figure 18. Typical cyclic voltammetry of 1 mM HQ in pH 7.0 phosphate buffer
using an AuNP/Ab1/Ag/Ab2/MP/HRP (steady: see text) rotating-disk electrode.
Scan rate = 0.2 Vs-1.
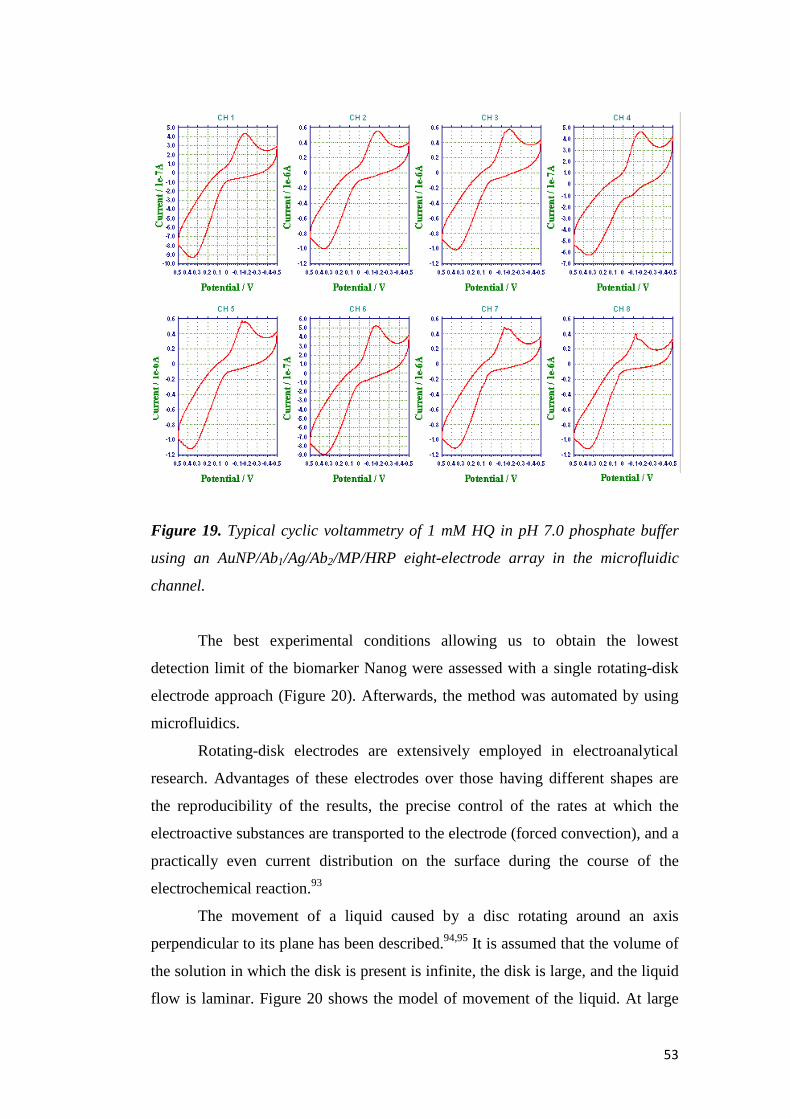
53
Figure 19. Typical cyclic voltammetry of 1 mM HQ in pH 7.0 phosphate buffer
using an AuNP/Ab1/Ag/Ab2/MP/HRP eight-electrode array in the microfluidic
channel.
The best experimental conditions allowing us to obtain the lowest
detection limit of the biomarker Nanog were assessed with a single rotating-disk
electrode approach (Figure 20). Afterwards, the method was automated by using
microfluidics.
Rotating-disk electrodes are extensively employed in electroanalytical
research. Advantages of these electrodes over those having different shapes are
the reproducibility of the results, the precise control of the rates at which the
electroactive substances are transported to the electrode (forced convection), and a
practically even current distribution on the surface during the course of the
electrochemical reaction.93
The movement of a liquid caused by a disc rotating around an axis
perpendicular to its plane has been described.94,95 It is assumed that the volume of
the solution in which the disk is present is infinite, the disk is large, and the liquid
flow is laminar. Figure 20 shows the model of movement of the liquid. At large

54
distances from the disk, the liquid moves perpendicula
disk, in the thin layer adhering to the surface of the electrode, the liquid also g
a centrifugal velocity. At very short distances, a layer of quiescent solution is
present, whose thickness does not change in time. In this
effects the electroactive species only by diffusion.
Figure 20. Flow profile that is developed when a circular object is rotated in
solution and how this brings fresh reactant to the surface
Providing the rotation speed is
maintained, the mass transport equation is given by:
where the x dimension is the distance normal to the electrode surface. The mass
transport equation is determined by both diffusion (first term of the right
side member) and forced convection (second term), and both these terms effect
the concentration of the rea
sufficiently negative (positive) to make the red
controlled solely by mass transport, a limiting current (constant in time) arises.
The full and correct equation
rotating disk electrode, was
distances from the disk, the liquid moves perpendicularly to the surface. Near the
disk, in the thin layer adhering to the surface of the electrode, the liquid also g
At very short distances, a layer of quiescent solution is
present, whose thickness does not change in time. In this layer, mass transport
effects the electroactive species only by diffusion.93
Flow profile that is developed when a circular object is rotated in
solution and how this brings fresh reactant to the surface.
Providing the rotation speed is kept within the limits that laminar flow is
transport equation is given by:
dimension is the distance normal to the electrode surface. The mass
transport equation is determined by both diffusion (first term of the right
side member) and forced convection (second term), and both these terms effect
the concentration of the reagent close to the electrode surface. At a potential
sufficiently negative (positive) to make the reduction (oxidation) process
controlled solely by mass transport, a limiting current (constant in time) arises.
The full and correct equation, describing the limiting current in the case of
was obtained by Levich96,97:
rly to the surface. Near the
disk, in the thin layer adhering to the surface of the electrode, the liquid also gains
At very short distances, a layer of quiescent solution is
layer, mass transport
Flow profile that is developed when a circular object is rotated in
kept within the limits that laminar flow is
dimension is the distance normal to the electrode surface. The mass
transport equation is determined by both diffusion (first term of the right-hand
side member) and forced convection (second term), and both these terms effect
gent close to the electrode surface. At a potential
uction (oxidation) process
controlled solely by mass transport, a limiting current (constant in time) arises.
ent in the case of

55
where i l is the limiting current, n is the number of electron transferred, F is the
Faraday constant, A is the electrode area, D is the diffusion coefficient, ω is the
angular velocity of the rotating disk electrode, c0 is the bulk concentration, and ν
is the kinematic viscosity of the solution.
3.1.3 Analysis of the Immunosensors’ Performance
In our sensor assembly, the working electrode was placed into an
electrochemical cell containing 10 mL of a 1 mM HQ PBS buffer solution, which
was purged with purified Nitrogen for at least 1 h before the measurements. We
used a normal electrochemical cell with 5 holes: one for the working rotating-disk
electrode, one for the reference electrode (SCE), one for the counter-electrode
(Pt), one for the inert gas, and one for the injection of hydrogen peroxide.
Figure 21. In the upper image, there are the electrodes during the incubation of
Ab1. On the right, the rotating disk electrode system is represented entirely, and in
the last image there is a zoom of the electrochemical 5 holes cell that we used for
the measurements.
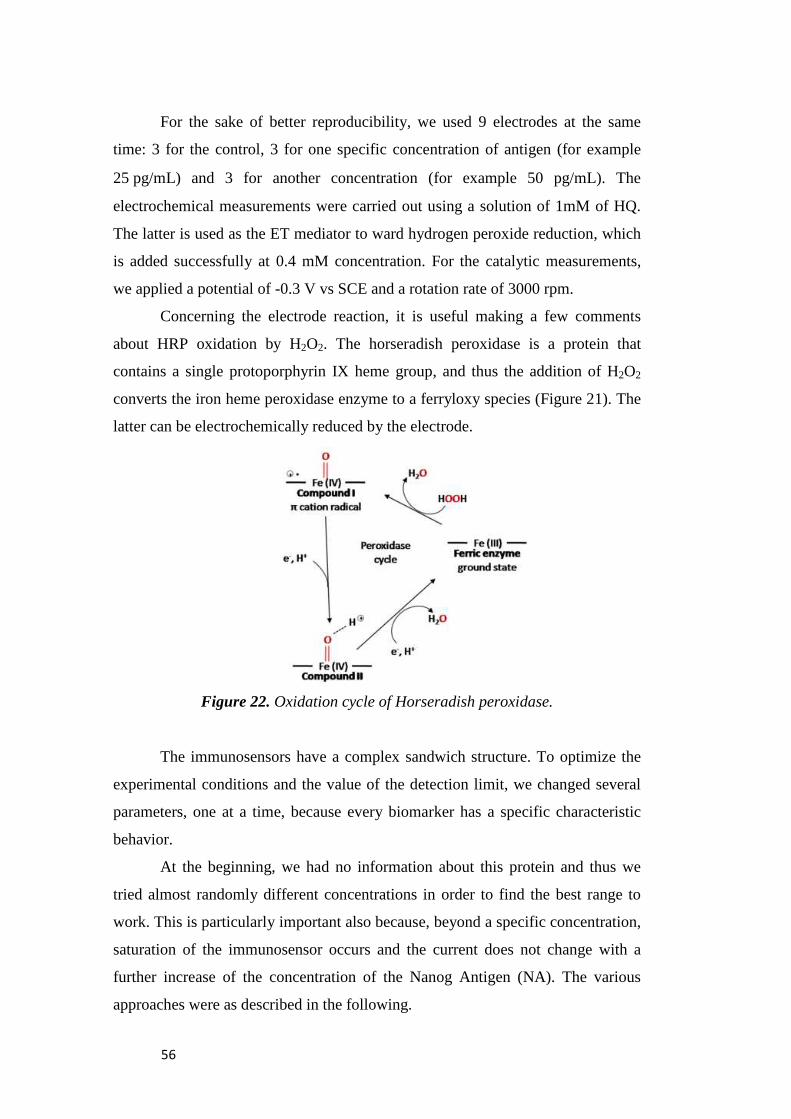
56
For the sake of better reproducibility, we used 9 electrodes at the same
time: 3 for the control, 3 for one specific concentration of antigen (for example
25 pg/mL) and 3 for another concentration (for example 50 pg/mL). The
electrochemical measurements were carried out using a solution of 1mM of HQ.
The latter is used as the ET mediator to ward hydrogen peroxide reduction, which
is added successfully at 0.4 mM concentration. For the catalytic measurements,
we applied a potential of -0.3 V vs SCE and a rotation rate of 3000 rpm.
Concerning the electrode reaction, it is useful making a few comments
about HRP oxidation by H2O2. The horseradish peroxidase is a protein that
contains a single protoporphyrin IX heme group, and thus the addition of H2O2
converts the iron heme peroxidase enzyme to a ferryloxy species (Figure 21). The
latter can be electrochemically reduced by the electrode.
Figure 22. Oxidation cycle of Horseradish peroxidase.
The immunosensors have a complex sandwich structure. To optimize the
experimental conditions and the value of the detection limit, we changed several
parameters, one at a time, because every biomarker has a specific characteristic
behavior.
At the beginning, we had no information about this protein and thus we
tried almost randomly different concentrations in order to find the best range to
work. This is particularly important also because, beyond a specific concentration,
saturation of the immunosensor occurs and the current does not change with a
further increase of the concentration of the Nanog Antigen (NA). The various
approaches were as described in the following.
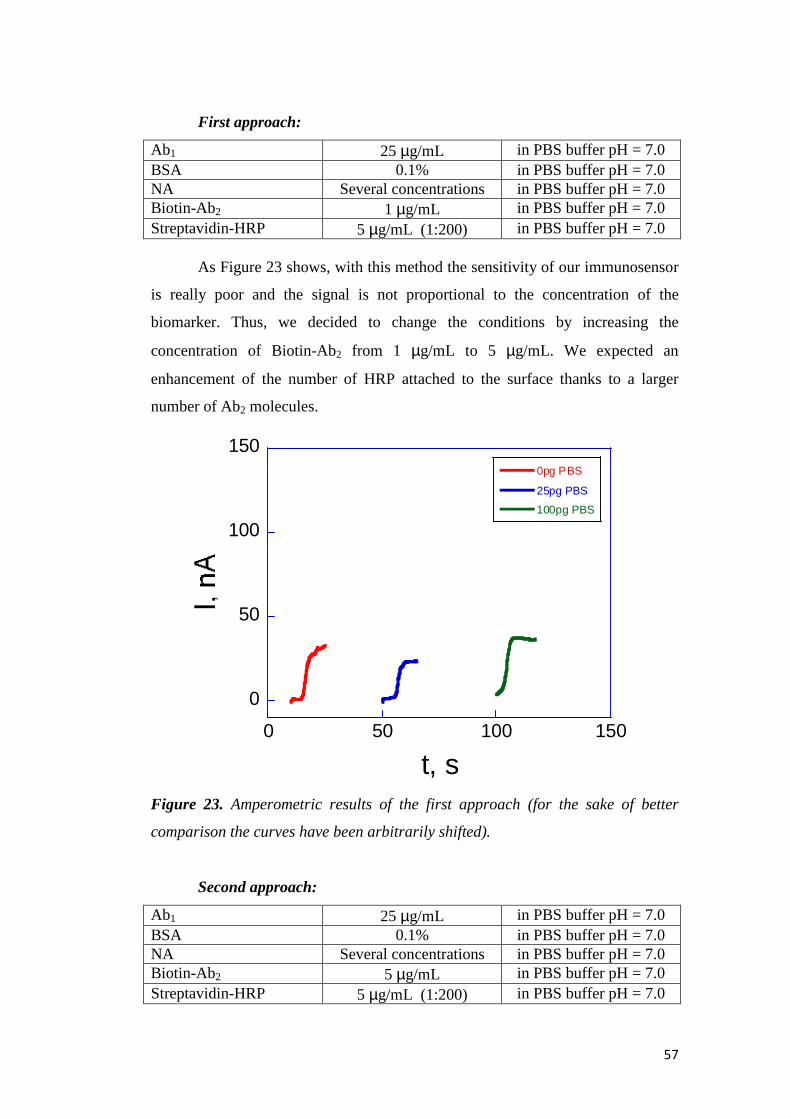
57
First approach:
Ab1 25 µg/mL in PBS buffer pH = 7.0 BSA 0.1% in PBS buffer pH = 7.0 NA Several concentrations in PBS buffer pH = 7.0 Biotin-Ab2 1 µg/mL in PBS buffer pH = 7.0 Streptavidin-HRP 5 µg/mL (1:200) in PBS buffer pH = 7.0
As Figure 23 shows, with this method the sensitivity of our immunosensor
is really poor and the signal is not proportional to the concentration of the
biomarker. Thus, we decided to change the conditions by increasing the
concentration of Biotin-Ab2 from 1 µg/mL to 5 µg/mL. We expected an
enhancement of the number of HRP attached to the surface thanks to a larger
number of Ab2 molecules.
Figure 23. Amperometric results of the first approach (for the sake of better
comparison the curves have been arbitrarily shifted).
Second approach:
Ab1 25 µg/mL in PBS buffer pH = 7.0 BSA 0.1% in PBS buffer pH = 7.0 NA Several concentrations in PBS buffer pH = 7.0 Biotin-Ab2 5 µg/mL in PBS buffer pH = 7.0 Streptavidin-HRP 5 µg/mL (1:200) in PBS buffer pH = 7.0
0
50
100
150
0 50 100 150
0pg PBS
25pg PBS
100pg PBS
t, s
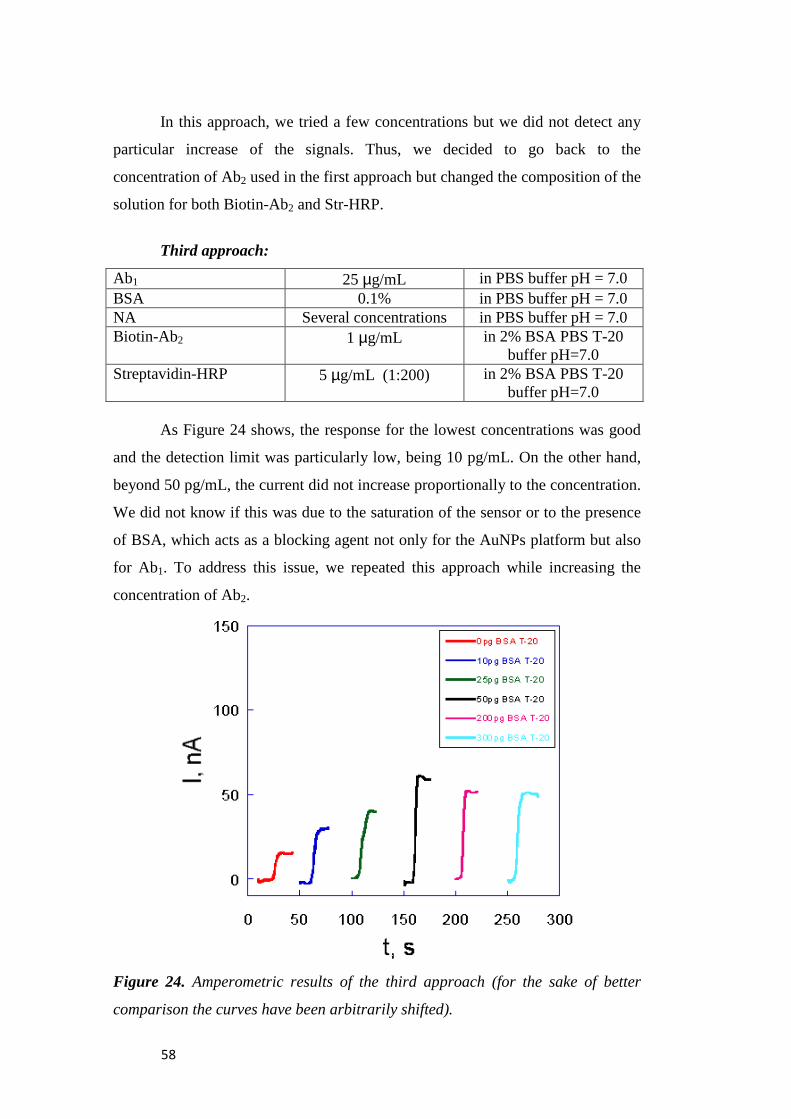
58
In this approach, we tried a few concentrations but we did not detect any
particular increase of the signals. Thus, we decided to go back to the
concentration of Ab2 used in the first approach but changed the composition of the
solution for both Biotin-Ab2 and Str-HRP.
Third approach:
Ab1 25 µg/mL in PBS buffer pH = 7.0 BSA 0.1% in PBS buffer pH = 7.0 NA Several concentrations in PBS buffer pH = 7.0 Biotin-Ab2 1 µg/mL in 2% BSA PBS T-20
buffer pH=7.0 Streptavidin-HRP 5 µg/mL (1:200) in 2% BSA PBS T-20
buffer pH=7.0
As Figure 24 shows, the response for the lowest concentrations was good
and the detection limit was particularly low, being 10 pg/mL. On the other hand,
beyond 50 pg/mL, the current did not increase proportionally to the concentration.
We did not know if this was due to the saturation of the sensor or to the presence
of BSA, which acts as a blocking agent not only for the AuNPs platform but also
for Ab1. To address this issue, we repeated this approach while increasing the
concentration of Ab2.
Figure 24. Amperometric results of the third approach (for the sake of better
comparison the curves have been arbitrarily shifted).
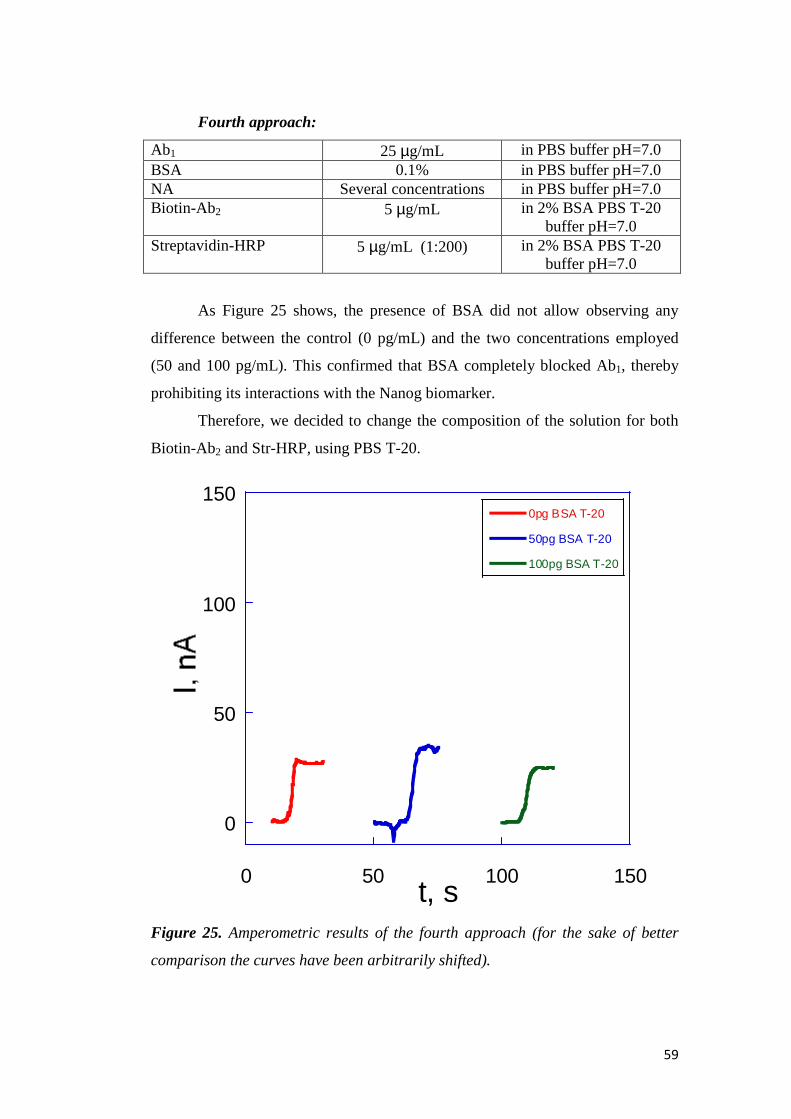
59
Fourth approach:
Ab1 25 µg/mL in PBS buffer pH=7.0 BSA 0.1% in PBS buffer pH=7.0 NA Several concentrations in PBS buffer pH=7.0 Biotin-Ab2 5 µg/mL in 2% BSA PBS T-20
buffer pH=7.0 Streptavidin-HRP 5 µg/mL (1:200) in 2% BSA PBS T-20
buffer pH=7.0
As Figure 25 shows, the presence of BSA did not allow observing any
difference between the control (0 pg/mL) and the two concentrations employed
(50 and 100 pg/mL). This confirmed that BSA completely blocked Ab1, thereby
prohibiting its interactions with the Nanog biomarker.
Therefore, we decided to change the composition of the solution for both
Biotin-Ab2 and Str-HRP, using PBS T-20.
Figure 25. Amperometric results of the fourth approach (for the sake of better
comparison the curves have been arbitrarily shifted).
0
50
100
150
0 50 100 150
0pg BSA T-20
50pg BSA T-20
100pg BSA T-20
t, s
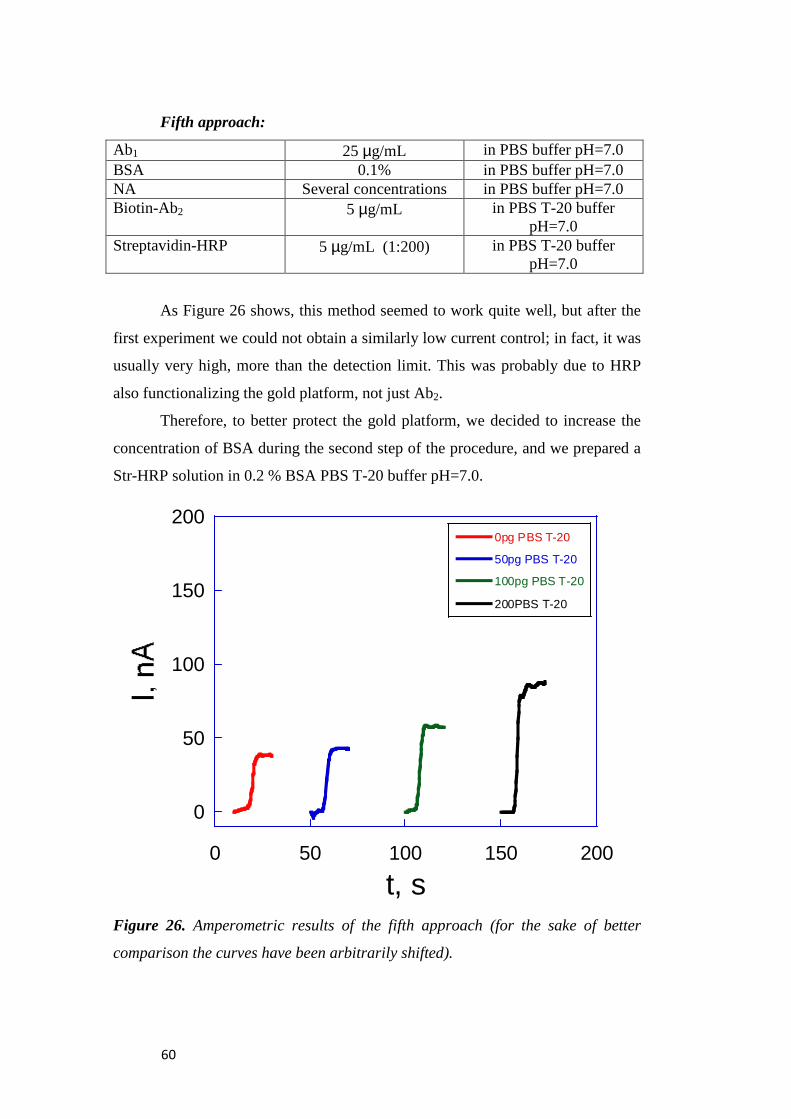
60
Fifth approach:
Ab1 25 µg/mL in PBS buffer pH=7.0 BSA 0.1% in PBS buffer pH=7.0 NA Several concentrations in PBS buffer pH=7.0 Biotin-Ab2 5 µg/mL in PBS T-20 buffer
pH=7.0 Streptavidin-HRP 5 µg/mL (1:200) in PBS T-20 buffer
pH=7.0
As Figure 26 shows, this method seemed to work quite well, but after the
first experiment we could not obtain a similarly low current control; in fact, it was
usually very high, more than the detection limit. This was probably due to HRP
also functionalizing the gold platform, not just Ab2.
Therefore, to better protect the gold platform, we decided to increase the
concentration of BSA during the second step of the procedure, and we prepared a
Str-HRP solution in 0.2 % BSA PBS T-20 buffer pH=7.0.
Figure 26. Amperometric results of the fifth approach (for the sake of better
comparison the curves have been arbitrarily shifted).
0
50
100
150
200
0 50 100 150 200
0pg PBS T-20
50pg PBS T-20
100pg PBS T-20
200PBS T-20
t, s
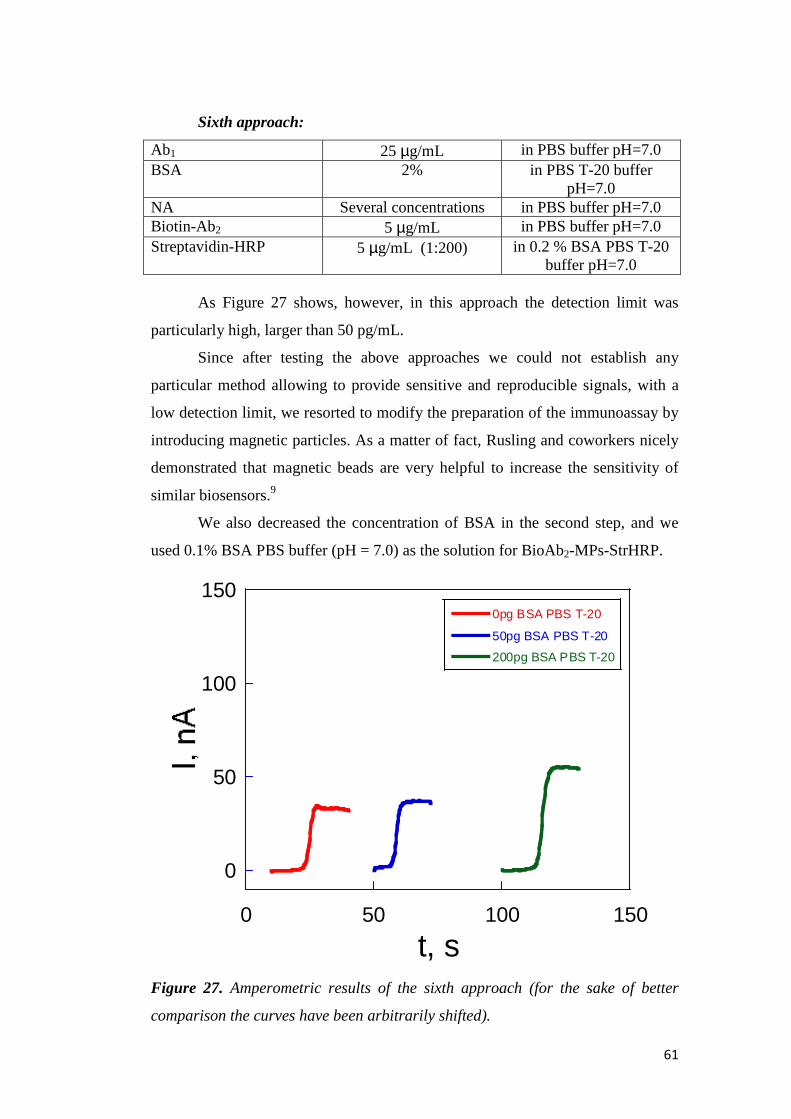
61
Sixth approach:
Ab1 25 µg/mL in PBS buffer pH=7.0 BSA 2% in PBS T-20 buffer
pH=7.0 NA Several concentrations in PBS buffer pH=7.0 Biotin-Ab2 5 µg/mL in PBS buffer pH=7.0 Streptavidin-HRP 5 µg/mL (1:200) in 0.2 % BSA PBS T-20
buffer pH=7.0
As Figure 27 shows, however, in this approach the detection limit was
particularly high, larger than 50 pg/mL.
Since after testing the above approaches we could not establish any
particular method allowing to provide sensitive and reproducible signals, with a
low detection limit, we resorted to modify the preparation of the immunoassay by
introducing magnetic particles. As a matter of fact, Rusling and coworkers nicely
demonstrated that magnetic beads are very helpful to increase the sensitivity of
similar biosensors.9
We also decreased the concentration of BSA in the second step, and we
used 0.1% BSA PBS buffer (pH = 7.0) as the solution for BioAb2-MPs-StrHRP.
Figure 27. Amperometric results of the sixth approach (for the sake of better
comparison the curves have been arbitrarily shifted).
0
50
100
150
0 50 100 150
0pg BSA PBS T-20
50pg BSA PBS T-20
200pg BSA PBS T-20
t, s
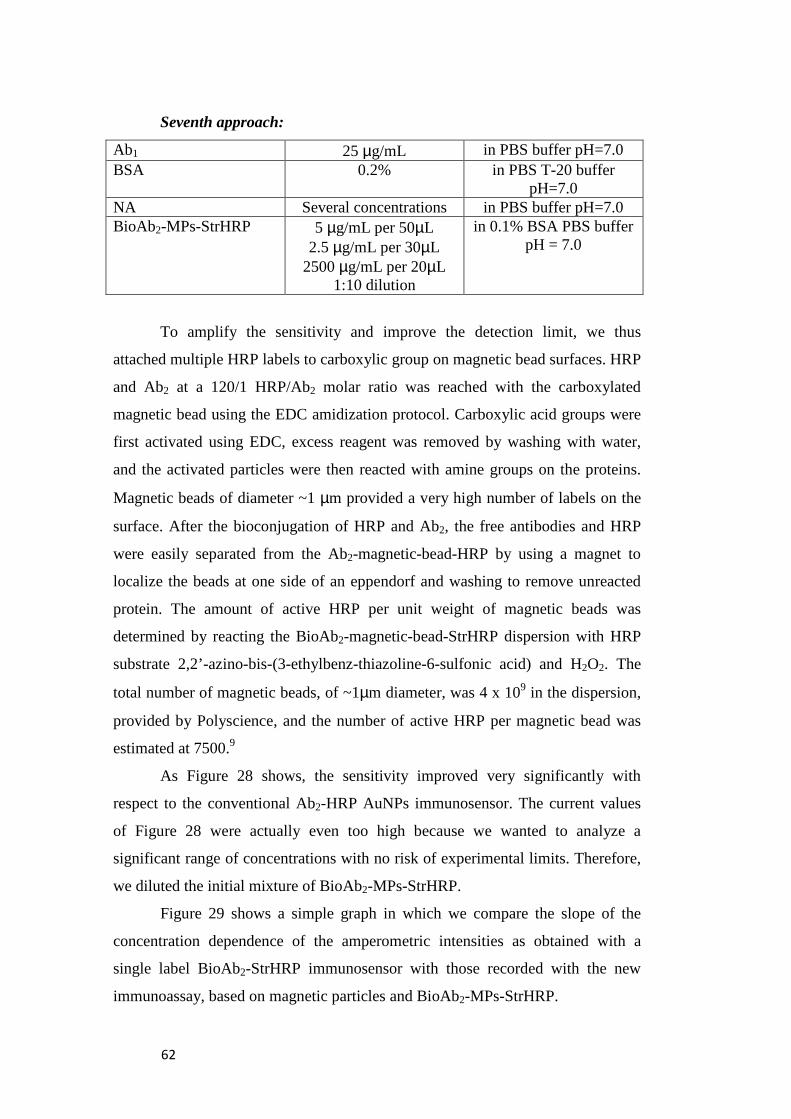
62
Seventh approach:
Ab1 25 µg/mL in PBS buffer pH=7.0 BSA 0.2% in PBS T-20 buffer
pH=7.0 NA Several concentrations in PBS buffer pH=7.0 BioAb2-MPs-StrHRP 5 µg/mL per 50µL
2.5 µg/mL per 30µL 2500 µg/mL per 20µL
1:10 dilution
in 0.1% BSA PBS buffer pH = 7.0
To amplify the sensitivity and improve the detection limit, we thus
attached multiple HRP labels to carboxylic group on magnetic bead surfaces. HRP
and Ab2 at a 120/1 HRP/Ab2 molar ratio was reached with the carboxylated
magnetic bead using the EDC amidization protocol. Carboxylic acid groups were
first activated using EDC, excess reagent was removed by washing with water,
and the activated particles were then reacted with amine groups on the proteins.
Magnetic beads of diameter ~1 µm provided a very high number of labels on the
surface. After the bioconjugation of HRP and Ab2, the free antibodies and HRP
were easily separated from the Ab2-magnetic-bead-HRP by using a magnet to
localize the beads at one side of an eppendorf and washing to remove unreacted
protein. The amount of active HRP per unit weight of magnetic beads was
determined by reacting the BioAb2-magnetic-bead-StrHRP dispersion with HRP
substrate 2,2’-azino-bis-(3-ethylbenz-thiazoline-6-sulfonic acid) and H2O2. The
total number of magnetic beads, of ~1µm diameter, was 4 x 10⁹ in the dispersion,
provided by Polyscience, and the number of active HRP per magnetic bead was
estimated at 7500.9
As Figure 28 shows, the sensitivity improved very significantly with
respect to the conventional Ab2-HRP AuNPs immunosensor. The current values
of Figure 28 were actually even too high because we wanted to analyze a
significant range of concentrations with no risk of experimental limits. Therefore,
we diluted the initial mixture of BioAb2-MPs-StrHRP.
Figure 29 shows a simple graph in which we compare the slope of the
concentration dependence of the amperometric intensities as obtained with a
single label BioAb2-StrHRP immunosensor with those recorded with the new
immunoassay, based on magnetic particles and BioAb2-MPs-StrHRP.
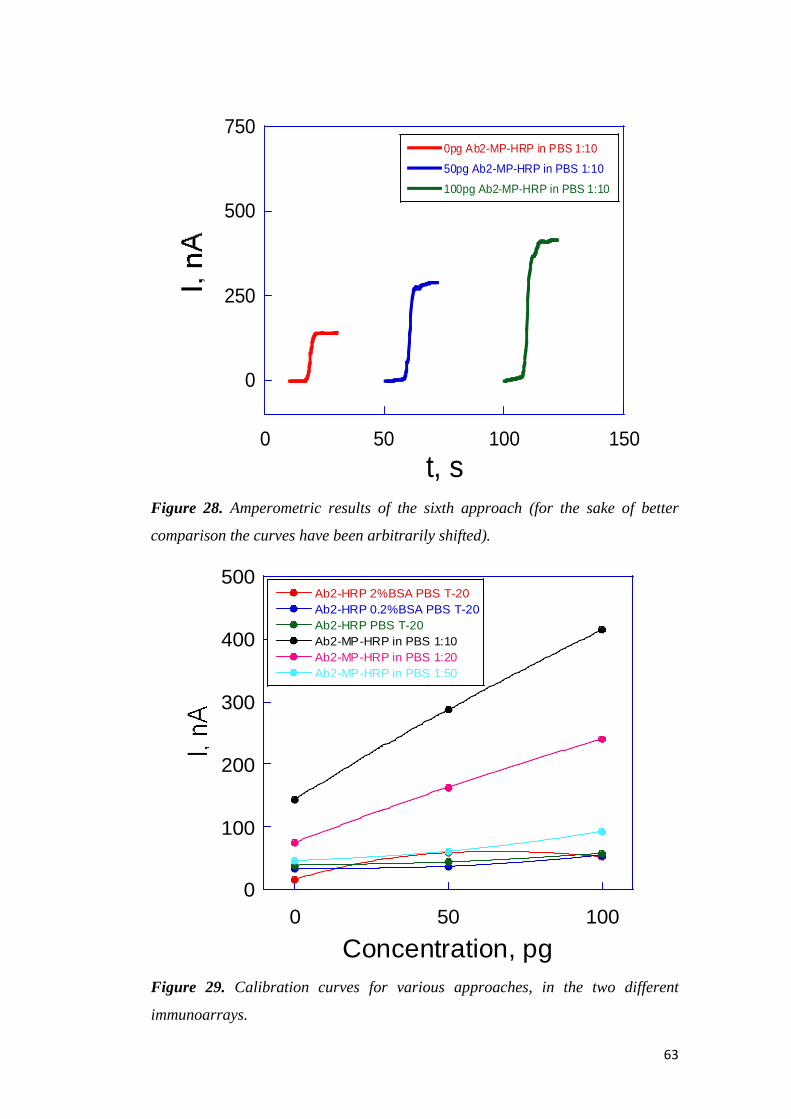
63
Figure 28. Amperometric results of the sixth approach (for the sake of better
comparison the curves have been arbitrarily shifted).
Figure 29. Calibration curves for various approaches, in the two different
immunoarrays.
0
250
500
750
0 50 100 150
0pg Ab2-MP-HRP in PBS 1:10
50pg Ab2-MP-HRP in PBS 1:10
100pg Ab2-MP-HRP in PBS 1:10
t, s
0
100
200
300
400
500
0 50 100
Ab2-HRP 2%BSA PBS T-20Ab2-HRP 0.2%BSA PBS T-20Ab2-HRP PBS T-20Ab2-MP-HRP in PBS 1:10Ab2-MP-HRP in PBS 1:20Ab2-MP-HRP in PBS 1:50
Concentration, pg
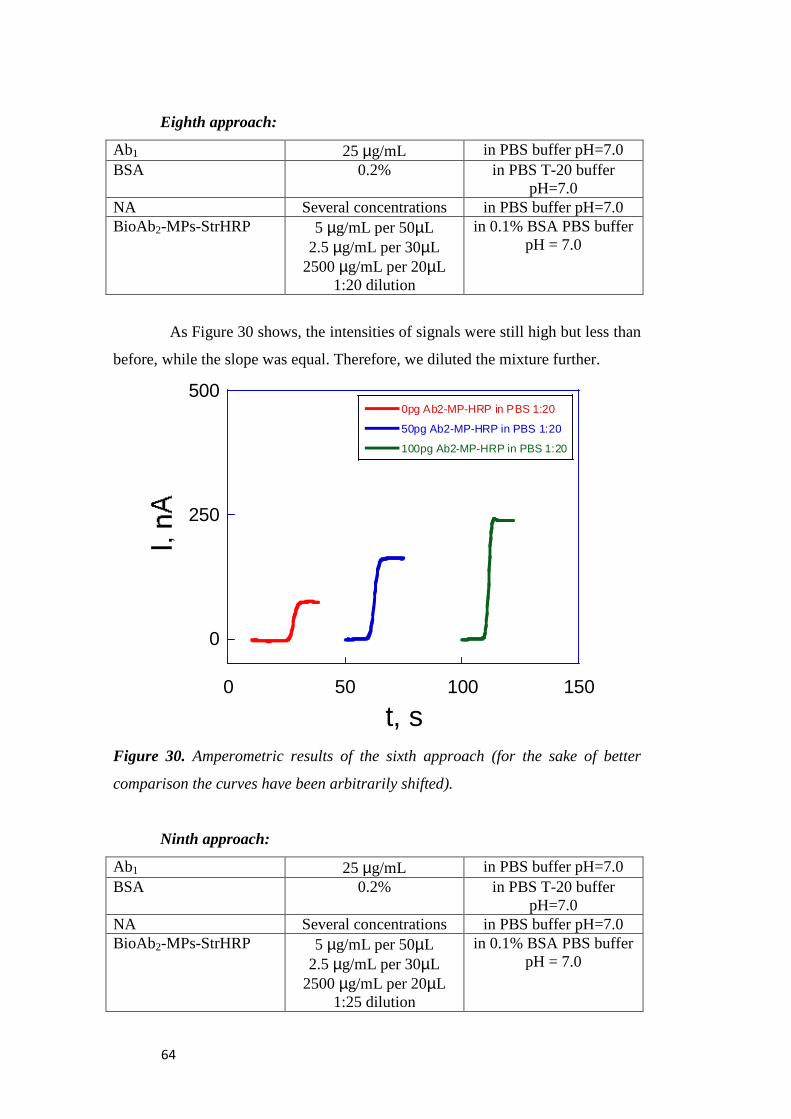
64
Eighth approach:
Ab1 25 µg/mL in PBS buffer pH=7.0 BSA 0.2% in PBS T-20 buffer
pH=7.0 NA Several concentrations in PBS buffer pH=7.0 BioAb2-MPs-StrHRP 5 µg/mL per 50µL
2.5 µg/mL per 30µL 2500 µg/mL per 20µL
1:20 dilution
in 0.1% BSA PBS buffer pH = 7.0
As Figure 30 shows, the intensities of signals were still high but less than
before, while the slope was equal. Therefore, we diluted the mixture further.
Figure 30. Amperometric results of the sixth approach (for the sake of better
comparison the curves have been arbitrarily shifted).
Ninth approach:
Ab1 25 µg/mL in PBS buffer pH=7.0 BSA 0.2% in PBS T-20 buffer
pH=7.0 NA Several concentrations in PBS buffer pH=7.0 BioAb2-MPs-StrHRP 5 µg/mL per 50µL
2.5 µg/mL per 30µL 2500 µg/mL per 20µL
1:25 dilution
in 0.1% BSA PBS buffer pH = 7.0
0
250
500
0 50 100 150
0pg Ab2-MP-HRP in PBS 1:20
50pg Ab2-MP-HRP in PBS 1:20
100pg Ab2-MP-HRP in PBS 1:20
t, s
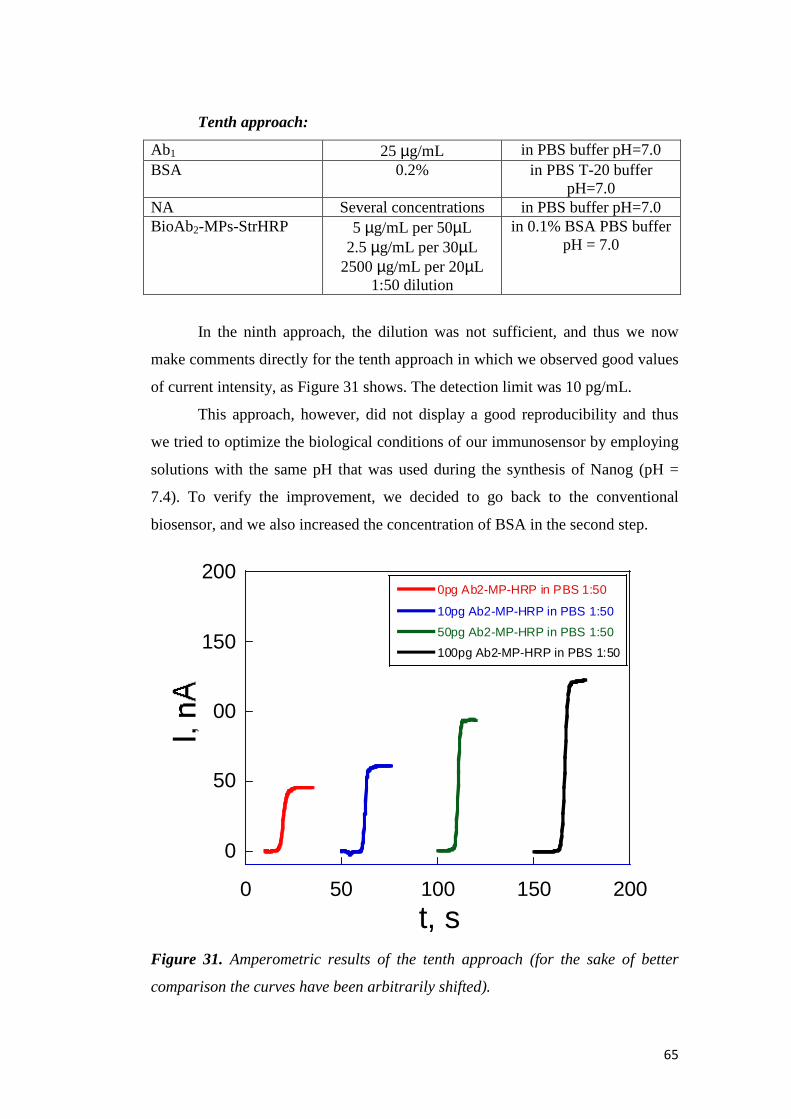
65
Tenth approach:
Ab1 25 µg/mL in PBS buffer pH=7.0 BSA 0.2% in PBS T-20 buffer
pH=7.0 NA Several concentrations in PBS buffer pH=7.0 BioAb2-MPs-StrHRP 5 µg/mL per 50µL
2.5 µg/mL per 30µL 2500 µg/mL per 20µL
1:50 dilution
in 0.1% BSA PBS buffer pH = 7.0
In the ninth approach, the dilution was not sufficient, and thus we now
make comments directly for the tenth approach in which we observed good values
of current intensity, as Figure 31 shows. The detection limit was 10 pg/mL.
This approach, however, did not display a good reproducibility and thus
we tried to optimize the biological conditions of our immunosensor by employing
solutions with the same pH that was used during the synthesis of Nanog (pH =
7.4). To verify the improvement, we decided to go back to the conventional
biosensor, and we also increased the concentration of BSA in the second step.
Figure 31. Amperometric results of the tenth approach (for the sake of better
comparison the curves have been arbitrarily shifted).
0
50
100
150
200
0 50 100 150 200
0pg Ab2-MP-HRP in PBS 1:50
10pg Ab2-MP-HRP in PBS 1:50
50pg Ab2-MP-HRP in PBS 1:50
100pg Ab2-MP-HRP in PBS 1:50
t, s
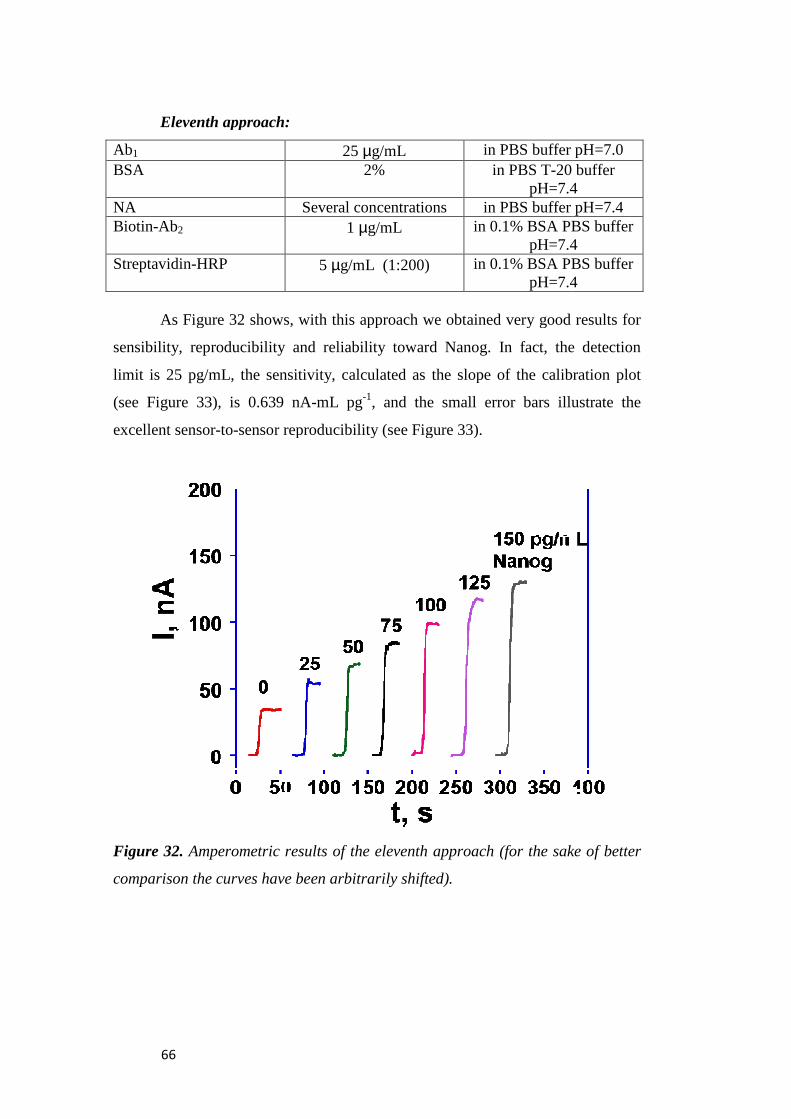
66
Eleventh approach:
Ab1 BSA
NA Biotin-Ab2
Streptavidin-HRP
As Figure 32 shows, with this approach we obtained very good results for
sensibility, reproducibility and reliability toward Nanog. In fact, the detection
limit is 25 pg/mL, the sensitivity, calculated as the slope of the calibration plot
(see Figure 33), is 0.639 nA
excellent sensor-to-sensor reproducibility (see Figure 33).
Figure 32. Amperometric results of the eleventh
comparison the curves have been
Eleventh approach:
25 µg/mL in PBS buffer pH=7.02% in PBS T-20 buffer
pH=7.4Several concentrations in PBS buffer pH=7.4
1 µg/mL in 0.1% BSA PBS buffer pH=7.4
5 µg/mL (1:200) in 0.1% BSA PBS buffer pH=7.4
As Figure 32 shows, with this approach we obtained very good results for
sensibility, reproducibility and reliability toward Nanog. In fact, the detection
sensitivity, calculated as the slope of the calibration plot
(see Figure 33), is 0.639 nA-mL pg-1, and the small error bars illustrate the
sensor reproducibility (see Figure 33).
Amperometric results of the eleventh approach (for the sake of better
comparison the curves have been arbitrarily shifted).
in PBS buffer pH=7.0 20 buffer
4 in PBS buffer pH=7.4
in 0.1% BSA PBS buffer pH=7.4
in 0.1% BSA PBS buffer pH=7.4
As Figure 32 shows, with this approach we obtained very good results for
sensibility, reproducibility and reliability toward Nanog. In fact, the detection
sensitivity, calculated as the slope of the calibration plot
, and the small error bars illustrate the
(for the sake of better
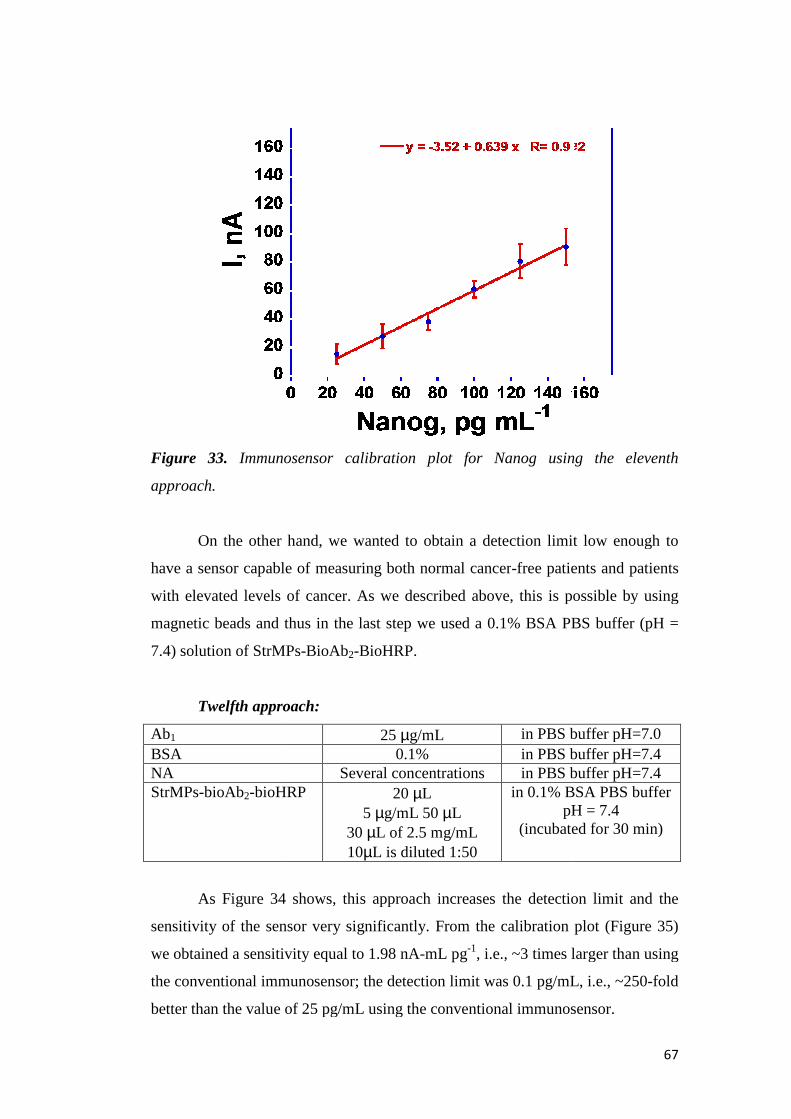
Figure 33. Immunosensor calibration plot for Nanog using the eleventh
approach.
On the other hand, we wanted to obtain a detection limit low enough to
have a sensor capable of measuring both normal cancer
with elevated levels of cancer. As we described above, this is possible by using
magnetic beads and thus in the last step we used a 0.1% BSA PBS buffer (pH =
7.4) solution of StrMPs
Twelfth approach:
Ab1 BSA NA StrMPs-bioAb2-bioHRP
As Figure 34 shows, this approach increases the detection limit and the
sensitivity of the sensor very significantly. From the calibration plot (Figure 35)
we obtained a sensitivity equal to 1.98
the conventional immunosensor; the detection limit was 0.1 pg/mL, i.e., ~250
better than the value of 25 pg/mL using the conventional immunosensor.
Immunosensor calibration plot for Nanog using the eleventh
On the other hand, we wanted to obtain a detection limit low enough to
capable of measuring both normal cancer-free patients and patients
with elevated levels of cancer. As we described above, this is possible by using
magnetic beads and thus in the last step we used a 0.1% BSA PBS buffer (pH =
7.4) solution of StrMPs-BioAb2-BioHRP.
approach:
25 µg/mL in PBS buffer pH=7.00.1% in PBS buffer pH=7.4
Several concentrations in PBS buffer pH=7.4bioHRP 20 µL
5 µg/mL 50 µL 30 µL of 2.5 mg/mL 10µL is diluted 1:50
in 0.1% BSA PBS buffer pH = 7.4
(incubated for 30 min)
As Figure 34 shows, this approach increases the detection limit and the
sensitivity of the sensor very significantly. From the calibration plot (Figure 35)
we obtained a sensitivity equal to 1.98 nA-mL pg-1, i.e., ~3 times larger than using
the conventional immunosensor; the detection limit was 0.1 pg/mL, i.e., ~250
better than the value of 25 pg/mL using the conventional immunosensor.
67
Immunosensor calibration plot for Nanog using the eleventh
On the other hand, we wanted to obtain a detection limit low enough to
free patients and patients
with elevated levels of cancer. As we described above, this is possible by using
magnetic beads and thus in the last step we used a 0.1% BSA PBS buffer (pH =
in PBS buffer pH=7.0 in PBS buffer pH=7.4 in PBS buffer pH=7.4
in 0.1% BSA PBS buffer pH = 7.4
(incubated for 30 min)
As Figure 34 shows, this approach increases the detection limit and the
sensitivity of the sensor very significantly. From the calibration plot (Figure 35)
, i.e., ~3 times larger than using
the conventional immunosensor; the detection limit was 0.1 pg/mL, i.e., ~250-fold
better than the value of 25 pg/mL using the conventional immunosensor.

68
Figure 34. Amperometric results of the twelf
comparison the curves have been
Figure 35. Immunosensor calibration plot for Nanog using the twelfth approach.
perometric results of the twelfth approach (for the sake of better
comparison the curves have been arbitrarily shifted).
Immunosensor calibration plot for Nanog using the twelfth approach.
(for the sake of better
Immunosensor calibration plot for Nanog using the twelfth approach.

At this point, to better control and automate sample introduction, as well as
steps such as washing, reagent addition, and the amount of H
decided to take the sensor experiment to the microfluidic system.
In microfluidics, the mechanism is similar to that of the rotating
electrode, the main difference being that in this case
stationary while the HQ solution continuously flows into the microfluidic channel
at a determinate speed rate (100
transport regime, H2O
enzyme peroxidase. Figure 36 shows a schematic representation of the
microfluidic system.
Figure 36
The intensity of the a
concentration of NA, and
the flux. Figure 37 shows one representative example of measurement employing
an eight-electrode array. The Nanog concentration was 1 pg/mL. As we can see,
the current does not reach a steady state
method, but increases until reaching a maximum value and then decreases in time
because the concentration of hydrogen peroxide decreases due to the constant flux
of the fluid.
At this point, to better control and automate sample introduction, as well as
washing, reagent addition, and the amount of H2
decided to take the sensor experiment to the microfluidic system.
In microfluidics, the mechanism is similar to that of the rotating
electrode, the main difference being that in this case the eight-electrode array is
stationary while the HQ solution continuously flows into the microfluidic channel
at a determinate speed rate (100 µL/min). By taking advantage of this mass
O2, once injected, can reach the sensor array and
enzyme peroxidase. Figure 36 shows a schematic representation of the
6. Schematic representation of microfluidic system
The intensity of the amperometric current is proportional to the
concentration of NA, and the width of the peak is proportional to the speed rate of
the flux. Figure 37 shows one representative example of measurement employing
electrode array. The Nanog concentration was 1 pg/mL. As we can see,
the current does not reach a steady state, as with the rotating
method, but increases until reaching a maximum value and then decreases in time
because the concentration of hydrogen peroxide decreases due to the constant flux
69
At this point, to better control and automate sample introduction, as well as
2O2 injected, we
In microfluidics, the mechanism is similar to that of the rotating-disk
electrode array is
stationary while the HQ solution continuously flows into the microfluidic channel
L/min). By taking advantage of this mass
, once injected, can reach the sensor array and oxidize the
enzyme peroxidase. Figure 36 shows a schematic representation of the
Schematic representation of microfluidic system
mperometric current is proportional to the
the width of the peak is proportional to the speed rate of
the flux. Figure 37 shows one representative example of measurement employing
electrode array. The Nanog concentration was 1 pg/mL. As we can see,
, as with the rotating-disk electrode
method, but increases until reaching a maximum value and then decreases in time
because the concentration of hydrogen peroxide decreases due to the constant flux
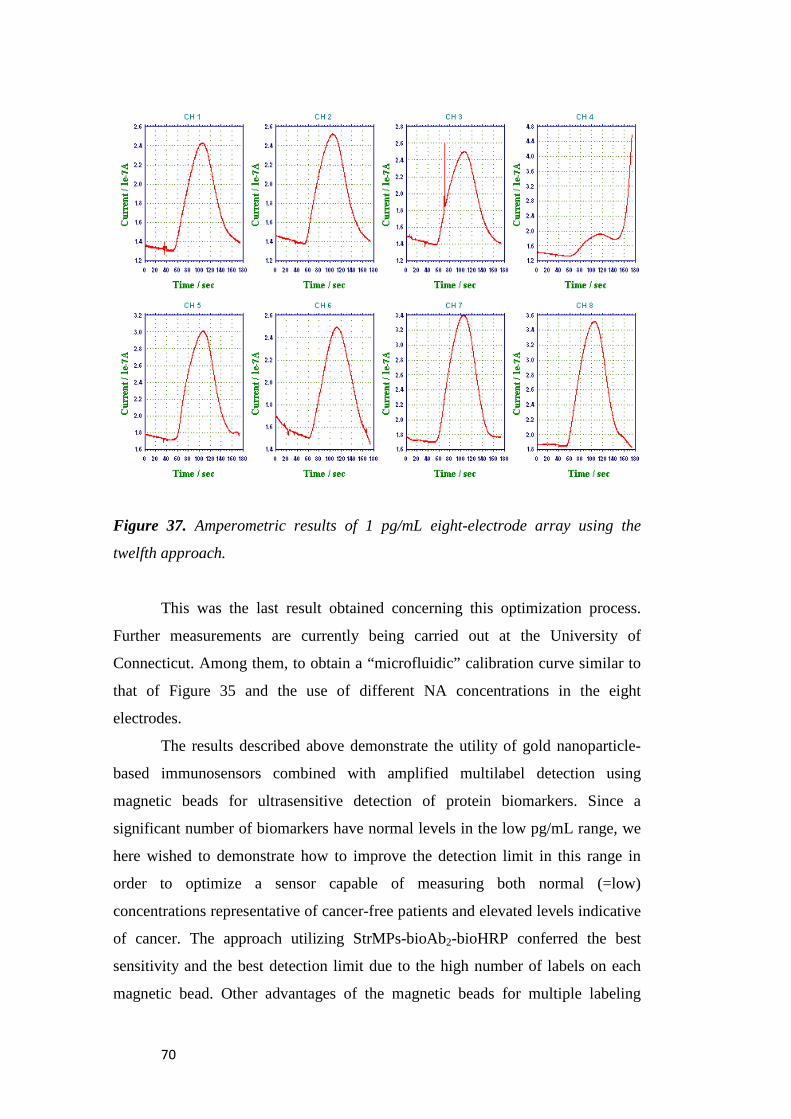
70
Figure 37. Amperometric results of 1 pg/mL eight-electrode array using the
twelfth approach.
This was the last result obtained concerning this optimization process.
Further measurements are currently being carried out at the University of
Connecticut. Among them, to obtain a “microfluidic” calibration curve similar to
that of Figure 35 and the use of different NA concentrations in the eight
electrodes.
The results described above demonstrate the utility of gold nanoparticle-
based immunosensors combined with amplified multilabel detection using
magnetic beads for ultrasensitive detection of protein biomarkers. Since a
significant number of biomarkers have normal levels in the low pg/mL range, we
here wished to demonstrate how to improve the detection limit in this range in
order to optimize a sensor capable of measuring both normal (=low)
concentrations representative of cancer-free patients and elevated levels indicative
of cancer. The approach utilizing StrMPs-bioAb2-bioHRP conferred the best
sensitivity and the best detection limit due to the high number of labels on each
magnetic bead. Other advantages of the magnetic beads for multiple labeling
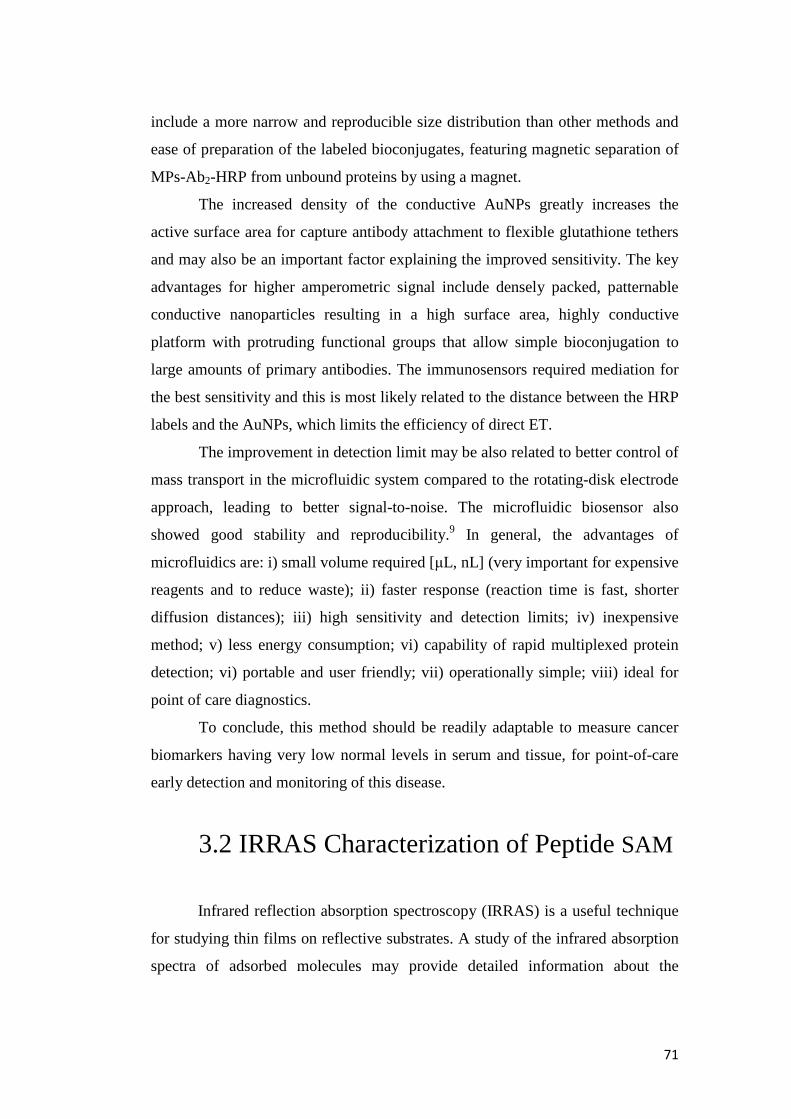
71
include a more narrow and reproducible size distribution than other methods and
ease of preparation of the labeled bioconjugates, featuring magnetic separation of
MPs-Ab2-HRP from unbound proteins by using a magnet.
The increased density of the conductive AuNPs greatly increases the
active surface area for capture antibody attachment to flexible glutathione tethers
and may also be an important factor explaining the improved sensitivity. The key
advantages for higher amperometric signal include densely packed, patternable
conductive nanoparticles resulting in a high surface area, highly conductive
platform with protruding functional groups that allow simple bioconjugation to
large amounts of primary antibodies. The immunosensors required mediation for
the best sensitivity and this is most likely related to the distance between the HRP
labels and the AuNPs, which limits the efficiency of direct ET.
The improvement in detection limit may be also related to better control of
mass transport in the microfluidic system compared to the rotating-disk electrode
approach, leading to better signal-to-noise. The microfluidic biosensor also
showed good stability and reproducibility.9 In general, the advantages of
microfluidics are: i) small volume required [µL, nL] (very important for expensive
reagents and to reduce waste); ii) faster response (reaction time is fast, shorter
diffusion distances); iii) high sensitivity and detection limits; iv) inexpensive
method; v) less energy consumption; vi) capability of rapid multiplexed protein
detection; vi) portable and user friendly; vii) operationally simple; viii) ideal for
point of care diagnostics.
To conclude, this method should be readily adaptable to measure cancer
biomarkers having very low normal levels in serum and tissue, for point-of-care
early detection and monitoring of this disease.
3.2 IRRAS Characterization of Peptide SAM
Infrared reflection absorption spectroscopy (IRRAS) is a useful technique
for studying thin films on reflective substrates. A study of the infrared absorption
spectra of adsorbed molecules may provide detailed information about the

72
structure of the adsorbed species, the nature of the interaction with the surface,
and the strength of the adsorption forces.
3.2.1 The metal-surface selection rule
The IRRAS technique differs from normal IR spectroscopy for a particular
effect given by the reflection of the beam on a surface. Infrared radiation is a
transverse, electromagnetic wave characterized by the orthogonal electric and
magnetic fields oscillating in directions perpendicular to the direction of the wave
propagation. Figure 38 shows a graphical representation of an electromagnetic
wave with the electric field oriented along the y axis. Such a wave, with a well-
defined orientation of the electric and magnetic fields, describes a linearly
polarized radiation and shows that a non-polarized radiation can be regarded as
composed of two orthogonal, linearly-polarized components. The energy of the
magnetic field is equal to the energy of the electric field of an electromagnetic
wave and thus it is convenient to consider only one field, usually the electric one.
When the electromagnetic radiation is incident at a boundary between two phases,
part of the beam is reflected and part of it is refracted into the second medium.
The reflected light combines with the incident light to produce a standing-wave
electric field at the metal surface, where the adsorbing monolayer is present.
Figure 38. Direction of electric and magnetic fields with respect to the
propagation direction of an electromagnetic wave.
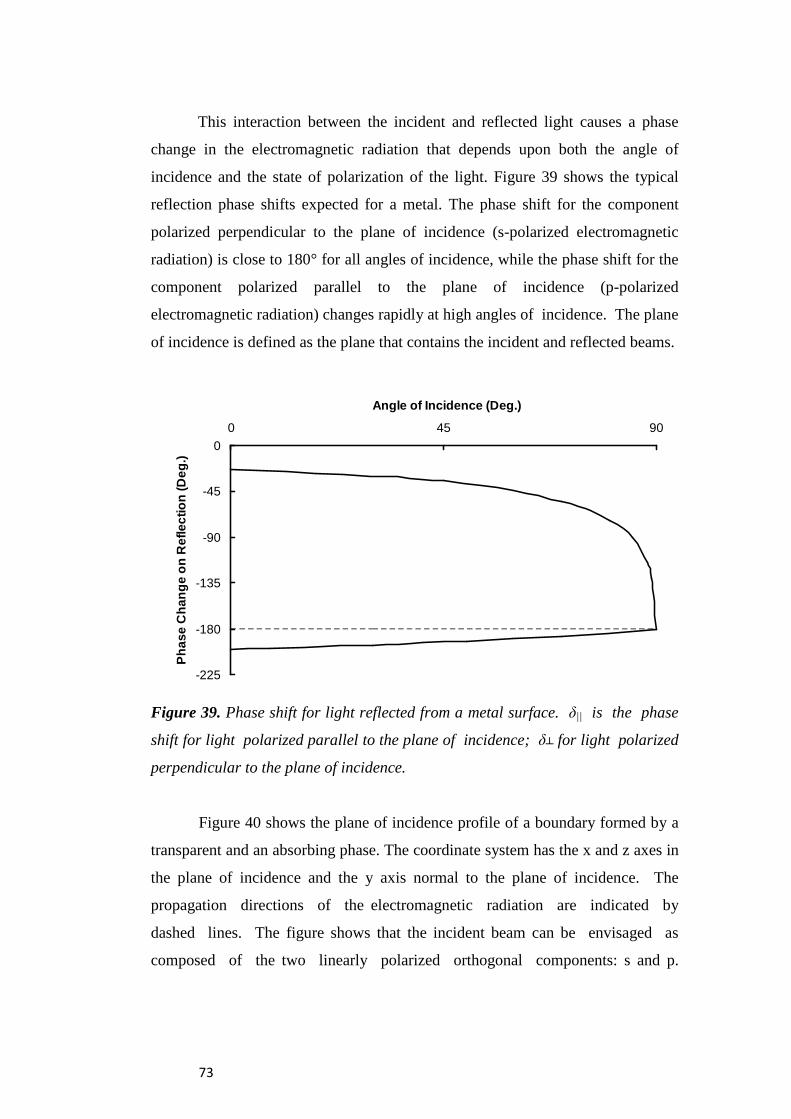
73
This interaction between the incident and reflected light causes a phase
change in the electromagnetic radiation that depends upon both the angle of
incidence and the state of polarization of the light. Figure 39 shows the typical
reflection phase shifts expected for a metal. The phase shift for the component
polarized perpendicular to the plane of incidence (s-polarized electromagnetic
radiation) is close to 180° for all angles of incidence, while the phase shift for the
component polarized parallel to the plane of incidence (p-polarized
electromagnetic radiation) changes rapidly at high angles of incidence. The plane
of incidence is defined as the plane that contains the incident and reflected beams.
Figure 39. Phase shift for light reflected from a metal surface. δ|| is the phase
shift for light polarized parallel to the plane of incidence; δ┴ for light polarized
perpendicular to the plane of incidence.
Figure 40 shows the plane of incidence profile of a boundary formed by a
transparent and an absorbing phase. The coordinate system has the x and z axes in
the plane of incidence and the y axis normal to the plane of incidence. The
propagation directions of the electromagnetic radiation are indicated by
dashed lines. The figure shows that the incident beam can be envisaged as
composed of the two linearly polarized orthogonal components: s and p.
-225
-180
-135
-90
-45
00 45 90
Angle of Incidence (Deg.)
Ph
ase
Ch
ang
e o
n R
efle
ctio
n (D
eg.)
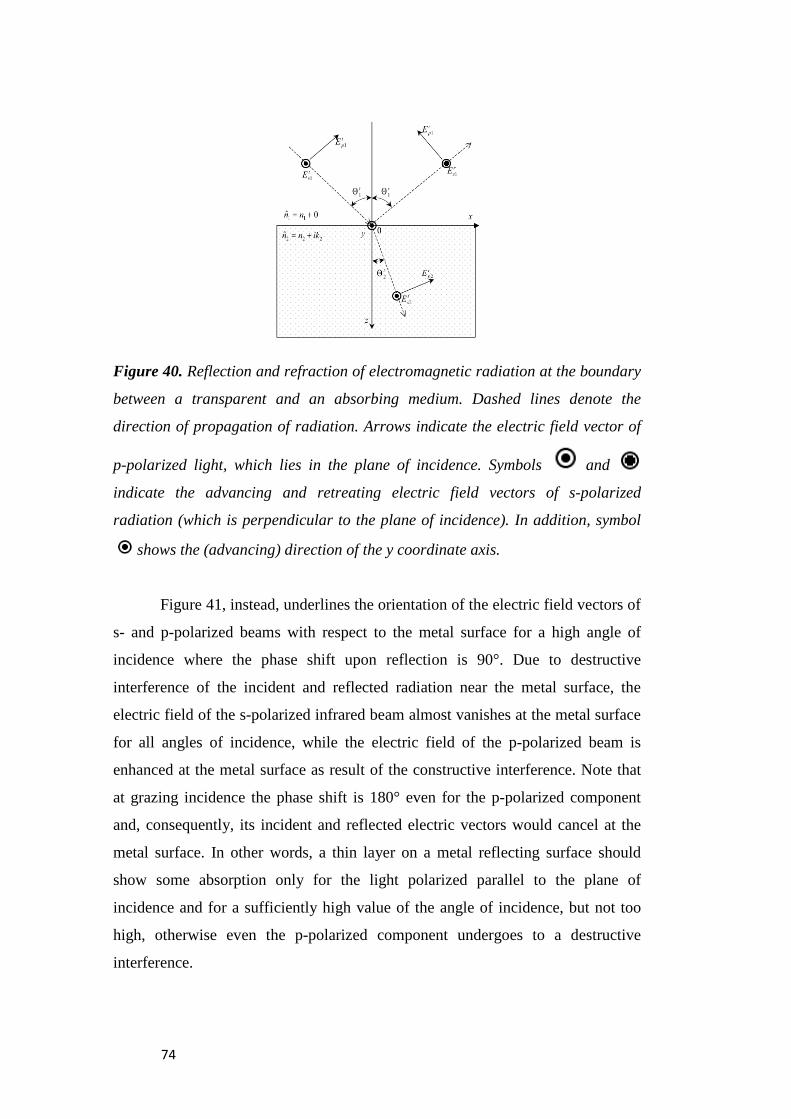
74
Figure 40. Reflection and refraction of electromagnetic radiation at the boundary
between a transparent and an absorbing medium. Dashed lines denote the
direction of propagation of radiation. Arrows indicate the electric field vector of
p-polarized light, which lies in the plane of incidence. Symbols and
indicate the advancing and retreating electric field vectors of s-polarized
radiation (which is perpendicular to the plane of incidence). In addition, symbol
shows the (advancing) direction of the y coordinate axis.
Figure 41, instead, underlines the orientation of the electric field vectors of
s- and p-polarized beams with respect to the metal surface for a high angle of
incidence where the phase shift upon reflection is 90°. Due to destructive
interference of the incident and reflected radiation near the metal surface, the
electric field of the s-polarized infrared beam almost vanishes at the metal surface
for all angles of incidence, while the electric field of the p-polarized beam is
enhanced at the metal surface as result of the constructive interference. Note that
at grazing incidence the phase shift is 180° even for the p-polarized component
and, consequently, its incident and reflected electric vectors would cancel at the
metal surface. In other words, a thin layer on a metal reflecting surface should
show some absorption only for the light polarized parallel to the plane of
incidence and for a sufficiently high value of the angle of incidence, but not too
high, otherwise even the p-polarized component undergoes to a destructive
interference.
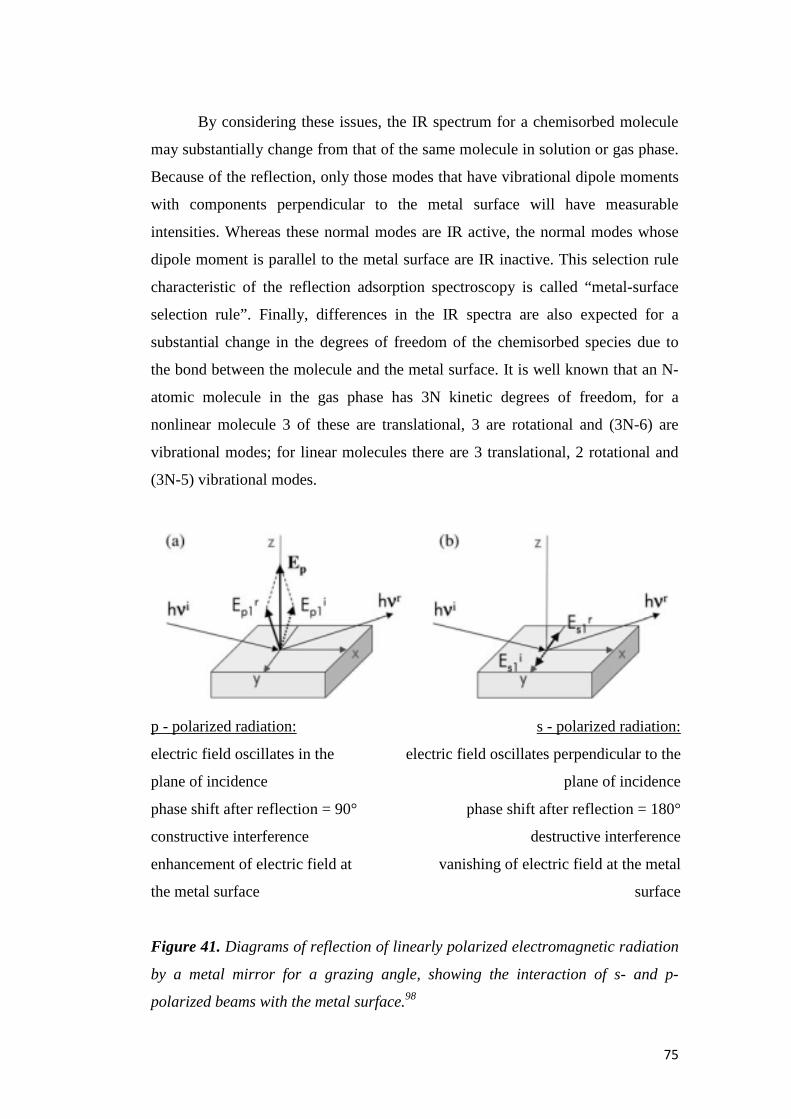
75
By considering these issues, the IR spectrum for a chemisorbed molecule
may substantially change from that of the same molecule in solution or gas phase.
Because of the reflection, only those modes that have vibrational dipole moments
with components perpendicular to the metal surface will have measurable
intensities. Whereas these normal modes are IR active, the normal modes whose
dipole moment is parallel to the metal surface are IR inactive. This selection rule
characteristic of the reflection adsorption spectroscopy is called “metal-surface
selection rule”. Finally, differences in the IR spectra are also expected for a
substantial change in the degrees of freedom of the chemisorbed species due to
the bond between the molecule and the metal surface. It is well known that an N-
atomic molecule in the gas phase has 3N kinetic degrees of freedom, for a
nonlinear molecule 3 of these are translational, 3 are rotational and (3N-6) are
vibrational modes; for linear molecules there are 3 translational, 2 rotational and
(3N-5) vibrational modes.
p - polarized radiation:
electric field oscillates in the
plane of incidence
phase shift after reflection = 90°
constructive interference
enhancement of electric field at
the metal surface
s - polarized radiation:
electric field oscillates perpendicular to the
plane of incidence
phase shift after reflection = 180°
destructive interference
vanishing of electric field at the metal
surface
Figure 41. Diagrams of reflection of linearly polarized electromagnetic radiation
by a metal mirror for a grazing angle, showing the interaction of s- and p-
polarized beams with the metal surface.98
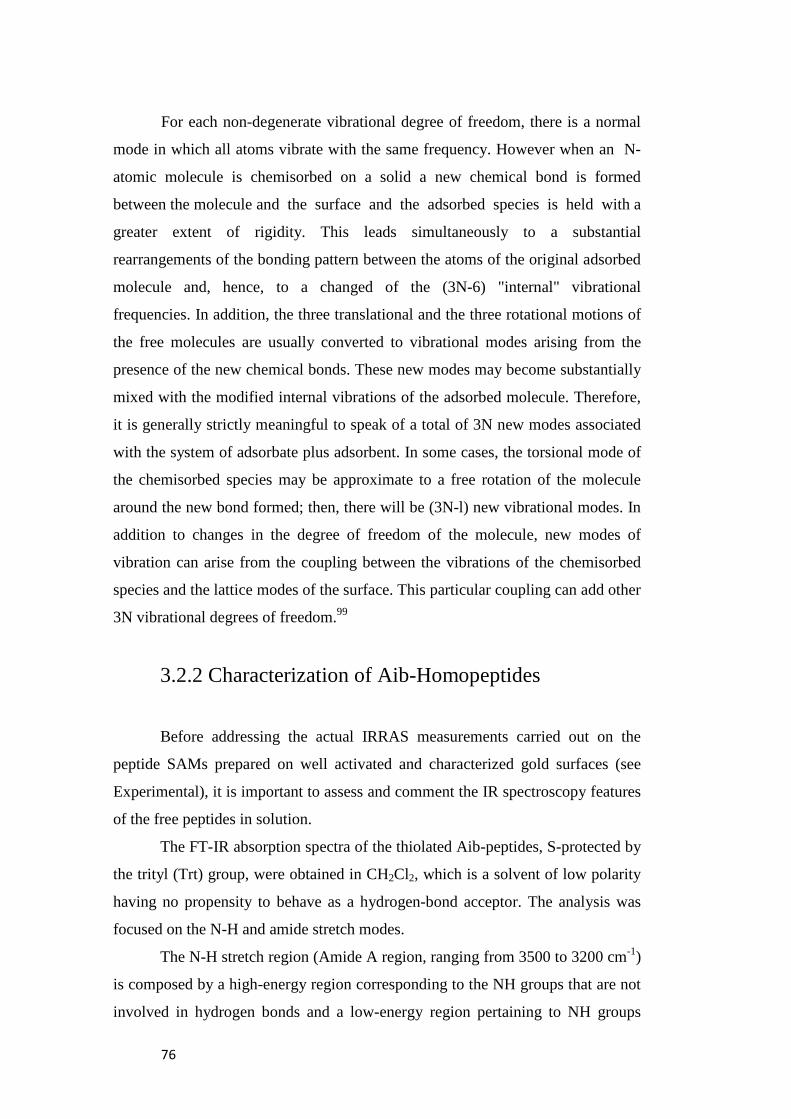
76
For each non-degenerate vibrational degree of freedom, there is a normal
mode in which all atoms vibrate with the same frequency. However when an N-
atomic molecule is chemisorbed on a solid a new chemical bond is formed
between the molecule and the surface and the adsorbed species is held with a
greater extent of rigidity. This leads simultaneously to a substantial
rearrangements of the bonding pattern between the atoms of the original adsorbed
molecule and, hence, to a changed of the (3N-6) "internal" vibrational
frequencies. In addition, the three translational and the three rotational motions of
the free molecules are usually converted to vibrational modes arising from the
presence of the new chemical bonds. These new modes may become substantially
mixed with the modified internal vibrations of the adsorbed molecule. Therefore,
it is generally strictly meaningful to speak of a total of 3N new modes associated
with the system of adsorbate plus adsorbent. In some cases, the torsional mode of
the chemisorbed species may be approximate to a free rotation of the molecule
around the new bond formed; then, there will be (3N-l) new vibrational modes. In
addition to changes in the degree of freedom of the molecule, new modes of
vibration can arise from the coupling between the vibrations of the chemisorbed
species and the lattice modes of the surface. This particular coupling can add other
3N vibrational degrees of freedom.99
3.2.2 Characterization of Aib-Homopeptides
Before addressing the actual IRRAS measurements carried out on the
peptide SAMs prepared on well activated and characterized gold surfaces (see
Experimental), it is important to assess and comment the IR spectroscopy features
of the free peptides in solution.
The FT-IR absorption spectra of the thiolated Aib-peptides, S-protected by
the trityl (Trt) group, were obtained in CH2Cl2, which is a solvent of low polarity
having no propensity to behave as a hydrogen-bond acceptor. The analysis was
focused on the N-H and amide stretch modes.
The N-H stretch region (Amide A region, ranging from 3500 to 3200 cm-1)
is composed by a high-energy region corresponding to the NH groups that are not
involved in hydrogen bonds and a low-energy region pertaining to NH groups
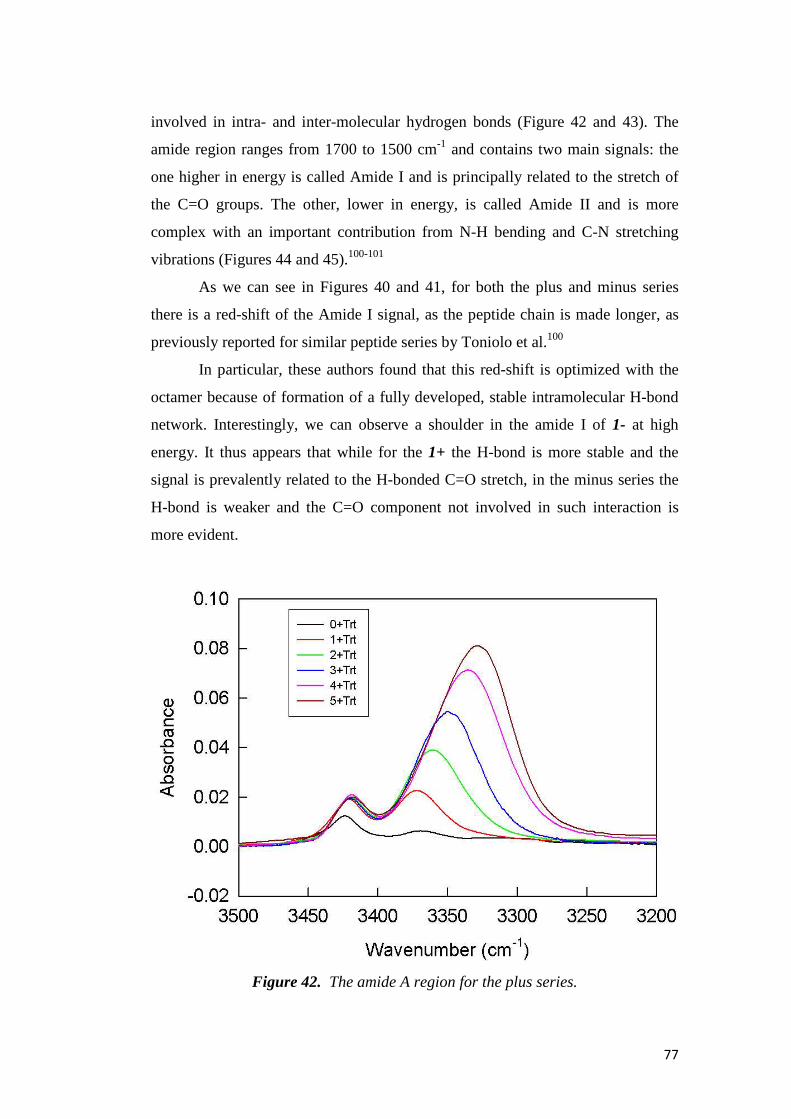
77
involved in intra- and inter-molecular hydrogen bonds (Figure 42 and 43). The
amide region ranges from 1700 to 1500 cm-1 and contains two main signals: the
one higher in energy is called Amide I and is principally related to the stretch of
the C=O groups. The other, lower in energy, is called Amide II and is more
complex with an important contribution from N-H bending and C-N stretching
vibrations (Figures 44 and 45).100-101
As we can see in Figures 40 and 41, for both the plus and minus series
there is a red-shift of the Amide I signal, as the peptide chain is made longer, as
previously reported for similar peptide series by Toniolo et al.100
In particular, these authors found that this red-shift is optimized with the
octamer because of formation of a fully developed, stable intramolecular H-bond
network. Interestingly, we can observe a shoulder in the amide I of 1- at high
energy. It thus appears that while for the 1+ the H-bond is more stable and the
signal is prevalently related to the H-bonded C=O stretch, in the minus series the
H-bond is weaker and the C=O component not involved in such interaction is
more evident.
Figure 42. The amide A region for the plus series.
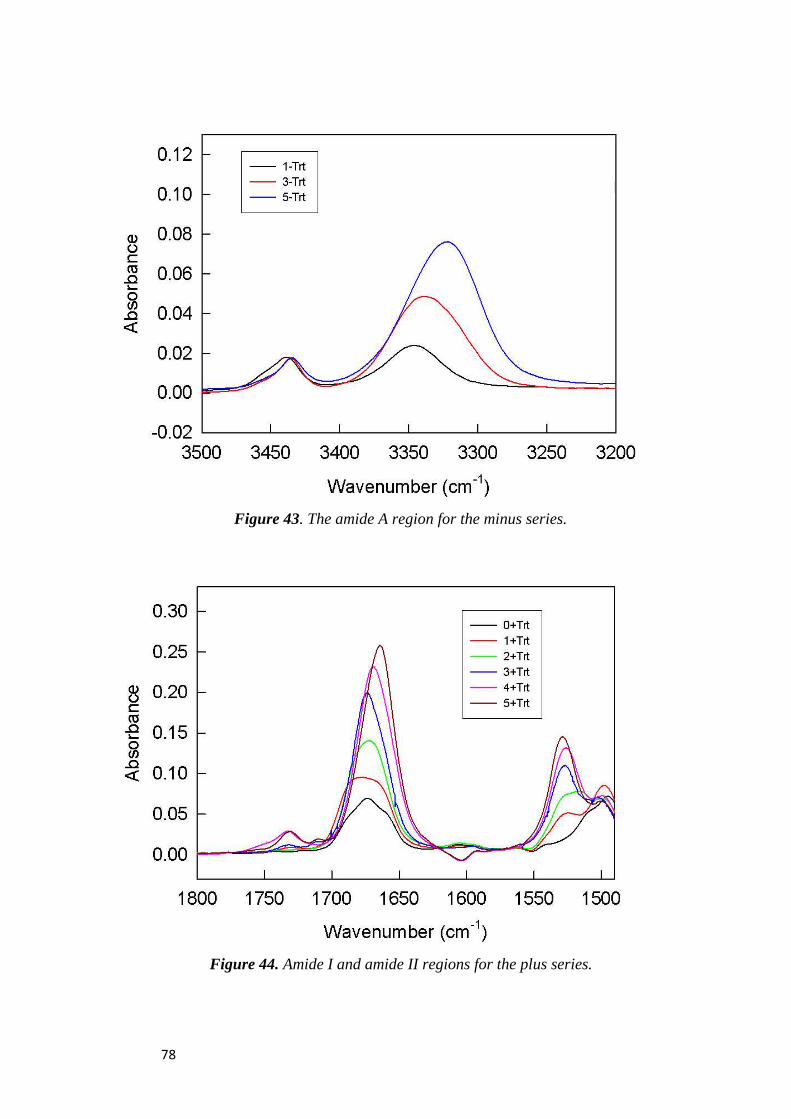
78
Figure 43. The amide A region for the minus series.
Figure 44. Amide I and amide II regions for the plus series.
b
)
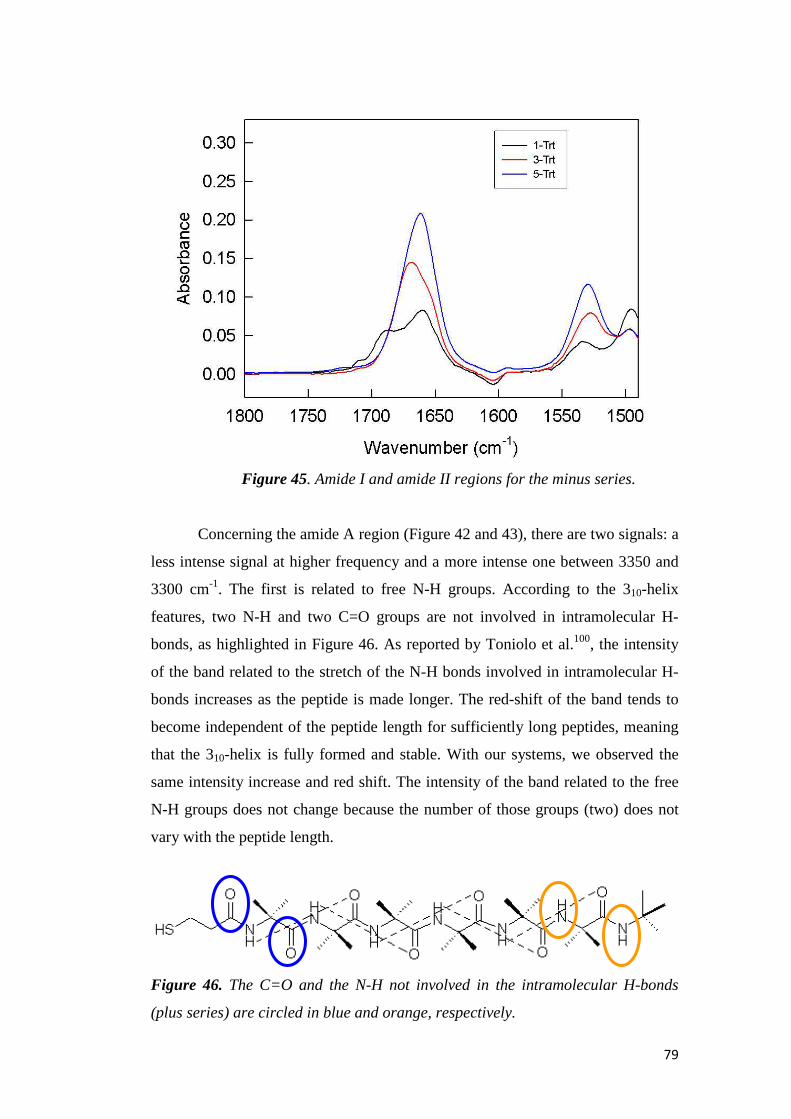
79
Figure 45. Amide I and amide II regions for the minus series.
Concerning the amide A region (Figure 42 and 43), there are two signals: a
less intense signal at higher frequency and a more intense one between 3350 and
3300 cm-1. The first is related to free N-H groups. According to the 310-helix
features, two N-H and two C=O groups are not involved in intramolecular H-
bonds, as highlighted in Figure 46. As reported by Toniolo et al.100, the intensity
of the band related to the stretch of the N-H bonds involved in intramolecular H-
bonds increases as the peptide is made longer. The red-shift of the band tends to
become independent of the peptide length for sufficiently long peptides, meaning
that the 310-helix is fully formed and stable. With our systems, we observed the
same intensity increase and red shift. The intensity of the band related to the free
N-H groups does not change because the number of those groups (two) does not
vary with the peptide length.
Figure 46. The C=O and the N-H not involved in the intramolecular H-bonds
(plus series) are circled in blue and orange, respectively.
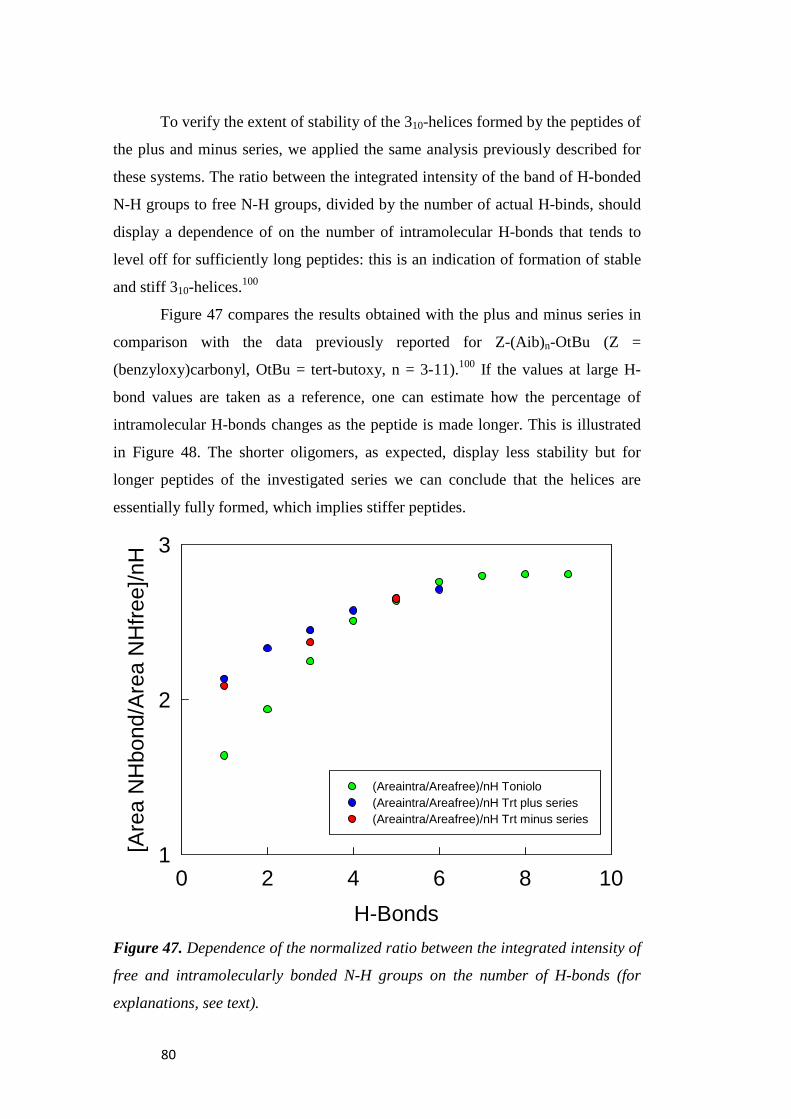
80
To verify the extent of stability of the 310-helices formed by the peptides of
the plus and minus series, we applied the same analysis previously described for
these systems. The ratio between the integrated intensity of the band of H-bonded
N-H groups to free N-H groups, divided by the number of actual H-binds, should
display a dependence of on the number of intramolecular H-bonds that tends to
level off for sufficiently long peptides: this is an indication of formation of stable
and stiff 310-helices.100
Figure 47 compares the results obtained with the plus and minus series in
comparison with the data previously reported for Z-(Aib)n-OtBu (Z =
(benzyloxy)carbonyl, OtBu = tert-butoxy, n = 3-11).100 If the values at large H-
bond values are taken as a reference, one can estimate how the percentage of
intramolecular H-bonds changes as the peptide is made longer. This is illustrated
in Figure 48. The shorter oligomers, as expected, display less stability but for
longer peptides of the investigated series we can conclude that the helices are
essentially fully formed, which implies stiffer peptides.
Figure 47. Dependence of the normalized ratio between the integrated intensity of
free and intramolecularly bonded N-H groups on the number of H-bonds (for
explanations, see text).
H-Bonds
0 2 4 6 8 10
[Are
a N
Hbo
nd/A
rea
NH
free
]/nH
1
2
3
(Areaintra/Areafree)/nH Toniolo (Areaintra/Areafree)/nH Trt plus series(Areaintra/Areafree)/nH Trt minus series
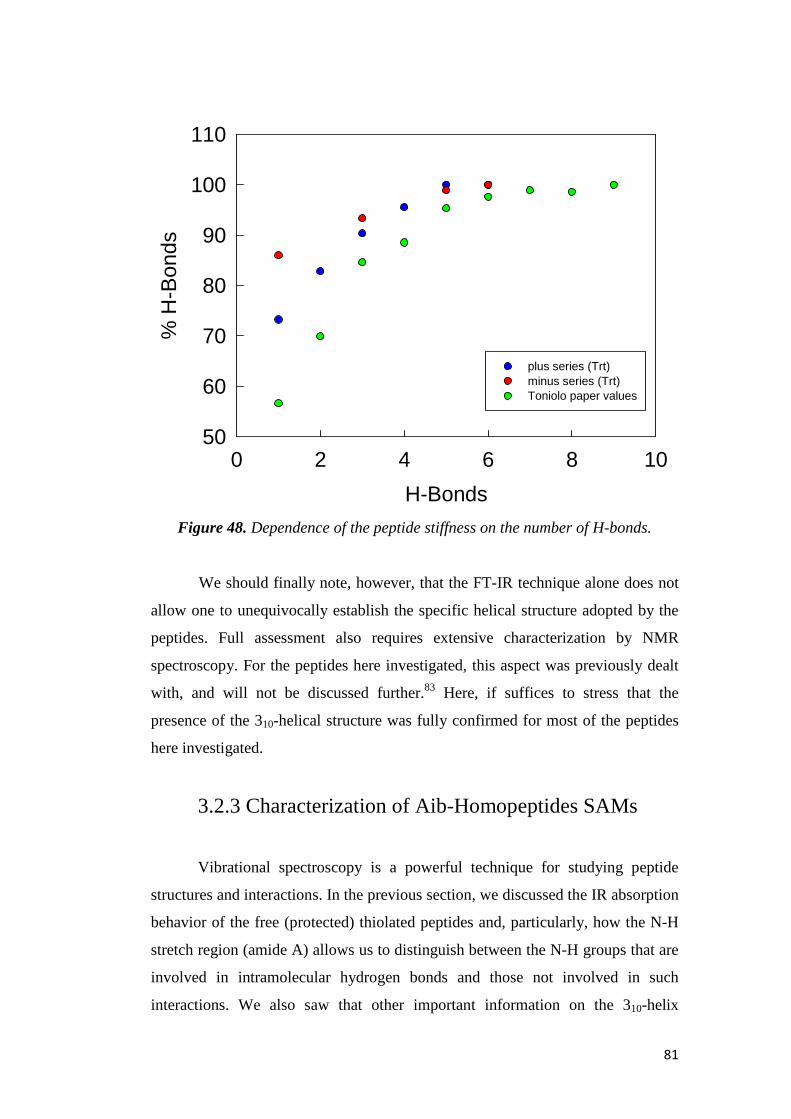
81
Figure 48. Dependence of the peptide stiffness on the number of H-bonds.
We should finally note, however, that the FT-IR technique alone does not
allow one to unequivocally establish the specific helical structure adopted by the
peptides. Full assessment also requires extensive characterization by NMR
spectroscopy. For the peptides here investigated, this aspect was previously dealt
with, and will not be discussed further.83 Here, if suffices to stress that the
presence of the 310-helical structure was fully confirmed for most of the peptides
here investigated.
3.2.3 Characterization of Aib-Homopeptides SAMs
Vibrational spectroscopy is a powerful technique for studying peptide
structures and interactions. In the previous section, we discussed the IR absorption
behavior of the free (protected) thiolated peptides and, particularly, how the N-H
stretch region (amide A) allows us to distinguish between the N-H groups that are
involved in intramolecular hydrogen bonds and those not involved in such
interactions. We also saw that other important information on the 310-helix
H-Bonds
0 2 4 6 8 10
% H
-Bon
ds
50
60
70
80
90
100
110
plus series (Trt)minus series (Trt)Toniolo paper values

82
structure and stability can be obtained from the amide I (and amide II) region.
IRRAS spectroscopy was utilized to obtain information on the structure of the
peptide SAMs and to further investigate their stability. In fact, the same
information provided from FTIR of free ligands can be obtained from the position
and intensity of the IRRAS peaks. In addition, information on the organization of
the monolayer can be gathered by taking advantage of the metal-surface selection
rule.
The two series of peptides, self-assembled onto carefully annealed gold
surfaces (see Experimental) were thus studied by IRRAS; the spectrum of 0+,
however, could not be satisfactorily analyzed because of its week signals. Figure
48 shows the full spectrum of the SAMs formed from the peptides of the plus
series. The presence of bands that clearly increase as the peptide length increases
is evident. We will first comment the Amide A region, and then the Amide I and
II regions.
Plus Series:
Figure 49. The FTIR-RAS spectra for the plus series correspond (bottom to top)
to 1+ (pink), 2+ (green), 3+ (blue), 4+ (red), and 5+ (black).
Wavenumber (cm-1)
15002000250030003500
Abs
orba
nce
-8e-4
-6e-4
-4e-4
-2e-4
0
2e-4
4e-4
6e-4
8e-4
1e-3FTIR 5+ FTIR 4+ FTIR 3+ FTIR 2+ FTIR 1+

83
Hydrogen bonding and the coupling between transition dipoles are among
the most important factors governing conformational sensitivity of the amide
bands.100
The N-H stretch region, from 3200 cm-1 to 3500 cm-1, clearly shows
(Figure 50), that compared to the free molecules the band corresponding to the
two free N-H groups disappears, which means that all the N-H groups are bonded
either intra- or inter-molecularly. In fact, we should consider that while in the
SAMs the peptides are forced to organize close to each other. In this way, the free
N-H are conceivably involved in intermolecular interactions and thus the high-
frequency band disappears. This conclusion also implies that neighbor peptide
adsorbates should provide C=O groups that are already involved in intrachain
C=O···H-N hydrogen bonds. These three-center hydrogen bonds allow formation
of a strong interchain bonding network and, since for the plus series they are
embedded inside of the monolayer, they are largely unaffected by an increase of
the peptide length, as already observed for the corresponding 3D SAMs formed
on gold nanoclusters.83
The Amide A region also shows that as the peptide chain length increases
the frequency of the N-H stretch band of intramolecularly H-bonded peptides
decreases, which is a marker of the increase of peptide stiffness (see Figure 51).
As we discussed in the previous section, based on the work of Toniolo and
coworkers one can relate the percentage of intramolecular H-bonds of the 310-
helix type to the number of residues.100
We applied the same treatment to the trityl-protected thiolated peptides of
the plus series and could estimate that even with 1+ helicity is more than 70%,
eventually becoming 100% for the longest peptide. These data highlight the
outstanding efficiency of the Aib unit in stabilizing folded and helical species
even in very short peptides, but also explain the broadness of the IR bands, which
result from a combination of contributions from multiple conformations.83
Since the helicity percentage requires to compute a factor including the
integrated absorbance of the free N-H groups, this calculation cannot be applied to
the peptides in the SAM. On the other hand, the very fact that the peptide is inside
the monolayer implies less freedom degrees and thus the helix is expected to be
even stiffer than in solution. This is also known for simple alkanethiols, where the
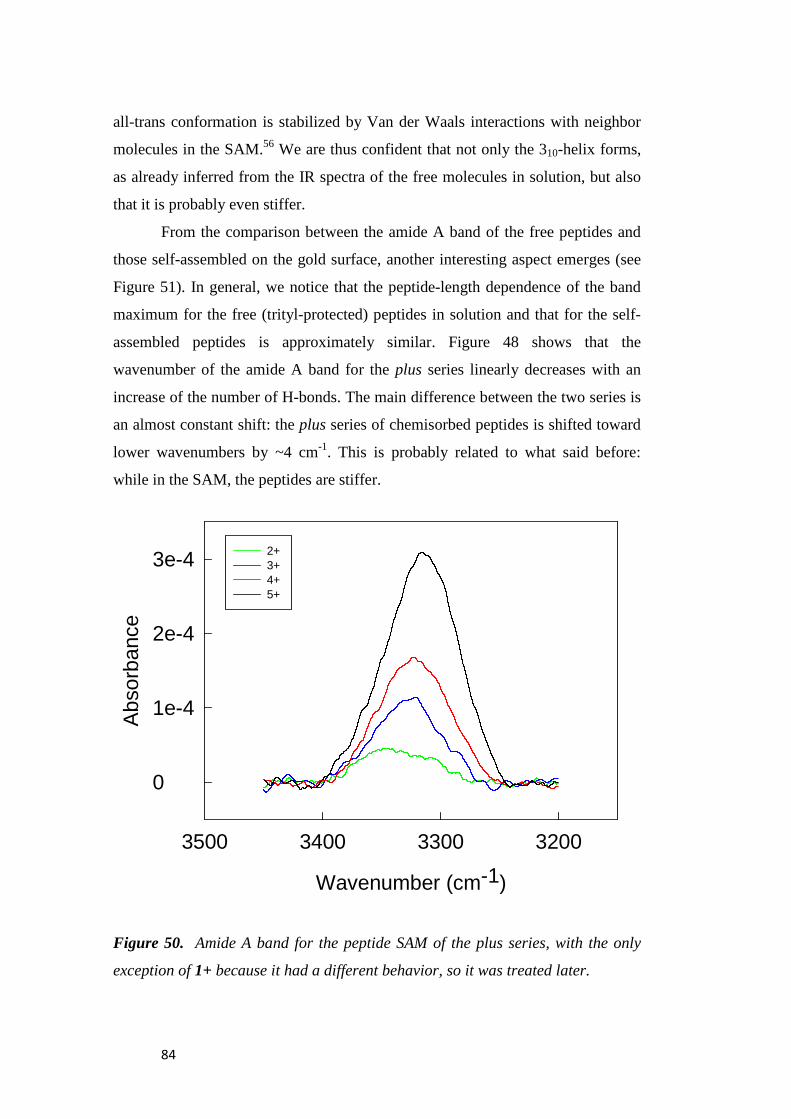
84
all-trans conformation is stabilized by Van der Waals interactions with neighbor
molecules in the SAM.56 We are thus confident that not only the 310-helix forms,
as already inferred from the IR spectra of the free molecules in solution, but also
that it is probably even stiffer.
From the comparison between the amide A band of the free peptides and
those self-assembled on the gold surface, another interesting aspect emerges (see
Figure 51). In general, we notice that the peptide-length dependence of the band
maximum for the free (trityl-protected) peptides in solution and that for the self-
assembled peptides is approximately similar. Figure 48 shows that the
wavenumber of the amide A band for the plus series linearly decreases with an
increase of the number of H-bonds. The main difference between the two series is
an almost constant shift: the plus series of chemisorbed peptides is shifted toward
lower wavenumbers by ~4 cm-1. This is probably related to what said before:
while in the SAM, the peptides are stiffer.
Figure 50. Amide A band for the peptide SAM of the plus series, with the only
exception of 1+ because it had a different behavior, so it was treated later.
Wavenumber (cm-1)
3200330034003500
Abs
orba
nce
0
1e-4
2e-4
3e-4 2+ 3+4+ 5+
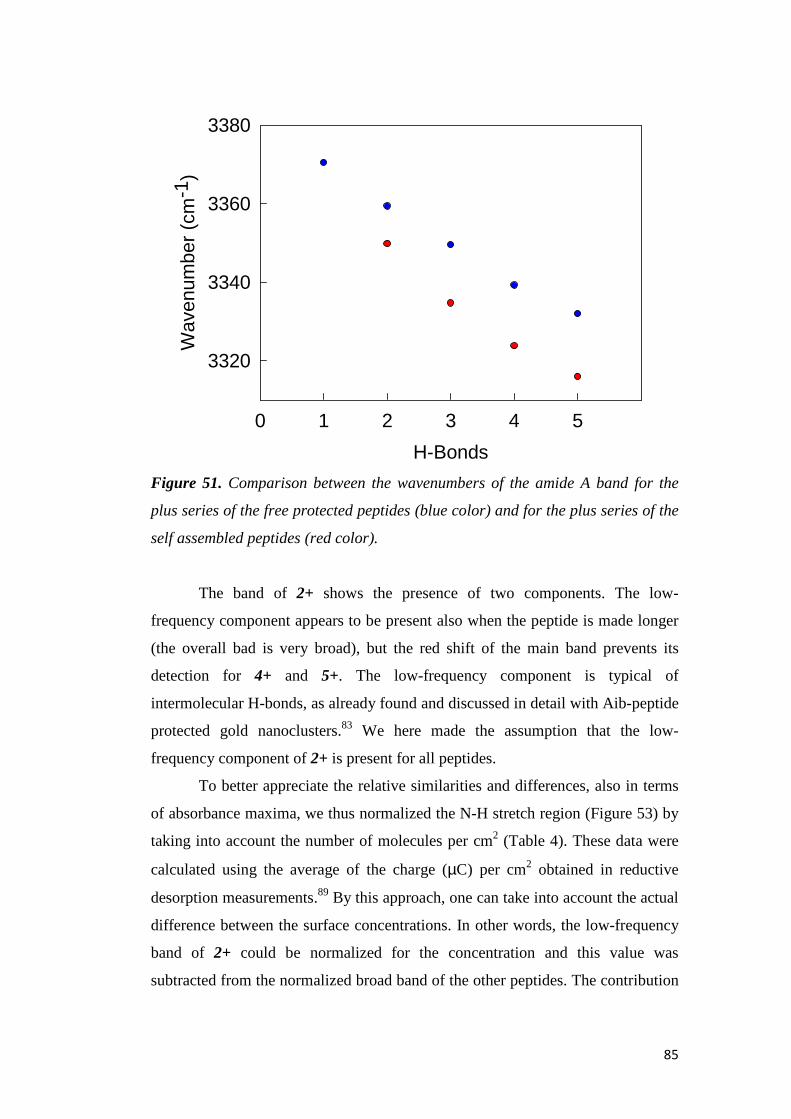
85
Figure 51. Comparison between the wavenumbers of the amide A band for the
plus series of the free protected peptides (blue color) and for the plus series of the
self assembled peptides (red color).
The band of 2+ shows the presence of two components. The low-
frequency component appears to be present also when the peptide is made longer
(the overall bad is very broad), but the red shift of the main band prevents its
detection for 4+ and 5+. The low-frequency component is typical of
intermolecular H-bonds, as already found and discussed in detail with Aib-peptide
protected gold nanoclusters.83 We here made the assumption that the low-
frequency component of 2+ is present for all peptides.
To better appreciate the relative similarities and differences, also in terms
of absorbance maxima, we thus normalized the N-H stretch region (Figure 53) by
taking into account the number of molecules per cm2 (Table 4). These data were
calculated using the average of the charge (µC) per cm2 obtained in reductive
desorption measurements.89 By this approach, one can take into account the actual
difference between the surface concentrations. In other words, the low-frequency
band of 2+ could be normalized for the concentration and this value was
subtracted from the normalized broad band of the other peptides. The contribution
H-Bonds
0 1 2 3 4 5
Wav
enum
ber
(cm
-1)
3320
3340
3360
3380
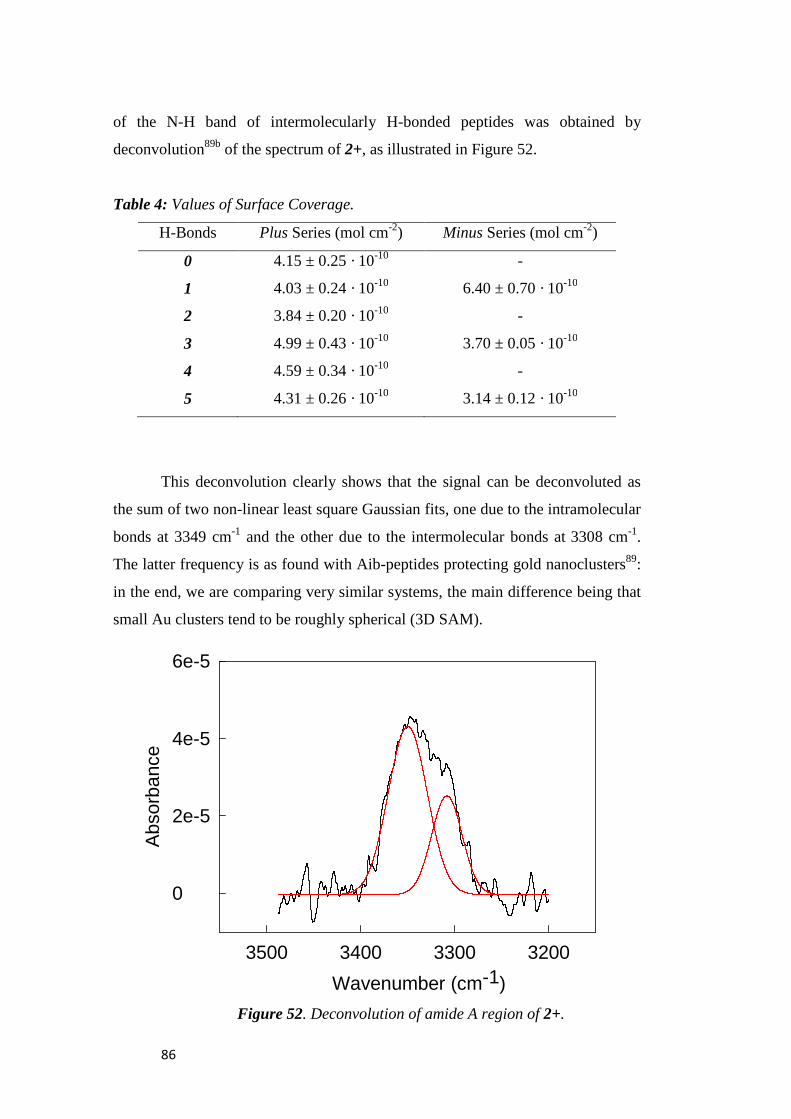
86
of the N-H band of intermolecularly H-bonded peptides was obtained by
deconvolution89b of the spectrum of 2+, as illustrated in Figure 52.
Table 4: Values of Surface Coverage.
H-Bonds Plus Series (mol cm-2) Minus Series (mol cm-2)
0 4.15 ± 0.25 · 10-10 -
1 4.03 ± 0.24 · 10-10 6.40 ± 0.70 · 10-10
2 3.84 ± 0.20 · 10-10 -
3 4.99 ± 0.43 · 10-10 3.70 ± 0.05 · 10-10
4 4.59 ± 0.34 · 10-10 -
5 4.31 ± 0.26 · 10-10 3.14 ± 0.12 · 10-10
This deconvolution clearly shows that the signal can be deconvoluted as
the sum of two non-linear least square Gaussian fits, one due to the intramolecular
bonds at 3349 cm-1 and the other due to the intermolecular bonds at 3308 cm-1.
The latter frequency is as found with Aib-peptides protecting gold nanoclusters89:
in the end, we are comparing very similar systems, the main difference being that
small Au clusters tend to be roughly spherical (3D SAM).
Figure 52. Deconvolution of amide A region of 2+.
Wavenumber (cm-1)
3200330034003500
Abs
orba
nce
0
2e-5
4e-5
6e-5
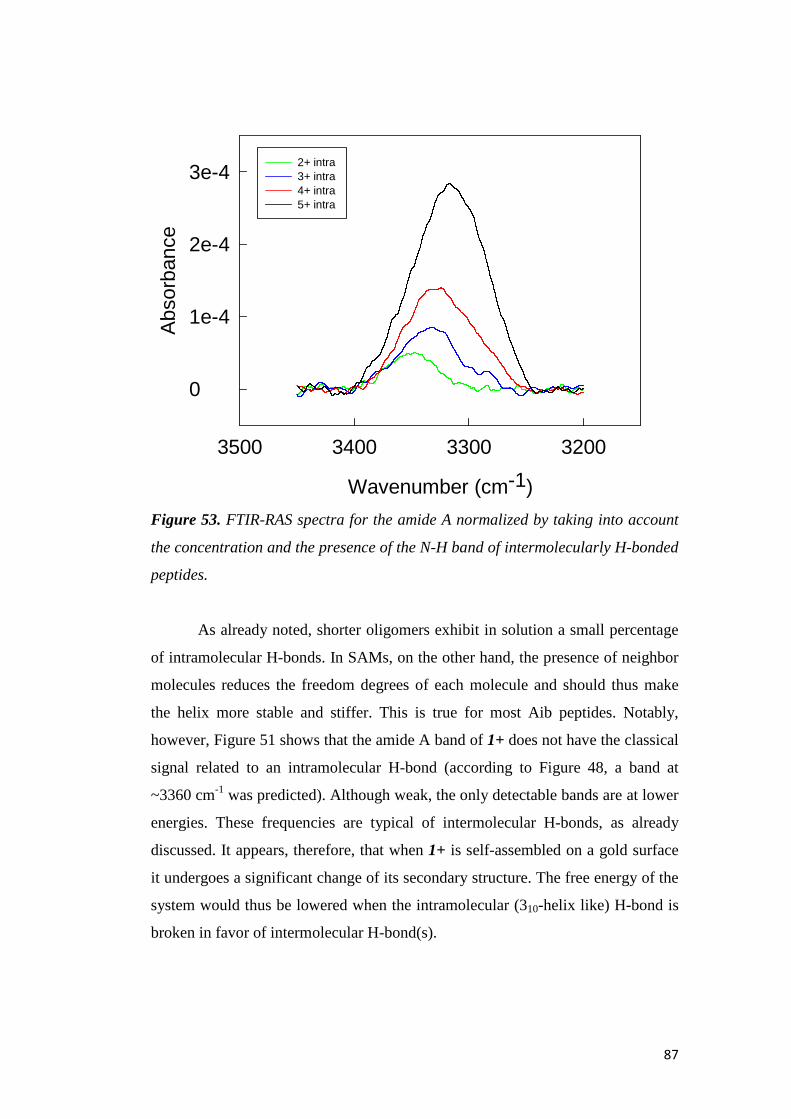
87
Figure 53. FTIR-RAS spectra for the amide A normalized by taking into account
the concentration and the presence of the N-H band of intermolecularly H-bonded
peptides.
As already noted, shorter oligomers exhibit in solution a small percentage
of intramolecular H-bonds. In SAMs, on the other hand, the presence of neighbor
molecules reduces the freedom degrees of each molecule and should thus make
the helix more stable and stiffer. This is true for most Aib peptides. Notably,
however, Figure 51 shows that the amide A band of 1+ does not have the classical
signal related to an intramolecular H-bond (according to Figure 48, a band at
~3360 cm-1 was predicted). Although weak, the only detectable bands are at lower
energies. These frequencies are typical of intermolecular H-bonds, as already
discussed. It appears, therefore, that when 1+ is self-assembled on a gold surface
it undergoes a significant change of its secondary structure. The free energy of the
system would thus be lowered when the intramolecular (310-helix like) H-bond is
broken in favor of intermolecular H-bond(s).
Wavenumber (cm-1)
3200330034003500
Abs
orba
nce
0
1e-4
2e-4
3e-42+ intra3+ intra4+ intra5+ intra
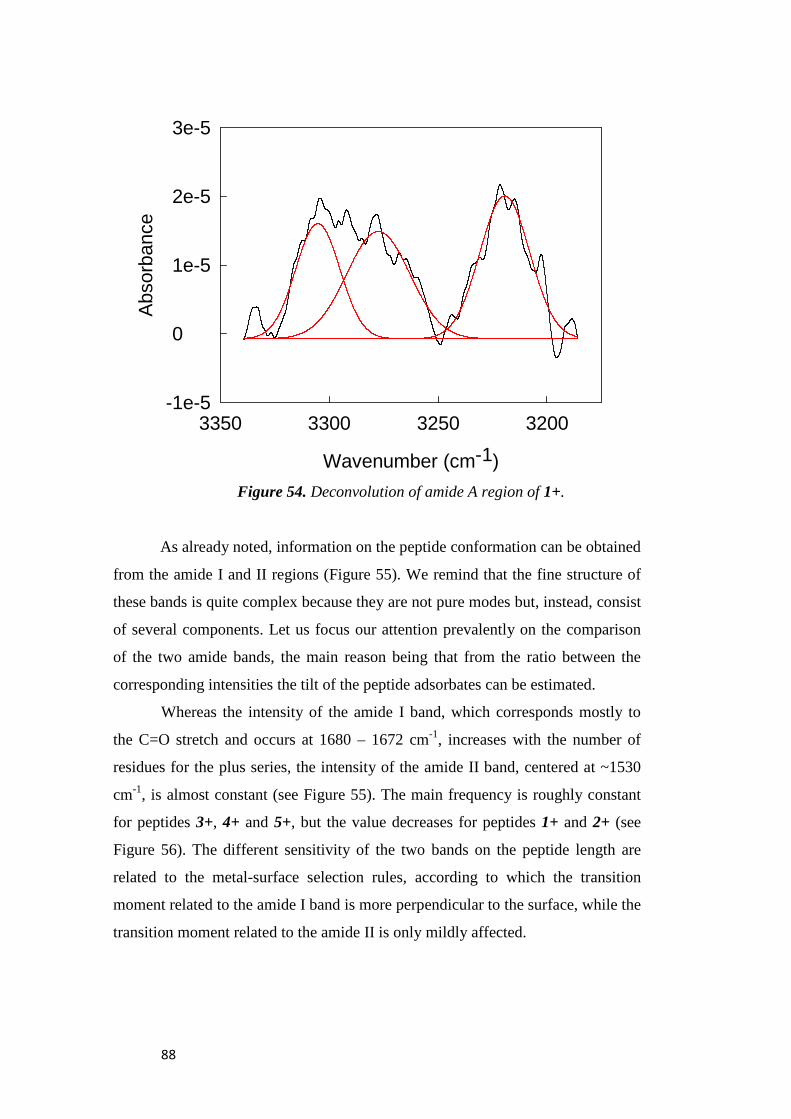
88
Figure 54. Deconvolution of amide A region of 1+.
As already noted, information on the peptide conformation can be obtained
from the amide I and II regions (Figure 55). We remind that the fine structure of
these bands is quite complex because they are not pure modes but, instead, consist
of several components. Let us focus our attention prevalently on the comparison
of the two amide bands, the main reason being that from the ratio between the
corresponding intensities the tilt of the peptide adsorbates can be estimated.
Whereas the intensity of the amide I band, which corresponds mostly to
the C=O stretch and occurs at 1680 – 1672 cm-1, increases with the number of
residues for the plus series, the intensity of the amide II band, centered at ~1530
cm-1, is almost constant (see Figure 55). The main frequency is roughly constant
for peptides 3+, 4+ and 5+, but the value decreases for peptides 1+ and 2+ (see
Figure 56). The different sensitivity of the two bands on the peptide length are
related to the metal-surface selection rules, according to which the transition
moment related to the amide I band is more perpendicular to the surface, while the
transition moment related to the amide II is only mildly affected.
Wavenumber (cm-1)
3200325033003350
Abs
orba
nce
-1e-5
0
1e-5
2e-5
3e-5
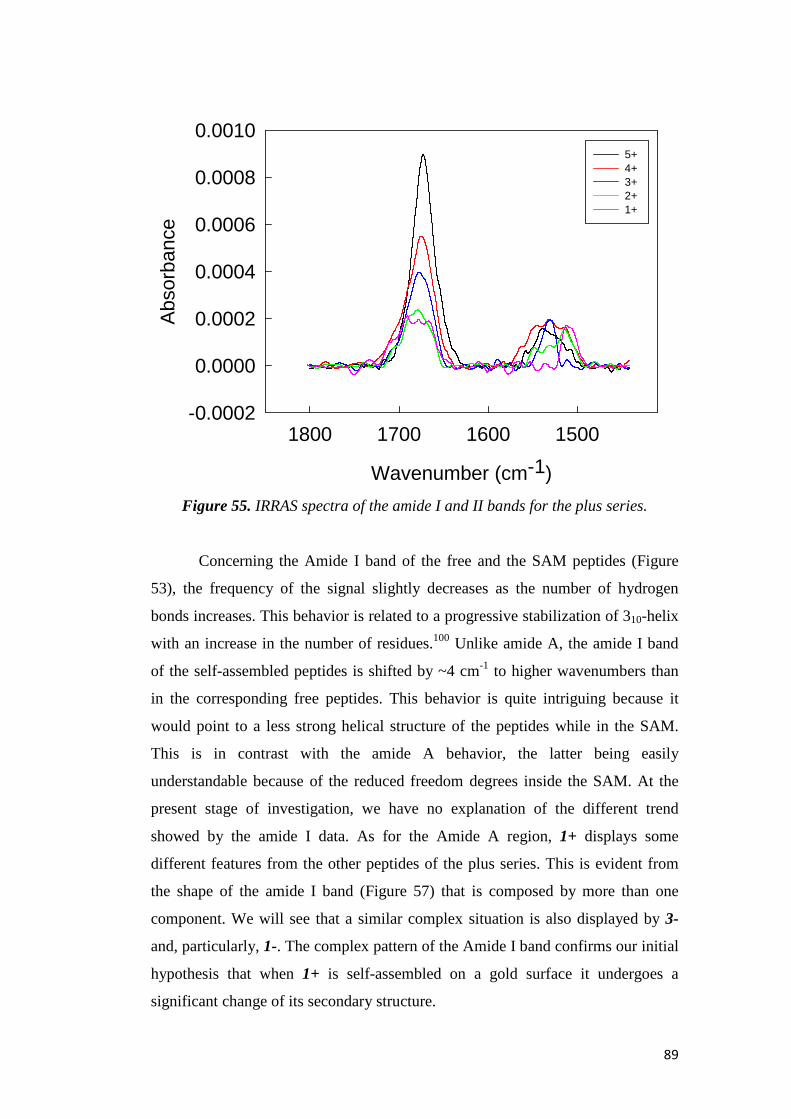
89
Figure 55. IRRAS spectra of the amide I and II bands for the plus series.
Concerning the Amide I band of the free and the SAM peptides (Figure
53), the frequency of the signal slightly decreases as the number of hydrogen
bonds increases. This behavior is related to a progressive stabilization of 310-helix
with an increase in the number of residues.100 Unlike amide A, the amide I band
of the self-assembled peptides is shifted by ~4 cm-1 to higher wavenumbers than
in the corresponding free peptides. This behavior is quite intriguing because it
would point to a less strong helical structure of the peptides while in the SAM.
This is in contrast with the amide A behavior, the latter being easily
understandable because of the reduced freedom degrees inside the SAM. At the
present stage of investigation, we have no explanation of the different trend
showed by the amide I data. As for the Amide A region, 1+ displays some
different features from the other peptides of the plus series. This is evident from
the shape of the amide I band (Figure 57) that is composed by more than one
component. We will see that a similar complex situation is also displayed by 3-
and, particularly, 1-. The complex pattern of the Amide I band confirms our initial
hypothesis that when 1+ is self-assembled on a gold surface it undergoes a
significant change of its secondary structure.
Wavenumber (cm-1)
1500160017001800
Abs
orba
nce
-0.0002
0.0000
0.0002
0.0004
0.0006
0.0008
0.00105+ 4+ 3+ 2+ 1+

90
Figure 55. Comparison between the wavenumbers of the amide II band for the
plus series of the free protected peptides (blue) and for the plus series of the self-
assembled peptides (red).
Figure 56. Comparison between the wavenumbers of the amide I band for the
plus series of the free protected peptides (blue color) and for the plus series of the
self assembled peptides (red color).
H-Bonds
0 1 2 3 4 5
Wav
enum
ber
(cm
-1)
1500
1510
1520
1530
1540
H-Bonds
0 1 2 3 4 5
Wav
enum
ber
(cm
-1)
1665
1670
1675
1680
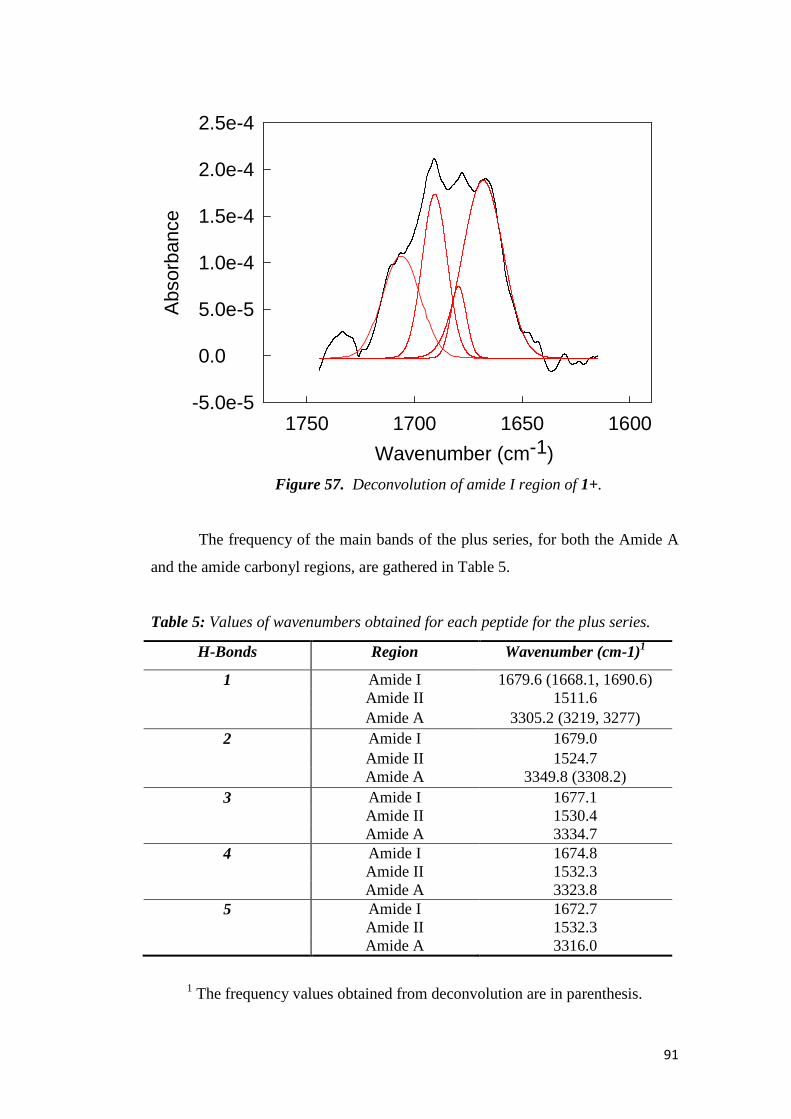
91
Figure 57. Deconvolution of amide I region of 1+.
The frequency of the main bands of the plus series, for both the Amide A
and the amide carbonyl regions, are gathered in Table 5.
Table 5: Values of wavenumbers obtained for each peptide for the plus series.
H-Bonds Region Wavenumber (cm-1)1
1 Amide I 1679.6 (1668.1, 1690.6) Amide II 1511.6 Amide A 3305.2 (3219, 3277)
2 Amide I 1679.0 Amide II 1524.7 Amide A 3349.8 (3308.2)
3 Amide I 1677.1 Amide II 1530.4 Amide A 3334.7
4 Amide I 1674.8 Amide II 1532.3 Amide A 3323.8
5 Amide I 1672.7 Amide II 1532.3 Amide A 3316.0
1 The frequency values obtained from deconvolution are in parenthesis.
Wavenumber (cm-1)
1600165017001750
Abs
orba
nce
-5.0e-5
0.0
5.0e-5
1.0e-4
1.5e-4
2.0e-4
2.5e-4

92
Minus Series:
Figure 58. The FTIR-RAS spectra for the minus series correspond (bottom to top)
to 1- (blue), 3- (red), and 5- (black).
We now focus on the minus series. This series consistently displays
absorbances significantly lower than those of the corresponding plus series. This
is related to both a lower surface concentration (see Table 5) and other factors, as
explained in the following.
The spectral region pertaining to the amide A band (Figure 59) shows that
1- has a high-energy band in the region of free N-H bonds, and both 1- and 3- do
not show the intramolecular band at the expected wavenumbers, but show a broad
band at lower energies that most likely corresponds to the stretch of
intermolecularly-bonded NH groups. We should mention, however, that for 3- this
behavior is less reproducible, as if for this peptide the SAM structure is very much
dependent on the preparation of the SAM. We believe (see below) that this is
related to this peptide being near the “transition” between forming 310-helices and
other, more intramolecularly H-bonded structures. For 5-, however, we observe a
Wavenumber (cm-1)
15002000250030003500
Abs
orba
nce
-2e-4
-1e-4
0
1e-4
2e-4
3e-4
4e-4
5e-4FTIR 5- FTIR 3- FTIR 1-
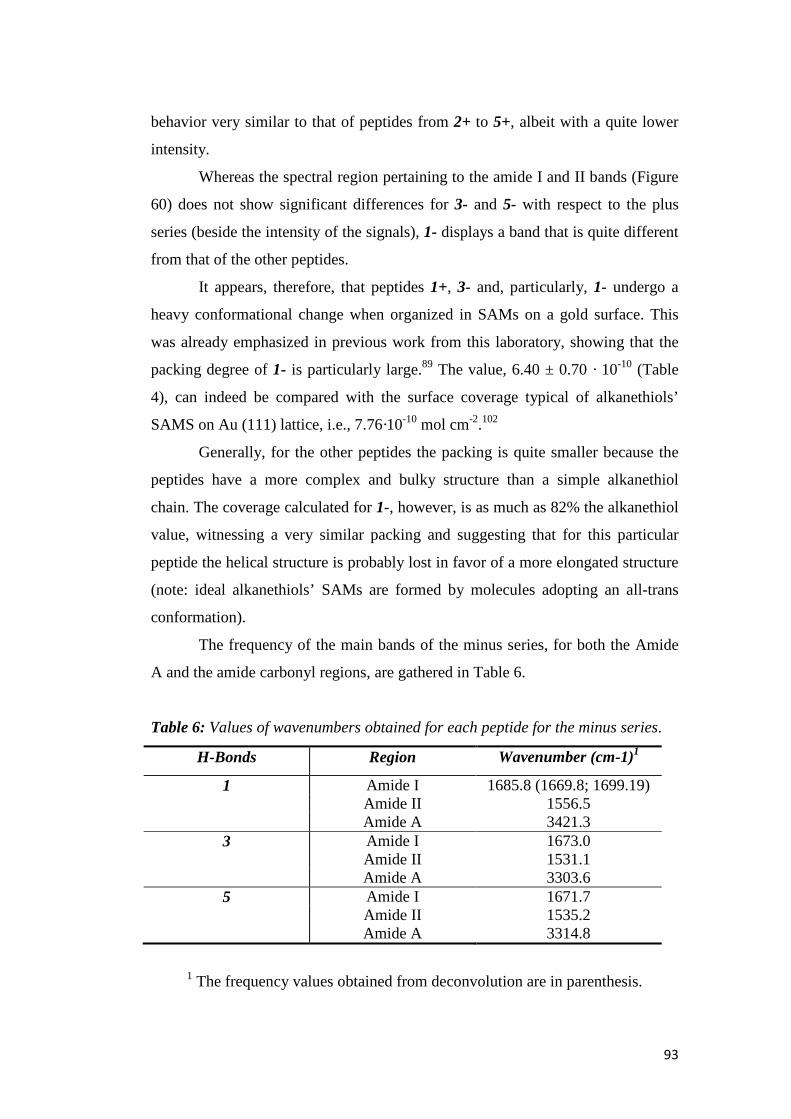
93
behavior very similar to that of peptides from 2+ to 5+, albeit with a quite lower
intensity.
Whereas the spectral region pertaining to the amide I and II bands (Figure
60) does not show significant differences for 3- and 5- with respect to the plus
series (beside the intensity of the signals), 1- displays a band that is quite different
from that of the other peptides.
It appears, therefore, that peptides 1+, 3- and, particularly, 1- undergo a
heavy conformational change when organized in SAMs on a gold surface. This
was already emphasized in previous work from this laboratory, showing that the
packing degree of 1- is particularly large.89 The value, 6.40 ± 0.70 · 10-10 (Table
4), can indeed be compared with the surface coverage typical of alkanethiols’
SAMS on Au (111) lattice, i.e., 7.76·10-10 mol cm-2.102
Generally, for the other peptides the packing is quite smaller because the
peptides have a more complex and bulky structure than a simple alkanethiol
chain. The coverage calculated for 1-, however, is as much as 82% the alkanethiol
value, witnessing a very similar packing and suggesting that for this particular
peptide the helical structure is probably lost in favor of a more elongated structure
(note: ideal alkanethiols’ SAMs are formed by molecules adopting an all-trans
conformation).
The frequency of the main bands of the minus series, for both the Amide
A and the amide carbonyl regions, are gathered in Table 6.
Table 6: Values of wavenumbers obtained for each peptide for the minus series.
H-Bonds Region Wavenumber (cm-1)1
1 Amide I 1685.8 (1669.8; 1699.19) Amide II 1556.5 Amide A 3421.3
3 Amide I 1673.0 Amide II 1531.1 Amide A 3303.6
5 Amide I 1671.7 Amide II 1535.2 Amide A 3314.8
1 The frequency values obtained from deconvolution are in parenthesis.
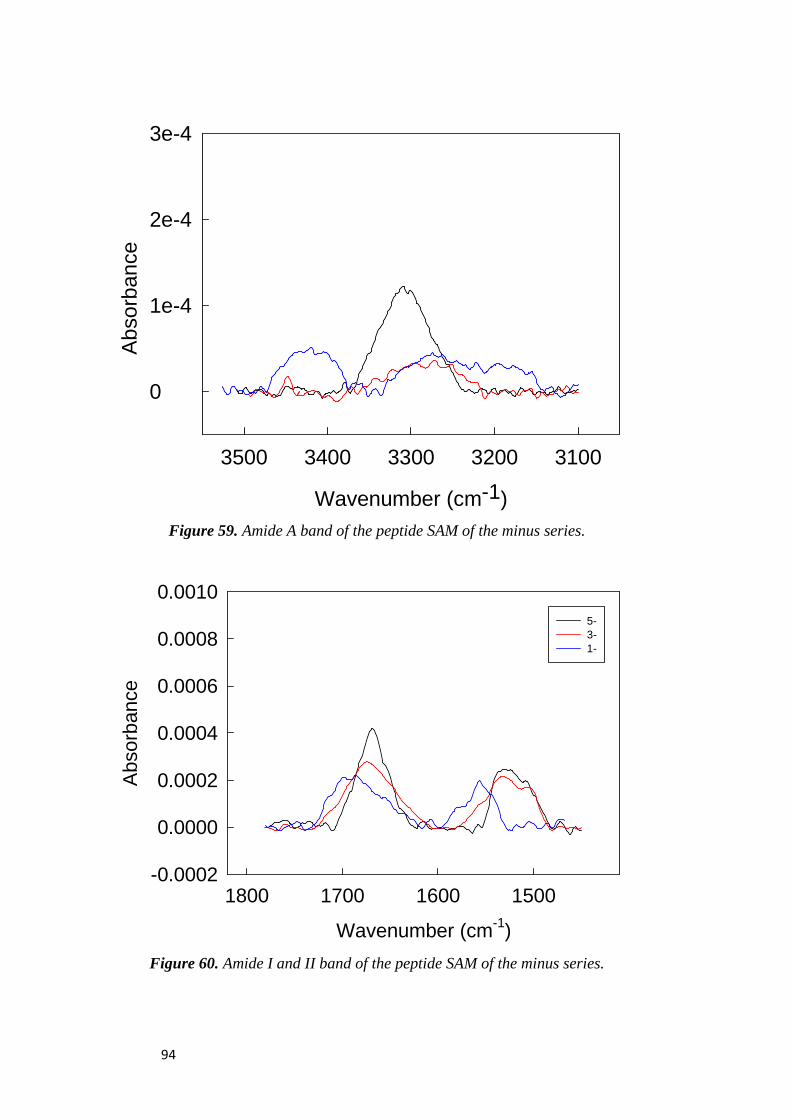
94
Figure 59. Amide A band of the peptide SAM of the minus series.
Figure 60. Amide I and II band of the peptide SAM of the minus series.
Wavenumber (cm-1)
31003200330034003500
Abs
orba
nce
0
1e-4
2e-4
3e-4
Wavenumber (cm-1)
1500160017001800
Abs
orba
nce
-0.0002
0.0000
0.0002
0.0004
0.0006
0.0008
0.00105-3-1-
95
Based on the IRRAS observations, we can thus conclude that while in the
SAM the plus series affords a more stable secondary structure than the minus
series. The shortest peptides give less stable 310-helices, probably preferring to
form intermolecular H-bonds. Disruption of the 310-helical structure is more
evident with the minus series.
3.2.4 Determination of the Orientation of the Absorbed
Molecules
The orientation of the absorbed molecules within the SAM is determined
by several factors such as the adsorbate−substrate binding strength, the geometry
of the binding site, the intermolecular interactions between the adsorbed
molecules, and the solvent−adsorbate interactions.103
As a result, the orientation of the peptide helix axis with respect to the
substrate's surface normal is better described as a distribution of values. An
orientation distribution function is thus necessary to interpret the IRRAS spectrum
and calculate the average tilt angle from band intensities. Thus, Samulsky and
coworkers104 employed a Gaussian orientation distribution function to infer the
peptide helix axis orientation in the SAM on gold. The helix axis orientation was
obtained by optimizing the agreement between theoretical values for the amide I
to amide II absorbance ratio, D (see equation 7), and the observed D value from
the IRRAS experiments.
Figure 61 shows the coordinate system that describes the interaction
between the polarized, incident IR electric field and the molecular transition
moment in the grazing angle IRRAS experiment. Due to the surface selection
rule105, the only active electric-field component of the incident light (n) is parallel
to the Z-axis of the laboratory system (X, Y, Z), the gold surface being in the
X−Y plane. The transition moment m (amide I or amide II band) is located in a
molecule (helix)-fixed frame (x, y, z) by its respective polar and azimuthal angles
(α, β). The x, y, z frame is oriented with the z-axis along the helix, and that axis is
located in the laboratory system by θ, and Φ. γ is the azimuthal angle about the

96
helix axis. Using the relations among the Euler a
is given by:
Figure 61. Coordinates of the laboratory (X, Y, Z) and molecular (x,
for a tilted peptide on gold surface.
The IRRAS absorption intensity,
uniform azimuthal distribution about the helix axis
over the interval [0, 2π]
The α-dependence is simultaneously averaged by this assumption for
the angles between the transition moment and the helix axis were determined to
be 39° for β1 (amide I band) and 75° for
A(θ), where θ describes the tilt angle between the helix axis and the surface
normal.
helix axis. Using the relations among the Euler angles106, the projection of
Coordinates of the laboratory (X, Y, Z) and molecular (x, y, z) systems
peptide on gold surface.
RAS absorption intensity, A, is proportional to |m·n|2. Assuming
uniform azimuthal distribution about the helix axisγ is uniformly distributed
Samulski found that
dependence is simultaneously averaged by this assumption for
the angles between the transition moment and the helix axis were determined to
(amide I band) and 75° for β2 (amide II band),107 A can be written as
describes the tilt angle between the helix axis and the surface
the projection of m on n
y, z) systems
. Assuming
is uniformly distributed
dependence is simultaneously averaged by this assumption for γ. As
the angles between the transition moment and the helix axis were determined to
A can be written as
describes the tilt angle between the helix axis and the surface
97
The observed IRRAS absorption intensity (Aobs) depends on the orientation
distribution of the helices in the film. Thus, Aobs is the weighted superposition of
contributions, A(θ) W(θ) dθ, where W(θ) is the normalized helix axis orientation
distribution function. Hence, we have
�5� ���� � � ���������� � � �|� · �|����������� �!
�!
Similarly, the average of any function X of the tilt angle of the helix axis
relative to the surface normal is
�6� �#� � � #����������� �!
The amide I to amide II absorbance ratio is
�7� % � & ����'����'' � & ( �|� · �|���' �������� �!( �|� · �|���''�������� �!
where K is the scaling factor that relates the intrinsic “oscillator strength” of the
amide I and amide II vibrational modes. K was determined to be 1.35 ± 2 from the
transmission FTIR spectrum of a peptide KBr pellet.104
The Gaussian orientation distribution function that was used to model the
helix axis orientation distribution is
�8� ���� � *�+�,- ./ 121� �� / �!��2 sin���
where N is the normalization constant:
�9� * � � �,- �! ./ 121� �� / �!��2 sin�������
98
Assuming the monolayer to be an ideal isotropic film with a uniplanar
distribution of helix axis confined to the gold substrate, θ results constant.
Therefore, the helix-axis orientational distribution is a delta function: W(θ) = δ(θ -
90°). This distribution is certainly reasonable for our monolayer.
The observed ratio of the amide I and amide II integrated intensities, Dobs =
A Iobs/A
IIobs, is thus calculated from the equation, for which we know W(θ) = δ(θ -
90°). Therefore, the orientation of the peptides adsorbed on the gold surface was
determined according to the following equation, assuming an isotropic monolayer:
�10� % � & ����'����'' � & �|89 · :|���|899 · :|�� � 1.35 �3 cos� � / 1��3 cos� ?+ / 1� � 2�3 cos� � / 1��3 cos� ?� / 1� � 2
�11� @% � A B%B�'A · @�' � A B%B�''A · @�'' � 1�'' · @�' � �'��''�� · @�''
A Iobs and AII
obs are the observed absorbances of amide I and amide II
bands, θ is the tilt angle of the helical axis, and β1 and β2 represent the angles
between the transition moment and the helix axis, those value were taken to be
39° and 75°, respectively.107
In order to take the maximum value of observed absorbance, we selected
the two zones of the spectrum where the amide I and amide II bands are present.
Then, we employed three different nonlinear regression analyses (the Gaussian,
the Pseudo-Voigt, and the Lorentzian fitting methods) to optimize the agreement
between the theoretical values for the amide I to amide II absorbance ratio, and
the observed D value from the IRRAS experiments. After several tests, we opted
for using only the Gaussian regression, which gave the best peaks. In some cases,
to find the best values of maximum absorbance, we also used a deconvolution,
and to calculate the corresponding error, we used the conventional linear
propagation:
�11� C � C! � D · �.�!.EFG�GH� IJ2
99
�12� @C � @C! � �.�!.EFG�GH� IJ2 · @D � KD�, / ,!���.�!.EFG�GH� IJ2LM N · @L� KD�, / ,!��.�!.EFG�GH� IJ2LM� N · @,!
Then, to calculate the tilt angle of each peptide and the corresponding
errors, we used the following equations, obtained from equation 10.
�13� � � DOPQR STU 2& / 2%% · �3 cos� ?� / 1� / �3 cos� ?+ / 1�& � 1V · 13W
�14� @� � YZ[/ 1\1 / U 2& / 2%% · �3 cos� ?� / 1� / �3 cos� ?+ / 1�& � 1V · 13
· 12 1\U 2& / 2%% · �3 cos� ?� / 1� / �3 cos� ?+ / 1�& � 1V · 13· 13 ] 2% · �3 cos� ?� / 1� / �3 cos� ?+ / 1�&/ �3 cos� ?� / 1��2& / 2%��% · �3 cos� ?� / 1� / �3 cos� ?+ / 1�&��^_ · @%
� YZ[/ 1\1 / U 2& / 2%% · �3 cos� ?� / 1� / �3 cos� ?+ / 1�& � 1V · 13
· 12 1\U 2& / 2%% · �3 cos� ?� / 1� / �3 cos� ?+ / 1�& � 1V · 13· 13 U 2% · �3 cos� ?� / 1� / �3 cos� ?+ / 1�&� &�2& / 2%��% · �3 cos� ?� / 1� / �3 cos� ?+ / 1�&��V_ · @&

100
From these calculations, we obtained the values shown in Table 7.
Table 7: Amide I to Amide II Absorbance Ratio and relative Tilt angle.
H-Bonds D = AI/AII Tilt Angle θθθθ (degrees)
1+ 1.16 54.7 2+ 1.68 49.5 3+ 2.06 44.6 4+ 2.80 37.9 5+ 5.90 22.4
1- 1.20 57.8 3- 1.25 56.7 5- 1.38 54.2
Of course, all these data rely on a series of assumptions. First, we assume
of having a monatomically smooth Au(111) surface and that there is no surface
roughness (i.e., an angular spread resulting from a less-than-flat surface that
should be convolved with the angular distribution of the helix axes). This is a
significant assumption as the IR beam size is macroscopic in areal dimensions and
it is doubtful that a uniform surface (other than a single crystal) describes such a
large area. On the other hand, in the Experimental section we stressed that the
freshly annealed surface is mostly a (111) surface and the roughness factor is
close to 1, being 1.16 ± 0.08. Second, we assume that the SAM is isotropic and
defect-free, and this is something that is obviously not true as thoroughly
commented upon in the introducing chapter. Finally, how well is the helix axis
defined? At the polypeptide-air interface, for example, we expect some dynamic
behaviour that introduces some uncertainty about the definition of the helix axis
itself. That the helices are stable is true for the longest peptides of the plus and
minus series, but it is not completely valid for shorter peptides, particularly those
of the minus series. For these peptides, 1θ and 2θ may thus be slightly different.
Because of these assumptions, we consider that an error of at least ±5° is more
reasonable than that of ±1° deriving from our calculations. Figure 63 shows that
the long peptides of the plus series are less tilted than shorter ones.
We should stress that the figure also includes 1+ and 1-, although the error
on the determination of their amide II intensity indicates that the calculated tilt
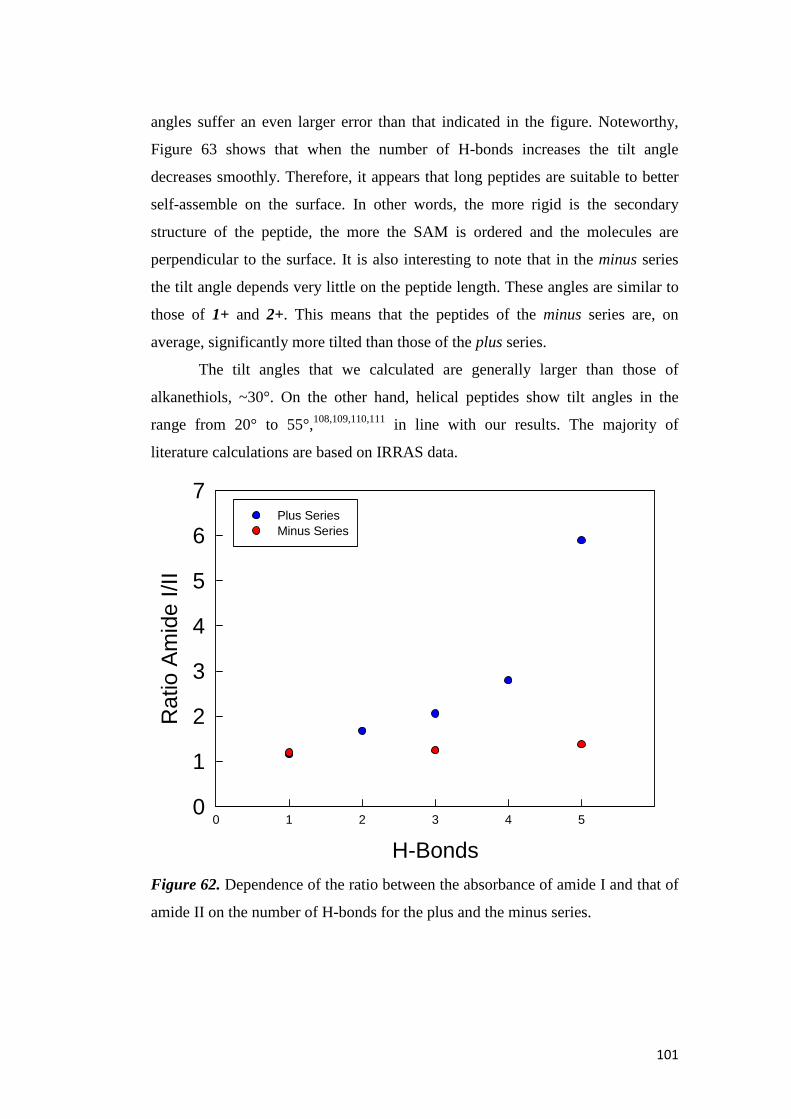
101
angles suffer an even larger error than that indicated in the figure. Noteworthy,
Figure 63 shows that when the number of H-bonds increases the tilt angle
decreases smoothly. Therefore, it appears that long peptides are suitable to better
self-assemble on the surface. In other words, the more rigid is the secondary
structure of the peptide, the more the SAM is ordered and the molecules are
perpendicular to the surface. It is also interesting to note that in the minus series
the tilt angle depends very little on the peptide length. These angles are similar to
those of 1+ and 2+. This means that the peptides of the minus series are, on
average, significantly more tilted than those of the plus series.
The tilt angles that we calculated are generally larger than those of
alkanethiols, ~30°. On the other hand, helical peptides show tilt angles in the
range from 20° to 55°,108,109,110,111 in line with our results. The majority of
literature calculations are based on IRRAS data.
Figure 62. Dependence of the ratio between the absorbance of amide I and that of
amide II on the number of H-bonds for the plus and the minus series.
H-Bonds
0 1 2 3 4 5
Rat
io A
mid
e I/I
I
0
1
2
3
4
5
6
7Plus Series Minus Series
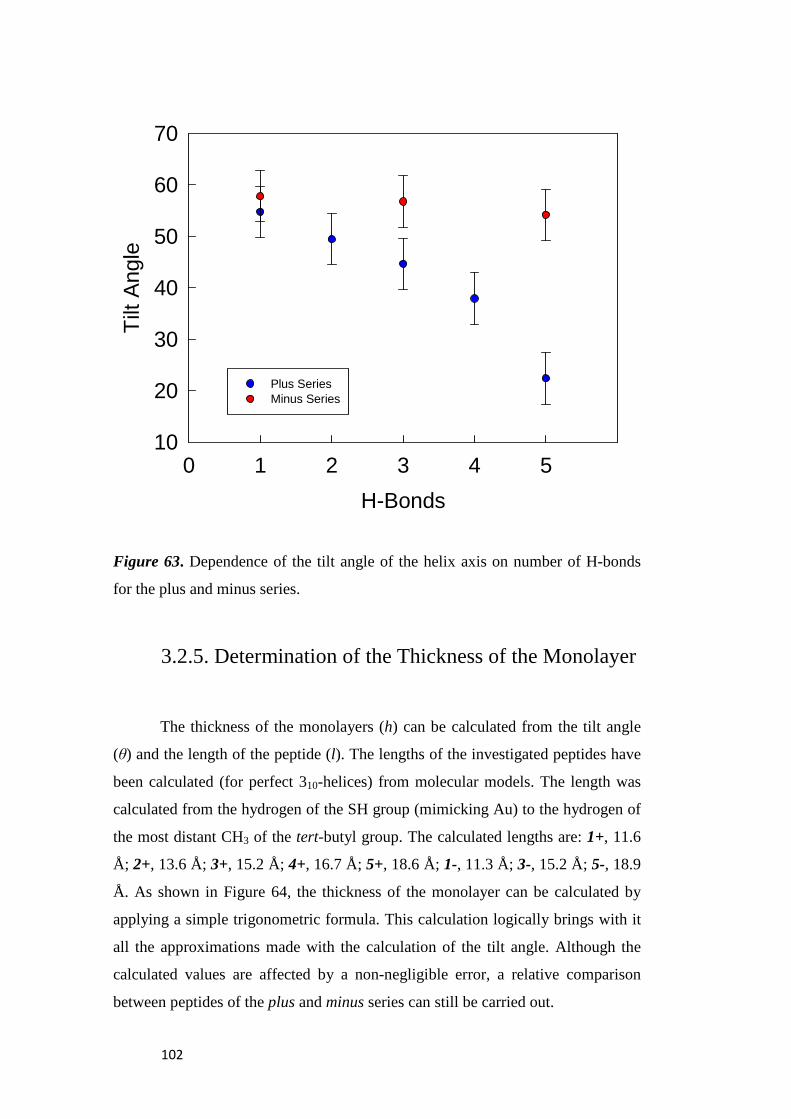
102
Figure 63. Dependence of the tilt angle of the helix axis on number of H-bonds
for the plus and minus series.
3.2.5. Determination of the Thickness of the Monolayer
The thickness of the monolayers (h) can be calculated from the tilt angle
(θ) and the length of the peptide (l). The lengths of the investigated peptides have
been calculated (for perfect 310-helices) from molecular models. The length was
calculated from the hydrogen of the SH group (mimicking Au) to the hydrogen of
the most distant CH3 of the tert-butyl group. The calculated lengths are: 1+, 11.6
Å; 2+, 13.6 Å; 3+, 15.2 Å; 4+, 16.7 Å; 5+, 18.6 Å; 1-, 11.3 Å; 3-, 15.2 Å; 5-, 18.9
Å. As shown in Figure 64, the thickness of the monolayer can be calculated by
applying a simple trigonometric formula. This calculation logically brings with it
all the approximations made with the calculation of the tilt angle. Although the
calculated values are affected by a non-negligible error, a relative comparison
between peptides of the plus and minus series can still be carried out.
H-Bonds
0 1 2 3 4 5
Tilt
Ang
le
10
20
30
40
50
60
70
Plus SeriesMinus Series
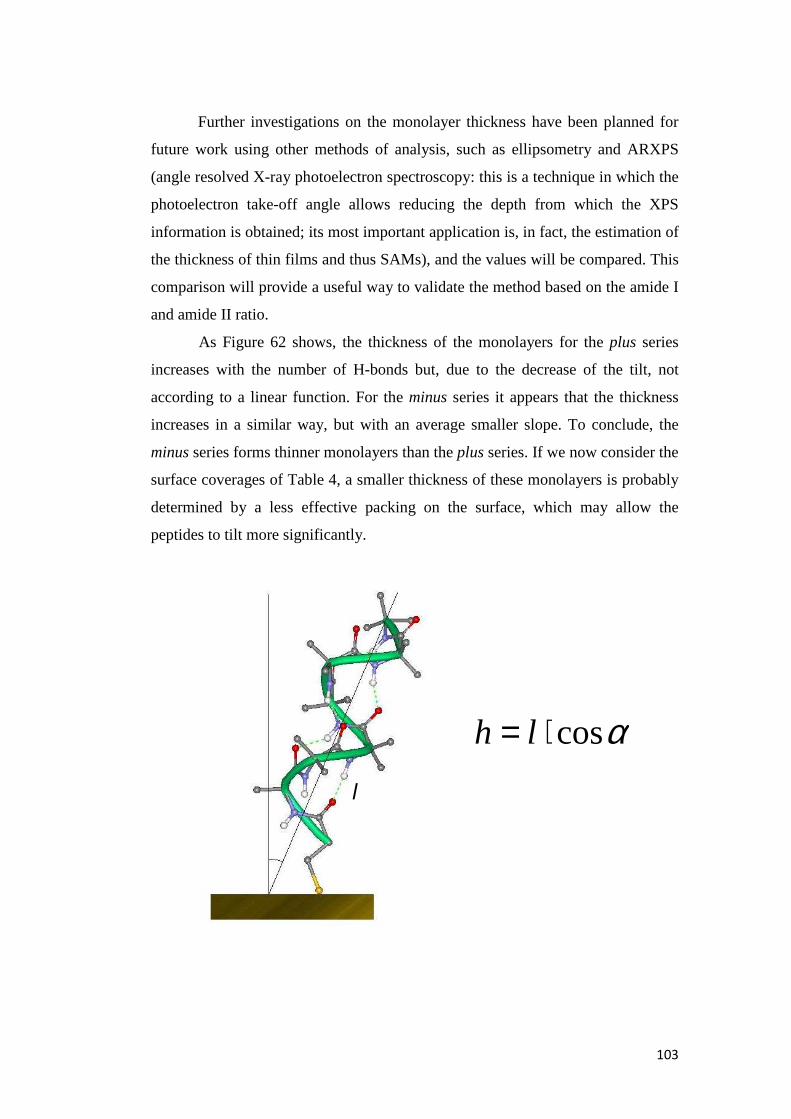
103
Further investigations on the monolayer thickness have been planned for
future work using other methods of analysis, such as ellipsometry and ARXPS
(angle resolved X-ray photoelectron spectroscopy: this is a technique in which the
photoelectron take-off angle allows reducing the depth from which the XPS
information is obtained; its most important application is, in fact, the estimation of
the thickness of thin films and thus SAMs), and the values will be compared. This
comparison will provide a useful way to validate the method based on the amide I
and amide II ratio.
As Figure 62 shows, the thickness of the monolayers for the plus series
increases with the number of H-bonds but, due to the decrease of the tilt, not
according to a linear function. For the minus series it appears that the thickness
increases in a similar way, but with an average smaller slope. To conclude, the
minus series forms thinner monolayers than the plus series. If we now consider the
surface coverages of Table 4, a smaller thickness of these monolayers is probably
determined by a less effective packing on the surface, which may allow the
peptides to tilt more significantly.
l
αcos⋅= lh
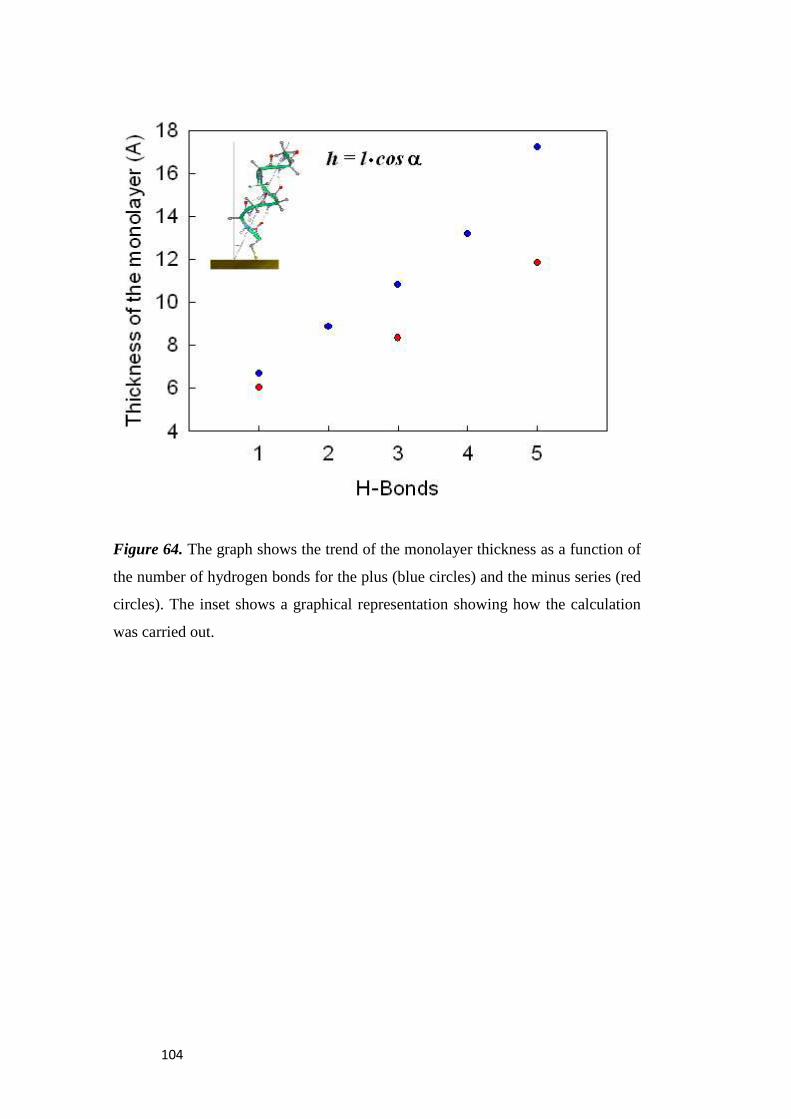
104
Figure 64. The graph shows the trend of the monolayer thickness as a function of
the number of hydrogen bonds for the plus (blue circles) and the minus series (red
circles). The inset shows a graphical representation showing how the calculation
was carried out.
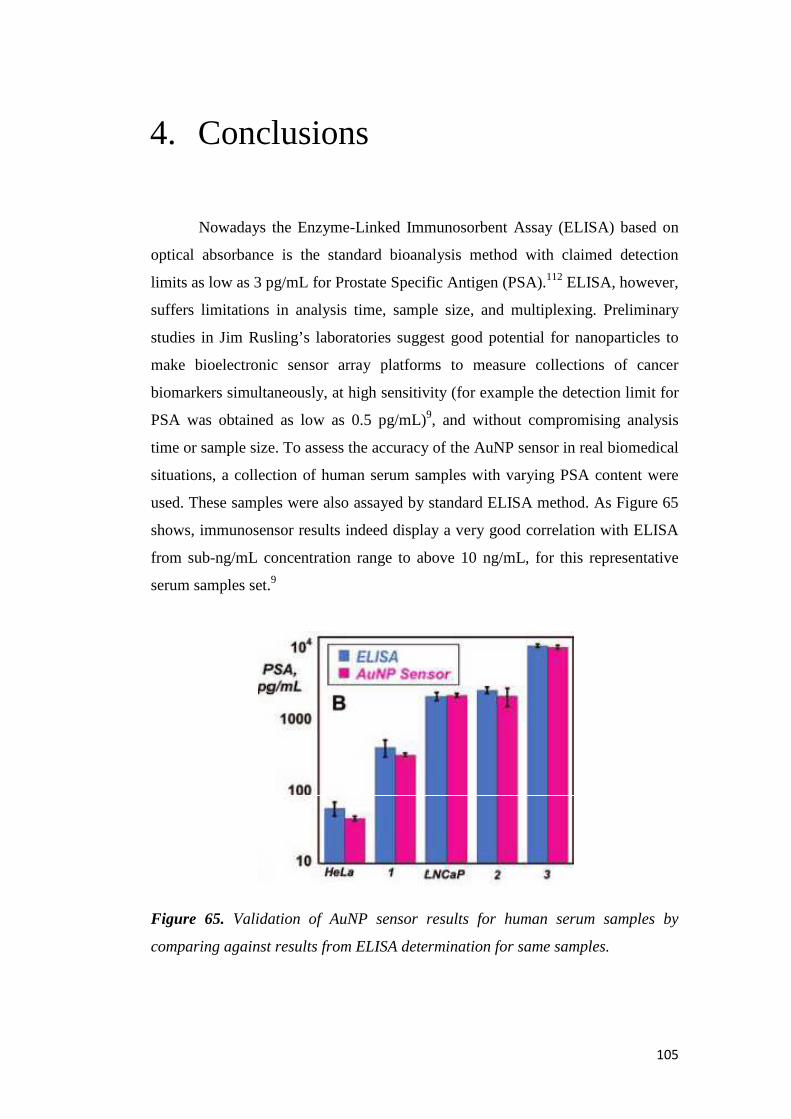
105
4. Conclusions
Nowadays the Enzyme-Linked Immunosorbent Assay (ELISA) based on
optical absorbance is the standard bioanalysis method with claimed detection
limits as low as 3 pg/mL for Prostate Specific Antigen (PSA).112 ELISA, however,
suffers limitations in analysis time, sample size, and multiplexing. Preliminary
studies in Jim Rusling’s laboratories suggest good potential for nanoparticles to
make bioelectronic sensor array platforms to measure collections of cancer
biomarkers simultaneously, at high sensitivity (for example the detection limit for
PSA was obtained as low as 0.5 pg/mL)9, and without compromising analysis
time or sample size. To assess the accuracy of the AuNP sensor in real biomedical
situations, a collection of human serum samples with varying PSA content were
used. These samples were also assayed by standard ELISA method. As Figure 65
shows, immunosensor results indeed display a very good correlation with ELISA
from sub-ng/mL concentration range to above 10 ng/mL, for this representative
serum samples set.9
Figure 65. Validation of AuNP sensor results for human serum samples by
comparing against results from ELISA determination for same samples.

106
It was thus demonstrated that the AuNP platform is competitive with other
state-of-the-art approaches in terms of both sensitivity and detection limit in real
samples, and may prove to have marked economic advantages in future array
fabrication. On these grounds, we employed this kind of electrochemical
immunosensor to a new biomarker that may be involved in carcinogenesis of
cervix and progression of cervical carcinoma. We should stress, in fact, that
nowadays researchers still do not know the detection limit of this particular
biomarker; similarly, the difference of concentration between healthy individuals
and patients with cancer is still unknown.
Since we did not know the range of the expression of the Nanog
biomarker, we started by adopting the same approach that was previously adopted
for the PSA biomarker.9 Step by step, we optimized the experimental conditions
by changing the concentrations of the several solutions used for preparing the
immunosensor. Inhibition of non-specific binding of labeled detection antibodies
was the most crucial step, because if the concentration of BSA was too high the
signal was annihilated, but if the concentration was too low the signal was not
reproducible.
Since a significant number of biomarkers have normal levels in the low
pg/mL range, we aimed at reaching sensitivity in this concentration range in order
to make a sensor capable of measuring both normal (= low) concentrations
representative of cancer-free patients and elevated levels indicative of cancer.
Therefore, we implemented our immunosensor using StrMPs-bioAb2-bioHRP that
conferred the best sensitivity and the best detection limit, due to the high number
of labels on each magnetic bead. In fact, as demonstrated in the Results and
Discussion, we obtained a calibration plot that shows high sensitivity, good
reproducibility and the low detection limit of 0.1 pg/mL; this will allow the study
of serum samples from both healthy individuals and patients with cervical
carcinoma. Integrating the electrochemical biosensor into a purposely designed
electrochemical microfluidics device proved to be a very promising strategy to
improve the sensor further. We believe that, after standardization of the method,
this immunosensor should be readily adaptable to measure Nanog biomarker
expression in real patients, for point-of-care early detection and monitoring of
cancer disease.
107
We also carried out an investigation of the properties of two series of
peptide SAMs in order to check their potential as possible templates for building
the above biosensor/s. In a well-performing electrochemical biosensor, the control
of the ET through the monolayer is of paramount importance. The ET behavior is
dictated by the properties of the SAM in terms of electron tunneling and quality of
the SAM itself. Aib-homopeptides were chosen for their peculiar properties to
form stable and robust 310-helices even for short oligomers. For these systems, the
ET rate is favored by the stiffness of the secondary structure, which in turn is
associated with the presence of an extended network of intramolecular H-bonds.
Two series of thiolated Aib-homopeptides were studied: a plus series with the
positive pole of the dipole moment on the sulfur side and a minus series whose
dipole moment is reversed. In each series the number of residues was varied. For
the plus series, the number of residues was varies from 1 to 6, allowing to study
the effect of having from 0 to 5 intramolecular H-bonds (according to the 310-
helix). For the minus series we focused on peptides with 1, 3, and 5 H-bonds.
The structure and the stability of the secondary structure of the adsorbed
peptides while in the SAMs were studied by IRRAS spectroscopy. We observed
differences as a function of both the peptide length and orientation. The data
showed that stable 310-helices form for most peptides, while for the shortest
peptides competition between intra- and intermolecular H-bonds makes things
more complex. In general, we found that when peptides are organized in the
SAM, a wide network of lateral interaction is established, which contributes to
increase the stability of the SAM itself and strengthens the secondary structure of
the SAM constituents. This is particularly true for the plus series that proved to be
slightly more stable, as helices, than the corresponding series of free peptides in
solution.
Complementary information on the organization of the SAM was gathered
by calculation of the tilt angle. We found that the plus series gives SAMs with
more vertically oriented molecules and thus thicker SAMs than for the minus
series. It thus appears that the reversed dipole moment of the minus series is
somehow slightly destabilizing the structure of the SAM relative to the plus
series. Because of this destabilization, the peptides of the minus series prefer to
108
adopt a more pronounced tilt angle with respect to the surface normal. With 1- the
310-helical structure is totally modified (or even lost) in favor of later interactions.
From our study, we conclude that long peptides of the plus series are liable
to provide the most stable and ordered monolayers, whereas shorter peptides form
SAMs that are less stable and more prone to defects. This evidence, together with
the excellent ET properties of the long peptides of the plus series,89 thus suggests
that sufficiently long peptides of the plus series may provide a particularly
convenient support for the construction of efficient electrochemical biosensors.
This Thesis was made possible by the collaboration (and friendship)
between my supervisor, Prof. Flavio Maran, and co-supervisor, Prof. Jim Rusling.
The research proceeded smoothly and although some aspects are still waiting to
be addressed, the general outcome of the two related topics was as all of us hoped.
New challenges are, however, around the corner. To improve the efficiency of the
biosensor, we are about to optimize the immunosensor by changing some
elements of the transducer, particularly by using Aib-peptide SAMs which should
lead to very fast electrode kinetics. We are also investigating the possibility of
increasing the active surface of the electrode substrate, for example by using
nanostructured gold electrodes113 as an alternative to a bed of AuNPs. Some
attempts in this direction have been carried out, but this an aspect that for time
limitations of this Thesis could not be covered.
109
5. References
[1] McNaught, A. D.; Wilkinson, A.; Compendium of Chemical Terminology,
2nd ed.; Blackwell Scientific Pubblications, Oxford, 1997.
[2] Wang, J.; Glucose Biosensors: 40 years of advances challenges
Electroanalysis, 2001, 13, 983-988.
[3] Turner, A. P. F.; Karube, I.; Wilson, G. S.; Biosensors: Fundamentals and
Applications, Oxford University Press, 1987.
[4] Bashir, D. R.; Ferrari, M.; Wereley, S.; Biomolecular sensing, processing
and analysis, Springer, 1987.
[5] Chaki, N. K.; Vijayamohanan, K.; Biosensors and Bioelectronics, 2002,
17, 1-12.
[6] Koncki, R.; Anal. Chim. Acta, 2007, 599(1), 7-15.
[7] Ligler, F. S.; Anal. Chem., 2009, 81(2), 519-26.
[8] Ramanathan, K.; Danielsson, B.; Biosensor Bioelectron., 2001, 16(6), 417-
23.
[9] Mani, W.; Chikkaveeraiah, B. V.; Patel, V.; Gutkind, J. S.; Rusling, J. F.;
ACSNano, 2009, 3(3), 585-594.
[10] Pui-yee, C. C.; Cheung, C. Y.; Renneberg, R.; Seydack, M.; Biochem.
Engin./Biotechnol., 2008, 109, 123-154.
[11] Pober, J. S.; Lichtman, A. H.; Abbas, A. K.; Immunologia cellulare e
molecolare, 2002, XI-596 p., 4th Ed., Piccin-Nuova Libraria.
[12] Ambrosi, A.; Castañeda, M. T.; Killard, A. J.; Smyth, M. R.; Alegret, S.;
Merkoçi, A.; Anal. Chem., 2007, 79(14), 5232-40.
[13] De la Encosura-Muñiz, A. ; Maltez-da Costa, M.; Merkoçi, A.; Biosensors
and Bioelectronics, 2009, 24, 2475-2482.
[14] Chikkaveeraiah, B. V.; Liu, H; Mani V.; Papadimitrakopoulos, F.;
Rusling, J. F. Electrochemistry Communications, 2009, 11, 819-822.
[15] Ye, F.; Zhou, C.; Cheng, Q.; Shen, J.; Chen, H.; BioMed Central Cancer,
2008, 8:108.
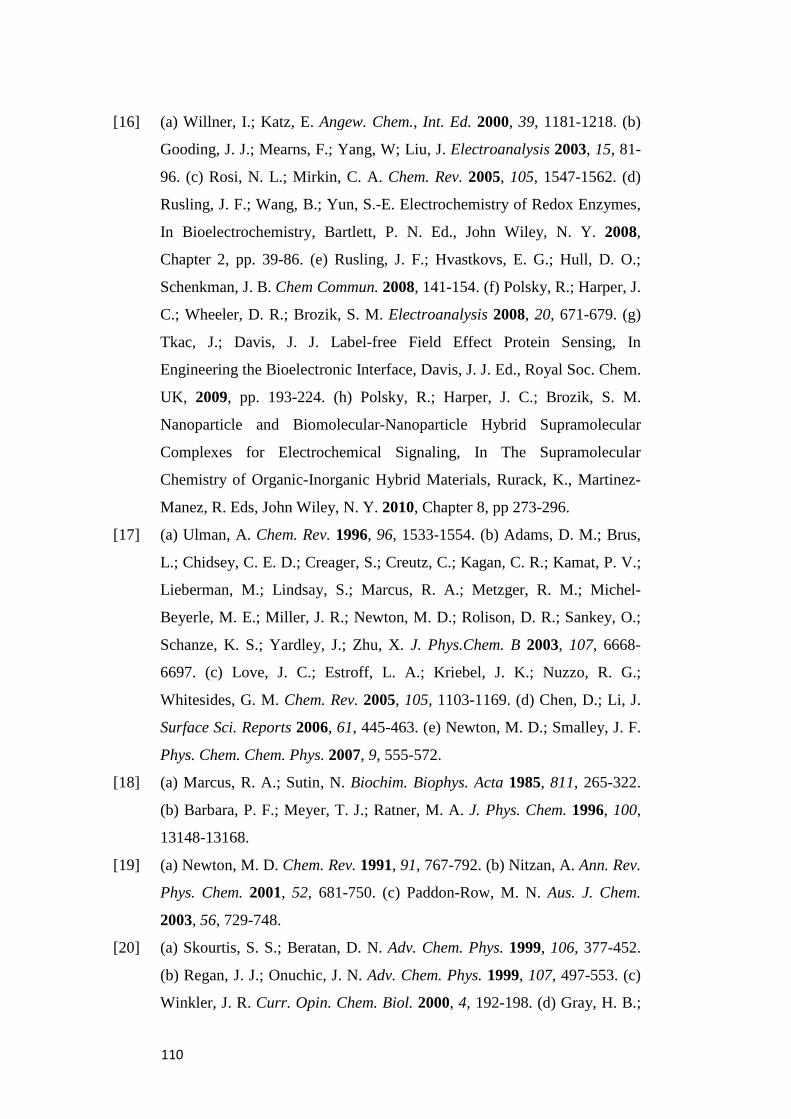
110
[16] (a) Willner, I.; Katz, E. Angew. Chem., Int. Ed. 2000, 39, 1181-1218. (b)
Gooding, J. J.; Mearns, F.; Yang, W; Liu, J. Electroanalysis 2003, 15, 81-
96. (c) Rosi, N. L.; Mirkin, C. A. Chem. Rev. 2005, 105, 1547-1562. (d)
Rusling, J. F.; Wang, B.; Yun, S.-E. Electrochemistry of Redox Enzymes,
In Bioelectrochemistry, Bartlett, P. N. Ed., John Wiley, N. Y. 2008,
Chapter 2, pp. 39-86. (e) Rusling, J. F.; Hvastkovs, E. G.; Hull, D. O.;
Schenkman, J. B. Chem Commun. 2008, 141-154. (f) Polsky, R.; Harper, J.
C.; Wheeler, D. R.; Brozik, S. M. Electroanalysis 2008, 20, 671-679. (g)
Tkac, J.; Davis, J. J. Label-free Field Effect Protein Sensing, In
Engineering the Bioelectronic Interface, Davis, J. J. Ed., Royal Soc. Chem.
UK, 2009, pp. 193-224. (h) Polsky, R.; Harper, J. C.; Brozik, S. M.
Nanoparticle and Biomolecular-Nanoparticle Hybrid Supramolecular
Complexes for Electrochemical Signaling, In The Supramolecular
Chemistry of Organic-Inorganic Hybrid Materials, Rurack, K., Martinez-
Manez, R. Eds, John Wiley, N. Y. 2010, Chapter 8, pp 273-296.
[17] (a) Ulman, A. Chem. Rev. 1996, 96, 1533-1554. (b) Adams, D. M.; Brus,
L.; Chidsey, C. E. D.; Creager, S.; Creutz, C.; Kagan, C. R.; Kamat, P. V.;
Lieberman, M.; Lindsay, S.; Marcus, R. A.; Metzger, R. M.; Michel-
Beyerle, M. E.; Miller, J. R.; Newton, M. D.; Rolison, D. R.; Sankey, O.;
Schanze, K. S.; Yardley, J.; Zhu, X. J. Phys.Chem. B 2003, 107, 6668-
6697. (c) Love, J. C.; Estroff, L. A.; Kriebel, J. K.; Nuzzo, R. G.;
Whitesides, G. M. Chem. Rev. 2005, 105, 1103-1169. (d) Chen, D.; Li, J.
Surface Sci. Reports 2006, 61, 445-463. (e) Newton, M. D.; Smalley, J. F.
Phys. Chem. Chem. Phys. 2007, 9, 555-572.
[18] (a) Marcus, R. A.; Sutin, N. Biochim. Biophys. Acta 1985, 811, 265-322.
(b) Barbara, P. F.; Meyer, T. J.; Ratner, M. A. J. Phys. Chem. 1996, 100,
13148-13168.
[19] (a) Newton, M. D. Chem. Rev. 1991, 91, 767-792. (b) Nitzan, A. Ann. Rev.
Phys. Chem. 2001, 52, 681-750. (c) Paddon-Row, M. N. Aus. J. Chem.
2003, 56, 729-748.
[20] (a) Skourtis, S. S.; Beratan, D. N. Adv. Chem. Phys. 1999, 106, 377-452.
(b) Regan, J. J.; Onuchic, J. N. Adv. Chem. Phys. 1999, 107, 497-553. (c)
Winkler, J. R. Curr. Opin. Chem. Biol. 2000, 4, 192-198. (d) Gray, H. B.;
111
Winkler, J. R. In Electron Transfer in Chemistry; Balzani, V., Ed.; Wiley-
VCH: Weinheim, 2001; Vol. 1, pp 3-23.
[21] (a) Page, C. C.; Moser, C. C.; Chen, X.; Dutton, P. L. Nature 1999, 402,
47-52. (b) Kelley, S. O.; Barton, J. K. Science 1999, 283, 375-381. (c)
Jortner, J.; Bixon, M.; Langenbacher, T.; Michel-Beyerle, M. E. Proc. Nat.
Acad. Sci. 1998, 95, 12759-12765. (d) Schuster, G. B. Acc. Chem. Res.
2000, 33, 253-260. (e) Giese, B. Ann. Rev. Biochem. 2002, 71, 51-70. (f)
Berlin, Y. A.; Burin, A. L.; Ratner, M. A. Chem. Phys. 2002, 275, 61-74.
(g) Lewis, D.; Liu, J.; Weigel, W.; Rettig, W.; Kurnikov, I. V.; Beratan, D.
N. Proc. Nat. Acad. Sci. 2002, 99, 12536-12541.
[22] a) Anderson, P. W. Phys. Rev. 1950, 79, 350-356. (b) McConnell, H. M. J.
Chem. Phys. 1961, 35, 508-515.
[23] (a) Grozema, F. C.; Berlin, Y. A.; Siebbeles, L. D. A. J. Am. Chem. Soc.
2000, 122, 10903-10909. (b) Bixon, M.; Jortner, J. J. Am. Chem. Soc.
2001, 123, 12556-12567. (c) Li, X.-Q.; Zhang, H.; Yan, Y. J. J. Phys.
Chem. A 2001, 105, 9563-9567. (d) Renger, T.; Marcus, R. A. J. Phys.
Chem. A 2003, 107, 8404-8419.
[24] (a) Long, Y.-T.; Abu-Irhayem, E.; Kraatz, H.-B. Chem. Eur. J. 2005, 11,
5186-5194. (b) Schlag, E. W. , Sheu, S.-Y. ; Yang, D.-Y. ; Selzle, H. L.;
Lin, S. H. Angew. Chem., Int. Ed. 2007, 46, 3196-3210.
[25] (a) Yanagisawa, K.; Morita, T.; Kimura, S. J. AM. Chem. Soc. 2004, 126,
12780-12781. (c) Giese, B.; Graber, M.; Cordes, M. Curr. Opin. Chem.
Biol. 2008, 12, 755-759.
[26] Antonello, S.; Maran, F. Chem. Soc. Rev. 2005, 34, 418-428.
[27] Rampi, M. A.; Whitesides, G. M. Chem. Phys. 2002, 281, 373-391.
[28] Smalley, J. F.; Finklea, H. O.; Chidsey, C. E. D.; Linford, M. R.; Creager,
S. E.; Ferraris, J. P.; Chalfant, K.; Zawodzinsk, T.; Feldberg, S. W.;
Newton, M. D. J. Am. Chem. Soc. 2003, 125, 2004-2013.
[29] (a) Morita, T.; Kimura, S. J. Am. Chem. Soc. 2003, 125, 8732-8733. (b)
Watanabe, J.; Morita, T.; Kimura, S. J. Phys. Chem. B 2005, 109, 14416–
14425. (c) Kai, M.; Takeda, K.; Morita, T.; Kimura, S. J. Pept. Sci. 2008,
14, 192–202. (d) Takeda, K.; Morita, T.; Kimura, S. J. Phys. Chem. B
112
2008, 112, 12840–12850. (e) Arikuma, Y.; Takeda, K.; Morita, T.; Ohmae,
M.; Kimura, S. J. Phys. Chem. B 2009, 113, 6256–6266.
[30] (a) Galka, M. M.; Kraatz, H.-B. ChemPhysChem 2002, 3, 356-359. (b)
Bediako-Amoa, I.; Sutherland, T. C.; Li, C.-Z.; Silerova, R.; Kraatz, H.-B.
J. Phys. Chem. B. 2004, 108, 704-714. (c) Kraatz, H.-B.; Bediako-Amoa,
I.; Gyepi-Garbrah, H.; Sutherland, T. C. J. Phys. Chem. B. 2004, 108,
20164-20172. (d) Dey, S. K.; Long, Y. T.; Chowdhury, S.; Sutherland, T.
C.; Mandal, H. S.; Kraatz, H. B. Langmuir 2007, 23, 6475–6477. (e)
Orlowski, G. A.; Chowdhury, S.; Kraatz, H. B. Langmuir 2007, 23,
12765–12770.
[31] (a) Bilewicz, R.; Sek, S.; Zawiska, I. Russ. J. Electrochem. 2002, 38, 29-
38. (b) Sek, S.; Moszynski, R.; Sepiol, A.; Misicka, A.; Bilewicz, R. J.
Electroanal. Chem. 2003, 550-551, 359-364. (c) Sek, S.; Sepiol, A.; Tolak,
A; Misicka, A.; Bilewicz, R. J. Phys. Chem. B 2004, 108, 8102-8105. (d)
Sek, S.; Tolak, A.; Misicka, A.; Palys, B.; Bilewicz, R. J. Phys. Chem. B
2005, 109, 18433–18438. (e) Sek, S.; Swiatek, K.; Misicka, A. J. Phys.
Chem. B 2005, 109, 23121–23124. (f) Sek, S.; Misicka, A.; Swiatek, K.;
Maicka, E. J. Phys. Chem. B 2006, 110, 19671–19677. forse solo SPM
[32] For recent ET studies on redox proteins and relevant references, see: (a)
Davis, K. L.; Drews, B. J.; Yue, H.; Waldeck, D. H.; Knorr, K.; Clark, R.
A. J. Phys. Chem. C 2008, 112, 6571–6576. (b) Millo, D.; Ranieri, A.;
Gross, P.; Ly, H. K.; Borsari, M.; Hildebrandt, P.; Wuite, G. J. L.; Gooijer,
C.; van der Zwan, G. J. Phys. Chem. C 2009, 113, 2861-2866.
[33] Brooksby, P. A.; Anderson, K. H.; Downard, A. J.; Abell, A. D. Langmuir,
2010, 26, 1334-1339.
[34] Porter, M. D.; Bright, T. B.; Allara, D. L.; Chidsey, C. E. D. J. Am. Chem.
Soc. 1987, 109, 3559-3568.
[35] (a) Becka, A. M.; Miller, C. J. J. Am. Chem. Soc. 1992, 96, 2657-2668. (b)
Becka, A. M.; Miller, C. J. J. Phys. Chem. 1992, 96, 2657-2668. (c) Becka,
A. M.; Miller, C. J. J. Phys. Chem. 1993, 97, 6233-6239. (d)Terrettaz, S.;
Becka, A. M.; Traub, M. J.; Fettinger, J. C.; Miller, C. J. J. Phys. Chem.
1995, 99, 11216-11224. (e) Cheng, J.; Sàghi-Szabò, G.; Tossel, J. A.;
Miller, C. J. J. Am. Chem. Soc.1996, 118, 680-684.

113
[36] Krysinski, P.; Brostowska-Smolska, M. J. Electroanal Chem. 1997, 424,
61-67.
[37] Doneux, T.; Steichen, M.; Bouchta, T.; Buess-Herman, C. J. Electroanal.
Chem. 2007, 599, 241-248.
[38] Protsailo, L. V.; Fawcett W. R. Electrochim. Acta 2000, 45, 3497–3505.
(Studio tramite impedenza)
[39] Smalley, J. F.; Newton, M. D.; Feldberg, S. W. J. Electroanal. Chem.
2006, 589, 1–6.
[40] (a) Degefa, T. H.; Schön, P.; Bongard, D.; Walder, L. J. Electroanal.
Chem. 2004, 574, 49-62. (b) Hwang, S.; Lee, B. S.; Chi, Y. S.; Kwak, J.;
Choi, I. S.; Lee, S. J. Electrochim. Acta 2008, 53, 2630-2636.
[41] Badia, A.; Lennox, B.; Reven, L. Acc. Chem. Res. 2000, 33, 475-481.
[42] Bizzotto, D.; Yu, H.; Cheng, A.K.H.; Murphy, J. N. J. Am. Chem. Soc.,
2009, 131, 4042-4050.
[43] (a) Zhao, X.; Wilbur, J. L.; Whitesides, G. M. Langmuir 1996, 12, 3257-
3264. (b) Che, G.; Cabrera C. R. J. Electroanal. Chem. 1996, 417, 155-
161. (c) Che, G.; Li, Z.; Zhang, H.; Cabrera C. R. J. Electroanal. Chem.
1998, 453, 9–17. (d) Protsailo, L. V.; Fawcett, W. R. Langmuir 2002, 18,
8933-8941. (Analisi dei difetti con Impedenza) (e) Benìtez, G.; Vericat,
C.; Tanco, S.; Lenicov, R. F.; Castez, M. F.; Vela, M. E.; Salvarezza R. C.;
Langmuir 2004, 20, 5030-5037. (f) Kiani, A.; Alpuche-Aviles, M. A.;
Eggers, P. K.; Jones, M.; Gooding, J. J.; Paddon-Row, M. N.; Bard, A. J.
Langmuir 2008, 24, 2841-2849. (g) Preiner, M. J.; Melosh, N. A.
Langmuir 2009, 25, 2585-2587.
[44] (a) Liu, B.; Mirkin, M. V.; Bard, A. J.; Creager, S. E. J. Am. Chem. Soc.
2004, 126, 1485-1492.; (b) Finklea, O. H. Langmuir 1993, 9, 3660-3667;
(c) Chailapaku, O.; Crooks, R. M. Langmuir 1995, 11, 1329-1340; (d)
Orlowski, G. A..; Kraatz, H. Electrochimica Acta 2006, 51, 2934–2937.
[45] Strattmann, M. Adv. Mater. 1990, 2, 191.
[46] Ulman, A. Thin Solid Films 1996, 273, 48-53.
[47] Nuzzo, R. C.; Dubois, L. H.; Allara, D. L. J. Am. Chem. Soc. 1990, 112,
558-569.
[48] DePalma, V.; Tillman, N. Langmuir 1989, 5, 868-872.

114
[49] Ferguson, G. S.; Chaudhury, M. K.; Sigal, G. B.; Whitesides, G. M.
Science 1991, 253, 776-778.
[50] Chen, J.; Reed, M. A.; Tour, J. M. Science 1990, 286, 1550-1552.
[51] Katz, H. E.; Wilson, W. L.; Scheller, G. J. Am. Chem. Soc. 1994, 116,
6636-6640.
[52] Malem, F.; Mandler, D. Anal. Chem. 1993, 65, 37-41.
[53] Gooding, J. J.; Praig, V. G.; Hall, E. A. H. Anal. Chem. 1998, 70, 2396-
2402.
[54] Giz, M. J.; Duong, B.; Tao, N. J. J. Electroanal. Chem. 1999, 465, 72-79
[55] Chen, D.; Li, J. Surface Sci. Reports 2006, 61, 445-463.
[56] Love, J. C.; Estroff, L. A.; Kriebel, J. K.; Nuzzo, R. G.; Whitesides, G.M.
Chem. Rev. 2005, 105, 1103-1169.
[57] Nuzzo, R. G.; Zegarski, B. R.; Dubois, L. H. J. Am. Chem. Soc. 1987, 109,
733-740.
[58] Valiokas, R.; Svedhem, S.; Svensson, S. C. T.; Liedberg, B.
Langmuir 1999, 15, 3390-3394.
[59] Schlenoff, J. B.; Li, M.; Ly, H. J. Am. Chem. Soc. 1995, 117, 12528.
[60] Antonello, S.; Benassi, R.; Gavioli, G.; Taddei, F.; Maran, F. J. Am. Chem.
Soc. 2002, 124, 7529-7538.
[61] Poirier, G.E. Langmuir 1997, 13, 2019-2026.
[62] Paradis, E.; Rowtree, P. J. Electroanal. Chem. 2003, 550, 175-185.
[63] Zhang, L.; Goddard, W. A.; Jiang, S. J. Chem. Phys. 2002, 117, 7341-
7349.
[64] Jiang, S. Mol. Phys. 2002, 100, 2261-2275.
[65] Fischer, D.; Curioni, A.; Andreoni, W. Langmuir 2003, 19, 3567-3571.
[66] Heister, K.; Zharnikov, M.; Grunze, M.; Johansson, L. S. O. J. Phys.
Chem. B 2001, 105, 4058-4061.
[67] Yang, Y. W.; Fan, L. J. Langmuir 2002, 18, 1157-1164.
[68] Dubois, L. H.; Zegarski, B. R.; Nuzzo, R.G. J. Chem. Phys. 1993, 98, 178-
188.
[69] Camillone, N.; Chidsey, C. E. S.; Eisemberger, P.; Fenter, P.; Li, J.; Liang,
K. S.; Liu, G. Y.; Scoles, G. J. Chem. Phys. 1993, 99, 744-747.
115
[70] Fenter, P; Eisemberger, P.; Liang, K. S. Phys. Rev. Lett. 1993, 70, 2447-
2450.
[71] Seydack, M., Biosens Bioelectron (2005) 20, 2454.
[72] Roy, S., and Gao, Z., Nano Today (2009) 4, 318.
[73] Pumera, M., et al., Sensors and Actuators B (2007) 123, 1195.
[74] Rosi, N. L., and Mirkin, C. A., Chem Rev (2005) 105, 1547.
[75] De la Enconsura-Muñiz A, Parolo C., Merkoçi A, Materialstoday (2010),
13.
[76] De la Enconsura-Muñiz, A.; Trends Anal Chem (2008) 27 (7), 568.
[77] Karle, I. L.; Balaram, P. Biochemistry 1990, 29, 6747-6756.
[78] (a) Toniolo, C.; Crisma, M.; Formaggio, F.; Peggion, C. Biopolymers
2001, 60, 396-419. (b) Crisma, M.; Moretto, A.; Formaggio, F.; Toniolo,
C. Biopolymers 2006, 84, 3-12.
[79] Goodman, M.; Toniolo, C.; Pallai, P. In Forum Peptides; Castro, B.,
Martinez, J., Eds.; Nancy Dohr: France, 1985; pp 146-174.
[80] (33) Toniolo, C.; Bonora, G. M.; Barone, V.; Bavoso, A.; Benedetti, E.; Di
Blasio, B.; Grimaldi, P.; Lelj, F.; Pavone, V.; Pedone, C., Macromolecules
1985, 18, 895-902.
[81] (a) Improta, R.; Barone, V.; Kudin, K. N.; Scuseria, G. E. J. Am. Chem.
Soc. 2001, 123, 3311-3322. (b) Shin, Y.-G; Newton, M. D.; Isied, S. S. J.
Am. Chem. Soc. 2003, 125, 3722-3732. (c) Wieczorek, R.; Dannenberg, J.
J. J. Am. Chem. Soc. 2004, 126, 14198-14205.
[82] (a) Kennedy, D. F.; Crisma, M.; Toniolo, C.; Chapman, D. Biochemistry
1991, 30; (b) Hanson, P.; Millhauser, F.; Formaggio, F.; Crisma, M.;
Toniolo, C. J. Am. Chem. Soc. 1996, 118.
[83] (a) Fabris, L.; Antonello, S.; Armelao, L.; Donkers, R. L.; Polo, F.;
Toniolo, C.; Maran, F., J. Am. Chem. Soc. 2006, 128, 326-336. (b) Holm,
A. H.; Ceccato, M.; Donkers, R. L.; Fabris, L.; Pace, G.; Maran, F.,
Langmuir 2006, 22, 10584-10589.
[84] Perera, N. V.; Isley, W.; Maran, F.; Gascón, J. A. J. Phys. Chem. C 2010,
114, 1643-16050.
[85] Wen, X. G.; Linton, R. W.; Formaggio, F.; Toniolo, C.; Samulski, E. T. J.
Phys. Chem. A 2004, 108, 9673-9681.
116
[86] a) Antonello, S.; Formaggio, F.; Moretto, A.; Toniolo, C.; Maran, F. J. Am.
Chem. Soc. 2003, 125, 2874-2875. (b) Polo, F.; Antonello, S.; Formaggio,
F.; Toniolo, C.; Maran, F. J. Am. Chem. Soc. 2005, 127, 492-493.
[87] (a) Improta, R.; Antonello, S.; Formaggio, F.; Maran, F.; Rega, N.;
Barone, V. J. Phys. Chem. B 2005, 109, 1023-1033. (b) Improta, R.;
Barone, V.; Newton, M. D.; Chemphyschem, 2006, 7, 1211.
[88] Becucci, L.; Guryanov, I.; Maran, F.; Guidelli, R. J. Am. Chem. Soc. 2010,
132, 6194-6204.
[89] Hesari, M.; Antonello, S.; Armelao, L.; Gobbo, P.; Guidelli, R.; Guryanov,
I.; Rampi, M. A.; Soldà, A.; Maran, F. Manuscript in preparation.
[90] Lvov, Y.M Thin-Film Nanofabrication by alterbate Absorption of
Polyions, Nanoparticles, and Proteins. In Handbook of Surface and
Interface of Material: Nanostructured Materials, Micelles, and Colloids;
Nalwa, H.S, Ed.; Academic Press: San Diego, 2001; Vol. 3, 170-189.
[91] Angerstein-Kozlowska, H.; Conway, B. E.; Hamelin, A.; Stoicoviciu, L. J.
Electroanal. Chem. 1987, 228, 429-453. Tkac, J.; Davis, J. J. J.
Electroanal. Chem. 2008, 621, 117-120.
[92] Haiss, W.; Thanh, N. T. K.; Aveyard, J.; Fernig, D. G.; Anal. Chem. 2007,
79, 4215-4221.
[93] Galus Z.; Fundamentals of electrochemical analysis, 2nd Edition, Polish
Scientific Publishers Pwn, 1976.
[94] Juntao Lu and Peifang Liu, J. Electroanal. Chem., 1988, 244, 339.
[95] Engstrom, R. C.; Weber, M.; Wunder, D. J.; Burgess, R.; Winquist, S.;
Anal. Chem. 1986, 58, 844.
[96] Tanaka, K.; Tamamushi, R.; Bioelectrochem. Bioenerg. 1987, 17, 519.
[97] Tanaka, K.; Kashiwagi, N.; Bioelectrochem. Bioenerg. 1988, 20, 1.
[98] Zamlynni, V. PhD Thesis Work, “Electrochemical and Spectroscopic
Studies of Pyridine Surfactants at the Gold-Electrolyte Interface”, 2002,
University of Guelph, ON Canada.
[99] Sheppard, N.; Erkelens, J. Appl. Spec. 1984, 38, 471-485.
[100] Toniolo, C.; Bonora, G. M.; Barone, V.; Bavoso, A.; Benedetti, E.; Di
Blasio, B.; Grimaldi, P.; Lelj, F.; Pavone, V.; Pedone, C.;
Macromolecules 1985, 18, 895-902

117
[101] Buffeteau, T.; Desbat, B., Appl. Spec. 1989, 6, 1027-1032.
[102] Strong, L.; Whitesides, G. M., Langmuir 1988, 4, 546-558.
[103] Swalen, J. D.; Allara, D. L.; Andrade, J. D.; Chandross, E. A.; Garoff, S.;
Israelachvili, J.; McCrthy, T. J.; Murray, R.; Pease, R. F.; Rabolt, J. F.,
Wynne, K. J.; Yu, H.; Langmuir 1987, 3, 932.
[104] (a) Wen, X.; Linton, R.W.; Formaggio, F.; Toniolo, C.; Samulski, E.T.; J.
Phys. Chem. A 2004; (b) Enriquez, E. P.; Samulski, E.T. Mat. Res. Soc.
Symp. Proc. 1992, 255, 423.
[105] Greenler, R. G., J. Chem. Phys. 1966, 44, 310-315.
[106] Michl, J.; Thulstrup, E. W.; Spectroscopy with Polarized Light: Solute
alignment by Photoselection, in Liquid Crystal, Polymers, and
Menmbranes; VCH Publichers: Deerfield Beach, FL, 1986.
[107] Tsuboi, M.; J. Polymer Sci. 1962, 59, 139-153.
[108] Arikuma, Y.; Takeda, K.; Morita, T.; Ohmae, M.; Kimura, S. J. Phys.
Chem. B 2009, 113, 6256–6266.
[109] Kraatz, H.-B.; Bediako-Amoa, I.; Gyepi-Garbrah, H.; Sutherland, T. C. J.
Phys. Chem. B. 2004, 108, 20164-20172.
[110] Mandal, H. S.; Kraatz, H. B. Chem. Phys. 2006, 326, 246–251.
[111] (a) Kitagawa, K.; Morita, T.; Kimura, S. Thin Solid Films 2006, 509, 18–
26. (b) Watanabe, J.; Morita, T.; Kimura, S. J. Phys. Chem. B 2005, 109,
14416-14425. (c) Kitagawa, K.; Morita, T.; Kimura, S. J. Phys. Chem. B
2004, 108, 15090-15095.
[112] Ward, M. A., Catto, J.W.F., Hamdy, F.C., Ann. Clin. Biochem, 2001, 38,
633-651.
[113] Cattarin, S.; Kramer, D.; Lui, A.; Musiani, M.; J. Phys. Chem. C 2007,
111, 12643-12649.