electrocardiographic diagnosis of atrial tachycardia ... · atrial tachycardia do not occur...
TRANSCRIPT
REVIEW ARTICLE
Electrocardiographic Diagnosis of Atrial Tachycardia:Classification, P-Wave Morphology, and DifferentialDiagnosis with Other Supraventricular Tachycardias
Carmelo Butta, M.D., Antonino Tuttolomondo, M.D., Ph.D.,Lucia Giarrusso, M.D., and Antonio Pinto, M.D.
From the U.O.C. Internal Medicine and Cardioangiology, Biomedical Department of Internal and Specialist Medicine,University of Palermo, Palermo, Italy
Atrial tachycardia is defined as a regular atrial activation from atrial areas with centrifugal spread,caused by enhanced automaticity, triggered activity or microreentry. New ECG classificationdifferentiates between focal and macroreentrant atrial tachycardia. Macroreentrant atrial tachycardiasinclude typical atrial flutter and other well characterized macroreentrant circuits in right and leftatrium. Typical atrial flutter has been described as counterclockwise reentry within right atrial and itpresents a characteristic ECG “sawtooth” pattern on the inferior leads. The foci responsible for focalatrial tachycardia do not occur randomly throughout the atria but tend to cluster at characteristicanatomical locations. The surface ECG is a very helpful tool in directing mapping to particularareas of interest. Atrial tachycardia should be differentiated from other supraventricular tachycardias.We propose a diagnostic algorithm in order to help the physician to discriminate among those.Holter analysis could offer further details to differentiate between atrial tachycardia and anothersupraventricular tachycardia. However, if the diagnosis is uncertain, it is possible to utilize vagalmaneuvers or adenosine administration. In conclusion, in spite of well–known limits, a goodinterpretation of ECG is very important and it could help the physician to manage and to treatcorrectly patients with atrial tachycardia.
Ann Noninvasive Electrocardiol 2014;00(0):1–14
ECG; atrial tachycardia; atrial flutter; supraventricular tachycardia; diagnostic algorithm
Atrial tachycardia (AT) is defined as a regularatrial activation from atrial areas with centrifugalspread, caused by enhanced automaticity, triggeredactivity, or microreentry.1 Electrophysiologicalstudies showed that electrocardiogram (ECG) is notable to properly explain all the AT mechanisms.2
Nevertheless, current classification establishesprecise criteria to define these arrhythmias in spiteof known ECG limits.2 Moreover, localization ofAT and differential diagnosis between AT and othersupraventricular tachycardia (SVT) may be very
Address for correspondence: Dr. Carmelo Butta, M.D., U.O.C. Medicina Interna e Cardioangiologia, Dipartimento Biomedico diMedicina Interna e Specialistica, Universita degli Studi di Palermo, Piazza delle Cliniche n° 2, 90127 Palermo. Tel: +39-0916552150;Fax: +39-0916552150; E-mail: [email protected]
Conflicts of interest: none.
hard and therefore the good knowledge of ECGis fundamental to diagnose and to treat correctlythese rhythm disorders.
In this article, we showed two ECG re-ports that represented a diagnostic challengein the clinical practice. Afterward, we con-ducted a review about electrocardiographic di-agnosis of AT (classification, localization, anddifferential diagnosis with other SVTs) in orderto help the physician to better manage thesearrhythmias.
C© 2014 Wiley Periodicals, Inc.DOI:10.1111/anec.12246
1
2 � A.N.E. � XXX 2014 � Vol. 00, No. 0 � Butta, et al. � Atrial Tachycardia and ECG
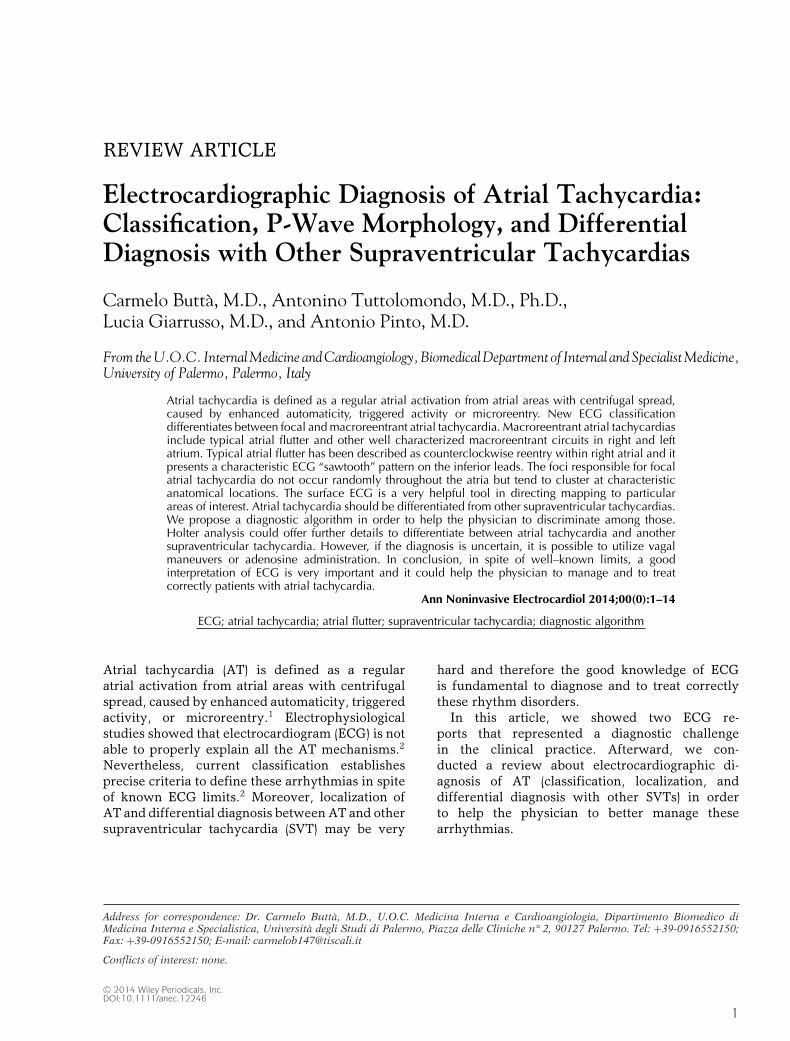
Figure 1. (A) Narrow complex tachycardia at ventricular rate of about 130 bpm. P waves are visible from V1 to V5leads. (B) Wenckebach phenomenon at Holter monitoring allows the diagnosis of atrial tachycardia.
CASE SERIES
Case Report 1
An 80-year-old male patient, affected bymetabolic syndrome, coronary artery disease, andchronic obstructive pulmonary disease, presentedto the hospital’s Emergency Department for chestpain and dyspnea. The ECG (Fig. 1A) shows
a regular narrow complex tachycardia (NCT) atventricular rate of about 130 beats per minute(bpm). P waves are well visible only from V1 toV5 leads. RP interval is shorter than PR intervaland it is lower than 70 milliseconds (ms). Themost likely diagnosis are: common atrioventricularnodal reentry tachycardia (AVNRT) and junctionaltachycardia (JT).1,3 In these cases, P wavesare usually well visible on the inferior leads
A.N.E. � XXX 2014 � Vol. 00, No. 0 � Butta, et al. � Atrial Tachycardia and ECG � 3
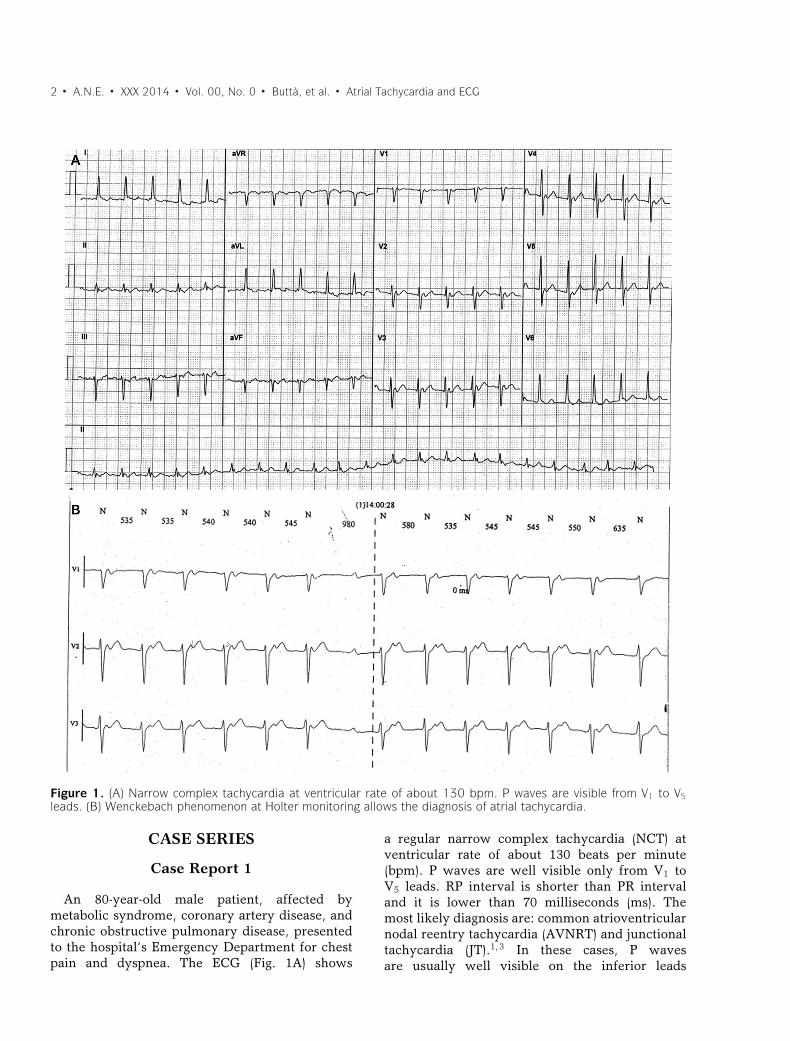
Figure 2. (A) Regular narrow complex tachycardia at ventricular rate of about 145 bpm without visible P waves. (B)Adenosine administration causes a temporary block of some ventricular beats, P waves become visible and diagnosisof atrial tachycardia is possible.
(negative) and on the V1 lead (positive) but inour ECG report there are visible positive Pwaves only from V1 to V5 lead. After a fewminutes, there is a spontaneous recovery of sinusrhythm. A Holter ECG monitoring performedafter a few days shows an analogous episode ofSVT where is visible that P waves have not aretrograde conduction. In fact, during monitoringPR and RP intervals are slightly irregular andsometimes PR interval progressively increasesuntil the atrioventricular (AV) conduction isblocked and a P wave is not followed by a QRScomplex (Wenckebach phenomenon) (Fig. 1B). TheWenckebach phenomenon is not compatible with
a diagnosis of common AVNRT or JT and it allowsthe diagnosis of AT.4
Case Report 2
A 79-year-old female patient, affected bymetabolic syndrome, presented to the hospital’sEmergency Department for palpitations. The ECG(Fig. 2A) shows an NCT at ventricular rate of about145 bpm with regular RR intervals and withoutvisible P waves. In this case, the most probablediagnoses are JT and common AVNRT.5 Vagalmaneuvers were ineffective to stop the tachycardiabut adenosine administration caused a temporary
4 � A.N.E. � XXX 2014 � Vol. 00, No. 0 � Butta, et al. � Atrial Tachycardia and ECG
block of some ventricular beats, so that the Pwaves became visible and the diagnosis of AT waspossible (Fig. 2B).
CLASSIFICATION
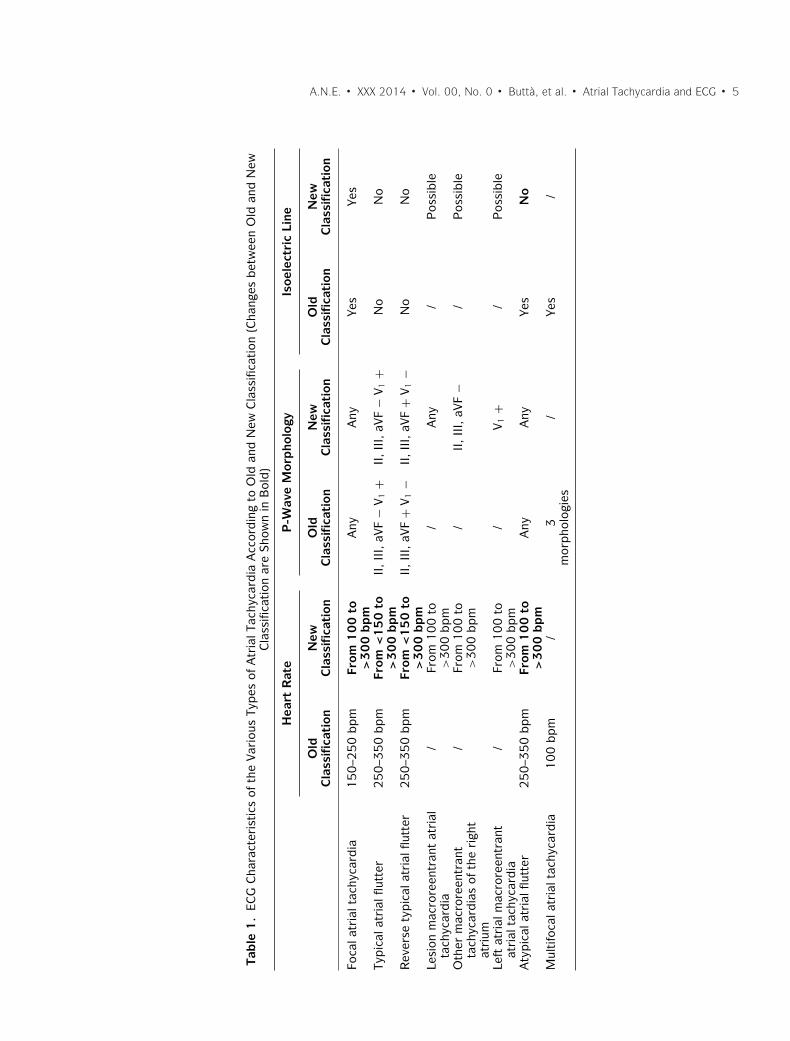
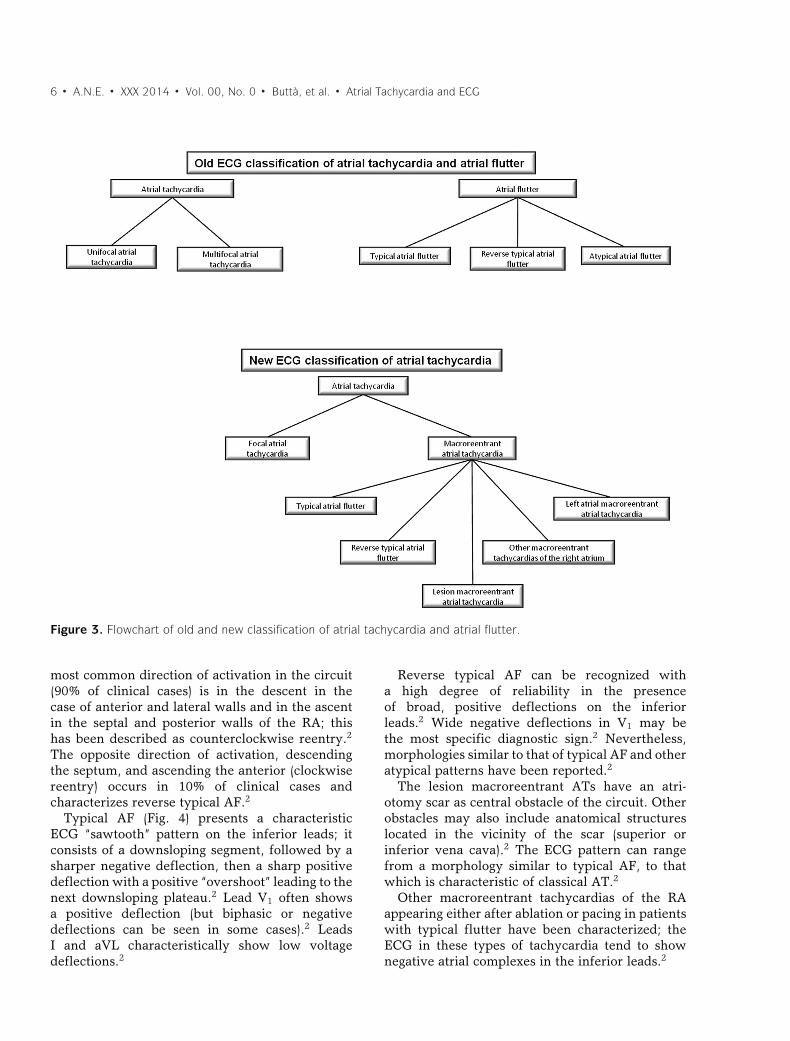
In the old ECG classification, AT was subdividedin unifocal and multifocal. Unifocal AT wasdefined by a slower P-wave rate (<200/min) and anisoelectric interval between P waves.6 Atrial flutter(AF) and unifocal AT were two distinct entities andthey were differentiated by two criteria: heart ratehigher than about 240–250/min in AF but not in ATand presence of isoelectric baselines between atrialdeflections in AT, but not in AF (Fig. 3).2,7
In 2001, a new classification of AT discriminatedtwo types of AT: focal and macroreentrant(Fig. 3).2 It was an electrophysiological classifica-tion and it showed limits of old ECG classification(isoelectric baseline did not discriminate betweenAT and AF). Multifocal AT did not be cited, AFwas included in the macroreentant group andsome subtypes of macroreentrant AT had notprecise ECG criteria (Table 1). However, althoughsometimes ECG and anatomical substrate did notcoincide, focal AT and AF had well-defined ECGcriteria.
Focal ATs
Focal ATs are characterized by a point sourcewith concentric spread of activation from theorigin.8 They appear to be caused by abnormalautomaticity, microreentry, and triggered activity(associated with delayed after-depolarizations).8
The focus originates from an area of atrialmyocardium arbitrarily defined as �2 cm indiameter.2,9 AT cycle length is usually �250 msbut it can be as short as �200 ms and it can exhibitimportant variations.2 A progressive rate increaseat tachycardia onset (warm up) and/or a progressiverate decrease before tachycardia termination (cooldown) are suggestive of an automatic mechanism.2
Typically, adrenergic stimulation can acceleratethe rate of focal discharge.2
A common misconception is that focal ATis a sign of underlying heart disease.6 Indeed,the majority of histological analyses conductedon myocardium from AT focuses have shownnormal findings.6 Locations of slow conduction andanisotropy provide the substrate for microreentryand the initiation of focal AT.6 Reduction in tissue
voltage and conduction slowing occur with aging;for these reasons, the microreentry is a morecommon mechanism for focal AT in the olderpopulation.6
ECG pattern of AT shows typically discreteP waves at rates 130–240 bpm, but possibly aslow as 100 bpm or as high as 300 bpm.2 Thereis a clearly defined isoelectric baseline betweenP waves in all leads.2,10 P-wave morphology(PWM) will depend on focus location, and itcan be used to approximately localize it beforeelectrophysiological study.2
Adenosine can effectively terminate focal ATrelated to triggered activity and microreentry,whereas the response in automatic AT is generallyof transient suppression.6 Moreover, calcium-channel blockers and beta-blockers can terminateAT owing to enhanced automaticity or triggeredactivity.2,6 Finally, class Ic and III drugs can alsoterminate or reduce recurrence of focal AT.6
Macroreentrant ATs
Macroreentrant ATs include typical AF and otherwell characterized macroreentrant circuits in rightand left atrium (LA; Table 1). The mechanism isreentrant activation around a large central obstacle,generally several centimeters in diameter, at leastin one of its dimensions.2 The central obstaclemay consist of normal or abnormal structures andit can be fixed, functional, or a combination ofeach.2
Typical AF is the most common macroreentrantAT.2 It usually has a cycle length between 190and 250 ms, with �2% cycle-to-cycle variation.2
However, conduction delays within the circuitcan prolong the AT cycle length, particularlyafter radiofrequency ablation, making it overlapwith the classical focal AT range (>400 ms cyclelength).2 In typical AF, activation of the rightatrium (RA) is reentrant, bounded anteriorly by thetricuspid orifice, and posteriorly by a combinationof anatomical obstacles (orifices of the superiorand inferior vena cava and the Eustachian ridge)and functional barriers (the region of the CT).2
The superior pivot point is not well defined. Theinferior pivot point is the area bounded anteriorlyby the inferior part of the tricuspid orifice, andposteriorly by the inferior vena cava orifice andits continuation in the eustachium ridge (inferioristhmus).2 Complete transection or ablation of thisisthmus interrupts and prevents typical AF.2 The
A.N.E. � XXX 2014 � Vol. 00, No. 0 � Butta, et al. � Atrial Tachycardia and ECG � 5
Table
1.
ECG
Cha
ract
eris
tics
ofth
eVa
riou
sTy
pes
ofA
tria
lTac
hyca
rdia
Acc
ordin
gto
Old
and
New
Cla
ssifi
cation
(Cha
nges
bet
wee
nO
ldan
dN
ewC
lass
ifica
tion
are
Sho
wn
inB
old)
Hea
rtR
ate
P-W
ave
Morp
holo
gyIs
oel
ectr
icLi
ne
Old
Cla
ssifi
cati
on
New
Cla
ssifi
cati
on
Old
Cla
ssifi
cati
on
New
Cla
ssifi
cati
on
Old
Cla
ssifi
cati
on
New
Cla
ssifi
cati
on
Foca
latr
ialt
achy
card
ia1
50
–25
0bpm
From
10
0to
>3
00
bpm
Any
Any
Yes
Yes
Typic
alat
rial
flutt
er2
50
–35
0bpm
From
<1
50
to>
30
0bpm
II,II
I,aV
F−
V 1+
II,II
I,aV
F−
V 1+
No
No
Rev
erse
typic
alat
rial
flutt
er2
50
–35
0bpm
From
<1
50
to>
30
0bpm
II,II
I,aV
F+
V 1−
II,II
I,aV
F+
V 1−
No
No
Lesi
onm
acro
reen
tran
tat
rial
tach
ycar
dia
/Fr
om1
00
to>
30
0bpm
/A
ny/
Pos
sible
Oth
erm
acro
reen
tran
tta
chyc
ardia
sof
the
righ
tat
rium
/Fr
om1
00
to>
30
0bpm
/II
,II
I,aV
F−
/P
ossi
ble
Left
atri
alm
acro
reen
tran
tat
rial
tach
ycar
dia
/Fr
om1
00
to>
30
0bpm
/V 1
+/
Pos
sible
Aty
pic
alat
rial
flutt
er2
50
–35
0bpm
From
10
0to
>3
00
bpm
Any
Any
Yes
No
Mul
tifo
cala
tria
ltac
hyca
rdia
�1
00
bpm
/�
3m
orpho
logi
es/
Yes
/
6 � A.N.E. � XXX 2014 � Vol. 00, No. 0 � Butta, et al. � Atrial Tachycardia and ECG
Figure 3. Flowchart of old and new classification of atrial tachycardia and atrial flutter.
most common direction of activation in the circuit(90% of clinical cases) is in the descent in thecase of anterior and lateral walls and in the ascentin the septal and posterior walls of the RA; thishas been described as counterclockwise reentry.2
The opposite direction of activation, descendingthe septum, and ascending the anterior (clockwisereentry) occurs in 10% of clinical cases andcharacterizes reverse typical AF.2
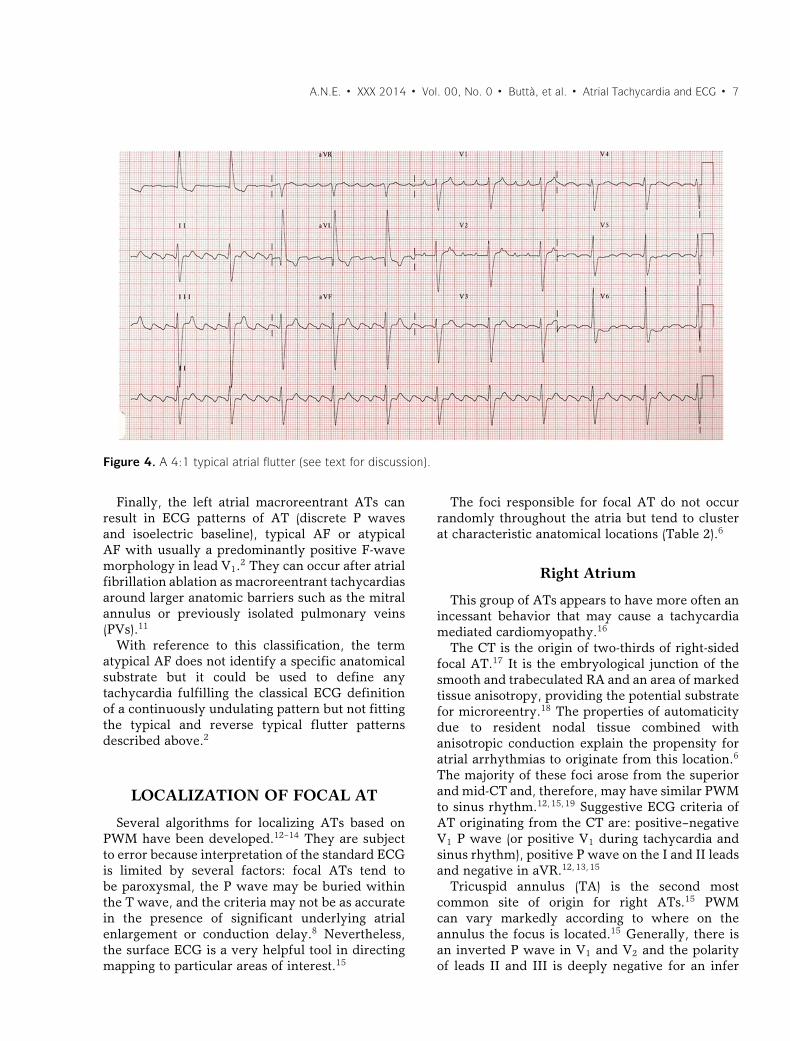
Typical AF (Fig. 4) presents a characteristicECG “sawtooth” pattern on the inferior leads; itconsists of a downsloping segment, followed by asharper negative deflection, then a sharp positivedeflection with a positive “overshoot” leading to thenext downsloping plateau.2 Lead V1 often showsa positive deflection (but biphasic or negativedeflections can be seen in some cases).2 LeadsI and aVL characteristically show low voltagedeflections.2
Reverse typical AF can be recognized witha high degree of reliability in the presenceof broad, positive deflections on the inferiorleads.2 Wide negative deflections in V1 may bethe most specific diagnostic sign.2 Nevertheless,morphologies similar to that of typical AF and otheratypical patterns have been reported.2
The lesion macroreentrant ATs have an atri-otomy scar as central obstacle of the circuit. Otherobstacles may also include anatomical structureslocated in the vicinity of the scar (superior orinferior vena cava).2 The ECG pattern can rangefrom a morphology similar to typical AF, to thatwhich is characteristic of classical AT.2
Other macroreentrant tachycardias of the RAappearing either after ablation or pacing in patientswith typical flutter have been characterized; theECG in these types of tachycardia tend to shownegative atrial complexes in the inferior leads.2
A.N.E. � XXX 2014 � Vol. 00, No. 0 � Butta, et al. � Atrial Tachycardia and ECG � 7
Figure 4. A 4:1 typical atrial flutter (see text for discussion).
Finally, the left atrial macroreentrant ATs canresult in ECG patterns of AT (discrete P wavesand isoelectric baseline), typical AF or atypicalAF with usually a predominantly positive F-wavemorphology in lead V1.2 They can occur after atrialfibrillation ablation as macroreentrant tachycardiasaround larger anatomic barriers such as the mitralannulus or previously isolated pulmonary veins(PVs).11
With reference to this classification, the termatypical AF does not identify a specific anatomicalsubstrate but it could be used to define anytachycardia fulfilling the classical ECG definitionof a continuously undulating pattern but not fittingthe typical and reverse typical flutter patternsdescribed above.2
LOCALIZATION OF FOCAL AT
Several algorithms for localizing ATs based onPWM have been developed.12–14 They are subjectto error because interpretation of the standard ECGis limited by several factors: focal ATs tend tobe paroxysmal, the P wave may be buried withinthe T wave, and the criteria may not be as accuratein the presence of significant underlying atrialenlargement or conduction delay.8 Nevertheless,the surface ECG is a very helpful tool in directingmapping to particular areas of interest.15
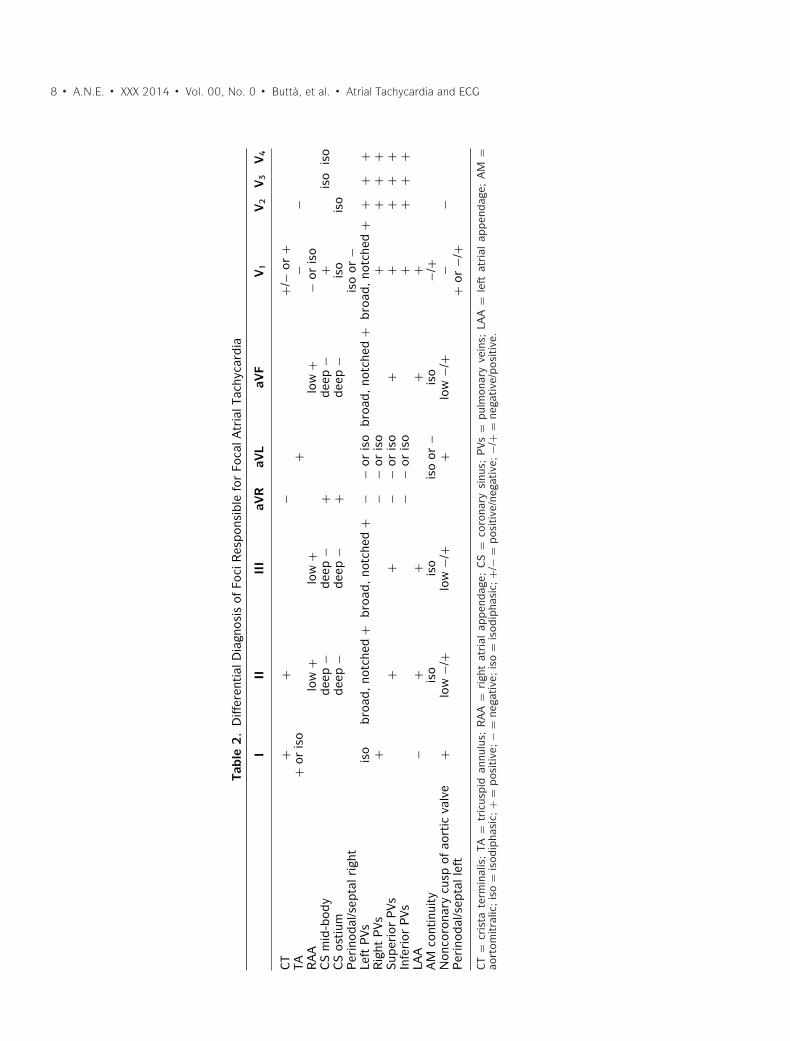
The foci responsible for focal AT do not occurrandomly throughout the atria but tend to clusterat characteristic anatomical locations (Table 2).6
Right Atrium
This group of ATs appears to have more often anincessant behavior that may cause a tachycardiamediated cardiomyopathy.16
The CT is the origin of two-thirds of right-sidedfocal AT.17 It is the embryological junction of thesmooth and trabeculated RA and an area of markedtissue anisotropy, providing the potential substratefor microreentry.18 The properties of automaticitydue to resident nodal tissue combined withanisotropic conduction explain the propensity foratrial arrhythmias to originate from this location.6
The majority of these foci arose from the superiorand mid-CT and, therefore, may have similar PWMto sinus rhythm.12,15,19 Suggestive ECG criteria ofAT originating from the CT are: positive–negativeV1 P wave (or positive V1 during tachycardia andsinus rhythm), positive P wave on the I and II leadsand negative in aVR.12,13,15
Tricuspid annulus (TA) is the second mostcommon site of origin for right ATs.15 PWMcan vary markedly according to where on theannulus the focus is located.15 Generally, there isan inverted P wave in V1 and V2 and the polarityof leads II and III is deeply negative for an infer
8 � A.N.E. � XXX 2014 � Vol. 00, No. 0 � Butta, et al. � Atrial Tachycardia and ECG
Table
2.
Diff
eren
tial
Dia
gnos
isof
Foci
Res
pon
sible
for
Foca
lAtr
ialT
achy
card
ia
III
III
aVR
aVL
aVF
V1
V2
V3
V4
CT
++
−+/
−or
+TA
+or
iso
+−
−R
AA
low
+lo
w+
low
+−
oris
oC
Sm
id-b
ody
dee
p−
dee
p−
+dee
p−
+is
ois
oC
Sos
tium
dee
p−
dee
p−
+dee
p−
iso
iso
Per
inod
al/s
epta
lrig
htis
oor
−Le
ftP
Vsis
obro
ad,no
tche
d+
bro
ad,no
tche
d+
−−
oris
obro
ad,
notc
hed
+bro
ad,no
tche
d+
++
+R
ight
PVs
+−
−or
iso
++
++
Sup
erio
rP
Vs+
+−
−or
iso
++
++
+In
feri
orP
Vs−
−or
iso
++
++
LAA
−+
++
+A
Mco
ntin
uity
iso
iso
iso
or−
iso
−/+
Non
coro
nary
cusp
ofao
rtic
valv
e+
low
−/+
low
−/+
+lo
w−/
+−
−P
erin
odal
/sep
tall
eft
+or
−/+
CT
=cr
ista
term
inal
is;
TA=
tric
uspid
annu
lus;
RA
A=
righ
tat
rial
appen
dag
e;C
S=
coro
nary
sinu
s;P
Vs=
pul
mon
ary
vein
s;LA
A=
left
atri
alap
pen
dag
e;A
M=
aort
omitra
lic;
iso
=is
odip
hasi
c;+
=pos
itiv
e;−
=ne
gative
;is
o=
isod
ipha
sic;
+/−
=pos
itiv
e/ne
gative
;−/
+=
nega
tive
/pos
itiv
e.
A.N.E. � XXX 2014 � Vol. 00, No. 0 � Butta, et al. � Atrial Tachycardia and ECG � 9
Table
3.
Diff
eren
tial
Dia
gnos
isof
SVT
sw
ith
Iden
tica
lPW
aves
and
Reg
ular
PP
Inte
rval
s
Par
oxy
-P
-Wav
eP
Ran
dR
PP
oss
ible
Var
iabili
tysm
alTr
igge
rM
orp
holo
gyP
:RR
atio
Inte
rval
sof
PP
and
RR
Inte
rval
sA
TYes
Sud
den
Any
Any
Any
Yes
Slo
w–f
ast
AVN
RT
Yes
PA
Cw
ith
PR
pro
long
atio
nR
etro
grad
ean
dco
ncen
tric
1:1
RP
<7
0m
sN
o
Slo
w–s
low
AVN
RT
Yes
PA
Cor
PVC
Ret
rogr
ade
and
conc
entr
ic1
:1R
P<
PR
but
>7
0m
sN
o
Fast
–slo
wA
VNR
TYe
sP
VCR
etro
grad
ean
dco
ncen
tric
1:1
RP
>P
RN
o
JTYe
sSud
den
Ret
rogr
ade
and
conc
entr
ic1
:1or
AV
dis
soci
atio
nP
wav
ead
jace
ntto
QR
SYe
s
Ort
hodro
mic
AVR
TYe
sP
AC
orP
VCA
ny1
:1R
P>
70
ms
No
PFR
JTN
oR
ate-
dep
enden
tA
ny1
:1R
P>
PR
No
ST
No
Gra
dua
lSin
us1
:1A
nyYe
s
AT
=at
rial
tach
ycar
dia
;A
VNR
T=
atri
oven
tric
ular
nodal
reen
try
tach
ycar
dia
;JT
=ju
nction
alta
chyc
ardia
;A
VRT
=at
riov
entr
icul
arre
cipro
cating
tach
ycar
dia
;P
FRJT
=per
man
ent
form
ofju
nction
alre
cipro
cating
tach
ycar
dia
;ST
=si
nus
tach
ycar
dia
;P
AC
=pre
mat
ure
atri
alco
ntra
ctio
n;P
VC=
pre
mat
ure
vent
ricu
lar
cont
ract
ion;
AV
=at
riov
entr
icul
ar.
10 � A.N.E. � XXX 2014 � Vol. 00, No. 0 � Butta, et al. � Atrial Tachycardia and ECG
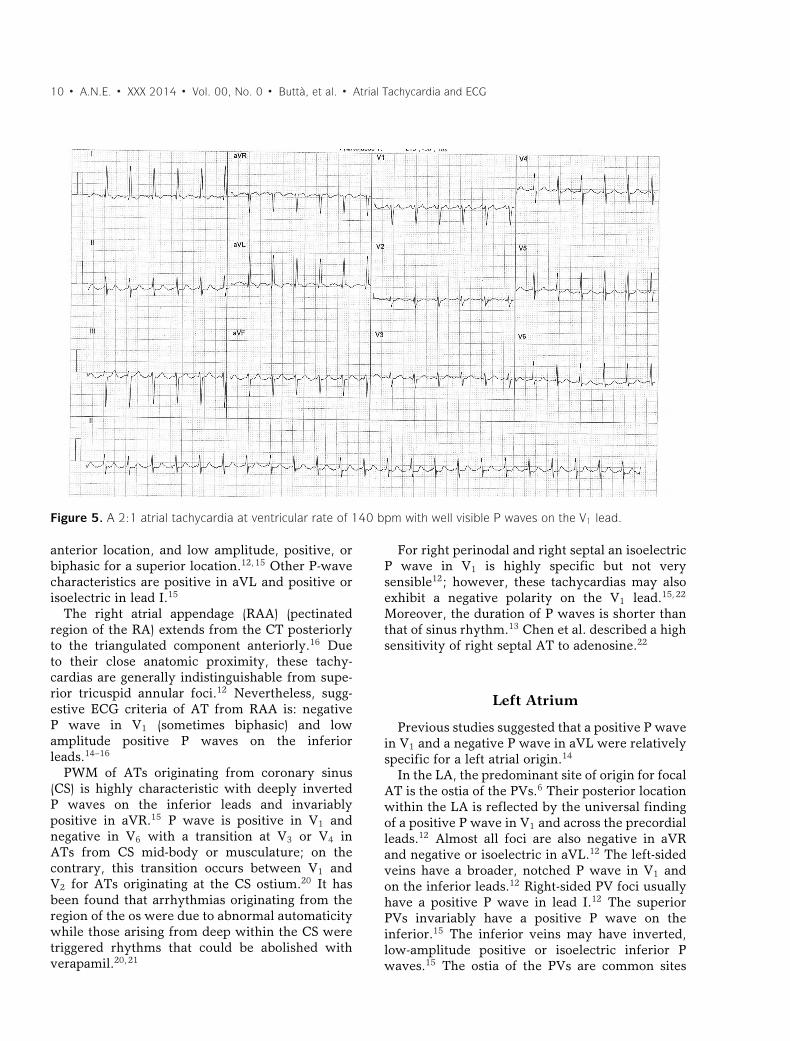
Figure 5. A 2:1 atrial tachycardia at ventricular rate of 140 bpm with well visible P waves on the V1 lead.
anterior location, and low amplitude, positive, orbiphasic for a superior location.12,15 Other P-wavecharacteristics are positive in aVL and positive orisoelectric in lead I.15
The right atrial appendage (RAA) (pectinatedregion of the RA) extends from the CT posteriorlyto the triangulated component anteriorly.16 Dueto their close anatomic proximity, these tachy-cardias are generally indistinguishable from supe-rior tricuspid annular foci.12 Nevertheless, sugg-estive ECG criteria of AT from RAA is: negativeP wave in V1 (sometimes biphasic) and lowamplitude positive P waves on the inferiorleads.14–16
PWM of ATs originating from coronary sinus(CS) is highly characteristic with deeply invertedP waves on the inferior leads and invariablypositive in aVR.15 P wave is positive in V1 andnegative in V6 with a transition at V3 or V4 inATs from CS mid-body or musculature; on thecontrary, this transition occurs between V1 andV2 for ATs originating at the CS ostium.20 It hasbeen found that arrhythmias originating from theregion of the os were due to abnormal automaticitywhile those arising from deep within the CS weretriggered rhythms that could be abolished withverapamil.20,21
For right perinodal and right septal an isoelectricP wave in V1 is highly specific but not verysensible12; however, these tachycardias may alsoexhibit a negative polarity on the V1 lead.15,22
Moreover, the duration of P waves is shorter thanthat of sinus rhythm.13 Chen et al. described a highsensitivity of right septal AT to adenosine.22
Left Atrium
Previous studies suggested that a positive P wavein V1 and a negative P wave in aVL were relativelyspecific for a left atrial origin.14
In the LA, the predominant site of origin for focalAT is the ostia of the PVs.6 Their posterior locationwithin the LA is reflected by the universal findingof a positive P wave in V1 and across the precordialleads.12 Almost all foci are also negative in aVRand negative or isoelectric in aVL.12 The left-sidedveins have a broader, notched P wave in V1 andon the inferior leads.12 Right-sided PV foci usuallyhave a positive P wave in lead I.12 The superiorPVs invariably have a positive P wave on theinferior.15 The inferior veins may have inverted,low-amplitude positive or isoelectric inferior Pwaves.15 The ostia of the PVs are common sites
A.N.E. � XXX 2014 � Vol. 00, No. 0 � Butta, et al. � Atrial Tachycardia and ECG � 11
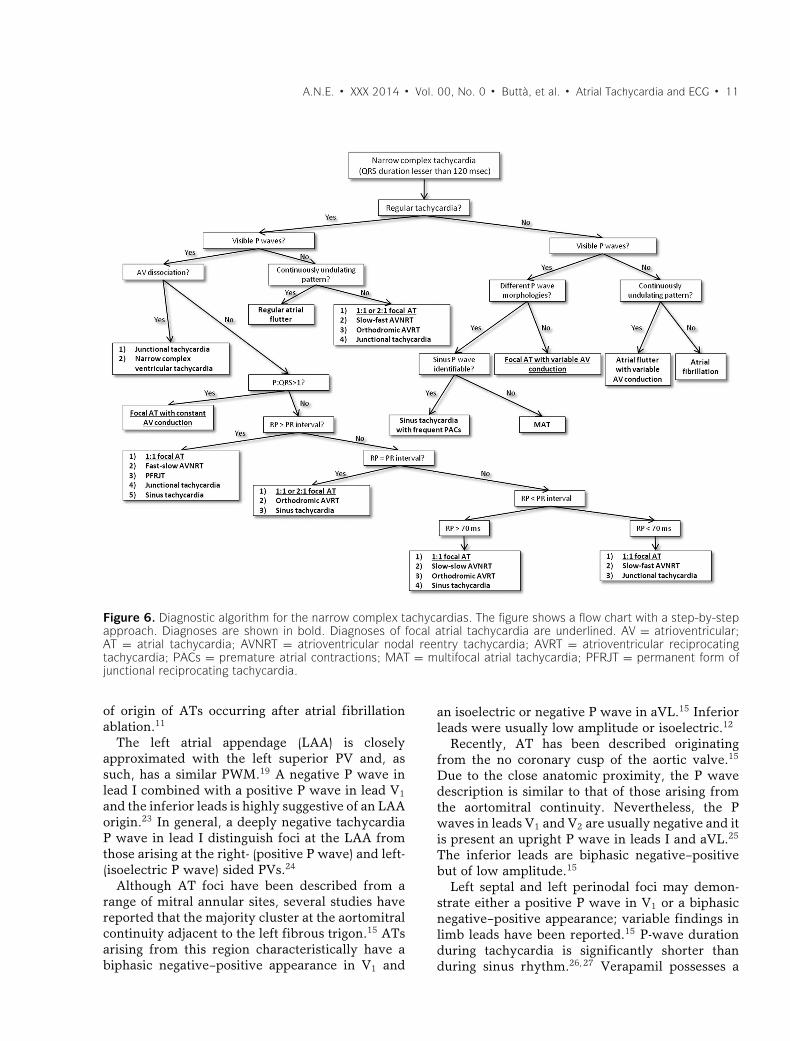
Figure 6. Diagnostic algorithm for the narrow complex tachycardias. The figure shows a flow chart with a step-by-stepapproach. Diagnoses are shown in bold. Diagnoses of focal atrial tachycardia are underlined. AV = atrioventricular;AT = atrial tachycardia; AVNRT = atrioventricular nodal reentry tachycardia; AVRT = atrioventricular reciprocatingtachycardia; PACs = premature atrial contractions; MAT = multifocal atrial tachycardia; PFRJT = permanent form ofjunctional reciprocating tachycardia.
of origin of ATs occurring after atrial fibrillationablation.11
The left atrial appendage (LAA) is closelyapproximated with the left superior PV and, assuch, has a similar PWM.19 A negative P wave inlead I combined with a positive P wave in lead V1and the inferior leads is highly suggestive of an LAAorigin.23 In general, a deeply negative tachycardiaP wave in lead I distinguish foci at the LAA fromthose arising at the right- (positive P wave) and left-(isoelectric P wave) sided PVs.24
Although AT foci have been described from arange of mitral annular sites, several studies havereported that the majority cluster at the aortomitralcontinuity adjacent to the left fibrous trigon.15 ATsarising from this region characteristically have abiphasic negative–positive appearance in V1 and
an isoelectric or negative P wave in aVL.15 Inferiorleads were usually low amplitude or isoelectric.12
Recently, AT has been described originatingfrom the no coronary cusp of the aortic valve.15
Due to the close anatomic proximity, the P wavedescription is similar to that of those arising fromthe aortomitral continuity. Nevertheless, the Pwaves in leads V1 and V2 are usually negative and itis present an upright P wave in leads I and aVL.25
The inferior leads are biphasic negative–positivebut of low amplitude.15
Left septal and left perinodal foci may demon-strate either a positive P wave in V1 or a biphasicnegative–positive appearance; variable findings inlimb leads have been reported.15 P-wave durationduring tachycardia is significantly shorter thanduring sinus rhythm.26,27 Verapamil possesses a
12 � A.N.E. � XXX 2014 � Vol. 00, No. 0 � Butta, et al. � Atrial Tachycardia and ECG
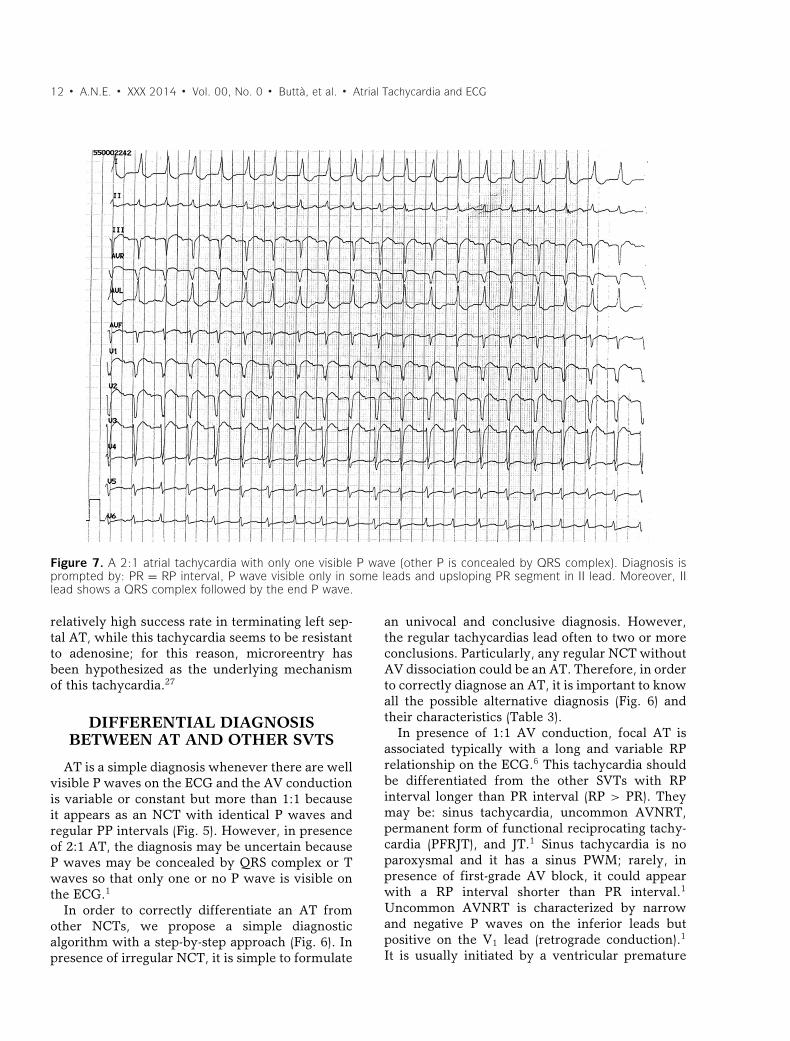
Figure 7. A 2:1 atrial tachycardia with only one visible P wave (other P is concealed by QRS complex). Diagnosis isprompted by: PR = RP interval, P wave visible only in some leads and upsloping PR segment in II lead. Moreover, IIlead shows a QRS complex followed by the end P wave.
relatively high success rate in terminating left sep-tal AT, while this tachycardia seems to be resistantto adenosine; for this reason, microreentry hasbeen hypothesized as the underlying mechanismof this tachycardia.27
DIFFERENTIAL DIAGNOSISBETWEEN AT AND OTHER SVTS
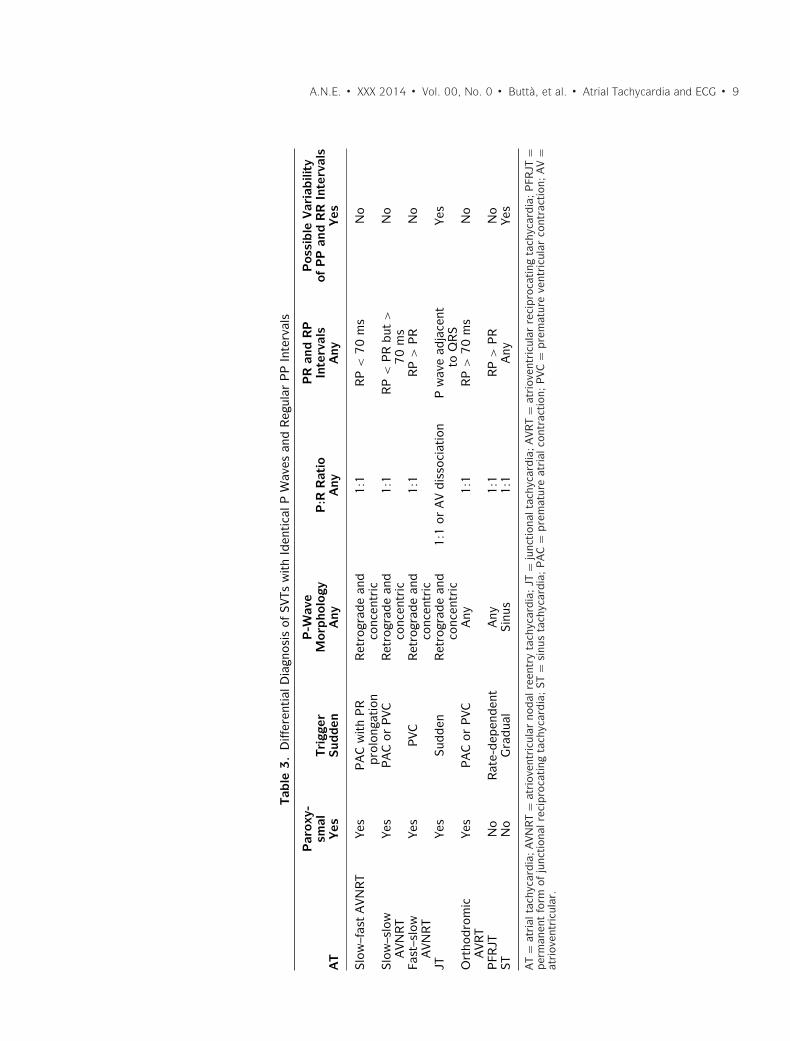
AT is a simple diagnosis whenever there are wellvisible P waves on the ECG and the AV conductionis variable or constant but more than 1:1 becauseit appears as an NCT with identical P waves andregular PP intervals (Fig. 5). However, in presenceof 2:1 AT, the diagnosis may be uncertain becauseP waves may be concealed by QRS complex or Twaves so that only one or no P wave is visible onthe ECG.1
In order to correctly differentiate an AT fromother NCTs, we propose a simple diagnosticalgorithm with a step-by-step approach (Fig. 6). Inpresence of irregular NCT, it is simple to formulate
an univocal and conclusive diagnosis. However,the regular tachycardias lead often to two or moreconclusions. Particularly, any regular NCT withoutAV dissociation could be an AT. Therefore, in orderto correctly diagnose an AT, it is important to knowall the possible alternative diagnosis (Fig. 6) andtheir characteristics (Table 3).
In presence of 1:1 AV conduction, focal AT isassociated typically with a long and variable RPrelationship on the ECG.6 This tachycardia shouldbe differentiated from the other SVTs with RPinterval longer than PR interval (RP > PR). Theymay be: sinus tachycardia, uncommon AVNRT,permanent form of functional reciprocating tachy-cardia (PFRJT), and JT.1 Sinus tachycardia is noparoxysmal and it has a sinus PWM; rarely, inpresence of first-grade AV block, it could appearwith a RP interval shorter than PR interval.1
Uncommon AVNRT is characterized by narrowand negative P waves on the inferior leads butpositive on the V1 lead (retrograde conduction).1
It is usually initiated by a ventricular premature
A.N.E. � XXX 2014 � Vol. 00, No. 0 � Butta, et al. � Atrial Tachycardia and ECG � 13
depolarization, is rarely sustained and it istypically constant.1,6,27 The PFRJT or reciprocatingtachycardia of Coumel is a particular orthodromicatrioventricular reciprocating tachycardia (AVRT)with an accessory pathway at low velocity (ratedependent) of conduction.28 It presents a noparoxysmal but incessant trend.1 Finally, JT mayrarely present retrograde P waves before QRScomplex (negative on the inferior leads and positivein V1).1
If an SVT presents a 1:1 AV conduction withalmost identical RP and PR intervals (RP = PR)and not sinus P wave, it may be a 1:1 AT or a2:1 AT with a P wave concealed by QRS complex(Fig. 7). In this case, AT should be distinguishedfrom sinus tachycardia and orthodromic AVRT.However, this tachycardia is usually triggered byan atrial or ventricular beat, it may present anyPWM and it is typically constant.1
Sometimes a 1:1 focal AT can show a short RPinterval, particularly at higher rates and increasedAV node conduction.6 When RP is shorter than PRinterval (RP < PR) but RP interval is longer than 70ms (RP > 70 ms), focal AT should be differentiatedfrom orthodromic AVRT, slow–slow AVNRT, andsinus tachycardia.1 Slow–slow AVNRT is rare, itpresents narrow and retrograde P waves and it istypically constant.1
Finally, if RP interval is shorter than 70 ms(RP < 70 ms), it is necessary to differentiate focalAT from common AVNRT and JT. The commonAVNRT is the most frequent form of paroxysmalSVT.1,3 It is a constant SVT that starts frequentlywith a supraventricular ectopic beat that presentsa prolongation of the PR interval on the ECG.1
P waves are narrow and they have a retrogrademorphology as well as JT.1
Whenever there is an SVT without visible Pwaves and without undulating pattern, it maybe: 1:1 or 2:1 AT, common AVNRT, orthodromicAVRT, or JT.1 In these cases, P waves are notvisible because they are concealed by T waves orQRS complex.
Holter analysis could offer further details todiscriminate between AT and another SVT. Itcould show start and finish typical of otherSVTs and some suggestive characteristics of AT.In fact, AT secondary to enhanced automaticitypresents generally a progressive rate increase attachycardia onset (warm-up) and/or a progressiverate decrease before tachycardia termination (cool
down).2 Moreover, PP and RR intervals mayvary slightly during AT.6 Finally, a Wenckebachconduction during an SVT is suggestive of AT.4
According to these criteria, AT is sometimesa diagnosis of exclusion on the ECG (Table 3).Therefore, if the diagnosis is uncertain, it ispossible to utilize vagal maneuvers, such as sinuscarotid massage, or adenosine administration.6
They cause generally a transient suppression ofAV node so that P waves become evident and thediagnosis of AT is feasible.6 However, adenosinecan effectively terminate focal AT related totriggered activity and microreentry29 as well asreentry tachycardias (AVRT or AVNRT).
CONCLUSIONS
AT is a paroxysmal SVT that could present:any PWM, any AV conduction, any RP orPR intervals, and a “warm-up” and “cool-down”phenomenon. Our ECG reports represented adiagnostic challenge in our clinical practice andthey showed as any SVT with identical P wavesand regular PP or RR intervals could be an AT.However, a good knowledge and interpretation ofthe ECG could help the physician to differentiatefocal and macroreentrant AT from the otherSVTs and to manage and to treat correctly thesepatients; moreover, the PWM analysis could bea very helpful tool in directing mapping duringelectrophysiological study.
In this article, we showed two ECG reportsand a review of main current electrocardiographicfindings about AT.
REFERENCES1. Butta C, Tuttolomondo A, Di Raimondo D, et al. The
supraventricular tachycardias: Proposal of a diagnosticalgorithm for the narrow complex tachycardias. J Cardiol2013;61:247–255.
2. Saoudi N, Cosıo F, Waldo A, et al. A classification ofatrial flutter and regular atrial tachycardia according toelectrophysiological mechanisms and anatomical bases. Astatement from a joint expert group from the working groupof arrhythmias of the European Society of Cardiology andthe North American Society of Pacing and Electrophysiol-ogy. Eur Heart J 2001;22:1162–1182.
3. Blomstrom-Lundqvist C, Scheinman MM, Aliot EM, et al.ACC/AHA/ESC guidelines for the management of patientswith supraventricular arrhythmias—Executive summary. Areport of the American College of Cardiology/ AmericanHeart Association Task Force on Practice Guidelines andthe European Society of Cardiology Committee for PracticeGuidelines. J Am Coll Cardiol 2003;42:1493–1531.
14 � A.N.E. � XXX 2014 � Vol. 00, No. 0 � Butta, et al. � Atrial Tachycardia and ECG
4. Oreto G: I disordini del ritmo cardiaco. Torino, CentroScientifico Editore, 1997.
5. Butta C, Tuttolomondo A, Di Raimondo D, et al. Effectof atrial capture beats on the subsequent cycle duringslow common atrioventricular nodal reentry tachycardia.J Cardiovasc Electrphysiol 2013;24:474–475.
6. Rosso R, Kistler PM. Focal atrial tachycardia. Heart2010;96:181–185.
7. Butta C, Tuttolomondo A, Di Raimondo D, et al. A re-entrytachycardia triggered by the spontaneous interruption of anatrial tachicardia. J Cardiovasc Med 2013 [Epub ahead ofprint].
8. Lindsay BD. Focal and macro reentrant atrial tachycardia:From bench to bedside and back to the bench again. HeartRhythm 2007;4:1361–1363.
9. Miyazaki S, Shah AJ, Kobori A, et al. How to approachreentrant atrial tachycardia after atrial fibrillation ablation.Circ Arrhythm Electrophysiol 2011;5:e1–e7.
10. Butta C, Tuttolomondo A, Giarrusso L, et al. A particularbigeminy during atrial tachycardia. Neth Heart J 2014 [Epubahead of print].
11. Gerstenfeld EP, Marchlinski FE. Mapping and ablationof left atrial tachycardias occurring after atrial fibrillationablation. Heart Rhythm 2007;4:S65–S72.
12. Kistler PM, Roberts-Thomson KC, Haqqani HM, et al.P-wave morphology in focal atrial tachycardia: Develop-ment of an algorithm to predict the anatomic site of origin.J Am Coll Cardiol 2006;48:1010–1017.
13. Tada H, Nogami A, Naito S, et al. Simple electrocar-diographic criteria for identifying the site of origin offocal right atrial tachycardia. Pacing Clin Electrophysiol1998;21:2431–2439.
14. Tang CW, Scheinman MM, Van Hare GF, et al. Use of Pwave configuration during atrial tachycardia to predict siteof origin. J Am Coll Cardiol 1995;26:1315–1324.
15. Teh AW, Kistler PM, Kalman JM. Using the 12-lead ECGto localize the origin of ventricular and atrial tachycardias:Part 1. Focal atrial tachycardia. J Cardiovasc Electrophysiol2009;20:706–709.
16. Roberts-Thomson KC, Kistler PM, Haqqani HM, et al. Focalatrial tachycardias arising from the right atrial appendage:Electrocardiographic and electrophysiologic characteristicsand radiofrequency ablation. J Cardiovasc Electrophysiol2007;18:367–372.
17. Kalman JM, Olgin JE, Karch MR, et al. “Cristal tachycar-dias”: Origin of right atrial tachycardias from the crista
terminalis identified by intracardiac echocardiography. JAm Coll Cardiol 1998;31:451–459.
18. Saffitz JE, Kanter HL, Green KG, et al. Tissue-specificdeterminants of anisotropic conduction velocity in canineatrial and ventricular myocardium. Circ Res 1994;74:1065–1070.
19. Roberts-Thomson KC, Kistler PM, Kalman JM. Focal atrialtachycardia: II. Management. Pacing Clin Electrophysiol2006;29:769–778.
20. Badhwar N, Kalman JM, Sparks PB, et al. Atrial tachycardiaarising from the coronary sinus musculature. J Am CollCardiol 2005;46:1921–1930.
21. Wit AL, Cranefield PF. Triggered and automatic activity inthe canine coronary sinus. Circ Res 1977;41:434–445.
22. Chen CC, Tai CT, Chiang CE, et al. Atrial tachycardiasoriginating from the atrial septum: Electrophysiologiccharacteristics and radiofrequency ablation. J CardiovascElectrophysiol 2000;11:744–749.
23. Kistler PM. The left atrial appendage: Not just an inno-cent bystander. J Cardiovasc Electrophysiol 2007;18:465–466.
24. Kistler PM, Sanders P, Fynn SP, et al. Electrophysiologicaland electrocardiographic characteristics of focal atrial tachy-cardia originating from the pulmonary veins: Acute andlong-term outcomes of radiofrequency ablation. Circulation2003;108:1968–1975.
25. Ouyang F, Ma J, Ho SY, et al. Focal atrial tachycardiaoriginating from the non-coronary aortic sinus: Electrophys-iological characteristics and catheter ablation. J Am CollCardiol 2006;48:122–131.
26. Frey B, Kreiner G, Gwechenberger M, et al. Ablationof atrial tachycardia originating from the vicinity of theatrioventricular node: Significance of mapping both sidesof the interatrial septum. J Am Coll Cardiol 2001;38:394–400.
27. Marrouche NF, SippensGroenewegen A, Yang Y, etal. Clinical and electrophysiologic characteristics of leftsepal atrial tachycardia. J Am Coll Cardiol 2002;40:1133–1139.
28. Ganz LI, Friedman PL. Supraventricular tachycardia. NEngl J Med 1995;332:162–173.
29. Chen SA, Chiang CE, Yang CJ, et al. Sustained atrial tachy-cardia in adult patients. Electrophysiological characteristics,pharmacological response, possible mechanisms, and ef-fects of radiofrequency ablation. Circulation 1994;90:1262–1278.