electricity generation in fiji: assessing the impact of...
TRANSCRIPT
Electricity Generation in Fiji: Assessing the Impact of Renewable Technologies on Costs and Financial Risk Matthew Dornan* and Frank Jotzo Resource Management in Asia-Pacific Program, Crawford School of Economics and Government, The Australian National University. *Corresponding author/presenter. E-mail Address: [email protected] Australian Agricultural and Resource Economics Society 55th Annual National Conference, Melbourne , 8-11 February, 2011
Electricity Generation in Fiji: Assessing the Impact of Renewable Technologies on Costs and Financial Risk Matthew Dornan* and Frank Jotzo Resource Management in Asia-Pacific Program, Crawford School of Economics and Government, The Australian National University. *Corresponding author and presenter. E-mail Address: [email protected]
Abstract In recent years, renewable energy technologies have been advocated in Fiji on the basis that they improve energy security and serve as a risk-mitigation measure against oil price volatility. Despite this, there have been few attempts to measure the impact of renewable technologies on energy security. That analysis is important if the benefits of renewable energy technologies in Fiji are to be adequately evaluated. This paper develops and applies a method for assessing the potential contribution of renewable technologies to the security of electricity supply in Fiji. The method is based on an application of portfolio theory, traditionally used in financial markets, to the electricity generation mix in Fiji. The results demonstrate the impact of different renewable technologies on both portfolio generation cost and risk for Fijian electricity grids. Key Words: renewable energy technologies, energy policy, electricity sector, Fiji, oil prices, portfolio analysis, Pacific islands Contents 1. Introduction 2. Context: The Impact of Oil Price Volatility in the Pacific Islands 3. The Electricity Sector in Fiji 4. Future Electricity Generation Options in Fiji 5. Economic Evaluation of Electricity Sector Investments: 6. Method: Applying Portfolio Theory to Fiji’s Electricity Sector a. Basic Method b. Modelling
c. Data Used in the Analysis 7. Modelling Results and Analysis a. Cost and Risk Implications of Different Technology ‘Portfolios’ b. The Impact of Changes in Total Demand c. Discussion 8. Conclusion
1. Introduction In recent years, renewable energy technologies have been advocated in Fiji and other Pacific island countries on the basis that they improve energy security by serving as a risk-mitigation measure against high oil prices. These arguments in favour of renewable energy technologies (renewables), grounded in economic and security language, differ to those of the past, which advocated renewables for rural electrification on primarily environmental and social grounds. This change in emphasis is the result of significant oil price volatility in recent years and especially the oil price spike in 2008, which adversely affected the economies and energy security of Pacific island countries. The case for renewables in Fiji has been argued particularly strongly in the electricity sector, where the government owned Fiji Electricity Authority has pursued a strategy of investment in renewable technologies in order to move away from oil-based power generation. Key among these has been the construction of the Nadarivatu hydro-power scheme, which when completed in 2012 will be the second largest hydro scheme built in Fijian history (FEA 2007a, 2008a). Other investments in Fiji include the Butoni wind farm, installation of co-generation plants in the timber and sugar industries, and various smaller hydro-power schemes. Despite these developments, there have been few attempts to rigorously assess or quantify the impact of renewable technologies on financial risk in Fiji’s electricity sector. These assessments are important if the true contribution of renewables to Fiji’s electricity sector is to be adequately evaluated. This paper attempts to addresses this gap in knowledge by developing and applying a method for simultaneously assessing the potential contribution of renewable technologies to the security and cost of electricity supply in Fiji. Portfolio theory is applied in custom-built stochastic simulation model to scenarios of future electricity generation mix in Fiji, showing the impact of different renewable technologies on both expected portfolio generation cost and financial risk for the Fiji electricity grid. Several policy recommendations arise from the findings of the model.
2. Context: The Impact of Oil Price Volatility in the Pacific Islands The economies of Pacific island countries have been adversely affected in recent years by high oil prices, culminating in the record oil prices of 2008 (see figure 1). The effects of these prices on Pacific economies have been documented elsewhere, and included fiscal and current account blowouts (ADB 2008; Levantis 2008a, b; Levantis et al. 2006; Tumbarello 2008; UNDP 2007). In Fiji, the value of oil imports rose from approximately 5 per cent to 12 per cent of Gross Domestic Product (GDP) between 2002 and 2008. This effectively meant a negative impact on Gross National Income of 7 per cent, and contributed to Fiji’s lacklustre economic performance over recent years.
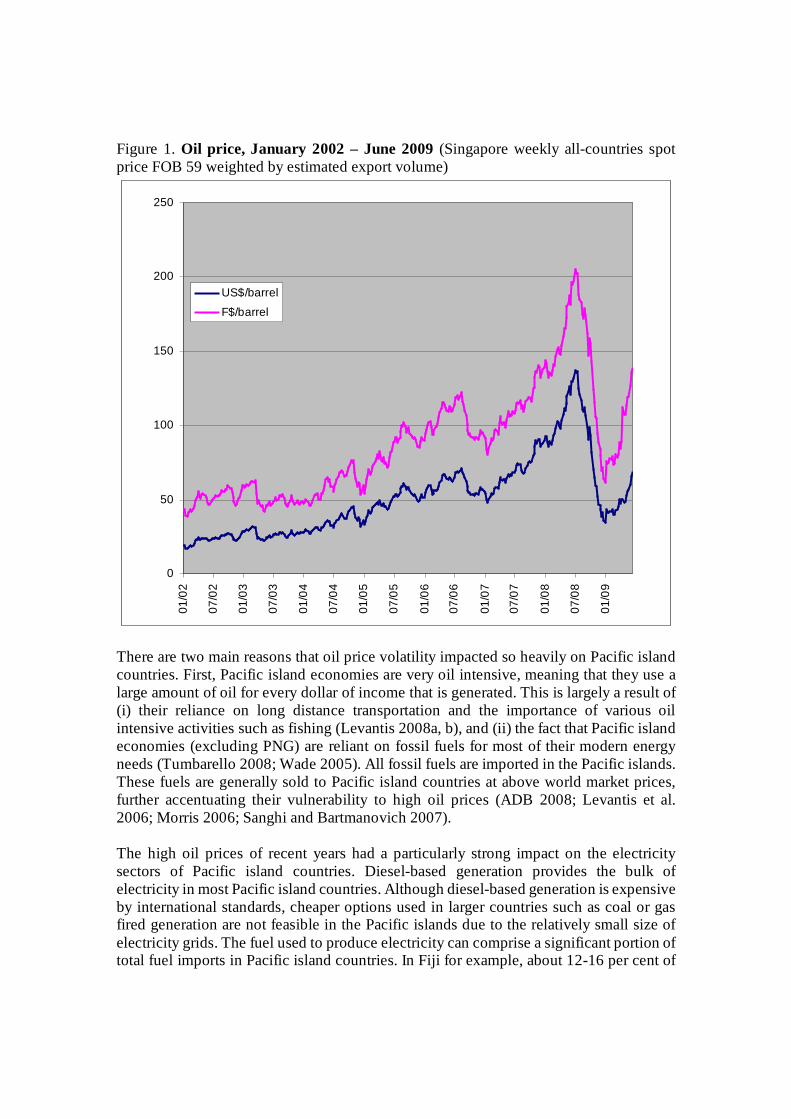
Figure 1. Oil price, January 2002 – June 2009 (Singapore weekly all-countries spot price FOB 59 weighted by estimated export volume)
0
50
100
150
200
250
01/0
2
07/0
2
01/0
3
07/0
3
01/0
4
07/0
4
01/0
5
07/0
5
01/0
6
07/0
6
01/0
7
07/0
7
01/0
8
07/0
8
01/0
9
US$/barrel
F$/barrel
There are two main reasons that oil price volatility impacted so heavily on Pacific island countries. First, Pacific island economies are very oil intensive, meaning that they use a large amount of oil for every dollar of income that is generated. This is largely a result of (i) their reliance on long distance transportation and the importance of various oil intensive activities such as fishing (Levantis 2008a, b), and (ii) the fact that Pacific island economies (excluding PNG) are reliant on fossil fuels for most of their modern energy needs (Tumbarello 2008; Wade 2005). All fossil fuels are imported in the Pacific islands. These fuels are generally sold to Pacific island countries at above world market prices, further accentuating their vulnerability to high oil prices (ADB 2008; Levantis et al. 2006; Morris 2006; Sanghi and Bartmanovich 2007). The high oil prices of recent years had a particularly strong impact on the electricity sectors of Pacific island countries. Diesel-based generation provides the bulk of electricity in most Pacific island countries. Although diesel-based generation is expensive by international standards, cheaper options used in larger countries such as coal or gas fired generation are not feasible in the Pacific islands due to the relatively small size of electricity grids. The fuel used to produce electricity can comprise a significant portion of total fuel imports in Pacific island countries. In Fiji for example, about 12-16 per cent of
imported fuel in 2009 (excluding aircraft turbine fuel) was used to generate electricity for the grid. This normally amounts to between 1.5 and 2 per cent of GDP, depending on the year. In several Pacific island countries high oil prices led to crises in state-owned electricity sectors, which were not permitted to increase tariff rates to reflect rising generation costs. Electricity was rationed in several cases as a result.
3. The Electricity Sector in Fiji In Fiji, energy security arguments have been used to support a range of investments in renewable energy technologies. This has been most pronounced in the electricity sector, where the state-owned Fiji Electricity Authority (FEA), the monopoly provider of grid-based electricity in Fiji, had stated that its goal in implementing renewable energy projects is to reduce its fuel importation bill and lessen its exposure to oil price volatility (FEA 2008b). The FEA has also established a goal of generating 90 per cent of its electricity using renewable energy technologies by 2011 – a goal that has not been met (FEA 2007a, 2008a). The FEA operates four electricity grids: one on the island of Viti Levu, two on the island of Vanua Levu (the Labasa and Savusavu grids), and one on Ovalau. Together, these grids have a peak load of 138 MW, and supply electricity to over 74 per cent of Fiji’s population.1 The Viti Levu grid, known as the Viti Levu Interconnected System (VLIS), is by far the largest of these grids, representing over 94 per cent of FEA generation.2 It also accounts for almost all electricity produced by renewable technologies, with most electricity generation in the three small grids produced using oil-based generators.3 In 2009, the FEA supplied a record 777 GWh of electricity, which represented a 47 per cent increase on generation in 1999.4 Fiji is different to other countries in the region that rely on diesel-based electricity generation for their power supplies, as a substantial proportion of its electricity is already met from renewable energy sources. The two main sources of electricity in Fiji are hydro-
1 The 2007 Census shows that 11 per cent of Fijian households remain un-electrified, 6 per cent are supplied by an off-grid electricity generation system supplied by the Department of Energy, 5 per cent generate their own power, and 1 per cent are supplied by the Public Works Department. Most systems provide power for only several hours each day. 2 Of the peak load, the VLIS accounts for 126 MW, the Labasa grid for 6.5 MW, Savusavu for 1.9 MW, and Ovalau for 3.6 MW. 3 The exceptions are a small 0.8 MW hydro-power station at Wainiqeu that is capable of supplying about 2 GWh each year to the Savusavu grid, and the Labasa sugar mill that supplies small amounts of electricity to the Labasa grid in Vanua Levu. 4 Generation in 1999 measured 528 GWh, which means that demand has increased at an average rate of about 4.7 per cent annually in the ten-year period. Demand has increased every year since 1999, with the exception of 1999-2000, where it fell as a result of low economic growth linked to the civilian coup of 2000. Increases in electricity demand since 1999 are the result of both increases in demand of existing households, and the extension of the grids to more households (FEA Annual Reports, various years).
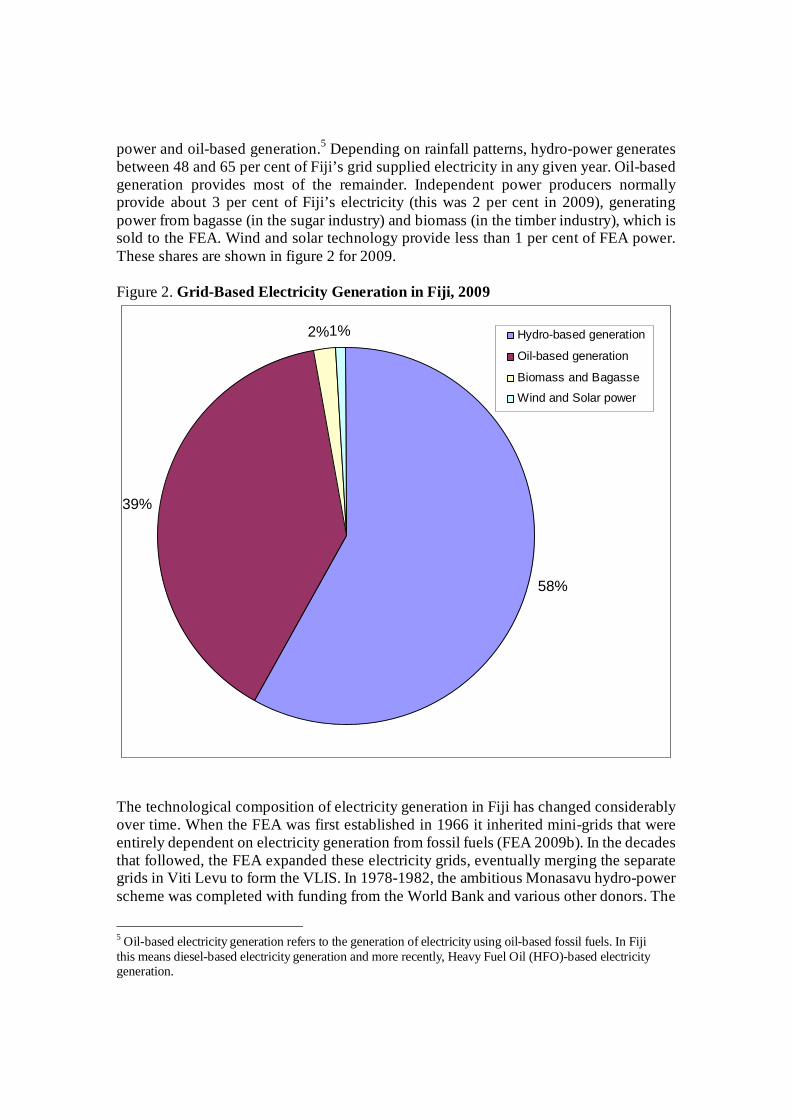
power and oil-based generation.5 Depending on rainfall patterns, hydro-power generates between 48 and 65 per cent of Fiji’s grid supplied electricity in any given year. Oil-based generation provides most of the remainder. Independent power producers normally provide about 3 per cent of Fiji’s electricity (this was 2 per cent in 2009), generating power from bagasse (in the sugar industry) and biomass (in the timber industry), which is sold to the FEA. Wind and solar technology provide less than 1 per cent of FEA power. These shares are shown in figure 2 for 2009. Figure 2. Grid-Based Electricity Generation in Fiji, 2009
58%
39%
2%1% Hydro-based generation
Oil-based generation
Biomass and Bagasse
Wind and Solar power
The technological composition of electricity generation in Fiji has changed considerably over time. When the FEA was first established in 1966 it inherited mini-grids that were entirely dependent on electricity generation from fossil fuels (FEA 2009b). In the decades that followed, the FEA expanded these electricity grids, eventually merging the separate grids in Viti Levu to form the VLIS. In 1978-1982, the ambitious Monasavu hydro-power scheme was completed with funding from the World Bank and various other donors. The
5 Oil-based electricity generation refers to the generation of electricity using oil-based fossil fuels. In Fiji this means diesel-based electricity generation and more recently, Heavy Fuel Oil (HFO)-based electricity generation.
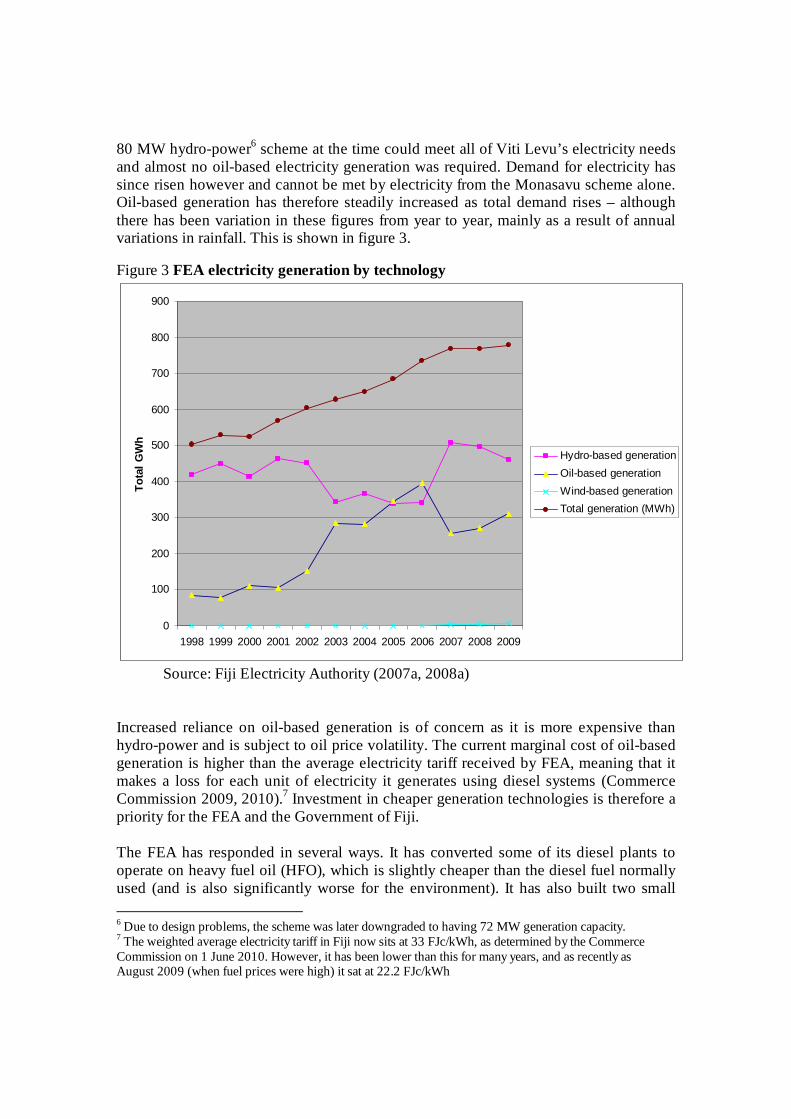
80 MW hydro-power6 scheme at the time could meet all of Viti Levu’s electricity needs and almost no oil-based electricity generation was required. Demand for electricity has since risen however and cannot be met by electricity from the Monasavu scheme alone. Oil-based generation has therefore steadily increased as total demand rises – although there has been variation in these figures from year to year, mainly as a result of annual variations in rainfall. This is shown in figure 3. Figure 3 FEA electricity generation by technology
0
100
200
300
400
500
600
700
800
900
1998 1999 2000 2001 2002 2003 2004 2005 2006 2007 2008 2009
Tota
l GW
h
Hydro-based generationOil-based generationWind-based generationTotal generation (MWh)
Source: Fiji Electricity Authority (2007a, 2008a) Increased reliance on oil-based generation is of concern as it is more expensive than hydro-power and is subject to oil price volatility. The current marginal cost of oil-based generation is higher than the average electricity tariff received by FEA, meaning that it makes a loss for each unit of electricity it generates using diesel systems (Commerce Commission 2009, 2010).7 Investment in cheaper generation technologies is therefore a priority for the FEA and the Government of Fiji. The FEA has responded in several ways. It has converted some of its diesel plants to operate on heavy fuel oil (HFO), which is slightly cheaper than the diesel fuel normally used (and is also significantly worse for the environment). It has also built two small 6 Due to design problems, the scheme was later downgraded to having 72 MW generation capacity. 7 The weighted average electricity tariff in Fiji now sits at 33 FJc/kWh, as determined by the Commerce Commission on 1 June 2010. However, it has been lower than this for many years, and as recently as August 2009 (when fuel prices were high) it sat at 22.2 FJc/kWh
6MW and 1.8MW hydro-power stations, which supplied about 24 GWh of electricity in 2009, and a 10 MW wind farm. The FEA has also continued to purchase electricity from the Fiji Sugar Corporation and has begun buying electricity from a 9.3 MW biomass plant operated by Tropik Wood. These measures have reduced but not stopped the growth of oil-based generation. Lastly and most importantly, the FEA is constructing a 40 MW hydro-power plant in Nadarivatu with a concessionary loan from China. This is expected to generate about 101 GWh of electricity per year, or a little more than one-fourth of power production at Monasavu. Oil-based generation should decline by about one-third of current levels as a result (FEA 2007b, 2008a, b, 2009a).
4. Future Electricity Generation Options in Fiji Present day electricity generation in Fiji is dominated by hydro-power and oil-based generation, with small amounts also coming from wind and solar power, biomass (from the timber industry) and bagasse (from the sugar industry). There is considerable scope for several of these less utilised sources to produce larger amounts of electricity if investments in generation equipment are made. There is also some scope for electricity generation from technologies not currently used in Fiji, some of which may be more economical than oil-based generation. These options and the scope for expanding generation in the future are described briefly below. Hydro-based Generation Hydro-power is the cheapest source of electricity available to the FEA, and currently accounts for over half of Fiji’s electricity production (producing 460 GWh in 2009, with capacity of 80.7 MW). This will increase significantly once the 40 MW-capacity Nadarivatu project is completed. Reports commissioned by the Department of Energy (Snowy Mountains Engineering Corporation 2009; Vega 2001) estimate that there is probably the potential in Viti Levu for another three or four projects similar in size to Nadarivatu, which together would generate approximately 300 to 400 GWh of electricity each year (the 400 GWh figure is used in this analysis). These projects would be small run-of-the-river schemes, like Nadarivatu, and are therefore likely to a) have higher generation costs, and b) require more back-up capacity than the existing Monasavu scheme. The model presented below distinguishes between ‘new’ and ‘existing’ hydro in order to incorporate these differences.
Oil-based Generation Oil-based electricity generation plays a special role in the FEA’s generation mix. As the only non-renewable technology used by the FEA, oil-based generation is not affected by rainfall or wind patterns, or by changes in sugar or timber production.8 This means that that it can be increased to fill the gap between demand and supply when there is reduced generation from hydro-power stations and other renewable technologies (as explained in more detail below). Due to its high cost, oil-based generation in Fiji is used mainly to meet peak load requirements or when electricity generation from hydro-power stations is low due to poor rainfall. There is considerable variation in oil-based generation in Fiji as a result, both on a seasonal and annual basis. In effect, oil-based generation is the inverse of hydro-based generation: when one rises, the other falls. The model incorporates oil-based generation in the same way, where it meets demand not met by renewable capacity (which is variable in the model). There is no limit in potential oil-based generation in Fiji. Both generators and fuel can be purchased readily from overseas. Bagasse-based Generation The Fiji Sugar Corporation currently produces electricity from bagasse, a bi-product of the sugar cane crushing process. Electricity generation from the 31 MW capacity plant is seasonal, occurring during the dry season when sugar cane crushing takes place. Electricity generation from bagasse is cheaper than oil-based generation in Fiji, although production can be affected by weather patterns and often stops during rain periods. This means that electricity from biomass and bagasse cannot be relied upon as ‘solid’ generation, and requires backup capacity (in the form of oil-based generation capacity) in the event that production ceases. The FSC has indicated that it could generate approximately 90 MW of power during the sugar cane crushing season if new generators are installed in its mills (this would equate to 209 GWh based on current capacity-production ratios). Biomass-based Generation Tropik Wood Industries Limited began generating electricity using biomass waste from timber production in May 2008. It is expected that the 9.3 MW generator currently in place could produce 24 GWh of power if it were fully operational (Snowy Mountains Engineering Corporation 2009). Generation costs are significantly lower than those of oil-based generators, and are slightly lower than the production costs of the Fiji Sugar Corporation. 8 Coal and gas is not used to generate electricity in Fiji, and is not cost-competitive against the technologies listed here at the small scale of operations in Fiji.

The FEA estimates the most likely maximum level of biomass-based electricity generation is 140 GWh per year (from 24 MW of capacity), although this depends on the development of the timber industry in Fiji. The model assumes that capacity from biomass technology does not exceed 24 MW for all but one scenario. Wind-based Generation Fiji’s only experience with grid-connected wind-based electricity generation is the Butoni wind farm, which was commissioned in July 2007. An important determinant of the levelised cost of wind-based electricity production is the capacity factor of a wind farm (actual generation as a percentage of possible generation), which is determined in large part by local wind speeds. Power production from the 10 MW Butoni wind farm has been lower than anticipated as a result of poor wind speeds, with average annual production of 5.535 GWh per year. This makes electricity produced from wind-power in Fiji extremely expensive. Wind monitoring by the Department of Energy suggests that there are no locations in Fiji where wind speeds are significantly higher than at Butoni which are also located near the electricity grid. Solar-based Generation Grid-connected solar-based generation has been very limited to date in Fiji. Despite high solar insolation rates in Fiji, ranging from 4.5 to 5.7 kWh/m2 per day (Vega 2001), the cost of solar-based grid-connected electricity generation is likely to remain higher than the other technologies listed here (with the possible exception of wind-power). Geothermal-based Generation Although there is currently no geothermal-based electricity generation in Fiji, there is evidence of geothermal resources in both Vanua Levu and Viti Levu.9 The model below assumes an upper limit of geothermal generation of 15 MW based on a pre-feasibility study conducted in 2009 (Nittetsu Mining Consultants Co. Ltd. 2009). This would involve 5 MW power stations placed at the two large deposits in Viti Levu (Tavua and Busa), and at one location in Vanua Levu (either near Savusavu or Labasa).
5. Economic Evaluation of Electricity Sector Investments The most common method traditionally used to evaluate electricity sector investments has been cost-benefit analysis, which allows for a comparison of the cost and benefits of an investment. The evaluation of competing electricity generation technologies has in 9 A preliminary feasibility study commissioned by the Japanese Ministry of Economy, Trade and Industry in March 2009 indicates that there is potential for 23 MW of geothermal-based electricity generation in Vanua Levu, at least 20 MW of which is near to the urban centres of Savusavu and Labasa (10 MW is near to each grid). Some of these resources could supply a 5 MW power plant, with the remainder being smaller.
turn occurred through least-cost analysis, which enables the identification of the cheapest technology that can be used to supply a given amount of electricity. In recent years, there has been increasing criticism of such traditional ‘engineering-economic’ methods of evaluation, with concern that they do not fully take into account the many benefits of renewable technologies. Chief among these criticism has been arguments that least-cost analyses: (i) look at technologies on a stand-alone basis only, (ii) do not take into account the risk reducing properties of many renewable technologies, and (iii) do not adequately measure the environmental or social benefits of renewable technologies (although increasingly attempts have been made to ensure this occurs through shadow pricing) (Awerbuch 2000, 2006; Awerbuch and Sauter 2006). Portfolio theory has been suggested as an alternative method to least-cost analysis for evaluating electricity sector investments. Portfolio theory (specifically, mean variance portfolio theory) is traditionally used in financial markets, and was developed by Harry Markowitz as a method of valuing financial market securities based on the return and risk implications of each security for a portfolio of financial securities (Awerbuch and Sauter 2006). The value of any security or investment under portfolio theory has two components: its expected (mean) return and the risk associated with that return (being the risk that the actual return from the security will differ to its expected return). The risk of a security is defined as the standard deviation of past returns (Markowitz 1952). Higher returns are generally associated with a higher level of risk. A portfolio analysis considers the return and risk implications of a security in terms of its impact on the return and risk of an investor’s portfolio of securities. In order to do this, the historical returns of that security are correlated with those of the portfolio and their correlation coefficient estimated. Where the returns of the security in question are highly correlated with those of the portfolio, it will increase the risk of the portfolio. This is because at a time when the returns of the portfolio are low, the security in question is also likely to provide low returns. On the other hand, if the returns of the security in question are negatively correlated with the returns of the portfolio, its inclusion in the portfolio will reduce the total risk associated with the portfolio. This is fairly intuitive. If a person has shares that are likely to fall in value in the event of a recession (eg, mining stocks), it would make sense to ‘hedge’ this risk by purchasing shares that will not be negatively affected by a recession, or at least will be less affected (eg, a budget supermarket chain).10
10 The idea can be demonstrated for a portfolio of two securities in the simple equations below The expected portfolio return, E(rp), is the weighted average of the expected returns of each security, E(ri): )()( 2211 rEXrEXrE p
Where X1 and X2 are the proportions of the portfolio made up of security 1 and security 2, and E(r1) and E(r2) are the expected (mean) returns of security 1 and security 2. Portfolio risk, σp, is based in part on the weighted average of the risk of each individual security, but is also determined by the correlation between the two securities:
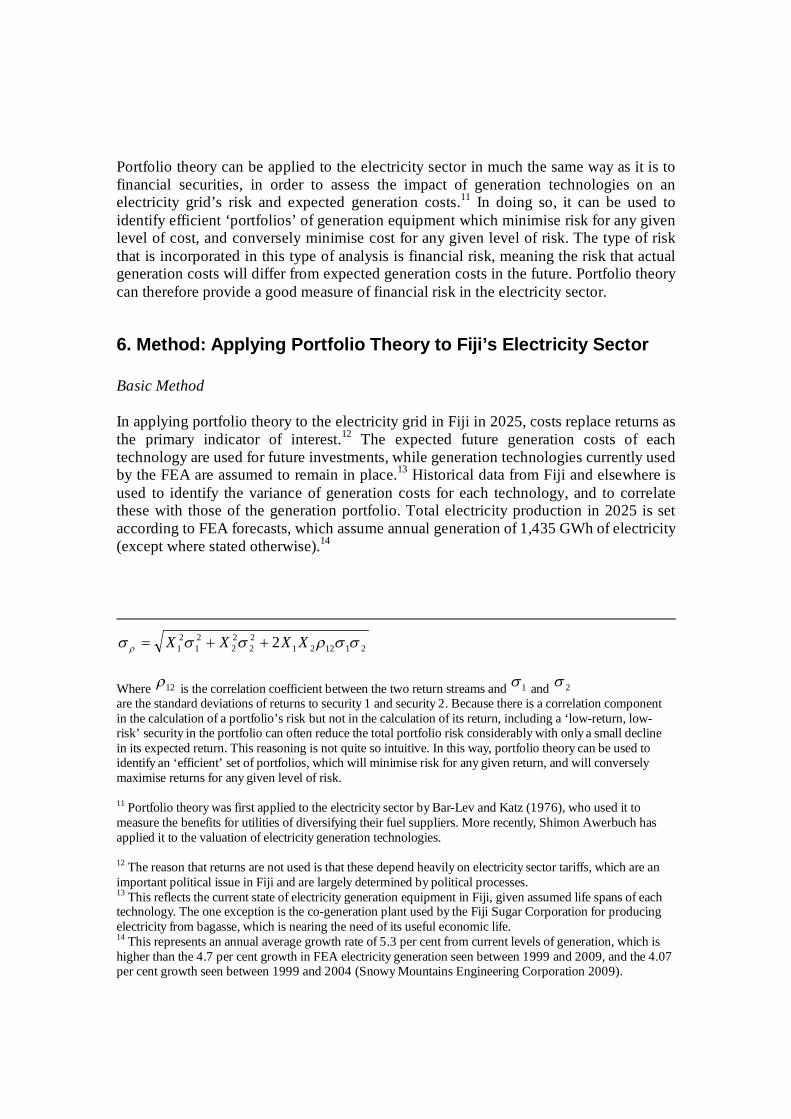
Portfolio theory can be applied to the electricity sector in much the same way as it is to financial securities, in order to assess the impact of generation technologies on an electricity grid’s risk and expected generation costs.11 In doing so, it can be used to identify efficient ‘portfolios’ of generation equipment which minimise risk for any given level of cost, and conversely minimise cost for any given level of risk. The type of risk that is incorporated in this type of analysis is financial risk, meaning the risk that actual generation costs will differ from expected generation costs in the future. Portfolio theory can therefore provide a good measure of financial risk in the electricity sector.
6. Method: Applying Portfolio Theory to Fiji’s Electricity Sector Basic Method In applying portfolio theory to the electricity grid in Fiji in 2025, costs replace returns as the primary indicator of interest.12 The expected future generation costs of each technology are used for future investments, while generation technologies currently used by the FEA are assumed to remain in place.13 Historical data from Fiji and elsewhere is used to identify the variance of generation costs for each technology, and to correlate these with those of the generation portfolio. Total electricity production in 2025 is set according to FEA forecasts, which assume annual generation of 1,435 GWh of electricity (except where stated otherwise).14
21122122
22
21
21 2 XXXX
Where 12 is the correlation coefficient between the two return streams and 1 and 2 are the standard deviations of returns to security 1 and security 2. Because there is a correlation component in the calculation of a portfolio’s risk but not in the calculation of its return, including a ‘low-return, low-risk’ security in the portfolio can often reduce the total portfolio risk considerably with only a small decline in its expected return. This reasoning is not quite so intuitive. In this way, portfolio theory can be used to identify an ‘efficient’ set of portfolios, which will minimise risk for any given return, and will conversely maximise returns for any given level of risk. 11 Portfolio theory was first applied to the electricity sector by Bar-Lev and Katz (1976), who used it to measure the benefits for utilities of diversifying their fuel suppliers. More recently, Shimon Awerbuch has applied it to the valuation of electricity generation technologies. 12 The reason that returns are not used is that these depend heavily on electricity sector tariffs, which are an important political issue in Fiji and are largely determined by political processes. 13 This reflects the current state of electricity generation equipment in Fiji, given assumed life spans of each technology. The one exception is the co-generation plant used by the Fiji Sugar Corporation for producing electricity from bagasse, which is nearing the need of its useful economic life. 14 This represents an annual average growth rate of 5.3 per cent from current levels of generation, which is higher than the 4.7 per cent growth in FEA electricity generation seen between 1999 and 2009, and the 4.07 per cent growth seen between 1999 and 2004 (Snowy Mountains Engineering Corporation 2009).
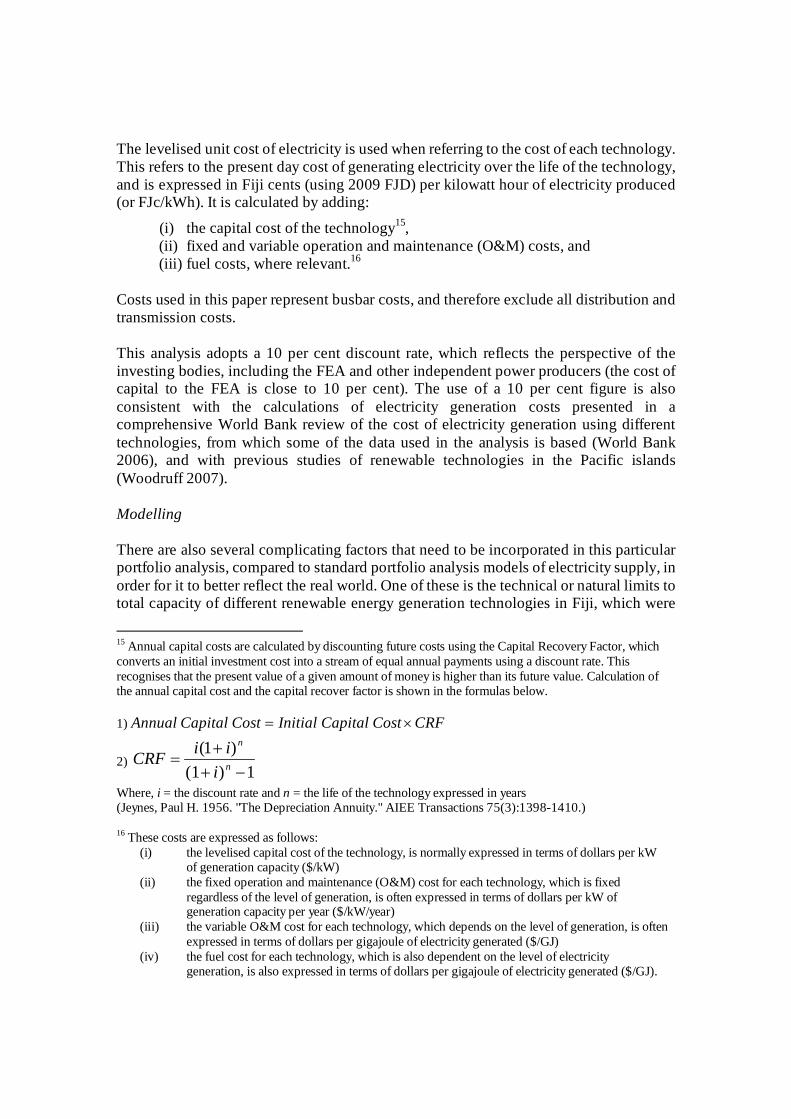
The levelised unit cost of electricity is used when referring to the cost of each technology. This refers to the present day cost of generating electricity over the life of the technology, and is expressed in Fiji cents (using 2009 FJD) per kilowatt hour of electricity produced (or FJc/kWh). It is calculated by adding:
(i) the capital cost of the technology15, (ii) fixed and variable operation and maintenance (O&M) costs, and (iii) fuel costs, where relevant.16
Costs used in this paper represent busbar costs, and therefore exclude all distribution and transmission costs. This analysis adopts a 10 per cent discount rate, which reflects the perspective of the investing bodies, including the FEA and other independent power producers (the cost of capital to the FEA is close to 10 per cent). The use of a 10 per cent figure is also consistent with the calculations of electricity generation costs presented in a comprehensive World Bank review of the cost of electricity generation using different technologies, from which some of the data used in the analysis is based (World Bank 2006), and with previous studies of renewable technologies in the Pacific islands (Woodruff 2007). Modelling There are also several complicating factors that need to be incorporated in this particular portfolio analysis, compared to standard portfolio analysis models of electricity supply, in order for it to better reflect the real world. One of these is the technical or natural limits to total capacity of different renewable energy generation technologies in Fiji, which were
15 Annual capital costs are calculated by discounting future costs using the Capital Recovery Factor, which converts an initial investment cost into a stream of equal annual payments using a discount rate. This recognises that the present value of a given amount of money is higher than its future value. Calculation of the annual capital cost and the capital recover factor is shown in the formulas below. 1) CRFCostCapitalInitialCostCapitalAnnual
2) 1)(1
)1(
n
n
iiiCRF
Where, i = the discount rate and n = the life of the technology expressed in years (Jeynes, Paul H. 1956. "The Depreciation Annuity." AIEE Transactions 75(3):1398-1410.) 16 These costs are expressed as follows:
(i) the levelised capital cost of the technology, is normally expressed in terms of dollars per kW of generation capacity ($/kW)
(ii) the fixed operation and maintenance (O&M) cost for each technology, which is fixed regardless of the level of generation, is often expressed in terms of dollars per kW of generation capacity per year ($/kW/year)
(iii) the variable O&M cost for each technology, which depends on the level of generation, is often expressed in terms of dollars per gigajoule of electricity generated ($/GJ)
(iv) the fuel cost for each technology, which is also dependent on the level of electricity generation, is also expressed in terms of dollars per gigajoule of electricity generated ($/GJ).

discussed in section four. Another is the ability of various technologies to meet varying loads of power, which is not accounted for in standard portfolio analysis. An electricity utility needs to ensure that there is sufficient generation capacity that can be ‘switched on’ to meet demand when needed (Awerbuch and Berger 2003; Copeland et al. 2005). Some renewable technologies are intermittent by nature (namely solar and wind power), and can only meet a certain percentage of the total electricity supply without investment in costly ‘backup’ generation capacity (that would provide electricity in the event that these renewables stopped providing electricity). In Fiji’s case, this backup consists of oil-based generation. This point is also relevant to Fiji’s most important renewable energy resource. Hydro-based generation is affected by rainfall patterns and decreases when drought affects the amount of water present in reservoirs. Rainfall patterns have considerable annual and seasonal variation. Seasonal variation is particularly high but follows a fairly reliable pattern. At the Monasavu hydro scheme, water levels drop during the dry season from June to October each year as stored water is used to generate electricity. Water levels then increase rapidly during the wet season, especially during January to March when cyclonic activity occurs. In extremely dry years, water levels during the dry season can reach a critical point where FEA has to stop generation at Monasavu altogether and rely instead on oil-based generation. These episodes are costly for the FEA and can also lead to rationing of electricity, as non-hydro capacity cannot meet peak loads. The amount of oil-based generation that is required to ensure security of electricity supply is therefore very important to the analysis. Another point relating to load factors of technologies is the fact that per unit electricity generation costs for a technology are determined in part by the output of the technology. This is because the levelised capital and fixed O&M cost of a technology (in other words, the cost in Fijian cents per kWh of electricity produced) are determined by dividing (discounted) annual costs with annual electricity production. For a technology like oil-based generation, where fuel is required to operate the generator, the utility will usually occupy renewable energy technologies that have low operating costs before reverting to oil-based generation. This means that oil-based generators that are used only occasionally will have higher per unit generation costs than those that operated more frequently. The important role that oil-based generation plays in meeting ‘peak load’ electricity demand is often not recognised in least-cost or standard portfolio analyses. These complicating features of electricity generation in Fiji are incorporated into the model in two ways. 1. The variability of electricity generation from renewable technologies is incorporated in the model. This is done calculating the standard deviation of historical monthly electricity production from each technology. Production from ‘new’ and ‘old’ hydro-power stations are treated separately, as the existing Monasavu scheme suffers less variability in electricity generation than will the Nadarivatu scheme (based on stream
flow analysis from the FEA) due to its greater storage reservoir.17 Power production from wind-power is also highly variable (based on historical data). Geothermal power production is stable and is usually used to meet base load electricity demand (Nittetsu Mining Consultants Co. Ltd. 2009). Production from biomass and bagasse plants is included in the model as producing no electricity for six months of the years, and operating at near full capacity for the remaining six months of the year. This reflects the dry and wet seasons in Fiji and is consistent with current power production in these sectors. 2. The model recognises the unique role of oil-based generation in providing security of supply to Fiji’s electricity grid. The model represents oil-based generation as a flexible back-up (or residual) form of generation that meets demand not met by renewable energy capacity. In other words, electricity supply from oil-based generators must always equal total electricity demand minus total output from renewables (which is a variable figure based on installed capacity from each renewable, and a random load factor representing natural variability). This requires a specific amount of back-up oil-based generation capacity for each possible combination of other generation sources. The exact amount of back-up oil-based generation capacity is computed endogenously in the model, based on output from renewable technology capacity. To determine diesel capacity, we define a cut-off for system reliability: in the standard simulations, we want to be able to supply the full amount of electricity demand in 99 per cent of cases (in other words, a 99 per cent probability that there is no shortfall in total electricity supply). So, using a greater share of ‘uncertain’ renewable technologies (such as hydro-power) in the overall renewable technology capacity means we need a greater amount of oil-based generation capacity. This in turn raises overall generation costs, as greater capital outlays are required even if the generating capacity is idle for much of the time. In this way, the model represents the system-wide cost implications of each particular choice on renewable energy capacity. The model therefore includes:
1. Capacity of each renewable technology (assumed for each scenario). 2. Expected output from renewable technology capacity, computed from random
realisations of output by technology, normally distributed with variability based on data on standard deviations from historical output data.
3. Expected output from oil-based generation capacity, computed from random realisations of (2.), as the residual to meet fixed total electricity demand and stochastic output from renewable technology capacity.
4. Required capacity of oil-based generation technology to fulfil electricity demand in 99 per cent of cases, computed from random realisations of (3.).
5. Cost data on each technology. 17 As highlighted previously, future hydro-power schemes are likely to be similar ‘run-of-the-river’ schemes like Nadarivatu, with little storage potential. This means generation from these power stations will be more affected by rainfall variability.
The model is implemented for numerical simulations using a Monte Carlo sampling approach, in the Matlab software package. All stochastic variables are distributed normally, and truncated at zero (to avoid random realisations with negative costs or negative amounts of generation). For each of the scenarios, three million random realisations of the model are computed, for which averages and standard deviations are reported below. Data Used in the Analysis Data on electricity sector costs and production in Fiji is taken from various sources. The cost analysis below takes the data on capital cost of projects from a draft report on energy security written for the Government of Fiji by Snowy Mountains Engineering Corporation (2009), which includes data supplied by the FEA. The accuracy of this data is verified using publicly available sources such as the FEA Annual Reports, Commerce Commission tariff determinations, and news clippings.18 No accurate figures could be obtained for O&M costs in Fiji, although some information was available from new reports and statements by FEA or Commerce Commission officials. As a result, the data for O&M costs is taken from a World Bank report published in 2006, Technical and Economic Assessment of Grid, Mini-Grid and Off-Grid Electrification. Again, the relevance of those figures has been verified where possible against publicly available information in Fiji, including statements by the Commerce Commission and the FEA. Data on the amount of electricity generation from each technology is taken from FEA Annual Reports. Monthly data is used to measure variability of electricity cost and output from hydro and wind-power stations (both technologies suffer considerable seasonal variation in output). Monthly data for hydro-based generation was only available from 2004 to 2008.
18 Unfortunately, publicly available data on the cost of electricity generation in Fiji is limited. The Fiji Electricity Authority did not provide any information beyond what was already publicly available on its webpage and in its annual reports. A lack of transparency in the Fiji Electricity Authority and the Commerce Commission, the regulatory agency charged with setting the tariff rate in Fiji, has led to complaints by the Consumer Council of Fiji, which questions why cost information for a monopoly government owned company needs to remain confidential.
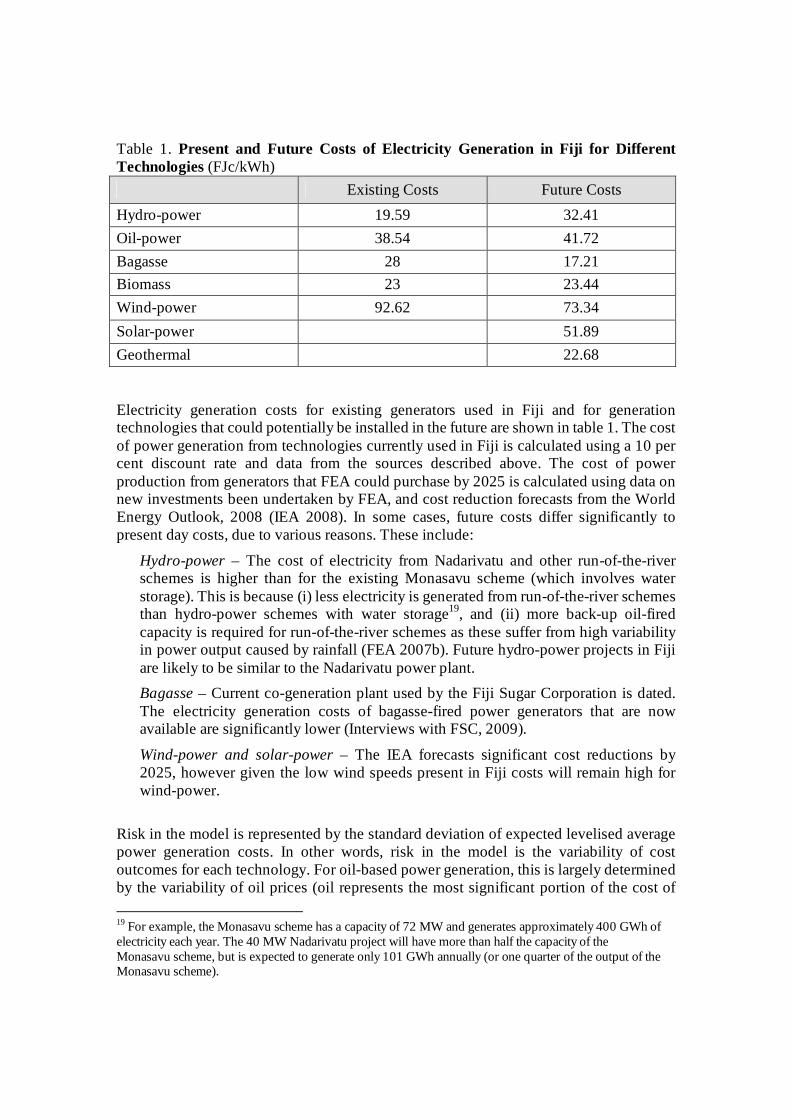
Table 1. Present and Future Costs of Electricity Generation in Fiji for Different Technologies (FJc/kWh) Existing Costs Future Costs Hydro-power 19.59 32.41 Oil-power 38.54 41.72 Bagasse 28 17.21 Biomass 23 23.44 Wind-power 92.62 73.34 Solar-power 51.89 Geothermal 22.68 Electricity generation costs for existing generators used in Fiji and for generation technologies that could potentially be installed in the future are shown in table 1. The cost of power generation from technologies currently used in Fiji is calculated using a 10 per cent discount rate and data from the sources described above. The cost of power production from generators that FEA could purchase by 2025 is calculated using data on new investments been undertaken by FEA, and cost reduction forecasts from the World Energy Outlook, 2008 (IEA 2008). In some cases, future costs differ significantly to present day costs, due to various reasons. These include:
Hydro-power – The cost of electricity from Nadarivatu and other run-of-the-river schemes is higher than for the existing Monasavu scheme (which involves water storage). This is because (i) less electricity is generated from run-of-the-river schemes than hydro-power schemes with water storage19, and (ii) more back-up oil-fired capacity is required for run-of-the-river schemes as these suffer from high variability in power output caused by rainfall (FEA 2007b). Future hydro-power projects in Fiji are likely to be similar to the Nadarivatu power plant. Bagasse – Current co-generation plant used by the Fiji Sugar Corporation is dated. The electricity generation costs of bagasse-fired power generators that are now available are significantly lower (Interviews with FSC, 2009).
Wind-power and solar-power – The IEA forecasts significant cost reductions by 2025, however given the low wind speeds present in Fiji costs will remain high for wind-power.
Risk in the model is represented by the standard deviation of expected levelised average power generation costs. In other words, risk in the model is the variability of cost outcomes for each technology. For oil-based power generation, this is largely determined by the variability of oil prices (oil represents the most significant portion of the cost of 19 For example, the Monasavu scheme has a capacity of 72 MW and generates approximately 400 GWh of electricity each year. The 40 MW Nadarivatu project will have more than half the capacity of the Monasavu scheme, but is expected to generate only 101 GWh annually (or one quarter of the output of the Monasavu scheme).
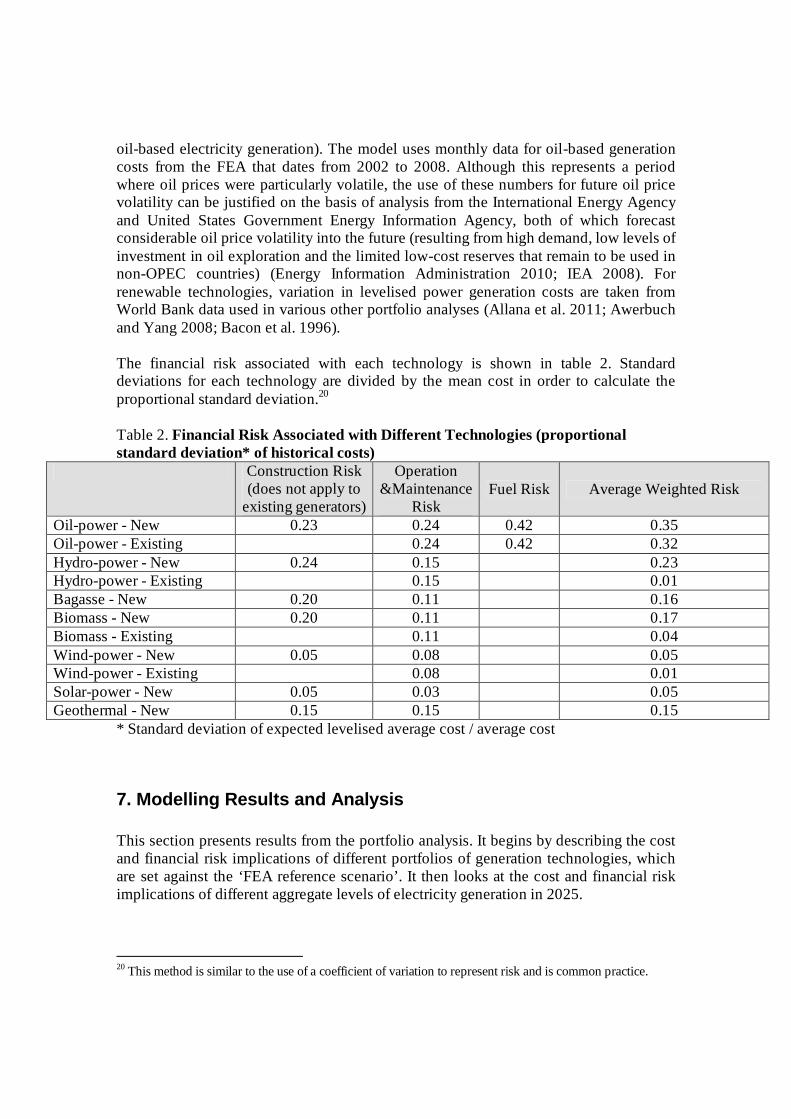
oil-based electricity generation). The model uses monthly data for oil-based generation costs from the FEA that dates from 2002 to 2008. Although this represents a period where oil prices were particularly volatile, the use of these numbers for future oil price volatility can be justified on the basis of analysis from the International Energy Agency and United States Government Energy Information Agency, both of which forecast considerable oil price volatility into the future (resulting from high demand, low levels of investment in oil exploration and the limited low-cost reserves that remain to be used in non-OPEC countries) (Energy Information Administration 2010; IEA 2008). For renewable technologies, variation in levelised power generation costs are taken from World Bank data used in various other portfolio analyses (Allana et al. 2011; Awerbuch and Yang 2008; Bacon et al. 1996). The financial risk associated with each technology is shown in table 2. Standard deviations for each technology are divided by the mean cost in order to calculate the proportional standard deviation.20 Table 2. Financial Risk Associated with Different Technologies (proportional standard deviation* of historical costs)
Construction Risk (does not apply to
existing generators)
Operation &Maintenance
Risk Fuel Risk Average Weighted Risk
Oil-power - New 0.23 0.24 0.42 0.35 Oil-power - Existing 0.24 0.42 0.32 Hydro-power - New 0.24 0.15 0.23 Hydro-power - Existing 0.15 0.01 Bagasse - New 0.20 0.11 0.16 Biomass - New 0.20 0.11 0.17 Biomass - Existing 0.11 0.04 Wind-power - New 0.05 0.08 0.05 Wind-power - Existing 0.08 0.01 Solar-power - New 0.05 0.03 0.05 Geothermal - New 0.15 0.15 0.15
* Standard deviation of expected levelised average cost / average cost
7. Modelling Results and Analysis This section presents results from the portfolio analysis. It begins by describing the cost and financial risk implications of different portfolios of generation technologies, which are set against the ‘FEA reference scenario’. It then looks at the cost and financial risk implications of different aggregate levels of electricity generation in 2025.
20 This method is similar to the use of a coefficient of variation to represent risk and is common practice.

Cost and Risk Implications of Different Technology ‘Portfolios’ Different portfolios of generation technologies are included in the model, and are set against the FEA reference scenario. The FEA reference scenario is based on FEA forecasts of electricity generation in 2025 (Snowy Mountains Engineering Corporation 2009). These forecasts predict that total electricity generation will have reached 1435 GWh by 2025. In addition to generation technologies that are already installed (and are expected to remain in place in 2025, with the exception of bagasse plant), the FEA reference scenario forecasts:
52.3 MW additional hydro-based generation capacity. Most of this (40 MW) will come in the form of the Nadarivatu project that should be completed by 2012.
25.8 MW bagasse capacity (all of which will be new, given that existing bagasse-fired generators are already nearing the end of their economic lives).
20 MW additional biomass capacity. This is based on current plans by Tropik Wood for investment in a new biomass-fired power plant.
No new wind-power capacity is included in the forecast. The FEA does not forecast any geothermal or solar-based power production in 2025. The cost and risk implications of different technology portfolios are illustrated in figure 4. The installed capacity of each technology for the different scenarios is shown in table 3.
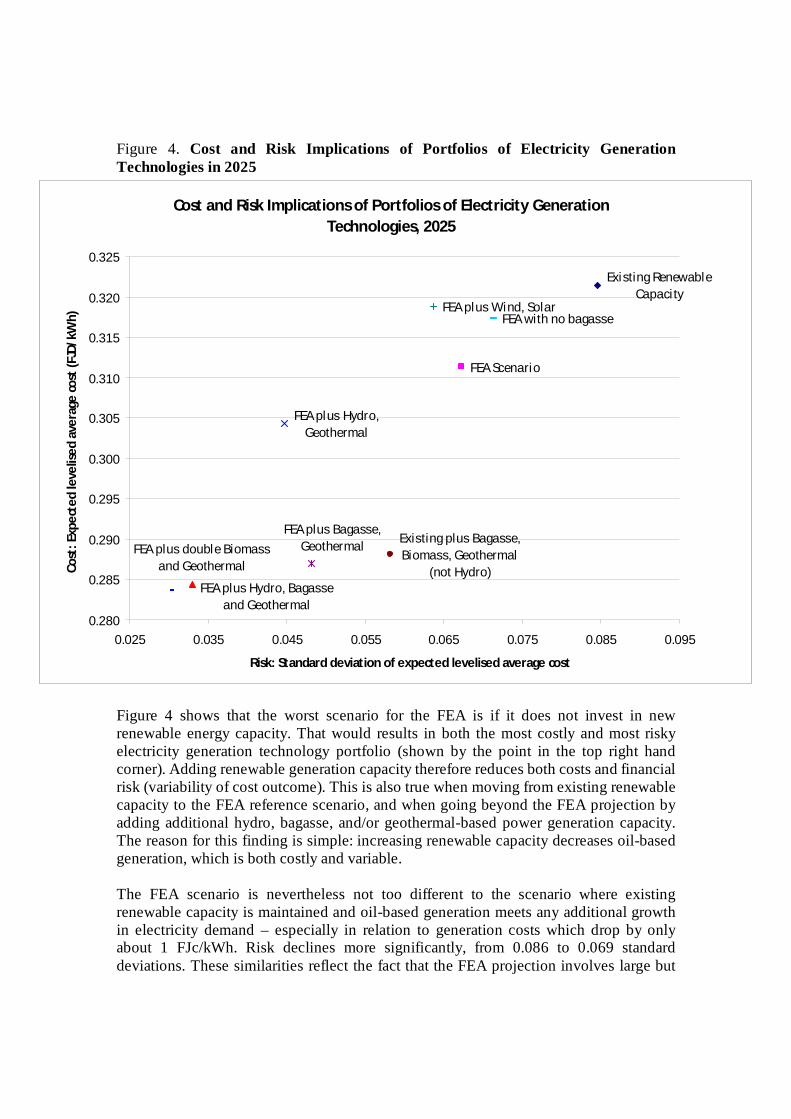
Figure 4. Cost and Risk Implications of Portfolios of Electricity Generation Technologies in 2025
Cost and Risk Implications of Portfolios of Electricity Generation Technologies, 2025
Existing Renewable Capaci ty
FEA Scenario
FEA plus Hydro, Geothermal
Existing plus Bagasse, Biomass, Geothermal
(not Hydro)
FEA plus Wind, SolarFEA with no bagasse
FEA plus Hydro, Bagasse and Geothermal
FEA plus Bagasse, GeothermalFEA plus double Biomass
and Geothermal
0.280
0.285
0.290
0.295
0.300
0.305
0.310
0.315
0.320
0.325
0.025 0.035 0.045 0.055 0.065 0.075 0.085 0.095
Risk: Standard deviation of expected levelised average cost
Cost
: Exp
ecte
d le
velis
ed av
erag
e co
st (F
JD/k
Wh)
Figure 4 shows that the worst scenario for the FEA is if it does not invest in new renewable energy capacity. That would results in both the most costly and most risky electricity generation technology portfolio (shown by the point in the top right hand corner). Adding renewable generation capacity therefore reduces both costs and financial risk (variability of cost outcome). This is also true when moving from existing renewable capacity to the FEA reference scenario, and when going beyond the FEA projection by adding additional hydro, bagasse, and/or geothermal-based power generation capacity. The reason for this finding is simple: increasing renewable capacity decreases oil-based generation, which is both costly and variable. The FEA scenario is nevertheless not too different to the scenario where existing renewable capacity is maintained and oil-based generation meets any additional growth in electricity demand – especially in relation to generation costs which drop by only about 1 FJc/kWh. Risk declines more significantly, from 0.086 to 0.069 standard deviations. These similarities reflect the fact that the FEA projection involves large but
modest investments (compared to the other scenarios) in renewable technologies (and specifically in bagasse, geothermal, and biomass). Interestingly, in the FEA reference scenario, only 45 per cent of total generation will be met by renewable energy technologies in 2025. This is well below the 90 per cent goal the FEA has set for 2011, even accounting for the likelihood that the FEA has assumed different capacity factors in its analysis (thereby changing output from renewable capacity it forecasts will be in place in 2025). Inclusion of additional wind and solar-power generation capacity in the FEA reference scenario reduces variability but increases expected costs. This is again the result of displacement of oil-based generation with renewable technologies; in this case wind and solar technology, which have lower variability but higher expected average costs than oil-based generation. The biggest improvements result from investment in hydro, biomass, bagasse and geothermal-based power generation. Figure 4 shows that the technology portfolio with the lowest risk and cost is one with double the amount of biomass (58.6 MW additional capacity compared with FEA reference scenario) and geothermal (30 MW additional) capacity that is forecast as likely to be available. In other words, the scenario is based on very optimistic forecasts of resource availability. The next best scenario and one with more realistic forecast of resource availability is the scenario with additional hydro-power (107.7 MW additional capacity compared with FEA reference scenario), bagasse (64.2 MW additional), and geothermal (15 MW additional) capacity. If no additional investment in bagasse is made (above the figure included in the FEA reference scenario), generation costs are 2 FJc/kWh higher and the cost outcome is more variable, with standard deviation increasing from 0.036 to 0.047 standard deviations compared to the low-risk, low-cost scenario. Where no investment in additional hydro technology is made (but there is additional investment in bagasse and geothermal technology above that included in the FEA scenario), expected average generation costs increase slightly while financial risk increases substantially. This is because investment in hydro-power further diversifies the FEA technology portfolio, and is the case even though generation costs for bagasse and geothermal have lower variation than do (new) hydro-power costs. If no new investments in hydro-power were to be made at all by the FEA (including the Nadarivatu hydro-power station, which is already under construction), a similar impact on cost and financial risk is observed (with even higher variability in expected average generation costs). Lastly, both expected average generation costs and financial risk also increase if there is no production from bagasse (which may occur in the event of a collapse of the sugar industry). In summary, additional investments in bagasse, biomass, hydro and geothermal power generation capacity beyond the FEA reference scenario lower expected generation costs and significantly lower financial-risk (or risk that actual costs in the future will be significantly different to expected costs).21 The same is not true of wind and solar-power, which reduce financial risk but increase expected power generation costs. Limited 21 Biomass technology performs a similar role, but has an upper limit of 29.3 MW capacity, which is already included in the FEA reference scenario.

investment by the FEA in renewables (as set out in its 2025 forecast) increases expected average generation costs and significantly increases financial risk compared to these ‘low risk, low cost’ generation portfolios.
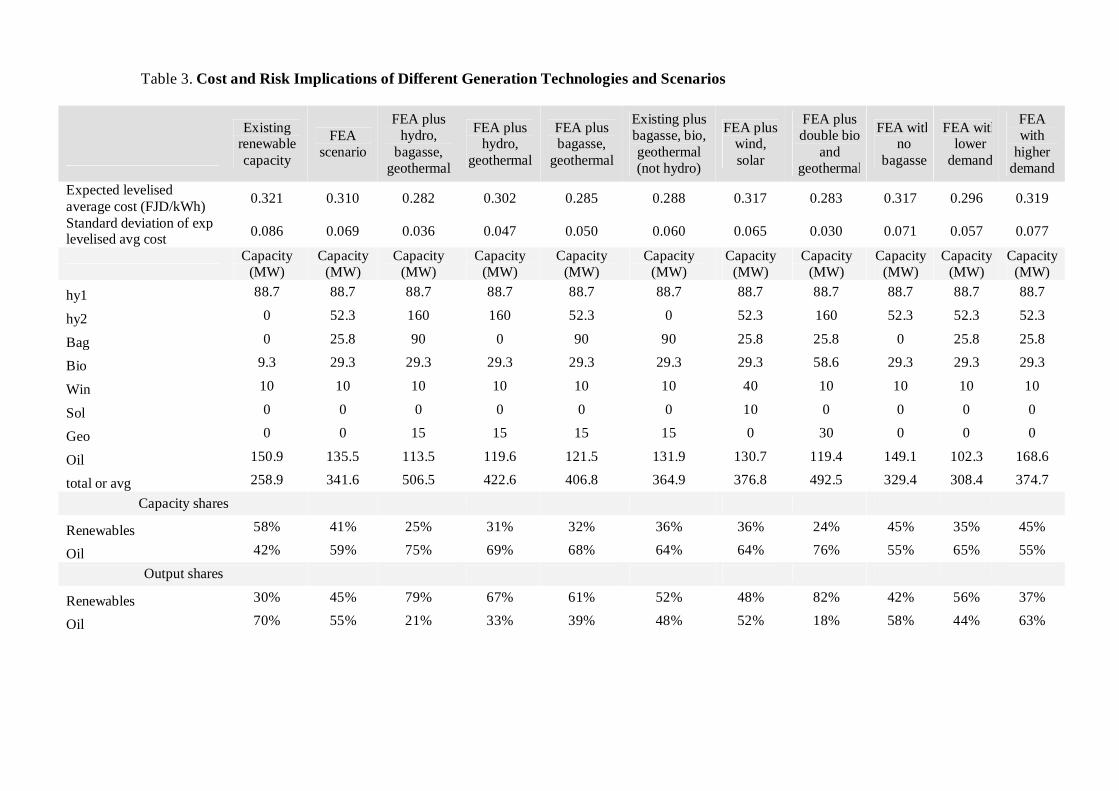
Table 3. Cost and Risk Implications of Different Generation Technologies and Scenarios
Existing renewable capacity
FEA scenario
FEA plus hydro,
bagasse, geothermal
FEA plus hydro,
geothermal
FEA plus bagasse,
geothermal
Existing plus bagasse, bio, geothermal (not hydro)
FEA plus wind, solar
FEA plus double bio
and geothermal
FEA with no
bagasse
FEA with lower
demand
FEA with
higher demand
Expected levelised average cost (FJD/kWh) 0.321 0.310 0.282 0.302 0.285 0.288 0.317 0.283 0.317 0.296 0.319
Standard deviation of exp levelised avg cost 0.086 0.069 0.036 0.047 0.050 0.060 0.065 0.030 0.071 0.057 0.077
Capacity
(MW) Capacity
(MW) Capacity
(MW) Capacity
(MW) Capacity
(MW) Capacity
(MW) Capacity
(MW) Capacity
(MW) Capacity
(MW) Capacity
(MW) Capacity
(MW) hy1 88.7 88.7 88.7 88.7 88.7 88.7 88.7 88.7 88.7 88.7 88.7
hy2 0 52.3 160 160 52.3 0 52.3 160 52.3 52.3 52.3
Bag 0 25.8 90 0 90 90 25.8 25.8 0 25.8 25.8
Bio 9.3 29.3 29.3 29.3 29.3 29.3 29.3 58.6 29.3 29.3 29.3
Win 10 10 10 10 10 10 40 10 10 10 10
Sol 0 0 0 0 0 0 10 0 0 0 0
Geo 0 0 15 15 15 15 0 30 0 0 0
Oil 150.9 135.5 113.5 119.6 121.5 131.9 130.7 119.4 149.1 102.3 168.6
total or avg 258.9 341.6 506.5 422.6 406.8 364.9 376.8 492.5 329.4 308.4 374.7
Capacity shares
Renewables 58% 41% 25% 31% 32% 36% 36% 24% 45% 35% 45%
Oil 42% 59% 75% 69% 68% 64% 64% 76% 55% 65% 55%
Output shares
Renewables 30% 45% 79% 67% 61% 52% 48% 82% 42% 56% 37%
Oil 70% 55% 21% 33% 39% 48% 52% 18% 58% 44% 63%

The Impact of Changes in Total Demand The model also sets out two additional scenarios where total electricity generation varies compared to that forecast by the FEA. This includes:
A ‘high demand’ scenario where electricity generation grows at a higher rate than expected by the FEA to reach 1722 GWh per year in 2025,
The ‘FEA scenario’ where electricity generation in 2025 is 1435 GWh per year, and
A ‘low demand’ scenario where electricity generation grows at a lower rate than expected by the FEA to reach only 1148 GWh per year in 2025.
The cost and financial risk implications of these three scenarios are shown in figure 5. All three of these scenarios assume investment in renewables as forecast by the FEA in its reference scenario (set out in table 3).
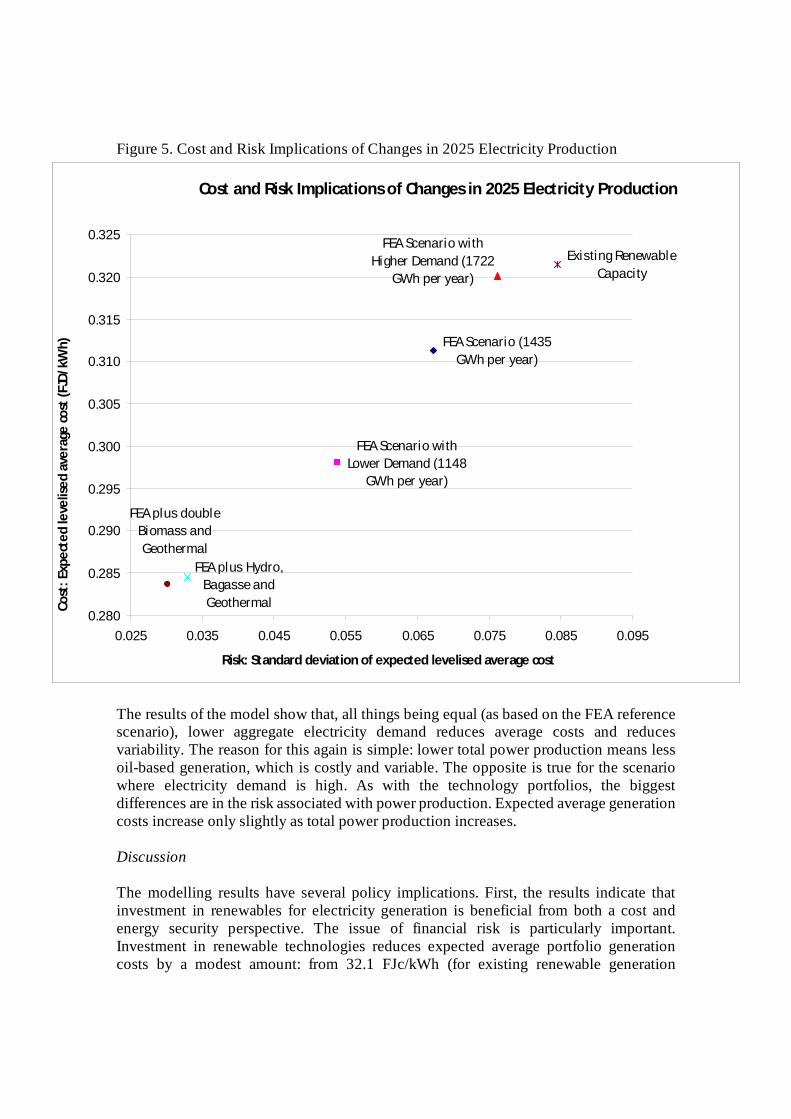
Figure 5. Cost and Risk Implications of Changes in 2025 Electricity Production
Cost and Risk Implications of Changes in 2025 Electricity Production
FEA Scenario (1435 GWh per year)
FEA Scenario with Lower Demand (1148
GWh per year)
Existing Renewable Capacity
FEA Scenario with Higher Demand (1722
GWh per year)
FEA plus Hydro, Bagasse and Geothermal
FEA plus double Biomass and Geothermal
0.280
0.285
0.290
0.295
0.300
0.305
0.310
0.315
0.320
0.325
0.025 0.035 0.045 0.055 0.065 0.075 0.085 0.095
Risk: Standard deviation of expected levelised average cost
Cost
: Exp
ecte
d le
velis
ed av
erag
e co
st (F
JD/k
Wh)
The results of the model show that, all things being equal (as based on the FEA reference scenario), lower aggregate electricity demand reduces average costs and reduces variability. The reason for this again is simple: lower total power production means less oil-based generation, which is costly and variable. The opposite is true for the scenario where electricity demand is high. As with the technology portfolios, the biggest differences are in the risk associated with power production. Expected average generation costs increase only slightly as total power production increases. Discussion The modelling results have several policy implications. First, the results indicate that investment in renewables for electricity generation is beneficial from both a cost and energy security perspective. The issue of financial risk is particularly important. Investment in renewable technologies reduces expected average portfolio generation costs by a modest amount: from 32.1 FJc/kWh (for existing renewable generation
capacity) to 28.2 FJc/kWh. Further reductions are not possible because of upper limits set for the lowest cost generation technologies: namely biomass, bagasse and geothermal. These upper limits are associated with limited renewable energy resource availability in Fiji.22 Reductions in financial risk associated with generation portfolios are far higher (in other words, reduction in risk that actual costs in the future will be significantly different to expected costs). Risk, as measured by standard deviations of expected levelised average cost, declines from 0.086 to 0.036 standard deviations when moving from the no-action ‘existing renewable generation’ scenario to the scenario where all investments forecast by the FEA go ahead, along with additional investments in bagasse, hydro and geothermal power stations. This indicates that investment in renewable energy technologies has significant advantages in terms of energy security for Fiji’s electricity grid. The modelling results also suggest that current FEA investments in renewable capacity, although significant, are not sufficient. The FEA reference scenario has higher expected generation costs and significantly higher financial risk than do scenarios with additional investment in bagasse, biomass, hydro and geothermal power generation capacity. The FEA reference scenario is also far removed from the FEA’s stated goal of generating 90 per cent of its power from renewable energy technologies23 (although admittedly this goal was only set for 2011, and may be based on different assumed capacity factors of installed renewable capacity). The other finding that has policy ramifications is that reductions in total demand have a similar impact to investment in low cost renewable energy technologies (namely bagasse, biomass and hydro) for the FEA. Again, the biggest impact relates to financial risk. Expected average costs are only 2 FJc/kWh lower in the ‘low demand’ scenario when compared to the ‘high demand’ scenario. At the same time, financial risk declines from 0.077 to 0.057 standard deviations. Lower levels of total generation therefore significantly improve energy security in Fiji’s electricity grid. This is a strong argument for considering the costs of demand management policies and strategies, and comparing these to the costs of investment in renewable technologies. This analysis may be included in future iterations of this paper.
8. Conclusion This paper has looked at the cost and financial risk implications of incorporating different mixes of renewable energy technologies in Fiji’s electricity grid. The analysis is important, given current investments in renewables and their justification on the grounds of lowering electricity generation costs and (more importantly) improving energy
22 Even some of the investments included here raise broader questions about the future state of the Fiji economy. For example, power production from bagasse assumes that the sugar industry remains in place in 2025. The poor performance of the sugar industry in recent years raises the question of whether this will indeed occur and whether the industry will be able to supply power to the electricity grid at all in 2025. 23 Current investments by the FEA will not reduce the proportion of oil-based generation currently used in the FEA grid in 2025.

security. The paper has developed and applied a stochastic simulation model based on portfolio theory, which shows the impact of different renewable technologies on both expected portfolio generation cost and financial risk for scenarios of future electricity generation mixes in Fiji. The modelling results indicate that investment in low cost renewables such as bagasse, biomass, geothermal and hydro-power technologies has the potential to modestly lower expected average generation costs, and to significantly reduce financial risk for Fiji’s electricity grid. Investment in high cost renewables such as wind and solar-power reduces financial risk but increases expected average generation costs. The results show that there are significant energy security benefits to investments in renewables beyond those predicted by the FEA, as well as moderate cost reductions. Scenarios of future electricity demand indicate that limiting electricity demand has a similar impact to investment in low cost renewable energy technologies (by significantly reducing financial risk and modestly reducing expected average generation costs in the Fiji grid). These findings suggest that the Government of Fiji should (i) promote investment in low cost renewables (bagasse, biomass, geothermal and hydro-power) and (ii) actively investigate the costs and benefits of energy efficiency measures designed to limit growth in electricity demand.
References ADB. 2008. "Living with High Prices: A Policy Brief." In ADB Pacific Studies Series. Manila: Asian Development Bank. Allana, Grant, Igor Eromenkoa, Peter McGregora and Kim Swalesb. 2011. "The regional electricity generation mix in Scotland: A portfolio selection approach incorporating marine technologies." Energy Policy 39(1). Awerbuch, S. and S. Yang. 2008. "Efficient electricity generating portfolios for Europe." In Analytical Methods for Energy Diversity and Security, eds. M. Bazilian and F. Roques. Amsterdam: Elsevier. Awerbuch, Shimon. 2000. "Investing in photovoltaics: risk, accounting and the value of new technology." Energy Policy 28:1023-1035. Awerbuch, Shimon. 2006. "Portfolio-based Electricity Generation Planning: Policy Implications for Renewables and Energy Security." Mitigation and Adaptation Strategies for Global Change 11:693–710. Awerbuch, Shimon and Martin Berger. 2003. "Applying Portfolio Theory to EU Electricity Planning and Policy-Making." In IEA/EET Working Paper. Paris: International Energy Agency. Awerbuch, Shimon and Raphael Sauter. 2006. "Exploiting the oil-GDP effect to support renewables deployment." Energy Policy 34:2805-2819. Bacon, R.H. , J.F. Besant-Jones and J. Heidurian. 1996. "Estimating construction costs and schedules: experience with power generation projects in developing countries." In World Bank Technical Paper Washington D.C. Commerce Commission. 2009. "Determination of Fiji Electricity Authority Tariff Rates: 18 August 2009." Suva: Commerce Commission. Commerce Commission. 2010. "Determination of Fiji Electricity Authority Tariff Rates: Tariff Alignment Phase 1, 1 June 2010." Suva: Commerce Commission. Copeland, Thomas E, J Fred Weston and Kuldeep Shastri. 2005. Financial Theory and Corporate Policy. fourth edition Edition. Boston: Addison Wesley. Energy Information Administration. 2010. "Annual Energy Outlook 2010." Washington D.C: Department of Energy. FEA. 2007a. "Annual Report." Suva: Fiji Electricity Authority. FEA. 2007b. "Nadarivatu Renewable Energy ECP Project - Project Description." Suva, Fiji: Fiji Electricity Authority. FEA. 2008a. "Annual Report." Suva: Fiji Electricity Authority. FEA. 2008b. "Renewable Projects." Suva: Fiji Electricity Authority. FEA. 2009a. "Annual Report." Suva: Fiji Electricity Authority. FEA. 2009b. "Our History." Suva: Fiji Electricity Authority. IEA. 2008. "World Energy Outlook 2008." Paris: International Energy Agency.
Jeynes, Paul H. 1956. "The Depreciation Annuity." AIEE Transactions 75(3):1398-1410. Levantis, Theodore. 2008a. "Oil price crisis in the Pacific." In Pacific Islands Update, 26 November. The Australian National University, Canberra. Levantis, Theodore. 2008b. "Oil price vulnerability in the Pacific." Pacific Economic Bulletin 23(2):214-225. Levantis, Theodore, Christine Groeger and Scott McNamara. 2006. "Are Pacific countries coping with surging oil prices?" Pacific Economic Bulletin 21(3):115-125. Markowitz, Harry. 1952. "Portfolio selection." Journal of Finance 7(1):77-91. Morris, Jared 2006. "Small States Bulk Procurement of Petroleum Study: Feasibility Study." In Pacific Studies Series: Towards a new Pacific regionalism. Suva: Pacific Islands Forum Secretariat. Nittetsu Mining Consultants Co. Ltd. 2009. "The Preliminary Feasibility Study on Geothermal Power Generation in Viti Levu Island and Vanua Levu Island the Republic of the Fiji Islands." Tokyo: Prepared for Japanese Ministry of Economy, Trade and Industry. Sanghi, Apurva and Alan Bartmanovich. 2007. "Harnessing competitive forces to reduce fuel costs in small island economies." Pacific Economic Bulletin 22(1):175-179. Snowy Mountains Engineering Corporation. 2009. "Fiji's National Energy Security Situation Report - Draft Only." Draft Edition. Suva, Fiji: Prepared for Fiji Department of Energy. Tumbarello, Patrizia. 2008. "High Food, Fuel Prices a Threat Where Protection Limited." In IMF Survey Magazine. Washington DC: International Monetary Fund. UNDP. 2007. "Fuel to Change: Overcoming Vulnerability to Rising Oil Prices." Bangkok: United Nations Development Program. Vega, Luis. 2001. "Summary of Renewable Energy Resource Assessments for Fiji Islands as of September 2001." Suva, Fiji: Prepared for Fiji Department of Energy. Wade, Herbert. 2005. "Pacific Regional Energy Assessment 2004: Regional Overview Report." In Pacific Islands Regional Energy Assessment. Apia: South Pacific Regional Environment Programme. Woodruff, Allison. 2007. "An Economic Assessment of Renewable Energy Options for Rural Electrification in Pacific Island Countries." Suva: Secretariat of the Pacific Applied Geoscience Commission. World Bank. 2006. "Technical and Economic Assessment of Grid, Mini-Grid and Off-Grid Electrification." Washington DC.