electric and magnetic fields summary - new … and magnetic fields summary seacoast reliability...
TRANSCRIPT

Electric and Magnetic Fields Summary Seacoast Reliability Project
Prepared by: Eversource Energy
January 28, 2016


i
Table of Contents List of Figures .................................................................................................................................. i
List of Tables .................................................................................................................................. ii
Summary ........................................................................................................................................ iii
1 Electric and Magnetic Fields from Power Lines and Other Sources ...................................... 1
2 Calculated Electric and Magnetic Fields from Proposed Facilities ........................................ 5
2.1 Calculations Assumptions for MF from Transmission Lines .......................................... 5
2.1.1 System Load and Generator Dispatch....................................................................... 6
2.1.2 Calculated Magnetic Fields During Assumed Average Annual Loads .................... 6
2.2 Calculation of EF from Transmission Lines .................................................................. 22
3 REFERENCES ..................................................................................................................... 30
Attachment A Tabulated Summaries of EMF Calculations .................................................. A-1
List of Figures
Figure 1 - Electric and Magnetic Fields in the Environment .......................................................... 2 Figure 2 - Typical Magnetic Field Exposures during Typical Daily Activities (Bethel, CT) ........ 3 Figure 3 - Magnetic Field Calculations for Madbury S/S to Madbury Town Line ........................ 7 Figure 4 - Magnetic Field Calculations for Madbury Town Line to University of New Hampshire......................................................................................................................................................... 8 Figure 5 - Magnetic Field Calculations for the Underground Transmission Line in the vicinity of the University of New Hampshire ................................................................................................. 9 Figure 6 - Magnetic Field Calculations for University of New Hampshire to Durham Substation....................................................................................................................................................... 10 Figure 7 - Magnetic Field Calculations for Durham Substation to Packers Falls Substation....... 11 Figure 8 - Magnetic Field Calculations for Packers Falls Substation to Newmarket Road ......... 12 Figure 9 - Magnetic Field Calculation for Newmarket Road to Durham Point Road .................. 13 Figure 10 - Magnetic Field Calculations for Durham Point Road to Little Bay Transition ......... 14 Figure 11 - Magnetic Field Calculations for Little Bay Launch to Little Bay Crossing .............. 15 Figure 12 - Magnetic Field Calculations for the Little Bay Crossing (Underwater Cables) ........ 16 Figure 13 - Magnetic Field Calculations for Little Bay Crossing to Little Bay Road .................. 17 Figure 14 - Magnetic Field Calculations for Little Bay Road to Fox Point Rd ............................ 18 Figure 15 - Magnetic Field Calculations for Fox Point Rd to Spaulding Turnpike Crossing ...... 19 Figure 16 - Magnetic Field Calculations for Spaulding Turnpike Crossing to Mall Parking Lot 20
ii
Figure 17 - Magnetic Field Calculations for Mall Parking Lot to the Portsmouth Substation ..... 21 Figure 18 - Electric Field Calculations for Madbury Substation to the Madbury Town Line...... 22 Figure 19 - Electric Field Calculations for Madbury Town Line to the University of New Hampshire ..................................................................................................................................... 23 Figure 20 - Electric Field Calculations for the University of New Hampshire to Durham Substation ...................................................................................................................................... 25 Figure 21 - Electric Field Calculations for Durham Substation to Packers Falls Substation ....... 25 Figure 22 - Electric Field Calculations for Packers Falls Substation to Newmarket Road .......... 26 Figure 23 - Calculated Electric Fields from Newmarket Road to Durham Point Road ............... 26 Figure 24 - Electric Field Calculations for Durham Point Road to Little Bay Launching Point .. 27 Figure 25 - Electric Field Calculations for Little Bay Road to Fox Point Rd .............................. 28 Figure 26 - Electric Field Calculations for Fox Point Rd to Spaulding Turnpike Crossing ......... 28 Figure 27 - Electric Field Calculations for Spaulding Turnpike Crossing to Mall Parking Lot ... 29 Figure 28 - Electric Field Calculations for Mall Parking Lot to Portsmouth Substation ............. 29
List of Tables
Table 1 - Summary of International Limits from Scientific Agencies .......................................... iii Table 2 - Summary of Magnetic Fields Measured in a Connecticut Town (Bethel) ...................... 3 Table 3 - New England System Loads Used for Assumptions ....................................................... 6

iii
Summary
This section provides electric and magnetic fields (EMF) information for the Project, presenting projections for future EMF levels associated with the proposed transmission line in each segment of the Preferred Route. Because the Project will follow along existing sub-transmission corridors, EMF from those sources are also discussed.
Section 1 provides general background information about EMF – what it is and typical levels encountered in the environment. Section 2 summarizes new developments in EMF Health Research since 2007. Section 3 outlines the methods for calculating fields and summarizes the calculated magnetic fields to comply with the requirements of the Commission. Section 4 provides a list of the references used in writing this summary.
The company prepared calculations of magnetic field levels in the vicinity of the proposed transmission lines under average annual loads and annual peak loads. Under all of these conditions, the calculated electric and magnetic fields are well below the exposure levels corresponding to ICNIRP and ICES Basic Restriction limits summarized in the table below.
EF (kV/m) MF (mG)ICES 26.8 9,150ICNIRP 36.4 12,400
Table 1 - Summary of EMF levels corresponding to Basic Restrictions on public exposure from international scientific agencies
In addition, there are two appendices for this report. Attachment A contains tabulated results of the calculated electric and magnetic fields for the Project. Appendix 40 provides a review of relevant scientific literature since June of 2007 that was prepared by Exponent, Inc.
1
1 Electric and Magnetic Fields from Power Lines and Other Sources
Electricity used in homes and workplaces is transmitted over considerable distances. Electricity is transmitted as alternating current (AC) to all homes and over electric lines delivering power to neighborhoods, factories, and commercial establishments. The power provided by electric utilities in North America oscillates 60 times per second (i.e., at a frequency of 60 hertz (Hz)).
Electric fields are the result of voltages applied to electrical conductors and equipment. The electric field is expressed in measurement units of volts per meter (V/m) or kilovolts per meter (kV/m); 1 kV/m is equal to 1,000 V/m. Most objects, including fences, shrubbery, and buildings, easily block electric fields. Therefore, certain appliances within homes and the workplace are the major sources of electric fields indoors, while power lines are the major sources of electric fields outdoors (Figure 1, lower panel).
Magnetic fields are produced by the flow of electric currents; however, unlike electric fields, most materials do not readily block magnetic fields. The level of a magnetic field is commonly expressed as magnetic flux density in units called gauss (G), or in milliGauss (mG), where 1 G = 1,000 mG.1 The magnetic field level at any point depends on characteristics of the source, including the arrangement of conductors, the amount of current flow through the source, and its distance from the point of measurement. The levels of both electric fields and magnetic fields diminish with increasing distance from the source.
Background AC magnetic field levels in homes are generally less than 20 mG when not near a particular source, such as some appliances. Higher magnetic field levels can be measured outdoors in the vicinity of distribution lines, sub-transmission lines, and transmission lines (Figure 1, upper panel).
Electric appliances are among the strongest sources of AC magnetic fields encountered in indoor environments. Magnetic fields near appliances can reach 1,000 mG or more. For example, Gauger (1985) reports the maximum AC magnetic field at 3 centimeters from a sampling of appliances as follows: 3,000 mG (can opener), 2,000 mG (hair dryer), 5 mG (oven), and 0.7 mG (refrigerator). Similar measurements have shown that there is a tremendous variability among appliances made by different manufacturers. The potential contribution of different sources to overall exposure over long periods is not very well characterized, but both repeated exposure to higher fields for short times and longer exposure to lower intensity fields for a long time contribute to an individual’s total exposure.
1 Scientists more commonly refer to magnetic fields in units of microTesla (μT). Magnetic fields in units of μT can be converted to milliGauss (mG) by multiplying by 10, i.e., 0.1 μT = 1 mG.

2
Considering EMF from a perspective of specific sources or environments, as illustrated in Figure 1, does not fully reflect the variations in an individual’s personal exposure as encountered in everyday life. To illustrate this, magnetic field measurements were recorded, over a two-hour period, by a meter worn at the waist of an Exponent engineer who conducted a range of typical daily activities.
Figure 1 - Electric and Magnetic Fields in the Environment
As illustrated in Figure 2, these activities included a visit to the post office and the library, walking along the street, getting ice cream, browsing in a bicycle shop, stopping in a chocolate

3
shop, going to the bank/ATM, driving along streets, shopping in a supermarket, stopping for gas, and purchasing food at a fast food restaurant.
Figure 2 - Measured Magnetic Fields Recorded during Typical Daily Activities (Bethel, CT)
During the course of the two hours, a maximum magnetic field of 97.55 mG was measured in the supermarket (Table 1). As Figure 2 shows, from moment-to-moment in everyday life, magnetic fields are encountered that vary in intensity over a wide range.
Maximum* Average Median97.55 4.57 1.10
*Maximum occurred in the supermarket
Magnetic Field Levels (milliGauss, mG)
Table 2 - Summary of Magnetic Fields Measured in a Connecticut Town (Bethel)

4
In June 2007, the World Health Organization (WHO) released its, to date, most comprehensive review that summarized the current scientific evidence and consensus on potential effects related to extremely low frequency (ELF) EMF.2 The WHO concluded, as it is also currently stated on its website, that “current evidence does not confirm the existence of any health consequences from exposure to low level electromagnetic fields.” While the WHO report also recognized the statistical associations reported from some childhood leukemia epidemiologic studies, in their assessment, it only provided limited evidence for a potential effect, because chance, confounding and bias could not be excluded with certainty as an explanation for the reported association. The WHO report also noted that “virtually all of the laboratory evidence and the mechanistic evidence fails to support a relationship” and, for the association, “on balance, the evidence is not strong enough to be considered causal.” Based on this review, the WHO concluded with respect to other diseases that “the scientific evidence supporting an association between ELF magnetic field exposure and all of these health effects is much weaker than for childhood leukemia.” The conclusions of the WHO report were consistent with those of other public health groups that had conducted review prior to the WHO report, including published reviews by the National Institute for Environmental and Health Sciences (NIEHS, 1999), the International Agency for Research on Cancer (IARC, 2002), the Australian Radiation Protection and Nuclear Safety Agency (ARPANSA, 2003),3 the National Radiological Protection Board of Great Britain (NRPB, 2004), and the Health Council of the Netherlands (HCN, 2005).4 Authoritative reviews conducted following the WHO report, including those by the International Commission on Non-Ionizing Radiation Protection (ICNIRP) in 2010, and the European Union’s Scientific Committee on Emerging and Newly Identified Health Risks (SCENIHR) in 2015, have arrived to similar conclusions. None of these agencies concluded that the evidence confirms the existence of adverse health effects of ELF EMF.
To assist the Committee in evaluating the most up-to-date research, Eversource commissioned William H. Bailey, Ph.D., Gabor Mezei, M.D., Ph.D. and other scientists at Exponent to provide a report that systematically evaluates recent peer-reviewed research and reviews by scientific panels, specifically including any published since those considered in the WHO’s review of 2007. Exponent’s report, which is provided in Appendix 40 includes a review of research and reviews published from June 2007 through November 2014. Significantly, Exponent’s report concludes:
In conclusion, recent studies when considered in context of previous research do not provide evidence to alter the conclusion that ELF EMF exposure at the levels we encounter in our everyday environment including transmission lines is not a cause of cancer or any other disease process. (Appendix 40, p. 52).
2 The ELF EMF range of frequencies includes 60 Hz EMF that is associated with electricity in North America. 3 ARPANSA released an updated evaluation of EMF research and a draft standard in 2006, which is largely consistent with those of WHO and other national and international health agencies. 4 The Health Council of the Netherlands issued an updated report in 2009.

5
2 Calculated Electric and Magnetic Fields from Proposed Facilities
The major sources of EMF associated with the Project are the proposed transmission line and other distribution lines in the vicinity of the Project. Transformers and other equipment within the Madbury and Portsmouth Substations are also potential EMF sources, but would cause little or no exposure to the general public. That is because “[i]n a substation, the strongest fields near the perimeter fence come from the transmission and distribution lines entering and leaving the substation. The strength of fields from equipment inside the fence decreases rapidly with distance, reaching very low levels at relatively short distances beyond substation fences.” (IEEE Std 1127™-2013). Because the fields outside the perimeter fence of a substation are highest directly above or below where transmission and distribution lines enter and leave the substation, measuring and calculating the EMF levels associated with transmission lines effectively addresses potential EMF exposures close to substations.
2.1 Calculations Assumptions for MF from Transmission Lines
Eversource calculated pre- and post-construction magnetic field levels using methods described in the Electric Power Research Institute’s AC Transmission Line Reference Book – 200-kV and Above, Third. With accurate input data, the equations in these references will accurately predict magnetic fields measured near power lines. The inputs to the calculation are data regarding current flow, circuit phasing, sheath and wire bonding, conductor and cable sizes and locations. The fields associated with power lines were estimated along profiles drawn perpendicular to the lines assuming flat terrain, at a point of lowest conductor sag for overhead transmission lines (25 feet for lowest conductor of an overhead 34.5-kV line, 30 feet for a 115-kV line or 35 feet for a 345-kV line) and at a point of shallowest depth for the underground 115-kV transmission line (45 inches for the uppermost power cable). All calculations were made for a height of 1 meter (3.28 feet) above ground, in accordance with standard practice (IEEE Std, 644-1994, R2008).
A calculation of magnetic fields first requires determining the currents that will flow on the affected lines under each set of conditions to be studied. For the New Hampshire transmission system, these currents are determined by modeling the transmission system with a specific system load level, generation dispatch, and direction/magnitude of power transfers in or out of New Hampshire. Each condition to be studied is selected in a conservative way so as to lead to calculation results that would likely be higher than actual magnetic field values under the assumed loading condition. Eversource calculated magnetic fields for existing lines under pre-Project conditions and for the proposed and existing lines under post-Project conditions in 2018 for two system loading conditions, Annual Peak Load (APL) and Annual Average Load (AAL). The calculations for Average Annual Load are the most useful for comparing before and after field levels for any ‘typical’ day, so these results are presented below in profiles and tables.

6
Additionally, magnetic field levels at 25-foot intervals are also presented for the base design designs at AAL and APL together with associated electric field levels, in Attachment A.
2.1.1 System Load and Generator Dispatch
Eversource analyzed the system under varying load conditions with reasonably appropriate generator dispatches. All transmission lines were assumed in service. Only transmission projects with Proposed Plan Application (PPA) approval in accordance with Section I.3.9 of the Tariff, as of the January 2015 RSP Project Listing, were included in the study base case. There are no system topology changes that are relevant to this study area when considering the 2018 system model. Loads assumed on the transmission system for New England are summarized in Table 3 below. Generator dispatch plays a role in the calculation of magnetic fields. For the purposes of these calculations, the Schiller Units (4, 5 & 6) were assumed to be off. This is not an unreasonable situation and maximizes the current flow on the new F107 line. This yields more conservative results.
Load Case Description 2014 Load (MW) 2019 Load (MW)Annual Peak Load ("APL") 90/10 Summer Peak ISO-NE L+L 31250 33335Peak Day Average Load ("PDAL" 85% of 90/10 Peak 26563 28335Average Annual Load ("AAL") Annual Hourly Average 15000 15000
Table 3 - New England System Loads Used for Assumptions
2.1.2 Calculated Magnetic Fields During Assumed Average Annual Loads
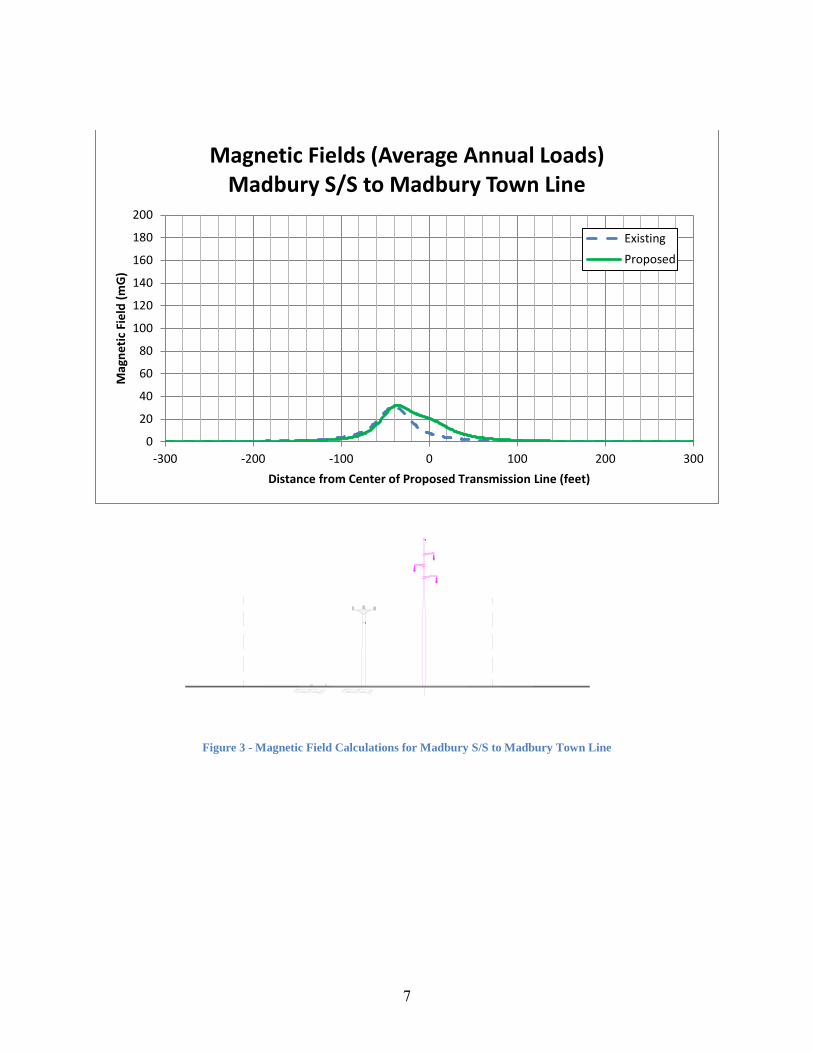
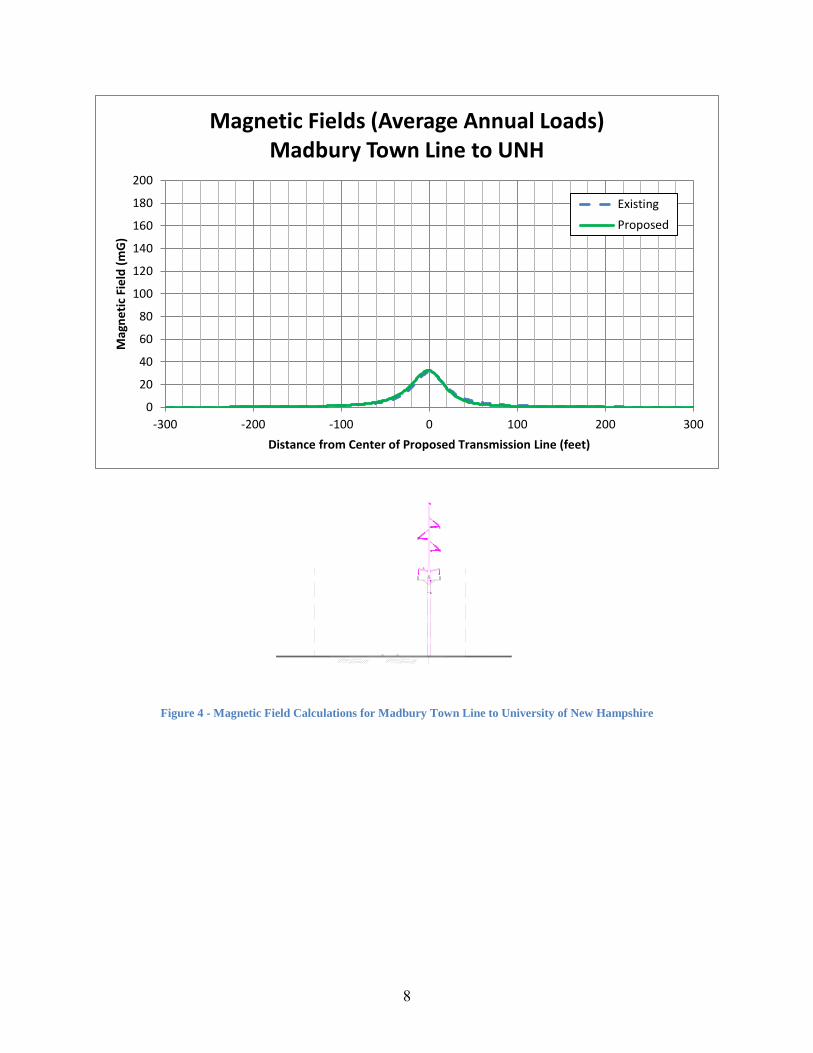
Calculated magnetic fields are presented here as a profile looking along the right-of-way (“ROW”) from Madbury Substation (in the Town of Madbury) towards Portsmouth Substation (in the Town of Portsmouth). The calculations are prepared for a distance of 300 feet on either side of the proposed 115-kV transmission line. Fields are plotted for both the existing distribution lines and the proposed transmission lines on the same figure. Below each graph is a depiction of the ROW showing both the existing and proposed facilities.
7
Figure 3 - Magnetic Field Calculations for Madbury S/S to Madbury Town Line
0
20
40
60
80
100
120
140
160
180
200
-300 -200 -100 0 100 200 300
Mag
netic
Fie
ld (m
G)
Distance from Center of Proposed Transmission Line (feet)
Magnetic Fields (Average Annual Loads) Madbury S/S to Madbury Town Line
ExistingProposed
8
Figure 4 - Magnetic Field Calculations for Madbury Town Line to University of New Hampshire
0
20
40
60
80
100
120
140
160
180
200
-300 -200 -100 0 100 200 300
Mag
netic
Fie
ld (m
G)
Distance from Center of Proposed Transmission Line (feet)
Magnetic Fields (Average Annual Loads) Madbury Town Line to UNH
ExistingProposed

9
Figure 5 - Magnetic Field Calculations for the Underground Transmission Line in the vicinity of the University of New Hampshire
0
20
40
60
80
100
120
140
160
180
200
-300 -200 -100 0 100 200 300
Mag
netic
Fie
ld (m
G)
Distance from Center of Proposed Transmission Line (feet)
Magnetic Fields (Average Annual Loads) UG Through UNH Parking Lot
ExistingProposed

10
Figure 6 - Magnetic Field Calculations for University of New Hampshire to Durham Substation
0
20
40
60
80
100
120
140
160
180
200
-300 -200 -100 0 100 200 300
Mag
netic
Fie
ld (m
G)
Distance from Center of Proposed Transmission Line (feet)
Magnetic Fields (Average Annual Loads) University of New Hampshire to Durham S/S
ExistingProposed

11
Figure 7 - Magnetic Field Calculations for Durham Substation to Packers Falls Substation
0
20
40
60
80
100
120
140
160
180
200
-300 -200 -100 0 100 200 300
Mag
netic
Fie
ld (m
G)
Distance from Center of Proposed Transmission Line (feet)
Magnetic Fields (Average Annual Loads) Durham S/S to Packers Falls S/S
ExistingProposed

12
Figure 8 - Magnetic Field Calculations for Packers Falls Substation to Newmarket Road
0
20
40
60
80
100
120
140
160
180
200
-300 -200 -100 0 100 200 300
Mag
netic
Fie
ld (m
G)
Distance from Center of Proposed Transmission Line (feet)
Magnetic Fields (Average Annual Loads) Packers Falls S/S to Newmarket Rd
ExistingProposed

13
Figure 9 - Magnetic Field Calculation for Newmarket Road to Durham Point Road
0
20
40
60
80
100
120
140
160
180
200
-300 -200 -100 0 100 200 300
Mag
netic
Fie
ld (m
G)
Distance from Center of Proposed Transmission Line (feet)
Magnetic Fields (Average Annual Loads) Newmarket Rd to Durham Point Rd
ExistingProposed

14
Figure 10 - Magnetic Field Calculations for Durham Point Road to Little Bay Transition
0
20
40
60
80
100
120
140
160
180
200
-300 -200 -100 0 100 200 300
Mag
netic
Fie
ld (m
G)
Distance from Center of Proposed Transmission Line (feet)
Magnetic Fields (Average Annual Loads) Durham Point Rd to Little Bay Transition
Existing

15
Figure 11 - Magnetic Field Calculations for Little Bay Launch to Little Bay Crossing
0
20
40
60
80
100
120
140
160
180
200
-300 -200 -100 0 100 200 300
Mag
netic
Fie
ld (m
G)
Distance from Center of Proposed Transmission Line (feet)
Magnetic Fields (Average Annual Loads) Little Bay Transition to Little Bay Crossing (UG)
ExistingProposed

16
Figure 12 - Magnetic Field Calculations for the Little Bay Crossing (Underwater Cables)
0
20
40
60
80
100
120
140
160
180
200
-300 -200 -100 0 100 200 300
Mag
netic
Fie
ld (m
G)
Distance from Center of Proposed Transmission Line (feet)
Magnetic Fields (Average Annual Loads) Little Bay Crossing (Underwater)
ExistingProposed

17
Figure 13 - Magnetic Field Calculations for Little Bay Crossing to Little Bay Road
0
20
40
60
80
100
120
140
160
180
200
-300 -200 -100 0 100 200 300
Mag
netic
Fie
ld (m
G)
Distance from Center of Proposed Transmission Line (feet)
Magnetic Fields (Average Annual Loads) Little Bay Crossing to Little Bay Road (UG)
ExistingProposed

18
Figure 14 - Magnetic Field Calculations for Little Bay Road to Fox Point Rd
0
20
40
60
80
100
120
140
160
180
200
-300 -200 -100 0 100 200 300
Mag
netic
Fie
ld (m
G)
Distance from Center of Proposed Transmission Line (feet)
Magnetic Fields (Average Annual Loads) Little Bay Road to Fox Point Rd
ExistingProposed

19
Figure 15 - Magnetic Field Calculations for Fox Point Rd to Spaulding Turnpike Crossing
0
20
40
60
80
100
120
140
160
180
200
-300 -200 -100 0 100 200 300
Mag
netic
Fie
ld (m
G)
Distance from Center of Proposed Transmission Line (feet)
Magnetic Fields (Average Annual Loads) Fox Point Rd to Spaulding Turnpike Crossing
ExistingProposed

20
Figure 16 - Magnetic Field Calculations for Spaulding Turnpike Crossing to Mall Parking Lot
0
20
40
60
80
100
120
140
160
180
200
-300 -200 -100 0 100 200 300
Mag
netic
Fie
ld (m
G)
Distance from Center of Proposed Transmission Line (feet)
Magnetic Fields (Average Annual Loads) Spaulding Turnpike to Mall Parking Lot
ExistingProposed

21
Figure 17 - Magnetic Field Calculations for Mall Parking Lot to the Portsmouth Substation
0
20
40
60
80
100
120
140
160
180
200
-300 -200 -100 0 100 200 300
Mag
netic
Fie
ld (m
G)
Distance from Center of Proposed Transmission Line (feet)
Magnetic Fields (Average Annual Loads) Mall Parking Lot to Portsmouth S/S
ExistingProposed

22
2.2 Calculation of EF from Transmission Lines
Eversource calculated pre- and post-construction electric field levels using methods described in the Electric Power Research Institute’s AC Transmission Line Reference Book – 200-kV and Above, Third. With accurate input data, the equations in these references will accurately predict electric fields measured near power lines. The inputs to the calculation are data regarding voltage, circuit phasing, conductor sizes and locations. The fields associated with power lines were estimated along profiles drawn perpendicular to the lines assuming flat terrain, at a point of lowest conductor sag for overhead transmission lines (25 feet for lowest conductor of an overhead 34.5-kV line, 30 feet for a 115-kV line or 35 feet for a 345-kV line) and at a point of shallowest depth for the underground 115-kV transmission line (45 inches for the uppermost power cable). All calculations were made for a height of 1 meter (3.28 feet) above ground, in accordance with standard practice (IEEE Std, 644-1994, R2008). Voltages were assumed to be at 1.05 per unit (105% of nominal voltage) which is the limit for operation of the system.
Additionally, electric field levels at 25-foot intervals are also presented for the base design together with associated magnetic field levels, in Attachment A.
Figure 18 - Electric Field Calculations for Madbury Substation to the Madbury Town Line
0
0.5
1
1.5
2
2.5
3
3.5
4
4.5
5
-300 -200 -100 0 100 200 300
Elec
tric
Fie
ld (k
V/m
)
Distance from Center of Proposed Transmission Line (feet)
Calculated Electric Fields Madbury S/S to Madbury Town Line
ExistingProposed
23
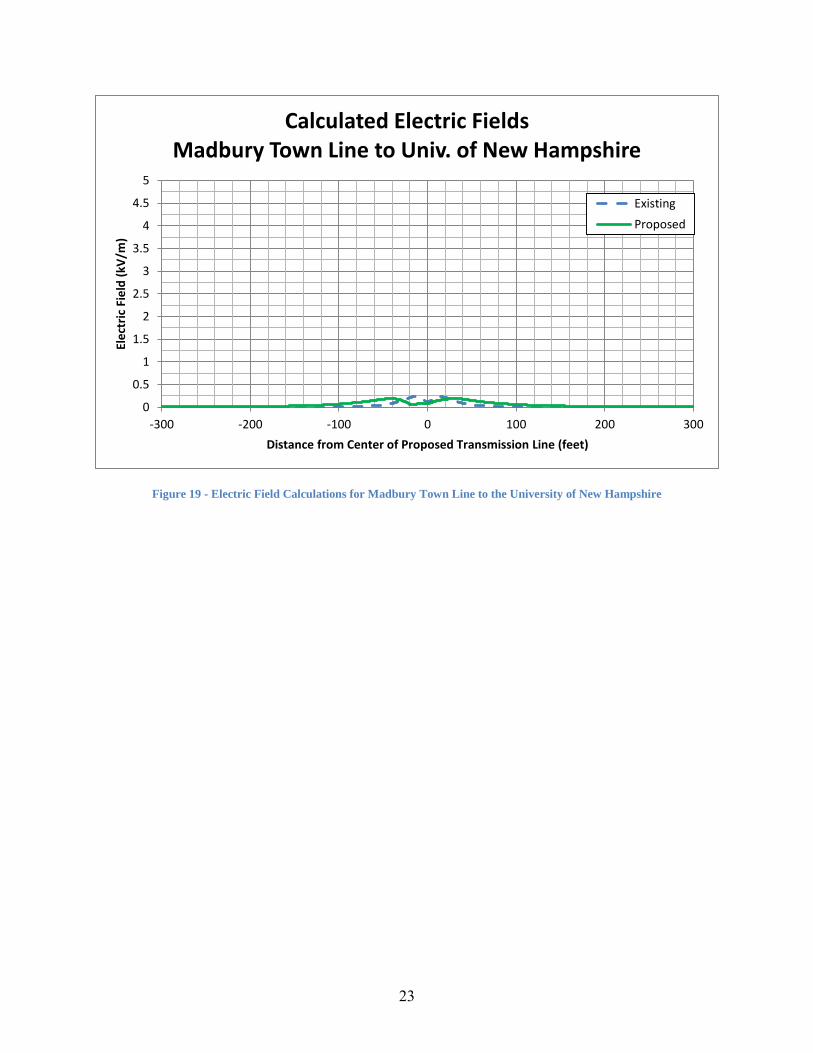
Figure 19 - Electric Field Calculations for Madbury Town Line to the University of New Hampshire
0
0.5
1
1.5
2
2.5
3
3.5
4
4.5
5
-300 -200 -100 0 100 200 300
Elec
tric
Fie
ld (k
V/m
)
Distance from Center of Proposed Transmission Line (feet)
Calculated Electric Fields Madbury Town Line to Univ. of New Hampshire
ExistingProposed

24
Because of the construction of underground cables, there are no electric fields outside of the cable. Therefore, no graphs were included for electric fields.

25
Figure 20 - Electric Field Calculations for the University of New Hampshire to Durham Substation
Figure 21 - Electric Field Calculations for Durham Substation to Packers Falls Substation
0
0.5
1
1.5
2
2.5
3
3.5
4
4.5
5
-300 -200 -100 0 100 200 300
Elec
tric
Fie
ld (k
V/m
)
Distance from Center of Proposed Transmission Line (feet)
Calculated Electric Fields University of New Hampshire to Durham S/S
ExistingProposed
0
0.5
1
1.5
2
2.5
3
3.5
4
4.5
5
-300 -200 -100 0 100 200 300
Elec
tric
Fie
ld (k
V/m
)
Distance from Center of Proposed Transmission Line (feet)
Calculated Electric Fields Durham S/S to Packers Falls S/S
ExistingProposed

26
Figure 22 - Electric Field Calculations for Packers Falls Substation to Newmarket Road
Figure 23 - Calculated Electric Fields from Newmarket Road to Durham Point Road
0
0.5
1
1.5
2
2.5
3
3.5
4
4.5
5
-300 -200 -100 0 100 200 300
Elec
tric
Fie
ld (k
V/m
)
Distance from Center of Proposed Transmission Line (feet)
Calculated Electric Fields Packers Falls S/S to Newmarket Road
ExistingProposed
0
0.5
1
1.5
2
2.5
3
3.5
4
4.5
5
-300 -200 -100 0 100 200 300
Elec
tric
Fie
ld (k
V/m
)
Distance from Center of Proposed Transmission Line (feet)
Calculated Electric Fields Newmarket Road to Durham Point Road
ExistingProposed

27
Figure 24 - Electric Field Calculations for Durham Point Road to Little Bay Launching Point
Because of the construction of underground cables, there are no electric fields outside of the cable. Therefore, no graphs were included for electric fields.
0
0.5
1
1.5
2
2.5
3
3.5
4
4.5
5
-300 -200 -100 0 100 200 300
Elec
tric
Fie
ld (k
V/m
)
Distance from Center of Proposed Transmission Line (feet)
Calculated Electric Fields Durham Point Road to Little Bay Transition
ExistingProposed

28
Figure 25 - Electric Field Calculations for Little Bay Road to Fox Point Rd
Figure 26 - Electric Field Calculations for Fox Point Rd to Spaulding Turnpike Crossing
0
0.5
1
1.5
2
2.5
3
3.5
4
4.5
5
-300 -200 -100 0 100 200 300
Elec
tric
Fie
ld (k
V/m
)
Distance from Center of Proposed Transmission Line (feet)
Calculated Electric Fields Little Bay Road to Fox Point Rd
ExistingProposed
0
0.5
1
1.5
2
2.5
3
3.5
4
4.5
5
-300 -200 -100 0 100 200 300
Elec
tric
Fie
ld (k
V/m
)
Distance from Center of Proposed Transmission Line (feet)
Calculated Electric Fields Frink Farm to Spaulding Turnpike
ExistingProposed

29
Figure 27 - Electric Field Calculations for Spaulding Turnpike Crossing to Mall Parking Lot
Figure 28 - Electric Field Calculations for Mall Parking Lot to Portsmouth Substation
0
0.5
1
1.5
2
2.5
3
3.5
4
4.5
5
-300 -200 -100 0 100 200 300
Elec
tric
Fie
ld (k
V/m
)
Distance from Center of Proposed Transmission Line (feet)
Calculated Electric Fields Spaulding Turnpike to Mall Parking Lot
ExistingProposed
0
0.5
1
1.5
2
2.5
3
3.5
4
4.5
5
-300 -200 -100 0 100 200 300
Elec
tric
Fie
ld (k
V/m
)
Distance from Center of Proposed Transmission Line (feet)
Calculated Electric Fields Mall Parking Lot to Portsmouth S/S
ExistingProposed

30
3 REFERENCES
CHAPTER Site 300 CERTIFICATES OF SITE AND FACILITY http://www.nhsec.nh.gov/rules/documents/chapter200.pdf
Institute of Electrical and Electronics Engineers (IEEE). 1990. IEEE guide for the design, construction, and operation of safe and reliable substations for environmental acceptance. IEEE Standard 1127-1998.
Department of Transportation, Federal Railroad Administration (DOT/FRA). EMF Monitoring on Amtrak’s Northeast Corridor: Post-Electrification Measurements and Analysis. Final Report DOT/FRA/RDV-06/01, October, 2006.
Institute of Electrical and Electronics Engineers (IEEE). IEEE recommended practice for instrumentation: specifications for magnetic flux density and electric field strength meters - 10 Hz to 3 kHz. IEEE Standard 1308-1994, R2001.
Institute of Electrical and Electronics Engineers (IEEE). IEEE standard procedures for measurement of power frequency electric and magnetic fields from AC power lines (Revision of IEEE Standard 644- 1987) IEEE Standard 644-1994, R2008.
Savitz DA, Pearce NE, Poole C. Methodological issues in the epidemiology of electromagnetic fields and cancer. Epidemiology Rev, 11:59-78, 1989.


A-1
Attachment A Tabulated Summaries of EMF Calculations

A-2
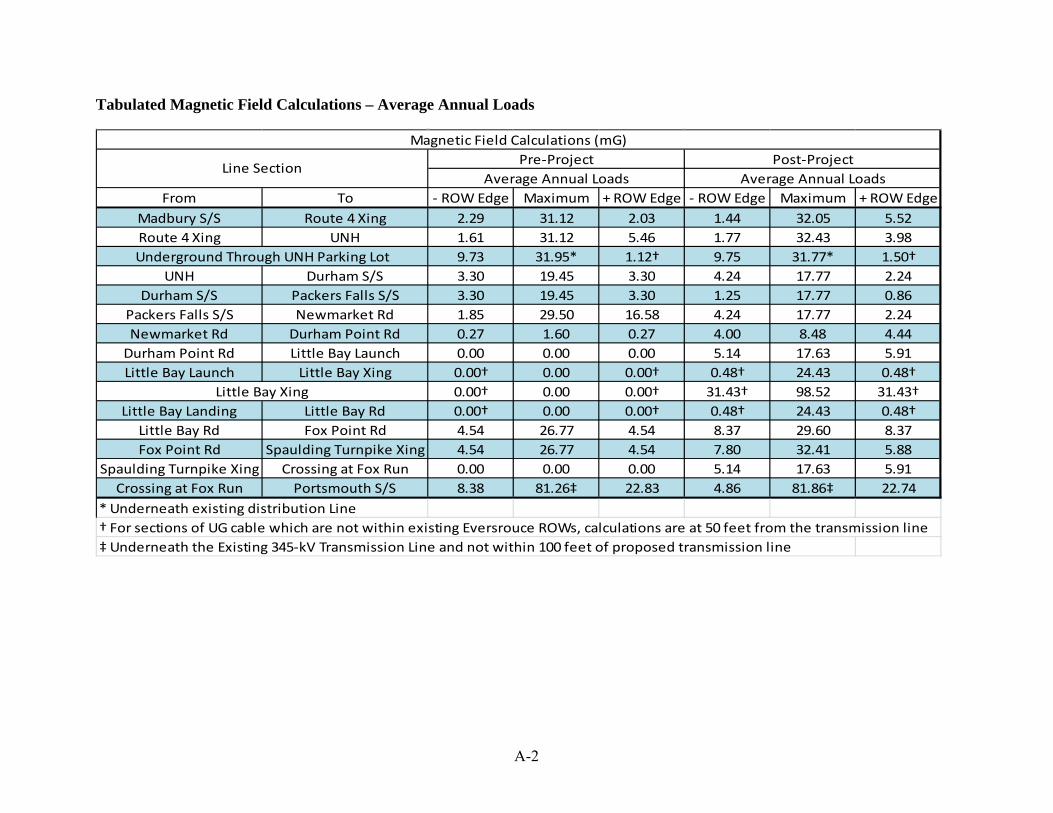
Tabulated Magnetic Field Calculations – Average Annual Loads
From To - ROW Edge Maximum + ROW Edge - ROW Edge Maximum + ROW EdgeMadbury S/S Route 4 Xing 2.29 31.12 2.03 1.44 32.05 5.52Route 4 Xing UNH 1.61 31.12 5.46 1.77 32.43 3.98
9.73 31.95* 1.12† 9.75 31.77* 1.50†UNH Durham S/S 3.30 19.45 3.30 4.24 17.77 2.24
Durham S/S Packers Falls S/S 3.30 19.45 3.30 1.25 17.77 0.86Packers Falls S/S Newmarket Rd 1.85 29.50 16.58 4.24 17.77 2.24Newmarket Rd Durham Point Rd 0.27 1.60 0.27 4.00 8.48 4.44
Durham Point Rd Little Bay Launch 0.00 0.00 0.00 5.14 17.63 5.91Little Bay Launch Little Bay Xing 0.00† 0.00 0.00† 0.48† 24.43 0.48†
0.00† 0.00 0.00† 31.43† 98.52 31.43†Little Bay Landing Little Bay Rd 0.00† 0.00 0.00† 0.48† 24.43 0.48†
Little Bay Rd Fox Point Rd 4.54 26.77 4.54 8.37 29.60 8.37Fox Point Rd Spaulding Turnpike Xing 4.54 26.77 4.54 7.80 32.41 5.88
Spaulding Turnpike Xing Crossing at Fox Run 0.00 0.00 0.00 5.14 17.63 5.91Crossing at Fox Run Portsmouth S/S 8.38 81.26‡ 22.83 4.86 81.86‡ 22.74
* Underneath existing distribution Line† For sections of UG cable which are not within existing Eversrouce ROWs, calculations are at 50 feet from the transmission line‡ Underneath the Existing 345-kV Transmission Line and not within 100 feet of proposed transmission line
Underground Through UNH Parking Lot
Magnetic Field Calculations (mG)
Line Section Pre-Project Post-ProjectAverage Annual Loads Average Annual Loads
Little Bay Xing

A-3
Tabulated Magnetic Field Calculations – Annual Peak Loads
From To - ROW Edge Maximum + ROW Edge - ROW Edge Maximum + ROW EdgeMadbury S/S Route 4 Xing 3.49 47.71 3.12 2.27 51.36 11.85Route 4 Xing UNH 2.48 47.71 8.37 2.58 46.21 6.10
14.92 48.99* 1.72† 14.93 48.62* 2.53†UNH Durham S/S 5.04 29.75 5.04 6.74 24.30 4.99
Durham S/S Packers Falls S/S 5.04 29.75 5.04 6.74 24.30 4.99Packers Falls S/S Newmarket Rd 1.73 29.60 16.53 10.24 32.15 22.11Newmarket Rd Durham Point Rd 0.39 2.29 0.39 7.98 17.53 8.88
Durham Point Rd Little Bay Launch 0.00 0.00 0.00 10.09 34.60 11.60Little Bay Launch Little Bay Xing 0.00† 0.00 0.00† 0.94† 47.96 0.93†
0.00† 0.00 0.00† 61.69† 193.40 61.69†Little Bay Landing Little Bay Rd 0.00† 0.00 0.00† 0.94† 47.96 0.93†
Little Bay Rd Fox Point Rd 6.92 40.84 6.92 16.44 58.10 16.44Fox Point Rd Spaulding Turnpike Xing 6.92 40.84 6.92 10.74 51.59 11.35
Spaulding Turnpike Xing Crossing at Fox Run 0.00 0.00 0.00 10.09 34.60 11.60Crossing at Fox Run Portsmouth S/S 9.66 141.22‡ 38.22 5.72 140.08‡ 38.25
* Underneath existing distribution Line† For sections of UG cable which are not within existing Eversrouce ROWs, calculations are at 50 feet from the transmission line‡ Underneath the Existing 345-kV Transmission Line and not within 100 feet of proposed transmission line
Underground Through UNH Parking Lot
Magnetic Field Calculations (mG)
Line Section Pre-Project Post-ProjectAnnual Peak Loads Annual Peak Loads
Little Bay Xing

A-4
Tabulated Electric Field Calculations
From To - ROW Edge Maximum + ROW Edge - ROW Edge Maximum + ROW EdgeMadbury S/S Route 4 Xing 0.02 0.26 0.02 0.03 1.07 0.32Route 4 Xing UNH 0.06 0.24 0.06 0.18 0.19 0.15
UNH Durham S/S 0.06 0.24 0.06 0.18 0.19 0.15Durham S/S Packers Falls S/S 0.06 0.24 0.06 0.18 0.19 0.15
Packers Falls S/S Newmarket Rd 0.09 0.29 0.24 0.21 0.22 0.16Newmarket Rd Durham Point Rd 0.06 0.24 0.06 0.18 0.19 0.15
Durham Point Rd Little Bay Launch 0.00 0.00 0.00 0.30 1.05 0.26Little Bay Launch Little Bay Xing
Little Bay Landing Little Bay RdLittle Bay Rd Fox Point Rd 0.06 0.24 0.06 0.53 1.20 0.53Fox Point Rd Spaulding Turnpike Xing 0.06 0.24 0.06 0.23 1.00 0.40
Spaulding Turnpike Xing Crossing at Fox Run 0.00 0.00 0.00 0.42 1.51 0.37Crossing at Fox Run Portsmouth S/S 0.26 4.14† 0.90 0.05 4.16† 0.91
* Underneath existing distribution Line† Underneath the Existing 345-kV Transmission Line and not within 100 feet of proposed transmission line
Electric Field Calculations (kV/m)Line Section Pre-Project Post-Project
Underground Through UNH Parking Lot No Electric Fields from UG Cables
No Electric Fields from UG CablesLittle Bay Xing
