elbow flexion and extension identification using surface ...€¦ · elbow flexion and extension...
TRANSCRIPT

ELBOW FLEXION AND EXTENSION IDENTIFICATION USING SURFACEELECTROMYOGRAPHY SIGNALS
A. Rubiano1,3, J. L. Ramırez1,3, M. N. El Korso1,3, L. Gallimard1,3, N. Jouandeau2,3, O. Polit1,3
1LEME, Universite Paris Ouest Nanterre La Defense,2LIASD, Universite Paris 8,3Universite Paris Lumiere,
50, rue de Sevres, 92410 Ville d’Avray, France.
ABSTRACTIn this paper, a new approach is presented for the analysisand the identification of the surface electromyography (EMG)signals of biceps and triceps muscles. The objective of thisstudy is the accurate classification of elbow flexion and ex-tension movements. We propose a cropping method based onthe agreement of the movement changes and the EMG signalusing the upper limb kinematic. Then, we perform the extrac-tion and selection of several well known features in time andfrequency domain. The selected features are used as inputsfor our support vector machine classifier that is designed us-ing an optimal weight vector criterion. Afterward, the trainingand test steps are performed in the proposed scheme. Finally,numerical simulation assesses the accuracy of the classifica-tion, as well as the robustness of the proposed approach con-sidering noisy measurements.
Index Terms— Electromyography, feature extraction,upper limb kinematic, support vector machine, quaternions.
1. INTRODUCTION
The surface electromyography (EMG) signal contains rele-vant information about the electrical activity produced by theneuromuscular process during contraction or relaxation [1].Due to the nature of the EMG, it is possible to extract somecharacteristics, which are useful to identify the producedmovements, as a function of the measured electrical activity.Nevertheless, the complexity of the measured EMG signalsmakes the detection and classification process a difficulttask [2].
In the literature, different studies had been carried out,with the aim to identify movements from EMG signals. In [3],the authors focused on the identification of five hand move-ments in which the obtained accuracy range was 94% to 99%.In the same way, [4] proposed the detection of the wrist andring finger movements and achieved an accuracy of 87.3%.More recently, in [5], the authors put forward the recognition
This work has been supported by the Universite Paris Lumiere throughthe ProMain project. A. Rubiano is with Universidad Militar Nueva Granada
of eight grasping gestures and earned an accuracy between96.9% and 99.65%.
Although these studies have reached good accuracies,none of them has considered the synchronization of the upperlimb kinematic with the EMG signal, to extract the signalfragment that match with each movement. Consequently, themain contributions of this paper are as follows:1. The development of an open source software, which can:a) show in real time the synchronization of upper limb kine-matic and EMG signals, b) fill automatically data gaps inkinematic data using quaternions approach, c) extract EMGsignals in an accurate way through the calculation of kine-matic parameters, during the flexion and extension.2. Design a methodology for analyzing and choosing thebests features to identify and classify movements, avoidingblack boxes, which improve the control of the classificationand generalization of the method.3. Propose a nonlinear support vector machine (SVM) classi-fier that is feeded with an experimental data set, that considervariations in kinematical parameters. Moreover, we performan exploration of the SVM settings, which give us an identi-fication of the parameters that influence the learning process.Finally, the robustness of the proposed scheme is test byartificially adding zero-mean white Gaussian noise.
As a result, we achieve and maintain an accuracy of99.79% using noisy measurements as input to the SVM clas-sifier instead of the noise-free measurements used in theprevious studies. Furthermore, we note that the obtained ac-curacy is achieved by testing the EMG signal from a new sub-ject. This achievement is highly important since it means thatthe proposed scheme is accurate and robust even in the pres-ence of new a subject not included in the learning process.Consequently, the proposed scheme ensures generalizationand applicability.
2. EXPERIMENT AND MATERIALS
Three healthy subjects have participated in the proposedexperiment. Each subject performed flexion and extension
23rd European Signal Processing Conference (EUSIPCO)
978-0-9928626-3-3/15/$31.00 ©2015 IEEE 649

Fig. 1. Distribution of markers in the upper limb kinematicchain.
movements, changing the covered angle and speed of move-ment while the upper limb motion tracking (ULMT) andEMG signals for biceps and triceps are recorded. Subjectone, two, and three, performed one, four, and six trials re-spectively, thus making a total of 44 recorded EMG signals.
The EMG signals have been recorded using the ZE-ROWIRE wireless EMG system with a sampling frequencyof 1 kHz. All subjects were equipped with two EMG sen-sors, which were located over the biceps branchis and triceps.We selected these muscles because they are the main mus-cles involved in the elbow flexion and extension [6], andconsequently, they produce high electrical activity during themovements.
The ULMT is performed using 7 3D VICON cameras andNexus software. The system has a sampling frequency of200 Hz. The subjects were equipped with 30 retro-reflectivemarkers, positioned all over the upper limb kinematic chainincluding the spinal column, see Fig. 1, distributed as fol-lows: i) Occipital bone (markers 1 to 3). ii) Cervical andlumbar vertebra (markers 4 to 13). iii) Sacrum (markers 13to 15). iv) Scapula (markers 16 and 17) v) Medial epicondyleof humerus (marker 18). vi) Coronoid process of ulna andradius (markers 19 and 20). vii) Styloid process of ulna andradius (markers 21 and 22). viii) Metacarpophalangeal jointof fingers 1, 2, 3 and 5 (markers 23 to 26). ix) Proximal inter-phalangeal joint of the fingers 2, 3 and 5 (markers 27 to 29).x) Interphalangeal joints of finger 1 (marker 30).
3. PRE-PROCESSING OF DATA
The pre-processing of data consist in the visualization andextraction of the EMG signals, that corresponds to the flexionand extension movement. For this issue, we develop an opensource software1 (developed in Matlab, see Fig. 2) which: i)Displays ULMT data, ii) displays the corresponding EMGsignals, iii) calculates the elbow angle and the correspond-ing angular velocity, iv) synchronizes in real time the EMGsignals and the ULMT data, with the aim of extracting sig-nals for flexion and extension movements from the raw EMGdata, taking into account the different sampling frequencies.
1The open source software will be available soon athttp://leme.u-paris10.fr/promain-565200.kjsp
Fig. 2. Software’s interface.
For the purpose of plotting the ULMT data, the markers areclustered by regions as follows: i) Head markers 1 to 3, ii)spinal column markers 4 to 13, iii) sacrum markers 13 to 15,iv) scapula markers 16 to 18, v) arm markers 18 to 20, vi)forearm markers 19 to 22 and vii) hand markers 21 to 30.These regions are used to draw lines between markers to al-low an easy interpretation of the 3D visualization, linking thescattered points in the graph (this explains that some markersare repeated in different clusters).
3.1. Automatic correction of missing data and outliers
Frequently, some markers of the ULMT disappear within sev-eral periods of times. Vicon Nexus software tries to recoverthe missing markers, but sometimes the software fails. Sothat, the missed values are assumed as zero by Matlab (seeFig. 3). Considering that the ULMT is used to the kinemat-ical analysis, it is important to retrieve the markers still lostafter Vicon Nexus software correction.
Consequently, we propose a mathematic model, whichcan automatically determine the values of the missed mark-ers. The model is based on quaternions, which are an aug-mented representation of a 3D vector. The quaternions areoften used in several domains, including computer graphics
Fig. 3. Examples of missing ULMT Markers.
23rd European Signal Processing Conference (EUSIPCO)
650
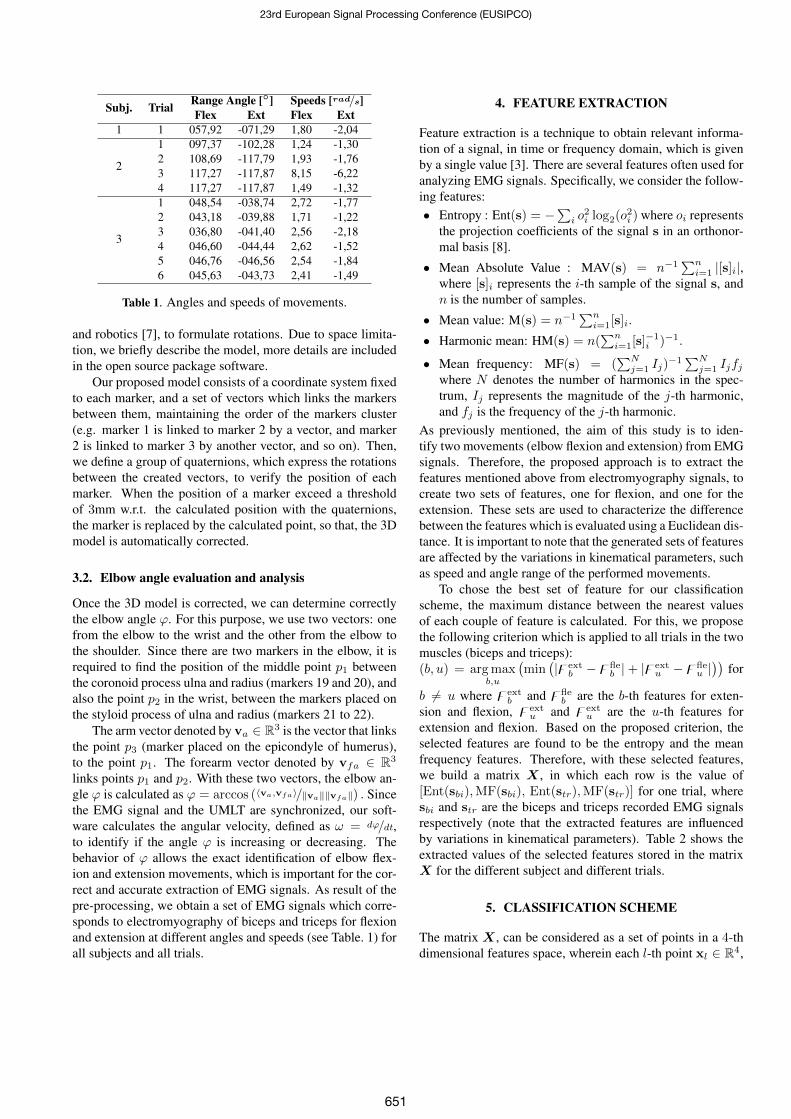
Subj. Trial Range Angle [◦] Speeds [rad/s]Flex Ext Flex Ext
1 1 057,92 -071,29 1,80 -2,04
2
1 097,37 -102,28 1,24 -1,302 108,69 -117,79 1,93 -1,763 117,27 -117,87 8,15 -6,224 117,27 -117,87 1,49 -1,32
3
1 048,54 -038,74 2,72 -1,772 043,18 -039,88 1,71 -1,223 036,80 -041,40 2,56 -2,184 046,60 -044,44 2,62 -1,525 046,76 -046,56 2,54 -1,846 045,63 -043,73 2,41 -1,49
Table 1. Angles and speeds of movements.
and robotics [7], to formulate rotations. Due to space limita-tion, we briefly describe the model, more details are includedin the open source package software.
Our proposed model consists of a coordinate system fixedto each marker, and a set of vectors which links the markersbetween them, maintaining the order of the markers cluster(e.g. marker 1 is linked to marker 2 by a vector, and marker2 is linked to marker 3 by another vector, and so on). Then,we define a group of quaternions, which express the rotationsbetween the created vectors, to verify the position of eachmarker. When the position of a marker exceed a thresholdof 3mm w.r.t. the calculated position with the quaternions,the marker is replaced by the calculated point, so that, the 3Dmodel is automatically corrected.
3.2. Elbow angle evaluation and analysis
Once the 3D model is corrected, we can determine correctlythe elbow angle ϕ. For this purpose, we use two vectors: onefrom the elbow to the wrist and the other from the elbow tothe shoulder. Since there are two markers in the elbow, it isrequired to find the position of the middle point p1 betweenthe coronoid process ulna and radius (markers 19 and 20), andalso the point p2 in the wrist, between the markers placed onthe styloid process of ulna and radius (markers 21 to 22).
The arm vector denoted by va ∈ R3 is the vector that linksthe point p3 (marker placed on the epicondyle of humerus),to the point p1. The forearm vector denoted by vfa ∈ R3
links points p1 and p2. With these two vectors, the elbow an-gle ϕ is calculated as ϕ = arccos (〈va,vfa〉/‖va‖‖vfa‖) . Sincethe EMG signal and the UMLT are synchronized, our soft-ware calculates the angular velocity, defined as ω = dϕ/dt,to identify if the angle ϕ is increasing or decreasing. Thebehavior of ϕ allows the exact identification of elbow flex-ion and extension movements, which is important for the cor-rect and accurate extraction of EMG signals. As result of thepre-processing, we obtain a set of EMG signals which corre-sponds to electromyography of biceps and triceps for flexionand extension at different angles and speeds (see Table. 1) forall subjects and all trials.
4. FEATURE EXTRACTION
Feature extraction is a technique to obtain relevant informa-tion of a signal, in time or frequency domain, which is givenby a single value [3]. There are several features often used foranalyzing EMG signals. Specifically, we consider the follow-ing features:• Entropy : Ent(s) = −
∑i o
2i log2(o2
i ) where oi representsthe projection coefficients of the signal s in an orthonor-mal basis [8].
• Mean Absolute Value : MAV(s) = n−1∑n
i=1 |[s]i|,where [s]i represents the i-th sample of the signal s, andn is the number of samples.
• Mean value: M(s) = n−1∑n
i=1[s]i.
• Harmonic mean: HM(s) = n(∑n
i=1[s]−1i )−1.
• Mean frequency: MF(s) = (∑N
j=1 Ij)−1∑N
j=1 Ijfjwhere N denotes the number of harmonics in the spec-trum, Ij represents the magnitude of the j-th harmonic,and fj is the frequency of the j-th harmonic.
As previously mentioned, the aim of this study is to iden-tify two movements (elbow flexion and extension) from EMGsignals. Therefore, the proposed approach is to extract thefeatures mentioned above from electromyography signals, tocreate two sets of features, one for flexion, and one for theextension. These sets are used to characterize the differencebetween the features which is evaluated using a Euclidean dis-tance. It is important to note that the generated sets of featuresare affected by the variations in kinematical parameters, suchas speed and angle range of the performed movements.
To chose the best set of feature for our classificationscheme, the maximum distance between the nearest valuesof each couple of feature is calculated. For this, we proposethe following criterion which is applied to all trials in the twomuscles (biceps and triceps):(b, u) = arg max
b,u
(min
(|zext
b −zfleb |+ |zext
u −zfleu |))
for
b 6= u where zextb and zfle
b are the b-th features for exten-sion and flexion, zext
u and zextu are the u-th features for
extension and flexion. Based on the proposed criterion, theselected features are found to be the entropy and the meanfrequency features. Therefore, with these selected features,we build a matrix X , in which each row is the value of[Ent(sbi),MF(sbi), Ent(str),MF(str)] for one trial, wheresbi and str are the biceps and triceps recorded EMG signalsrespectively (note that the extracted features are influencedby variations in kinematical parameters). Table 2 shows theextracted values of the selected features stored in the matrixX for the different subject and different trials.
5. CLASSIFICATION SCHEME
The matrix X , can be considered as a set of points in a 4-thdimensional features space, wherein each l-th point xl ∈ R4,
23rd European Signal Processing Conference (EUSIPCO)
651

rowFlexion
rowExtension
Biceps Triceps Biceps TricepsEnt MF Ent MF Ent MF Ent MF
1 3,3 269,4 3,4 270,2 12 3,7 267,1 2,3 262,62 3,4 270,3 2,0 259,0 13 2,0 259,3 2,2 261,93 3,5 271,0 2,0 259,7 14 2,0 259,3 2,2 262,04 3,2 272,6 2,5 262,7 15 2,5 262,6 2,5 263,85 3,5 269,8 2,1 258,0 16 1,8 257,6 2,4 264,66 4,4 280,6 2,8 266,7 17 2,6 263,4 2,9 269,87 3,0 269,8 2,2 262,1 18 2,3 265,6 2,1 267,18 3,2 272,6 2,5 262,7 19 2,5 262,6 2,5 263,89 3,4 269,5 2,1 260,0 20 2,3 263,8 1,7 260,710 4,3 273,7 2,7 264,4 21 2,6 263,7 3,0 271,211 3,3 269,1 2,3 262,6 22 2,1 261,5 2,2 265,9
Table 2. The feature matrix X in which rows one and twelveare trial extracted from subject one, rows two to five and rowsthirteen to sixteen are trials extracted from subject two, andthe other rows are trials extracted from subject three.
has an etiquette yl ∈ {1,−1}. The etiquette classifies thepoints into two categories: flexion or extension. The points ofthe matrixX can be separated, using a learning strategy basedon statistical theory, called support vector machine (SVM).The SVM calculate an optimal hyperplane between such cat-egories, using a matrix X ′ composed by q rows, where eachrow x′q is a support vector. In our case, the support vectorsare the rows three, four, six, fourteen, fifteen and seventeenof the matrix X , i.e. three vectors for flexion and three forextension.
In our study, a linear separation is not possible, ascan be seen from Fig. 4. Consequently, we propose touse a non-linear SVM classifier, where the optimal hyper-plane is obtained by solving a quadratic programming prob-lem (QPP) [9], given by minw,b,ξ
12w
Tw + C∑m
q=1[ξ]qs.t. yq
(wTφ(x′q) + b
)≥ 1 − [ξ]q and [ξ]q ≥ 0 for
q = 1, . . . ,m
where w and b determine the hyperplane in feature space,[ξ]q represents the error soft margin, C is a term to controlthe overfitting, m denotes the amount of support vectors in-
Fig. 4. Distribution of features for flexion and extension. Redcircles and blue squares represent, respectively, flexion andextension features.
Fig. 5. Percentage of classification as function of σ and C.
side X ′, and φ maps x′q into high-dimensional space. Thesolution of this problem, is the following decision function:Γ(xl) = sign
(∑mq=1 αqyqK(x′q,xl) + b
)in which αq
are the lagrange coefficients used to solve the QPP prob-lem [8], and K(x′q,xl) denotes a kernel function, that is, inour case, given by the following radial basis function (RBF):
K(x′q,xl) = exp−||x′q−xl||
2
2σ2 where σ denotes a positiveparameter for controlling the radius. This RBF function is se-lected due to its capacity of maximizing the distance betweenthe hyperplane and the points [10].Since we use six support vectors, the decision function Γ(xl)is applied to the remaining points xl of the matrix X . Then,the result of Γ(xl), is compared with yl. If the values match,it is considered that the SVM has correctly classified the pointxl. As a result, using a nonoptimal setting of σ and C, thealgorithm may achieve a classification percentage of 90.91%.This result shows that only two movements of all the trials(flexion of the second subject with trial three, and flexion ofthe third subject with trial three) are not correctly classified.It is important to remark that the SVM is trained only with13.63% of the whole trials (considering trials of subject twoand three), but the algorithm is able to classify correctly theEMG signals produced during flexion and extension of thefirst subject whose patterns are new for the classifier and wasnot used in the training step.To improve this result, we analyse the effect of the parametersσ and C in order to identify their influence on the final per-centage of classification. This numerical analysis consists ofa double iteration changing the values of the stated parame-ters. As result, we find that there is an optimal area for valuesof σ near to 1.1 and C close to 2.5, where the percentageof classification reaches 100% as is shown in Fig. 5. It isimportant to note that the 100% of successful classificationis due to the fixed (finite) number of testing data. To test themethod in a more realistic environment, the EMG signal maybe corrupted by noisy data. Such scenario is discussed in thefollowing section.
6. CLASSIFICATION ROBUSTNESS IN THEPRESENCE OF NOISY MEASUREMENTS
Even if we obtained an accurate result of EMG signals iden-tification with the nonlinear SVM classifier, it is necessary to
23rd European Signal Processing Conference (EUSIPCO)
652

Fig. 6. Classification results after adding noise for the firstsubject and trial one.
consider that there are several conditions that could influencethe results (e.g. the sweat and fatigue of the subject and dis-placement of the recording electrodes). The effect of someno idealistic conditions can be modeled as an additive whiteGaussian noise (AWGN) [1]. In our simulations, we addedAWGN to the biceps and triceps EMG signal measurementsof: (a) the first subject for trial 1, (b) the second subject fortrial 1, (c) the third subject for trial 5. Note that the con-taminated trials are only used to test the robustness and thus,they were not in the training set X ′ of SVM. The noise isgenerated for several values of signal to noise ratio (SNR),using 1000 Monte Carlo trials for each value of SNR. Thecorresponding noise values lies between 36 dB and 50dB.Subsequently of adding noise to these signals, the same pro-cess described in section 4 is applied to obtain features of thenoisy signals. The SVM achieves a successful classificationof 99.79%.
7. CONCLUSION
In this paper, a new elbow flexion and extension identifica-tion scheme is proposed. A quaternions based method wasused to correct the ULMT for data analysis, which let us cal-culate the position of missed kinematic markers. Moreover,with the corrected ULMT, we calculated, in an accurate way,the kinematic parameters as angles and speeds of the move-ment. These kinematic parameters allow us to identify withcertainty the fragment of the EMG signal that correspondsto a specific movement, permitting the analysis of the cor-rect signal. The above is one important difference with thestate of the art because authors usually use the complete EMGsignal or a fixed time window, so their result could not beproven for a specific movement. Consequently, out methodenables a better understanding of the EMG phenomena dur-ing the movement increasing the possibility of enforcementin movements recognition applications. Furthermore, we de-signed a novel criterion to select the best couple of features forthe classification. Then, we set up a nonlinear SVM classifier
that has as input the selected features. Finally, the numericalsimulation showed that the proposed scheme performs almostperfectly (99,79%) with a moderately contaminated measure-ment.
REFERENCES
[1] M. B. I. Reaz, M. S. Hussain, and F. Mohd-Yasin,“Techniques of EMG signal analysis: detection, pro-cessing, classification and applications,” BiologicalProcedures Online, vol. 8, no. 1, pp. 11–35, Dec. 2006.
[2] A. Alkan and M. Gnay, “Identification of EMG signalsusing discriminant analysis and SVM classifier,” ExpertSystems with Applications, vol. 39, no. 1, pp. 44–47,Jan. 2012.
[3] M.A. Oskoei and H. Huosheng, “Support vectormachine-based classification scheme for myoelectriccontrol applied to upper limb,” IEEE Transactions onBiomedical Engineering, vol. 55, no. 8, pp. 1956–1965,Aug. 2008.
[4] G. R. Naik, D.K. Kumar, and Jayadeva, “Twin SVMfor gesture classification using the surface electromyo-gram,” IEEE Transactions on Information Technologyin Biomedicine, vol. 14, no. 2, pp. 301–308, Mar. 2010.
[5] N. Wang, Y. Chen, and X. Zhang, “The recognition ofmulti-finger prehensile postures using LDA,” Biomed-ical Signal Processing and Control, vol. 8, no. 6, pp.706–712, Nov. 2013.
[6] A. Ali, K. Sundaraj, R. B. Ahmad, N. U. Ahamed, andA. Islam, “Surface electromyography for assessing tri-ceps brachii muscle activities: A literature review,” Bio-cybernetics and Biomedical Engineering, vol. 33, no. 4,pp. 187 – 195, 2013.
[7] P. Bell and I. Potapov, “Reachability problems inquaternion matrix and rotation semigroups,” Informa-tion and Computation, vol. 206, no. 11, pp. 1353 –1361, 2008.
[8] Q. Liu, X. Zhao, and Z. Hou, “Metric learning forevent-related potential component classification in EEGsignals,” in Proceedings of the 22nd European SignalProcessing Conference (EUSIPCO), Lisbon, Portugal,Sept. 2014, pp. 2005–2009, .
[9] F. F. Chamasemani and Y. P. Singh, “Multi-class sup-port vector machine (SVM) classifiers - an applicationin hypothyroid detection and classification,” in Sixthconference on Bio-Inspired Computing: Theroies andapplications, IEEE, Penang, Malaysia, Sept. 2011, pp.351–356, .
[10] X. Peng, “TPMSVM: A novel twin parametric-marginsupport vector machine for pattern recognition,” Pat-tern Recognition, vol. 44, no. 10-11, pp. 2678–2692,Oct. 2011.
23rd European Signal Processing Conference (EUSIPCO)
653