eia international energy outlook
TRANSCRIPT

DOE/EIA-0484(2009)
I n t e r n a t i o n a l
E n e r g y O u t l o o k
2 0 0 9
May 2009
Energy Information AdministrationOffice of Integrated Analysis and Forecasting
U.S. Department of EnergyWashington, DC 20585
This report was prepared by the Energy Information Administration, the independent statistical andanalytical agency within the Department of Energy. The information contained herein should beattributed to the Energy Information Administration and should not be construed as advocating orreflecting any policy position of the Department of Energy or of any other organization.
This publication is on the WEB at:
www.eia.doe.gov/oiaf/ieo/index.html.

Contacts
The International Energy Outlook is prepared by the Ener-gy Information Administration (EIA). General questionsconcerning the contents of the report should be referredto John J. Conti, Director, Office of Integrated Analysisand Forecasting ([email protected], 202-586-2222),
or Glen E. Sweetnam, Director, International, Economic,and Greenhouse Gases Division ([email protected], 202-586-2188). Specific questions about thereport should be referred to Linda E. Doman (202-586-1041) or the following analysts:
World Energy Demandand Economic Outlook . . . . . . . . . . . . . . . Linda E. Doman ([email protected], 202-586-1041)
Macroeconomic Assumptions . . . . . . Kay A. Smith ([email protected], 202-586-1132)
Liquid Fuels . . . . . . . . . . . . . . . . . . . . . . . . Lauren Mayne ([email protected], 202-586-3005)John Staub ([email protected], 202-586-6344)
Biofuels Production. . . . . . . . . . . . . . . Emre Yucel ([email protected] 202-586-9503)
Natural Gas . . . . . . . . . . . . . . . . . . . . . . . . . Justine Barden ([email protected] 202-586-3508)Aloulou Fawzi ([email protected] 202-586-1344)Phyllis Martin ([email protected], 202-586-9592)
Coal . . . . . . . . . . . . . . . . . . . . . . . . . . . . . . . . Michael Mellish ([email protected], 202-586-2136)Diane Kearney ([email protected], 202-586-2415)Stephanie Kette ([email protected], 202-586-3627)
Electricity . . . . . . . . . . . . . . . . . . . . . . . . . . . Linda Doman ([email protected], 202-586-1041)Renewable Generation . . . . . . . . . . . . Brian Murphy ([email protected], 202-586-1398)Solar Technologies . . . . . . . . . . . . . . . Marie LaRiviere ([email protected], 202-586-1475)
Industrial Sector . . . . . . . . . . . . . . . . . . . . . Kenneth Vincent ([email protected], 202-586-6582)
Transportation Sector . . . . . . . . . . . . . . . . Barry Kapilow-Cohen ([email protected], 202-586-5359)
Energy-Related Carbon DioxideEmissions . . . . . . . . . . . . . . . . . . . . . . . . . . . Perry Lindstrom ([email protected], 202-586-0934)
The following also contributed to production of the IEO2009 report: Randal Cook, Adrian Geagla, and John Holte.
ii Energy Information Administration / International Energy Outlook 2009
Electronic Access and Related Reports
IEO2009 will be available on CD-ROM and on the EIA Home Page (http://www.eia.doe.gov/oiaf/ieo/index.html) byMay 2009, including text, forecast tables, and graphics. To download the entire publication in Portable DocumentFormat (PDF), go to http://www.eia.doe.gov/oiaf/ieo/pdf/0484(2009).pdf.
For ordering information and questions on other energy statistics available from EIA, please contact EIA’s NationalEnergy Information Center. Addresses, telephone numbers, and hours are as follows:
National Energy Information Center, EI-30Energy Information AdministrationForrestal BuildingWashington, DC 20585
Telephone: 202/586-8800 E-mail: [email protected]: For people who are deaf World Wide Web Site: http://www.eia.doe.gov
or hard of hearing: 202/586-1181 Gopher Site: gopher://gopher.eia.doe.gov9 a.m. to 4 p.m., eastern time, M-F FTP Site: ftp://ftp.eia.doe.gov

ContentsPage
Energy Information Administration / International Energy Outlook 2009 iii
Preface . . . . . . . . . . . . . . . . . . . . . . . . . . . . . . . . . . . . . . . . . . . . . . . . . . . . . . . . . . . . . . . . . . . . . . . . . . . . . . . . . . . . . . . . . . . . ix
Highlights . . . . . . . . . . . . . . . . . . . . . . . . . . . . . . . . . . . . . . . . . . . . . . . . . . . . . . . . . . . . . . . . . . . . . . . . . . . . . . . . . . . . . . . . . 1World Energy Use by Fuel Type . . . . . . . . . . . . . . . . . . . . . . . . . . . . . . . . . . . . . . . . . . . . . . . . . . . . . . . . . . . . . . . . . . . . . 2World Delivered Energy Use by Sector . . . . . . . . . . . . . . . . . . . . . . . . . . . . . . . . . . . . . . . . . . . . . . . . . . . . . . . . . . . . . . . 5World Carbon Dioxide Emissions . . . . . . . . . . . . . . . . . . . . . . . . . . . . . . . . . . . . . . . . . . . . . . . . . . . . . . . . . . . . . . . . . . . 6
World Energy Demand and Economic Outlook . . . . . . . . . . . . . . . . . . . . . . . . . . . . . . . . . . . . . . . . . . . . . . . . . . . . . . . . . 7Outlook for World Energy Consumption by Source . . . . . . . . . . . . . . . . . . . . . . . . . . . . . . . . . . . . . . . . . . . . . . . . . . . . 9Delivered Energy Consumption by End-Use Sector . . . . . . . . . . . . . . . . . . . . . . . . . . . . . . . . . . . . . . . . . . . . . . . . . . . . 12World Economic Outlook . . . . . . . . . . . . . . . . . . . . . . . . . . . . . . . . . . . . . . . . . . . . . . . . . . . . . . . . . . . . . . . . . . . . . . . . . . 13Major Sources of Uncertainty in the Projections . . . . . . . . . . . . . . . . . . . . . . . . . . . . . . . . . . . . . . . . . . . . . . . . . . . . . . . . 17References . . . . . . . . . . . . . . . . . . . . . . . . . . . . . . . . . . . . . . . . . . . . . . . . . . . . . . . . . . . . . . . . . . . . . . . . . . . . . . . . . . . . . . . 19
Liquid Fuels . . . . . . . . . . . . . . . . . . . . . . . . . . . . . . . . . . . . . . . . . . . . . . . . . . . . . . . . . . . . . . . . . . . . . . . . . . . . . . . . . . . . . . . 21World Liquids Consumption . . . . . . . . . . . . . . . . . . . . . . . . . . . . . . . . . . . . . . . . . . . . . . . . . . . . . . . . . . . . . . . . . . . . . . . 22World Oil Prices . . . . . . . . . . . . . . . . . . . . . . . . . . . . . . . . . . . . . . . . . . . . . . . . . . . . . . . . . . . . . . . . . . . . . . . . . . . . . . . . . . 23World Liquids Production . . . . . . . . . . . . . . . . . . . . . . . . . . . . . . . . . . . . . . . . . . . . . . . . . . . . . . . . . . . . . . . . . . . . . . . . . 25Oil Reserves and Resources. . . . . . . . . . . . . . . . . . . . . . . . . . . . . . . . . . . . . . . . . . . . . . . . . . . . . . . . . . . . . . . . . . . . . . . . . 31References . . . . . . . . . . . . . . . . . . . . . . . . . . . . . . . . . . . . . . . . . . . . . . . . . . . . . . . . . . . . . . . . . . . . . . . . . . . . . . . . . . . . . . . 32
Natural Gas . . . . . . . . . . . . . . . . . . . . . . . . . . . . . . . . . . . . . . . . . . . . . . . . . . . . . . . . . . . . . . . . . . . . . . . . . . . . . . . . . . . . . . . . 35World Natural Gas Demand . . . . . . . . . . . . . . . . . . . . . . . . . . . . . . . . . . . . . . . . . . . . . . . . . . . . . . . . . . . . . . . . . . . . . . . . 35World Natural Gas Production. . . . . . . . . . . . . . . . . . . . . . . . . . . . . . . . . . . . . . . . . . . . . . . . . . . . . . . . . . . . . . . . . . . . . . 38Natural Gas Import Dependence . . . . . . . . . . . . . . . . . . . . . . . . . . . . . . . . . . . . . . . . . . . . . . . . . . . . . . . . . . . . . . . . . . . . 41World Natural Gas Reserves. . . . . . . . . . . . . . . . . . . . . . . . . . . . . . . . . . . . . . . . . . . . . . . . . . . . . . . . . . . . . . . . . . . . . . . . 44References . . . . . . . . . . . . . . . . . . . . . . . . . . . . . . . . . . . . . . . . . . . . . . . . . . . . . . . . . . . . . . . . . . . . . . . . . . . . . . . . . . . . . . . 46
Coal. . . . . . . . . . . . . . . . . . . . . . . . . . . . . . . . . . . . . . . . . . . . . . . . . . . . . . . . . . . . . . . . . . . . . . . . . . . . . . . . . . . . . . . . . . . . . . . 49World Coal Consumption. . . . . . . . . . . . . . . . . . . . . . . . . . . . . . . . . . . . . . . . . . . . . . . . . . . . . . . . . . . . . . . . . . . . . . . . . . 49World Coal Production . . . . . . . . . . . . . . . . . . . . . . . . . . . . . . . . . . . . . . . . . . . . . . . . . . . . . . . . . . . . . . . . . . . . . . . . . . . . 54World Coal Trade. . . . . . . . . . . . . . . . . . . . . . . . . . . . . . . . . . . . . . . . . . . . . . . . . . . . . . . . . . . . . . . . . . . . . . . . . . . . . . . . . 55World Coal Reserves . . . . . . . . . . . . . . . . . . . . . . . . . . . . . . . . . . . . . . . . . . . . . . . . . . . . . . . . . . . . . . . . . . . . . . . . . . . . . . 59References . . . . . . . . . . . . . . . . . . . . . . . . . . . . . . . . . . . . . . . . . . . . . . . . . . . . . . . . . . . . . . . . . . . . . . . . . . . . . . . . . . . . . . . 60
Electricity. . . . . . . . . . . . . . . . . . . . . . . . . . . . . . . . . . . . . . . . . . . . . . . . . . . . . . . . . . . . . . . . . . . . . . . . . . . . . . . . . . . . . . . . . . 63Electricity Supply by Energy Source . . . . . . . . . . . . . . . . . . . . . . . . . . . . . . . . . . . . . . . . . . . . . . . . . . . . . . . . . . . . . . . . . 63Regional Outlook . . . . . . . . . . . . . . . . . . . . . . . . . . . . . . . . . . . . . . . . . . . . . . . . . . . . . . . . . . . . . . . . . . . . . . . . . . . . . . . . . 70References . . . . . . . . . . . . . . . . . . . . . . . . . . . . . . . . . . . . . . . . . . . . . . . . . . . . . . . . . . . . . . . . . . . . . . . . . . . . . . . . . . . . . . . 82
Industrial Sector Energy Consumption . . . . . . . . . . . . . . . . . . . . . . . . . . . . . . . . . . . . . . . . . . . . . . . . . . . . . . . . . . . . . . . . 85Energy-Intensive Industries . . . . . . . . . . . . . . . . . . . . . . . . . . . . . . . . . . . . . . . . . . . . . . . . . . . . . . . . . . . . . . . . . . . . . . . . 87Regional Outlook . . . . . . . . . . . . . . . . . . . . . . . . . . . . . . . . . . . . . . . . . . . . . . . . . . . . . . . . . . . . . . . . . . . . . . . . . . . . . . . . . 90References . . . . . . . . . . . . . . . . . . . . . . . . . . . . . . . . . . . . . . . . . . . . . . . . . . . . . . . . . . . . . . . . . . . . . . . . . . . . . . . . . . . . . . . 94
Transportation Sector Energy Consumption. . . . . . . . . . . . . . . . . . . . . . . . . . . . . . . . . . . . . . . . . . . . . . . . . . . . . . . . . . . . 97OECD Countries. . . . . . . . . . . . . . . . . . . . . . . . . . . . . . . . . . . . . . . . . . . . . . . . . . . . . . . . . . . . . . . . . . . . . . . . . . . . . . . . . . 100Non-OECD Countries . . . . . . . . . . . . . . . . . . . . . . . . . . . . . . . . . . . . . . . . . . . . . . . . . . . . . . . . . . . . . . . . . . . . . . . . . . . . . 103References . . . . . . . . . . . . . . . . . . . . . . . . . . . . . . . . . . . . . . . . . . . . . . . . . . . . . . . . . . . . . . . . . . . . . . . . . . . . . . . . . . . . . . . 106
Energy-Related Carbon Dioxide Emissions . . . . . . . . . . . . . . . . . . . . . . . . . . . . . . . . . . . . . . . . . . . . . . . . . . . . . . . . . . . . 109Reference Case . . . . . . . . . . . . . . . . . . . . . . . . . . . . . . . . . . . . . . . . . . . . . . . . . . . . . . . . . . . . . . . . . . . . . . . . . . . . . . . . . . . 110Alternative Macroeconomic Growth Cases . . . . . . . . . . . . . . . . . . . . . . . . . . . . . . . . . . . . . . . . . . . . . . . . . . . . . . . . . . . 116Alternative Oil Price Cases . . . . . . . . . . . . . . . . . . . . . . . . . . . . . . . . . . . . . . . . . . . . . . . . . . . . . . . . . . . . . . . . . . . . . . . . . 116

Appendixes
Tables
Figures
iv Energy Information Administration / International Energy Outlook 2009
1. World Marketed Energy Consumption by Country Grouping, 2006-2030 . . . . . . . . . . . . . . . . . . . . . . . . . . . . . . . 72. World Gross Domestic Product by Country Grouping, 2006-2030 . . . . . . . . . . . . . . . . . . . . . . . . . . . . . . . . . . . . . . 143. World Liquid Fuels Production in the Reference Case, 2006-2030 . . . . . . . . . . . . . . . . . . . . . . . . . . . . . . . . . . . . . . 224. World Oil Reserves by Country as of January 1, 2009 . . . . . . . . . . . . . . . . . . . . . . . . . . . . . . . . . . . . . . . . . . . . . . . . . 315. World Natural Gas Production by Region and Country, 2006-2030 . . . . . . . . . . . . . . . . . . . . . . . . . . . . . . . . . . . . . 396. World Natural Gas Reserves by Country as of January 1, 2009 . . . . . . . . . . . . . . . . . . . . . . . . . . . . . . . . . . . . . . . . . 467. World Coal Production by Region, 2006-2030 . . . . . . . . . . . . . . . . . . . . . . . . . . . . . . . . . . . . . . . . . . . . . . . . . . . . . . . 548. World Coal Flows by Importing and Exporting Regions, Reference Case, 2007, 2015, and 2030 . . . . . . . . . . . . . 569. World Recoverable Coal Reserves as of January 1, 2006. . . . . . . . . . . . . . . . . . . . . . . . . . . . . . . . . . . . . . . . . . . . . . . 59
10. OECD and Non-OECD Net Electricty Generation by Energy Source, 2006-2030 . . . . . . . . . . . . . . . . . . . . . . . . . . 6411. OECD and Non-OECD Renewable Electricty Generation by Energy Source, 2006-2030. . . . . . . . . . . . . . . . . . . . 6712. OECD and Non-OECD Industrial Energy Consumption by Source, 2006-2030 . . . . . . . . . . . . . . . . . . . . . . . . . . . 8513. World Energy Consumption for Transportation by Country Grouping, 2006-2030. . . . . . . . . . . . . . . . . . . . . . . . 9714. World Energy-Related Carbon Dioxide Emissions in Selected Annex I Areas, 1990, 2006, and 2010 . . . . . . . . . . 11015. World Energy-Related Carbon Dioxide Emissions by Region, 1990-2030 . . . . . . . . . . . . . . . . . . . . . . . . . . . . . . . . 11116. Carbon Dioxide Intensity by Region and Country, 1980-2030. . . . . . . . . . . . . . . . . . . . . . . . . . . . . . . . . . . . . . . . . . 11417. Energy-Related Carbon Dioxide Emissions per Capita by Region and Country, 1990-2030 . . . . . . . . . . . . . . . . . 115
A. Reference Case Projections . . . . . . . . . . . . . . . . . . . . . . . . . . . . . . . . . . . . . . . . . . . . . . . . . . . . . . . . . . . . . . . . . . . . . . . 119B. High Economic Growth Case Projections . . . . . . . . . . . . . . . . . . . . . . . . . . . . . . . . . . . . . . . . . . . . . . . . . . . . . . . . . . . 137C. Low Economic Growth Case Projections. . . . . . . . . . . . . . . . . . . . . . . . . . . . . . . . . . . . . . . . . . . . . . . . . . . . . . . . . . . . 153D. High Oil Price Case Projections . . . . . . . . . . . . . . . . . . . . . . . . . . . . . . . . . . . . . . . . . . . . . . . . . . . . . . . . . . . . . . . . . . . 169E. Low Oil Price Case Projections . . . . . . . . . . . . . . . . . . . . . . . . . . . . . . . . . . . . . . . . . . . . . . . . . . . . . . . . . . . . . . . . . . . . 185F. Reference Case Projections by End-Use Sector and Country Grouping . . . . . . . . . . . . . . . . . . . . . . . . . . . . . . . . . . 201G. Projections of Liquid Fuels and Other Petroleum Production in Five Cases. . . . . . . . . . . . . . . . . . . . . . . . . . . . . . . 223H. Reference Case Projections for Electricity Capacity and Generation by Fuel . . . . . . . . . . . . . . . . . . . . . . . . . . . . . . 245I. Comparisons With International Energy Agency and IEO2008 Projections. . . . . . . . . . . . . . . . . . . . . . . . . . . . . . . 265J. Models Used To Generate the IEO2009 Projections . . . . . . . . . . . . . . . . . . . . . . . . . . . . . . . . . . . . . . . . . . . . . . . . . . . 271K. Regional Definitions . . . . . . . . . . . . . . . . . . . . . . . . . . . . . . . . . . . . . . . . . . . . . . . . . . . . . . . . . . . . . . . . . . . . . . . . . . . . 273
1. World Marketed Energy Consumption, 2006-2030. . . . . . . . . . . . . . . . . . . . . . . . . . . . . . . . . . . . . . . . . . . . . . . . . . . 12. World Marketed Energy Use by Fuel Type, 1980-2030. . . . . . . . . . . . . . . . . . . . . . . . . . . . . . . . . . . . . . . . . . . . . . . . 13. World Oil Prices in the IEO2009 and IEO2008 Reference Cases, 1980-2030 . . . . . . . . . . . . . . . . . . . . . . . . . . . . . . . 24. World Liquids Production, 2006-2030 . . . . . . . . . . . . . . . . . . . . . . . . . . . . . . . . . . . . . . . . . . . . . . . . . . . . . . . . . . . . . 25. Net Change in World Natural Gas Production, 2006-2030. . . . . . . . . . . . . . . . . . . . . . . . . . . . . . . . . . . . . . . . . . . . . 36. World Electricity Generation by Fuel, 2006-2030 . . . . . . . . . . . . . . . . . . . . . . . . . . . . . . . . . . . . . . . . . . . . . . . . . . . . 47. World Renewable Electricity Generation by Energy Source, 2006, 2015, and 2030 . . . . . . . . . . . . . . . . . . . . . . . . . 48. Net Increase in Industrial Energy Use by Region, 2006-2030 . . . . . . . . . . . . . . . . . . . . . . . . . . . . . . . . . . . . . . . . . . . 59. World Carbon Dioxide Emissions, 2006-2030 . . . . . . . . . . . . . . . . . . . . . . . . . . . . . . . . . . . . . . . . . . . . . . . . . . . . . . . 6
10. World Marketed Energy Consumption, 1980-2030. . . . . . . . . . . . . . . . . . . . . . . . . . . . . . . . . . . . . . . . . . . . . . . . . . . 711. World Marketed Energy Consumption: OECD and Non-OECD, 1980-2030 . . . . . . . . . . . . . . . . . . . . . . . . . . . . . 812. Marketed Energy Use by Region, 1990-2030 . . . . . . . . . . . . . . . . . . . . . . . . . . . . . . . . . . . . . . . . . . . . . . . . . . . . . . . . 813. Marketed Energy Use in the Non-OECD Economies by Region, 1980-2030 . . . . . . . . . . . . . . . . . . . . . . . . . . . . . . 814. World Marketed Energy Use by Fuel Type, 1980-2030. . . . . . . . . . . . . . . . . . . . . . . . . . . . . . . . . . . . . . . . . . . . . . . . 915. Coal Consumption in Selected World Regions, 1980-2030. . . . . . . . . . . . . . . . . . . . . . . . . . . . . . . . . . . . . . . . . . . . . 1016. World Electricity Generation by Fuel, 2006-2030 . . . . . . . . . . . . . . . . . . . . . . . . . . . . . . . . . . . . . . . . . . . . . . . . . . . . 1017. World Renewable Electricity Generation by Source, 2006-2030 . . . . . . . . . . . . . . . . . . . . . . . . . . . . . . . . . . . . . . . . 1018. Renewable Electricity Generation in China by Fuel, 2006-2030. . . . . . . . . . . . . . . . . . . . . . . . . . . . . . . . . . . . . . . . . 1119. World Nuclear Generating Capacity by Region, 2006, 2015, and 2030 . . . . . . . . . . . . . . . . . . . . . . . . . . . . . . . . . . . 1120. World Marketed Energy Consumption in Three Economic Growth Cases, 1980-2030 . . . . . . . . . . . . . . . . . . . . . 1721. World Oil Prices in Three Price Cases, 1980-2030 . . . . . . . . . . . . . . . . . . . . . . . . . . . . . . . . . . . . . . . . . . . . . . . . . . . . 1822. World Marketed Energy Consumption in Three Oil Price Cases, 2006-2030. . . . . . . . . . . . . . . . . . . . . . . . . . . . . . 1823. World Marketed Energy Consumption in Three Oil Price Cases, 2030 . . . . . . . . . . . . . . . . . . . . . . . . . . . . . . . . . . 18

Figures (Continued)
Energy Information Administration / International Energy Outlook 2009 v
24. World Liquids Consumption in Three Price Cases, 2030 . . . . . . . . . . . . . . . . . . . . . . . . . . . . . . . . . . . . . . . . . . . . . . 1925. World Liquids Consumption by Region and Country Group, 2006 and 2030 . . . . . . . . . . . . . . . . . . . . . . . . . . . . . 2126. World Liquids Supply in Three Cases, 2006 and 2030 . . . . . . . . . . . . . . . . . . . . . . . . . . . . . . . . . . . . . . . . . . . . . . . . 2127. World Production of Unconventional Liquid Fuels, 2006-2030 . . . . . . . . . . . . . . . . . . . . . . . . . . . . . . . . . . . . . . . . 2328. World Liquids Consumption by Sector, 2006-2030. . . . . . . . . . . . . . . . . . . . . . . . . . . . . . . . . . . . . . . . . . . . . . . . . . . 2329. World Oil Prices in Three Cases, 1980-2030 . . . . . . . . . . . . . . . . . . . . . . . . . . . . . . . . . . . . . . . . . . . . . . . . . . . . . . . . . 2430. Non-OPEC Conventional Liquids Production by Region, 2006 and 2030 . . . . . . . . . . . . . . . . . . . . . . . . . . . . . . . . 2631. OPEC Conventional Liquids Production by Region, 2006 and 2030. . . . . . . . . . . . . . . . . . . . . . . . . . . . . . . . . . . . . 2932. World Proved Oil Reserves by Geographic Region as of January 1, 2009. . . . . . . . . . . . . . . . . . . . . . . . . . . . . . . . . 3133. World Natural Gas Consumption, 1980-2030 . . . . . . . . . . . . . . . . . . . . . . . . . . . . . . . . . . . . . . . . . . . . . . . . . . . . . . . 3534. Natural Gas Consumption in North America by Country and Sector, 2006 and 2030 . . . . . . . . . . . . . . . . . . . . . . 3635. Natural Gas Consumption in OECD Asia by Country and Sector, 2006 and 2030 . . . . . . . . . . . . . . . . . . . . . . . . . 3736. Natural Gas Consumption in Non-OECD Europe and Eurasia, 1992-2030 . . . . . . . . . . . . . . . . . . . . . . . . . . . . . . . 3737. Natural Gas Consumption in Non-OECD Asia, 2006-2030 . . . . . . . . . . . . . . . . . . . . . . . . . . . . . . . . . . . . . . . . . . . . 3838. Imports as Share of OECD Natural Gas Consumption by Market, 2006-2030 . . . . . . . . . . . . . . . . . . . . . . . . . . . . . 4139. Imports as Share of Non-OECD Natural Gas Consumption by Country, 2006-2030 . . . . . . . . . . . . . . . . . . . . . . . 4540. World Natural Gas Reserves by Country Grouping, 1980-2008 . . . . . . . . . . . . . . . . . . . . . . . . . . . . . . . . . . . . . . . . 4541. World Natural Gas Reserves by Geographic Region as of January 1, 2009 . . . . . . . . . . . . . . . . . . . . . . . . . . . . . . . 4542. World Coal Consumption by Country Grouping, 1980-2030 . . . . . . . . . . . . . . . . . . . . . . . . . . . . . . . . . . . . . . . . . . 4943. Coal Share of World Energy Consumption by Sector, 2006, 2015, and 2030 . . . . . . . . . . . . . . . . . . . . . . . . . . . . . . 4944. OECD Coal Consumption by Region, 1980, 2006, 2015, and 2030 . . . . . . . . . . . . . . . . . . . . . . . . . . . . . . . . . . . . . . . 5045. Non-OECD Coal Consumption by Region, 1980, 2006, 2015, and 2030 . . . . . . . . . . . . . . . . . . . . . . . . . . . . . . . . . . 5146. Coal Consumption in China by Sector, 2006, 2015, and 2030 . . . . . . . . . . . . . . . . . . . . . . . . . . . . . . . . . . . . . . . . . . . 5147. Coal Imports by Major Importing Region, 1995-2030 . . . . . . . . . . . . . . . . . . . . . . . . . . . . . . . . . . . . . . . . . . . . . . . . . 5848. Growth in World Electric Power Generation and Total Energy Consumption, 1990-2030 . . . . . . . . . . . . . . . . . . 6349. World Net Electric Power Generation, 1980-2030 . . . . . . . . . . . . . . . . . . . . . . . . . . . . . . . . . . . . . . . . . . . . . . . . . . . . 6550. Non-OECD Net Electricity Generation by Region, 1980-2030 . . . . . . . . . . . . . . . . . . . . . . . . . . . . . . . . . . . . . . . . . . 6551. World Electricity Generation by Fuel, 2006-2030 . . . . . . . . . . . . . . . . . . . . . . . . . . . . . . . . . . . . . . . . . . . . . . . . . . . . 6552. World Net Electricity Generation from Nuclear Power by Region, 2006-2030 . . . . . . . . . . . . . . . . . . . . . . . . . . . . 6653. Net Electricity Generation in OECD North America, 1980-2030 . . . . . . . . . . . . . . . . . . . . . . . . . . . . . . . . . . . . . . . . 7054. Net Electricity Generation in OECD North America by Fuel, 2006 and 2030. . . . . . . . . . . . . . . . . . . . . . . . . . . . . . 7155. Renewable Electricity Generation in OECD Europe by Fuel, 2006-2030 . . . . . . . . . . . . . . . . . . . . . . . . . . . . . . . . . 7356. Net Electricity Generation in OECD Asia, 2006-2030 . . . . . . . . . . . . . . . . . . . . . . . . . . . . . . . . . . . . . . . . . . . . . . . . . 7557. Net Electricity Generation in Non-OECD Europe and Eurasia, 2006-2030 . . . . . . . . . . . . . . . . . . . . . . . . . . . . . . . 7658. Net Electricity Generation in Non-OECD Asia by Fuel, 2006-2030. . . . . . . . . . . . . . . . . . . . . . . . . . . . . . . . . . . . . . 7659. Net Electricity Generation in the Middle East by Fuel, 2006-2030 . . . . . . . . . . . . . . . . . . . . . . . . . . . . . . . . . . . . . . . 7860. Net Electricity Generation in Africa by Fuel, 2006-2030 . . . . . . . . . . . . . . . . . . . . . . . . . . . . . . . . . . . . . . . . . . . . . . . 8061. Net Electricity Generation in Brazil by Fuel, 2006-2030 . . . . . . . . . . . . . . . . . . . . . . . . . . . . . . . . . . . . . . . . . . . . . . . 8062. Net Electricity Generation in Other Central and South America by Fuel, 2006-2030 . . . . . . . . . . . . . . . . . . . . . . . 8163. OECD and Non-OECD Industrial Sector Energy Consumption, 2006-2030 . . . . . . . . . . . . . . . . . . . . . . . . . . . . . . 8664. World Industrial Sector Energy Consumption by Fuel, 2006 and 2030 . . . . . . . . . . . . . . . . . . . . . . . . . . . . . . . . . . 8665. World Industrial Sector Energy Consumption by Major Energy-Intensive Industry Shares, 2005 . . . . . . . . . . . 8767. OECD Industrial Sector Energy Consumption by Fuel, 2006 and 2030 . . . . . . . . . . . . . . . . . . . . . . . . . . . . . . . . . . 8966. OECD and Non-OECD Major Steel Producers, 2007 . . . . . . . . . . . . . . . . . . . . . . . . . . . . . . . . . . . . . . . . . . . . . . . . . 8968. Non-OECD Industrial Sector Energy Consumption by Fuel, 2006 and 2030 . . . . . . . . . . . . . . . . . . . . . . . . . . . . . . 9169. OECD and Non-OECD Transportation Sector Liquids Consumption, 2006-2030 . . . . . . . . . . . . . . . . . . . . . . . . . 9770. World Liquids Consumption by End-Use Sector, 2006-2030. . . . . . . . . . . . . . . . . . . . . . . . . . . . . . . . . . . . . . . . . . . 9971. OECD and Non-OECD Liquids Consumption by End-Use Sector, 2006 and 2030 . . . . . . . . . . . . . . . . . . . . . . . . . 9972. Average Annual Growth in OECD and Non-OECD Gross Domestic Product
and Transportation Sector Delivered Energy Use, 2006-2030 . . . . . . . . . . . . . . . . . . . . . . . . . . . . . . . . . . . . . . . . . . 9973. Change in OECD Transportation Sector Liquids Consumption by Region, 2006-2030 . . . . . . . . . . . . . . . . . . . . . 10074. Average Annual Change in Gross Domestic Product, Population, and Energy Consumption
for Transportation by OECD Region, 2006 to 2030 . . . . . . . . . . . . . . . . . . . . . . . . . . . . . . . . . . . . . . . . . . . . . . . . . . . 10175. Energy Consumption for Transportation in OECD Europe, 2006-2030 . . . . . . . . . . . . . . . . . . . . . . . . . . . . . . . . . . 10276. Average Annual Change in Gross Domestic Product, Population, and Energy Consumption
for Transportation by Non-OECD Region, 2006 to 2030. . . . . . . . . . . . . . . . . . . . . . . . . . . . . . . . . . . . . . . . . . . . . . . 10377. Non-OECD Asia and World Transportation Sector Liquids Consumption, 2006-2030 . . . . . . . . . . . . . . . . . . . . . 103

Figures (Continued)
Appendix Tables
vi Energy Information Administration / International Energy Outlook 2009
A1. World Total Primary Energy Consumption by Region, Reference Case, 1990-2030. . . . . . . . . . . . . . . . . . . . . . . . 121A2. World Total Energy Consumption by Region and Fuel, Reference Case, 1990-2030 . . . . . . . . . . . . . . . . . . . . . . . 122A3. World Gross Domestic Product (GDP) by Region Expressed in Purchasing Power Parity,
Reference Case, 1990-2030 . . . . . . . . . . . . . . . . . . . . . . . . . . . . . . . . . . . . . . . . . . . . . . . . . . . . . . . . . . . . . . . . . . . . . . . 124A4. World Gross Domestic Product (GDP) by Region Expressed in Market Exchange Rates,
Reference Case, 1990-2030 . . . . . . . . . . . . . . . . . . . . . . . . . . . . . . . . . . . . . . . . . . . . . . . . . . . . . . . . . . . . . . . . . . . . . . . 125A5. World Liquids Consumption by Region, Reference Case, 1990-2030 . . . . . . . . . . . . . . . . . . . . . . . . . . . . . . . . . . . . 126A6. World Natural Gas Consumption by Region, Reference Case, 1990-2030 . . . . . . . . . . . . . . . . . . . . . . . . . . . . . . . . 127A7. World Coal Consumption by Region, Reference Case, 1990-2030 . . . . . . . . . . . . . . . . . . . . . . . . . . . . . . . . . . . . . . 128A8. World Nuclear Energy Consumption by Region, Reference Case, 1990-2030 . . . . . . . . . . . . . . . . . . . . . . . . . . . . . 129A9. World Consumption of Hydroelectricity and Other Renewable Energy by Region, Reference Case,
1990-2030 . . . . . . . . . . . . . . . . . . . . . . . . . . . . . . . . . . . . . . . . . . . . . . . . . . . . . . . . . . . . . . . . . . . . . . . . . . . . . . . . . . . . . 130A10. World Carbon Dioxide Emissions by Region, Reference Case, 1990-2030 . . . . . . . . . . . . . . . . . . . . . . . . . . . . . . . . 131A11. World Carbon Dioxide Emissions from Liquids Use by Region, Reference Case, 1990-2030 . . . . . . . . . . . . . . . . 132A12. World Carbon Dioxide Emissions from Natural Gas Use by Region, Reference Case, 1990-2030. . . . . . . . . . . . . 133A13. World Carbon Dioxide Emissions from Coal Use by Region, Reference Case, 1990-2030 . . . . . . . . . . . . . . . . . . . 134A14. World Population by Region, Reference Case, 1990-2030 . . . . . . . . . . . . . . . . . . . . . . . . . . . . . . . . . . . . . . . . . . . . . 135
B1. World Total Primary Energy Consumption by Region, High Economic Growth Case, 1990-2030. . . . . . . . . . . . 139B2. World Total Energy Consumption by Region and Fuel, High Economic Growth Case, 1990-2030 . . . . . . . . . . . 140B3. World Gross Domestic Product (GDP) by Region Expressed in Purchasing Power Parity,
High Economic Growth Case, 1990-2030 . . . . . . . . . . . . . . . . . . . . . . . . . . . . . . . . . . . . . . . . . . . . . . . . . . . . . . . . . . . 142B4. World Liquids Consumption by Region, High Economic Growth Case, 1990-2030. . . . . . . . . . . . . . . . . . . . . . . . 143B5. World Natural Gas Consumption by Region, High Economic Growth Case, 1990-2030 . . . . . . . . . . . . . . . . . . . . 144B6. World Coal Consumption by Region, High Economic Growth Case, 1990-2030 . . . . . . . . . . . . . . . . . . . . . . . . . . 145B7. World Nuclear Energy Consumption by Region, High Economic Growth Case, 1990-2030. . . . . . . . . . . . . . . . . 146B8. World Consumption of Hydroelectricity and Other Renewable Energy by Region,
High Economic Growth Case, 1990-2030 . . . . . . . . . . . . . . . . . . . . . . . . . . . . . . . . . . . . . . . . . . . . . . . . . . . . . . . . . . . 147B9. World Carbon Dioxide Emissions by Region, High Economic Growth Case, 1990-2030. . . . . . . . . . . . . . . . . . . . 148
B10. World Carbon Dioxide Emissions from Liquids Use by Region, High Economic Growth Case, 1990-2030 . . . . 149B11. World Carbon Dioxide Emissions from Natural Gas Use by Region,
High Economic Growth Case, 1990-2030 . . . . . . . . . . . . . . . . . . . . . . . . . . . . . . . . . . . . . . . . . . . . . . . . . . . . . . . . . . . 150B12. World Carbon Dioxide Emissions from Coal Use by Region, High Economic Growth Case, 1990-2030 . . . . . . . 151
78. Energy Consumption for Passenger Transportation per Capita in China, India,and South Korea, 2006-2030 . . . . . . . . . . . . . . . . . . . . . . . . . . . . . . . . . . . . . . . . . . . . . . . . . . . . . . . . . . . . . . . . . . . . . . 104
79. Personal and Public Transportation Shares of Total Passenger Miles Traveledin OECD Asia and Non-OECD Asia, 2006 and 2030 . . . . . . . . . . . . . . . . . . . . . . . . . . . . . . . . . . . . . . . . . . . . . . . . . . 105
80. World Energy-Related Carbon Dioxide Emissions, 2006-2030 . . . . . . . . . . . . . . . . . . . . . . . . . . . . . . . . . . . . . . . . . 10981. World Energy-Related Carbon Dioxide Emissions by Fuel Type, 1990-2030 . . . . . . . . . . . . . . . . . . . . . . . . . . . . . 10982. U.S. Energy-Related Carbon Dioxide Emissions by Fuel in IEO2008 and IEO2009, 2006, 2015, and 2030 . . . . . . 11183. Average Annual Growth in Energy-Related Carbon Dioxide Emissions
in the OECD Economies, 2006-2030 . . . . . . . . . . . . . . . . . . . . . . . . . . . . . . . . . . . . . . . . . . . . . . . . . . . . . . . . . . . . . . . 11284. Average Annual Growth in Energy-Related Carbon Dioxide Emissions
in the Non-OECD Economies, 2006-2030 . . . . . . . . . . . . . . . . . . . . . . . . . . . . . . . . . . . . . . . . . . . . . . . . . . . . . . . . . . . 11285. World Carbon Dioxide Emissions from Liquids Combustion, 1990-2030 . . . . . . . . . . . . . . . . . . . . . . . . . . . . . . . . 11286. World Carbon Dioxide Emissions from Natural Gas Combustion, 1990-2030 . . . . . . . . . . . . . . . . . . . . . . . . . . . . 11387. World Carbon Dioxide Emissions from Coal Combustion, 1990-2030 . . . . . . . . . . . . . . . . . . . . . . . . . . . . . . . . . . . 11388. World Carbon Dioxide Emissions per Capita, 1990-2030. . . . . . . . . . . . . . . . . . . . . . . . . . . . . . . . . . . . . . . . . . . . . . 11589. Non-OECD Carbon Dioxide Emissions per Capita by Country and Region, 1990-2030 . . . . . . . . . . . . . . . . . . . . 11590. OECD Carbon Dioxide Emissions per Capita by Country and Region, 1990-2030 . . . . . . . . . . . . . . . . . . . . . . . . . 11691. Carbon Dioxide Emissions in Three Economic Growth Cases, 2006 and 2030 . . . . . . . . . . . . . . . . . . . . . . . . . . . . 11692. Carbon Dioxide Emissions in Three Oil Price Cases, 2006 and 2030 . . . . . . . . . . . . . . . . . . . . . . . . . . . . . . . . . . . . . 117K1. Map of the Six Basic Country Groupings . . . . . . . . . . . . . . . . . . . . . . . . . . . . . . . . . . . . . . . . . . . . . . . . . . . . . . . . . . . 273

Appendix Tables (Continued)
Energy Information Administration / International Energy Outlook 2009 vii
C1. World Total Energy Consumption by Region, Low Economic Growth Case, 1990-2030. . . . . . . . . . . . . . . . . . . . 155C2. World Total Energy Consumption by Region and Fuel, Low Economic Growth Case, 1990-2030 . . . . . . . . . . . . 156C3. World Gross Domestic Product (GDP) by Region Expressed in Purchasing Power Parity,
Low Economic Growth Case, 1990-2030. . . . . . . . . . . . . . . . . . . . . . . . . . . . . . . . . . . . . . . . . . . . . . . . . . . . . . . . . . . . 158C4. World Liquids Consumption by Region, Low Economic Growth Case, 1990-2030 . . . . . . . . . . . . . . . . . . . . . . . . 159C5. World Natural Gas Consumption by Region, Low Economic Growth Case, 1990-2030 . . . . . . . . . . . . . . . . . . . . 160C6. World Coal Consumption by Region, Low Economic Growth Case, 1990-2030 . . . . . . . . . . . . . . . . . . . . . . . . . . . 161C7. World Nuclear Energy Consumption by Region, Low Economic Growth Case, 1990-2030 . . . . . . . . . . . . . . . . . 162C8. World Consumption of Hydroelectricity and Other Renewable Energy by Region,
Low Economic Growth Case, 1990-2030. . . . . . . . . . . . . . . . . . . . . . . . . . . . . . . . . . . . . . . . . . . . . . . . . . . . . . . . . . . . 163C9. World Carbon Dioxide Emissions by Region, Low Economic Growth Case, 1990-2030 . . . . . . . . . . . . . . . . . . . . 164
C10. World Carbon Dioxide Emissions from Liquids Use by Region, Low Economic Growth Case, 1990-2030 . . . . . 165C11. World Carbon Dioxide Emissions from Natural Gas Use by Region,
Low Economic Growth Case, 1990-2030. . . . . . . . . . . . . . . . . . . . . . . . . . . . . . . . . . . . . . . . . . . . . . . . . . . . . . . . . . . . 166C12. World Carbon Dioxide Emissions from Coal Use by Region, Low Economic Growth Case, 1990-2030 . . . . . . . 167
D1. World Total Primary Energy Consumption by Region, High Oil Price Case, 1990-2030 . . . . . . . . . . . . . . . . . . . . 171D2. World Total Energy Consumption by Region and Fuel, High Oil Price Case, 1990-2030. . . . . . . . . . . . . . . . . . . . 172D3. World Gross Domestic Product (GDP) by Region Expressed in Purchasing Power Parity,
High Oil Price Case, 1990-2030 . . . . . . . . . . . . . . . . . . . . . . . . . . . . . . . . . . . . . . . . . . . . . . . . . . . . . . . . . . . . . . . . . . . 174D4. World Liquids Consumption by Region, High Oil Price Case, 1990-2030 . . . . . . . . . . . . . . . . . . . . . . . . . . . . . . . . 175D5. World Natural Gas Consumption by Region, High Oil Price Case, 1990-2030 . . . . . . . . . . . . . . . . . . . . . . . . . . . . 176D6. World Coal Consumption by Region, High Oil Price Case, 1990-2030 . . . . . . . . . . . . . . . . . . . . . . . . . . . . . . . . . . . 177D7. World Nuclear Energy Consumption by Region, High Oil Price Case, 1990-2030 . . . . . . . . . . . . . . . . . . . . . . . . . 178D8. World Consumption of Hydroelectricity and Other Renewable Energy by Region,
High OIl Price Case, 1990-2030 . . . . . . . . . . . . . . . . . . . . . . . . . . . . . . . . . . . . . . . . . . . . . . . . . . . . . . . . . . . . . . . . . . . 179D9. World Carbon Dioxide Emissions by Region, High Oil Price Case, 1990-2030 . . . . . . . . . . . . . . . . . . . . . . . . . . . . 180
D10. World Carbon Dioxide Emissions from Liquids Use by Region, High Oil Price Case, 1990-2030. . . . . . . . . . . . . 181D11. World Carbon Dioxide Emissions from Natural Gas Use by Region, High Oil Price Case, 1990-2030 . . . . . . . . . 182D12. World Carbon Dioxide Emissions from Coal Use by Region, High Oil Price Case, 1990-2030 . . . . . . . . . . . . . . . 183
E1. World Total Energy Consumption by Region, Low Oil Price Case, 1990-2030 . . . . . . . . . . . . . . . . . . . . . . . . . . . . 187E2. World Total Energy Consumption by Region and Fuel, Low Oil Price Case, 1990-2030 . . . . . . . . . . . . . . . . . . . . 188E3. World Gross Domestic Product (GDP) by Region Expressed in Purchasing Power Parity,
Low Oil Price Case, 1990-2030 . . . . . . . . . . . . . . . . . . . . . . . . . . . . . . . . . . . . . . . . . . . . . . . . . . . . . . . . . . . . . . . . . . . . 190E4. World Liquids Consumption by Region, Low Oil Price Case, 1990-2030. . . . . . . . . . . . . . . . . . . . . . . . . . . . . . . . . 191E5. World Natural Gas Consumption by Region, Low Oil Price Case, 1990-2030 . . . . . . . . . . . . . . . . . . . . . . . . . . . . . 192E6. World Coal Consumption by Region, Low Oil Price Case, 1990-2030 . . . . . . . . . . . . . . . . . . . . . . . . . . . . . . . . . . . 193E7. World Nuclear Energy Consumption by Region, Low Oil Price Case, 1990-2030. . . . . . . . . . . . . . . . . . . . . . . . . . 194E8. World Consumption of Hydroelectricity and Other Renewable Energy by Region,
Low Oil Price Case, 1990-2030 . . . . . . . . . . . . . . . . . . . . . . . . . . . . . . . . . . . . . . . . . . . . . . . . . . . . . . . . . . . . . . . . . . . . 195E9. World Carbon Dioxide Emissions by Region, Low Oil Price Case, 1990-2030. . . . . . . . . . . . . . . . . . . . . . . . . . . . . 196
E10. World Carbon Dioxide Emissions from Liquids Use by Region, Low Oil Price Case, 1990-2030 . . . . . . . . . . . . . 197E11. World Carbon Dioxide Emissions from Natural Gas Use by Region, Low Oil Price Case, 1990-2030 . . . . . . . . . 198E12. World Carbon Dioxide Emissions from Coal Use by Region, Low Oil Price Case, 1990-2030 . . . . . . . . . . . . . . . . 199
F1. Total World Delivered Energy Consumption by End-Use Sector and Fuel, 2006-2030 . . . . . . . . . . . . . . . . . . . . . 203F2. Total OECD Delivered Energy Consumption by End-Use Sector and Fuel, 2006-2030 . . . . . . . . . . . . . . . . . . . . . 204F3. Delivered Energy Consumption in the United States by End-Use Sector and Fuel, 2006-2030 . . . . . . . . . . . . . . . 205F4. Delivered Energy Consumption in Canada by End-Use Sector and Fuel, 2006-2030 . . . . . . . . . . . . . . . . . . . . . . . 206F5. Delivered Energy Consumption in Mexico by End-Use Sector and Fuel, 2006-2030 . . . . . . . . . . . . . . . . . . . . . . . 207F6. Delivered Energy Consumption in OECD Europe by End-Use Sector and Fuel, 2006-2030 . . . . . . . . . . . . . . . . . 208F7. Delivered Energy Consumption in Japan by End-Use Sector and Fuel, 2006-2030. . . . . . . . . . . . . . . . . . . . . . . . . 209F8. Delivered Energy Consumption in South Korea by End-Use Sector and Fuel, 2006-2030 . . . . . . . . . . . . . . . . . . . 210F9. Delivered Energy Consumption in Australia/New Zealand by End-Use Sector and Fuel, 2006-2030 . . . . . . . . 211
F10. Total Non-OECD Delivered Energy Consumption by End-Use Sector and Fuel, 2006-2030. . . . . . . . . . . . . . . . . 212F11. Delivered Energy Consumption in Russia by End-Use Sector and Fuel, 2006-2030 . . . . . . . . . . . . . . . . . . . . . . . . 213F12. Delivered Energy Consumption in Other Non-OECD Europe and Eurasia
by End-Use Sector and Fuel, 2006-2030 . . . . . . . . . . . . . . . . . . . . . . . . . . . . . . . . . . . . . . . . . . . . . . . . . . . . . . . . . . . . 214

Appendix Tables (Continued)
viii Energy Information Administration / International Energy Outlook 2009
F13. Delivered Energy Consumption in China by End-Use Sector and Fuel, 2006-2030 . . . . . . . . . . . . . . . . . . . . . . . . 215F14. Delivered Energy Consumption in India by End-Use Sector and Fuel, 2006-2030 . . . . . . . . . . . . . . . . . . . . . . . . . 216F15. Delivered Energy Consumption in Other Non-OECD Asia by End-Use Sector and Fuel, 2006-2030. . . . . . . . . . 217F16. Delivered Energy Consumption in the Middle East by End-Use Sector and Fuel, 2006-2030 . . . . . . . . . . . . . . . . 218F17. Delivered Energy Consumption in Africa by End-Use Sector and Fuel, 2006-2030 . . . . . . . . . . . . . . . . . . . . . . . . 219F18. Delivered Energy Consumption in Brazil by End-Use Sector and Fuel, 2006-2030. . . . . . . . . . . . . . . . . . . . . . . . . 220F19. Delivered Energy Consumption in Other Central and South America
by End-Use Sector and Fuel, 2006-2030 . . . . . . . . . . . . . . . . . . . . . . . . . . . . . . . . . . . . . . . . . . . . . . . . . . . . . . . . . . . . 221
G1. World Total Liquids Production by Region and Country, Reference Case, 1990-2030. . . . . . . . . . . . . . . . . . . . . . 225G2. World Conventional Liquids Production by Region and Country, Reference Case, 1990-2030 . . . . . . . . . . . . . . 226G3. World Unconventional Liquids Production by Region and Country, Reference Case, 1990-2030 . . . . . . . . . . . . 228G4. World Total Liquids Production by Region and Country, High Oil Price Case, 1990-2030 . . . . . . . . . . . . . . . . . . 229G5. World Conventional Liquids Production by Region and Country, High Oil Price Case, 1990-2030 . . . . . . . . . . 230G6. World Unconventional Liquids Production by Region and Country, High Oil Price Case, 1990-2030 . . . . . . . . 232G7. World Total Liquids Production by Region and Country, Low Oil Price Case, 1990-2030 . . . . . . . . . . . . . . . . . . 233G8. World Conventional Liquids Production by Region and Country, Low Oil Price Case, 1990-2030 . . . . . . . . . . . 234G9. World Unconventional Liquids Production by Region and Country, Low Oil Price Case, 1990-2030 . . . . . . . . . 236
G10. World Total Liquids Production by Region and Country, High Economic Growth Case, 1990-2030. . . . . . . . . . 237G11. World Conventional Liquids Production by Region and Country,
High Economic Growth Case, 1990-2030 . . . . . . . . . . . . . . . . . . . . . . . . . . . . . . . . . . . . . . . . . . . . . . . . . . . . . . . . . . . 238G12. World Unconventional Liquids Production by Region and Country,
High Economic Growth Case, 1990-2030 . . . . . . . . . . . . . . . . . . . . . . . . . . . . . . . . . . . . . . . . . . . . . . . . . . . . . . . . . . . 240G13. World Total Liquids Production by Region and Country, Low Economic Growth Case, 1990-2030 . . . . . . . . . . 241G14. World Conventional Liquids Production by Region and Country, Low Economic Growth Case, 1990-2030. . . 242G15. World Unconventional Liquids Production by Region and Country,
Low Economic Growth Case, 1990-2030. . . . . . . . . . . . . . . . . . . . . . . . . . . . . . . . . . . . . . . . . . . . . . . . . . . . . . . . . . . . 244
H1. World Total Installed Generating Capacity by Region and Country, 2006-2030. . . . . . . . . . . . . . . . . . . . . . . . . . . 247H2. World Installed Liquids-Fired Generating Capacity by Region and Country, 2006-2030 . . . . . . . . . . . . . . . . . . . 248H3. World Installed Natural-Gas-Fired Generating Capacity by Region and Country, 2006-2030 . . . . . . . . . . . . . . . 249H4. World Installed Coal-Fired Generating Capacity by Region and Country, 2006-2030 . . . . . . . . . . . . . . . . . . . . . . 250H5. World Installed Nuclear Generating Capacity by Region and Country, 2006-2030 . . . . . . . . . . . . . . . . . . . . . . . . 251H6. World Installed Hydroelectric Generating Capacity by Region and Country, 2006-2030 . . . . . . . . . . . . . . . . . . . 252H7. World Installed Wind-Powered Generating Capacity by Region and Country, 2006-2030. . . . . . . . . . . . . . . . . . 253H8. World Installed Geothermal Generating Capacity by Region and Country, 2006-2030. . . . . . . . . . . . . . . . . . . . . 254H9. World Installed Other Renewable Generating Capacity by Region and Country, 2006-2030 . . . . . . . . . . . . . . . . 255
H10. World Total Net Electricity Generation From Central Producers by Region and Country, 2006-2030. . . . . . . . . 256H11. World Net Liquids-Fired Electricity Generation From Central Producers
by Region and Country, 2006-2030 . . . . . . . . . . . . . . . . . . . . . . . . . . . . . . . . . . . . . . . . . . . . . . . . . . . . . . . . . . . . . . . . 257H12. World Net Natural-Gas-Fired Electricity Generation From Central Producers
by Region and Country, 2006-2030 . . . . . . . . . . . . . . . . . . . . . . . . . . . . . . . . . . . . . . . . . . . . . . . . . . . . . . . . . . . . . . . . 258H13. World Net Coal-Fired Electricity Generation From Central Producers by Region and Country, 2006-2030 . . . . 259H14. World Net Nuclear Electricity Generation From Central Producers by Region and Country, 2006-2030 . . . . . . 260H15. World Net Hydroelectric Generation From Central Producers by Region and Country, 2006-2030 . . . . . . . . . . 261H16. World Net Wind-Powered Electricity Generation From Central Producers
by Region and Country, 2006-2030 . . . . . . . . . . . . . . . . . . . . . . . . . . . . . . . . . . . . . . . . . . . . . . . . . . . . . . . . . . . . . . . . 262H17. World Net Geothermal Electricity Generation From Central Producers
by Region and Country, 2006-2030 . . . . . . . . . . . . . . . . . . . . . . . . . . . . . . . . . . . . . . . . . . . . . . . . . . . . . . . . . . . . . . . . 263H18. World Net Other Renewable Electricity Generation From Central Producers
by Region and Country, 2006-2030 . . . . . . . . . . . . . . . . . . . . . . . . . . . . . . . . . . . . . . . . . . . . . . . . . . . . . . . . . . . . . . . . 264
I1. Comparison of IEO2009 and IEA World Energy Consumption Growth Rates by Region, 2006-2015 . . . . . . . . . 265I2. Comparison of IEO2009 and IEA World Energy Consumption Growth Rates by Region, 2015-2030 . . . . . . . . . 267I3. Comparison of IEO2009 and IEA World Energy Consumption Growth Rates by Fuel, 2006-2015. . . . . . . . . . . . 267I4. Comparison of IEO2009 and IEA World Energy Consumption Growth Rates by Fuel, 2015-2030. . . . . . . . . . . . 268I5. Comparison of IEO2009 and IEO2008 Total World Energy Consumption, Reference Case, 2015 and 2030 . . . . 269I6. Comparison of IEO2009 and IEO2008 World Energy Consumption by Fuel, Reference Case, 2015 and 2030 . . 270

PrefaceThis report presents international energy projections through 2030,
prepared by the Energy Information Administration, including outlooks
for major energy fuels and associated carbon dioxide emissions.
The International Energy Outlook 2009 (IEO2009) presentsan assessment by the Energy Information Administra-tion (EIA) of the outlook for international energymarkets through 2030. U.S. projections appearing inIEO2009 are consistent with those published in EIA’sAnnual Energy Outlook 2009 (AEO2009), in March 2009.A revised, updated AEO2009 reference case projectionwas released on April 17, 2009. It reflects the impact ofprovisions in the American Recovery and ReinvestmentAct of 2009 (ARRA2009), enacted in mid-February 2009,on U.S. energy markets. The revised AEO2009 referencecase includes updates for the U.S. macroeconomic out-look, which has been changing at an unusually rapidrate in recent months. Throughout IEO2009, significantchanges to the U.S. outlook relative to the publishedAEO2009 reference case are noted for the reader’sreference.
IEO2009 is provided as a service to energy managers andanalysts, both in government and in the private sector.The projections are used by international agencies, Fed-eral and State governments, trade associations, andother planners and decisionmakers. They are publishedpursuant to the Department of Energy Organization Actof 1977 (Public Law 95-91), Section 205(c).
Projections in IEO2009 are divided according to Organi-zation for Economic Cooperation and Developmentmembers (OECD) and non-members (non-OECD).There are three basic country groupings in the OECD:North America (United States, Canada, and Mexico);OECD Europe; and OECD Asia (Japan, South Korea,and Australia/New Zealand) (see Appendix K for
complete regional definitions). Non-OECD is dividedinto five separate regional subgroups: non-OECDEurope and Eurasia, non-OECD Asia, Africa, MiddleEast, and Central and South America. Russia is repre-sented in non-OECD Europe and Eurasia; China andIndia are represented in non-OECD Asia; and Brazil isrepresented in Central and South America.
IEO2009 focuses exclusively on marketed energy. Non-marketed energy sources, which continue to play animportant role in some developing countries, are notincluded in the estimates. The IEO2009 projections arebased on U.S. and foreign government laws in effect onJanuary 1, 2009. The potential impacts of pending orproposed legislation, regulations, and standards are notreflected in the projections, nor are the impacts of legis-lation for which the implementing mechanisms have notyet been announced.
The report begins with a review of world trends inenergy demand and the major macroeconomic assump-tions used in deriving the IEO2009 projections, alongwith the major sources of uncertainty in the forecast. Thetime frame for historical data begins with 1980 andextends to 2006, and the projections extend to 2030. Higheconomic growth and low economic growth cases weredeveloped to depict a set of alternative growth paths forthe energy projections. The two cases consider higherand lower growth paths for regional gross domesticproduct (GDP) than are assumed in the reference case.IEO2009 also includes a high oil price case and, alterna-tively, a low oil price case. The resulting projections—and the uncertainty associated with international energy
Energy Information Administration / International Energy Outlook 2009 ix
Objectives of the IEO2009 Projections
The projections in IEO2009 are not statements of what will happen, but what might happen given the specificassumptions and methodologies used. The projections provide an objective, policy-neutral reference case that canbe used to analyze international energy markets. As a policy-neutral data and analysis organization, EIA does notpropose, advocate, or speculate on future legislative and regulatory changes.
Models are abstractions of energy production and consumption activities, regulatory activities, and producer andconsumer behavior. The projections are highly dependent on the data, analytical methodologies, model structures,and specific assumptions used in their development. Trends depicted in the analysis are indicative of tendencies inthe real world rather than representations of specific real-world outcomes. Even where trends are stable and wellunderstood, the projections are subject to uncertainty. Many events that shape energy markets are random and can-not be anticipated, and assumptions concerning future technology characteristics, demographics, and resourceavailability are necessarily uncertain.

projections in general—are discussed in Chapter 1,“World Energy Demand and Economic Outlook.”
Regional projections for energy consumption by fuel—liquids (primarily petroleum), natural gas, and coal—are presented in Chapters 2, 3, and 4, along withreviews of the current status of each fuel on a worldwidebasis. Chapter 5 discusses the projections for world elec-tricity markets—including nuclear power, hydropower,and other commercial renewable energy resources—and presents forecasts of world installed generatingcapacity. Chapter 6 provides a discussion of industrialsector energy use. Chapter 7 includes a detailed look atthe world’s transportation energy use. Finally, Chapter 8discusses the outlook for global energy-related carbondioxide emissions.
Appendix A contains summary tables for the IEO2009reference case projections of world energy consumption,GDP, energy consumption by fuel, carbon dioxide
emissions, and regional population growth. Summarytables of projections for the high and low economicgrowth cases are provided in Appendixes B and C,respectively, and projections for the high and low oilprice cases are provided in Appendixes D and E, respec-tively. Reference case projections of delivered energyconsumption by end-use sector and region are pre-sented in Appendix F. Appendix G contains summarytables of projections for world liquids production in allcases. Appendix H contains summary tables of referencecase projections for installed electric power capacity byfuel and regional electricity generation by fuel. Appen-dix I includes a set of comparisons of projections fromthe International Energy Agency’s World Energy Outlook2008 with the IEO2009 projections. Comparisons of theIEO2009 and IEO2008 projections are also presented inAppendix I. Appendix J describes the models used togenerate the IEO2009 projections, and Appendix Kdefines the regional designations included in the report.
x Energy Information Administration / International Energy Outlook 2009

HighlightsWorld marketed energy consumption is projected to increase by 44 percent
from 2006 to 2030. Total energy demand in the non-OECD countries increases
by 73 percent, compared with an increase of 15 percent in the OECD countries.
In the IEO2009 reference case—which reflects a scenarioin which current laws and policies remain unchangedthroughout the projection period—world marketedenergy consumption is projected to grow by 44 percentover the 2006 to 2030 period. Total world energy userises from 472 quadrillion British thermal units (Btu) in2006 to 552 quadrillion Btu in 2015 and then to 678quadrillion Btu in 2030 (Figure 1). The current world-wide economic downturn dampens world demand forenergy in the near term, as manufacturing and con-sumer demand for goods and services slows. In thelonger term, with economic recovery anticipated after2010, most nations return to trend growth in incomeand energy demand.
The most rapid growth in energy demand from 2006to 2030 is projected for nations outside the Organizationfor Economic Cooperation and Development (non-OECD nations). Total non-OECD energy consumptionincreases by 73 percent in the IEO2009 reference caseprojection, as compared with a 15-percent increase inenergy use among the OECD countries. Strong long-term GDP growth in the emerging economies of the
non-OECD countries drives the fast-paced growth inenergy demand. In all the non-OECD regions combined,economic activity—measured by GDP in purchasingpower parity terms—increases by 4.9 percent per yearon average, as compared with an average of 2.2 percentper year for the OECD countries.
The IEO2009 reference case projects increased worldconsumption of marketed energy from all fuel sourcesover the 2006 to 2030 projection period (Figure 2). Fossilfuels (liquid fuels and other petroleum,1 natural gas, andcoal) are expected to continue supplying much of theenergy used worldwide. Liquids supply the largestshare of world energy consumption over the projectionperiod; however, their share falls from 36 percent in 2006to 32 percent in 2030, as projected high world oil priceslead many energy users, especially in the industrial andelectric power sectors, to switch away from liquid fuelswhen feasible.
Average world oil prices2 increased each year between2003 and 2008. Spot prices reached $147 per barrel (innominal dollars) in mid-July 2008, when they were well
Energy Information Administration / International Energy Outlook 2009 1
472508
552596
637678
2006 2010 2015 2020 2025 20300
200
400
600
800Quadrillion Btu
OECD
Non-OECD
Figure 1. World Marketed Energy Consumption,2006-2030
Sources: 2006: Energy Information Administration (EIA),International Energy Annual 2006 (June-December 2008),web site www.eia.doe.gov/iea. Projections: EIA, WorldEnergy Projections Plus (2009).
1980 1995 2006 2015 20300
50
100
150
200
250Quadrillion Btu
History Projections
Liquids (Including Biofuels)
Natural Gas
Coal Renewables(Excluding Biofuels)
Nuclear
Figure 2. World Marketed Energy Use by FuelType, 1980-2030
Sources: 2006: Energy Information Administration (EIA),International Energy Annual 2006 (June-December 2008),web site www.eia.doe.gov/iea. Projections: EIA, WorldEnergy Projections Plus (2009).
1Liquid fuels and other petroleum include petroleum-derived fuels and non-petroleum-derived fuels, such as ethanol and biodiesel,coal-to-liquids, and gas-to-liquids. Petroleum coke, which is a solid, is included. Also included are natural gas liquids, crude oil consumedas a fuel, and liquid hydrogen.
2The world oil price reported in IEO2009 is for light sweet crude oil delivered to Cushing, Oklahoma. This price series is consistent withspot prices for light, sweet crude oil reported on the New York Mercantile Exchange (NYMEX). All oil prices are in real 2007 dollars per bar-rel, unless otherwise noted.

above the historical inflation-adjusted record price for abarrel of oil, which was set in the early 1980s. Afterreaching the July 2008 high mark, however, prices fellsharply. As the world’s economies recover, world oilprices are assumed to rebound and rise in real termsthrough 2030. In the IEO2009 reference case, the price oflight sweet crude oil in the United States (in real 2007dollars) rises from $61 per barrel in 2009 to $110 per bar-rel in 2015 and $130 per barrel in 2030.
World Energy Use by Fuel TypeLiquids are expected to remain the world’s dominantenergy source throughout the IEO2009 reference caseprojection, given their importance in the transportationand industrial end-use sectors. World use of liquids andother petroleum grows from 85 million barrels per dayin 2006 to 91 million barrels per day in 2015 and 107 mil-lion barrels per day in 2030. Only in the transportationsector are liquids relatively unaffected by the projectedhigh world oil prices. Although world oil prices in 2030in the IEO2009 reference case are 80 percent higher thanprojected in IEO2008 (Figure 3), liquids consumption inthe world transportation sector in 2030 is only 9 percentlower in this year’s outlook, reflecting the expectationthat, absent significant technological advances, liquidswill continue to be the primary energy source in theworld’s transportation sector.
To meet the increment in world liquids demand in theIEO2009 reference case, total supply in 2030 is projected
to be 22.0 million barrels per day higher than the 2006level of 84.6 million barrels per day. The reference caseassumes that OPEC will maintain a share of approxi-mately 40 percent of total world liquids productionthrough 2030, consistent with recent trends. Increasingvolumes of conventional liquids (crude oil and leasecondensate, natural gas plant liquids, and refinery gain)from OPEC members contribute 8.2 million barrels perday to the total increase in world liquids production,and conventional liquids supplies from non-OPECcountries add another 3.4 million barrels per day(Figure 4).
Unconventional resources (including oil sands, extra-heavy oil, biofuels, coal-to-liquids, and gas-to-liquids)from both OPEC and non-OPEC sources are expected tobecome increasingly competitive in the reference case.World production of unconventional resources, whichtotaled only 3.1 million barrels per day in 2006, increasesto 13.4 million barrels per day and accounts for 13 per-cent of total world liquids supply in 2030.
Biofuels, including ethanol and biodiesel, will be anincreasingly important source of unconventional liquidssupply, reaching 5.9 million barrels per day in 2030.Particularly strong growth in biofuels consumption isprojected for the United States, where production ofbiofuels increases from 0.3 million barrels per day in2006 to 1.9 million barrels per day in 2030, supported bylegislation in the Energy Independence and Security Actof 2007 that mandates increased U.S. use of biofuels.Other regions with sizable projected increases in bio-fuels production include OECD Europe, non-OECDAsia, and Central and South America. Those regions,together with the United States, account for 75 percent ofthe world increase in biofuels production.
2 Energy Information Administration / International Energy Outlook 2009
1980 1990 2000 2007 2020 20300
50
100
1502007 Dollars per Barrel
History Projections
IEO2009
IEO2008
Figure 3. World Oil Prices in the IEO2009 andIEO2008 Reference Cases, 1980-2030
Sources: History: Energy Information Administration (EIA),International Energy Annual 2006 (June-December 2008),web site www.eia.doe.gov/iea. IEO2008: EIA, InternationalEnergy Outlook 2008, DOE/EIA-0484(2008) (Washington, DC,September 2009), web site www.eia.doe.gov/oiaf/ieo/ieoarchive.html. IEO2009: EIA, Annual Energy Outlook 2009,DOE/EIA-0383(2009) (Washington, DC, March 2009), website www.eia.doe.gov/oiaf/aeo.
2006 2010 2015 2020 2025 20300
25
50
75
100
125Million Barrels per Day
Total
OPEC Conventional
Non-OPEC Conventional
Unconventional
Figure 4. World Liquids Production, 2006-2030
Sources: 2006: Energy Information Administration (EIA),International Energy Annual 2006 (June-December 2008),web site www.eia.doe.gov/iea. Projections: EIA, GenerateWorld Oil Balance Model (2009).

Natural gas consumption worldwide increases in theIEO2009 reference case from 104 trillion cubic feet in2006 to 153 trillion cubic feet in 2030. With world oilprices rebounding from their early 2009 level, as theworld economy recovers from the current downturn,and then continuing to grow in real terms through theend of the projection period, consumers opt for compar-atively less expensive natural gas for their energy needswhenever possible. As a result, natural gas remains akey energy source in the industrial sector and for elec-tricity generation. The industrial sector currently con-sumes more natural gas than any other end-use sector,and this is expected to remain true in the reference casethrough 2030, when 40 percent of the world’s natural gassupply is used for industrial purposes. Electricity gener-ation accounts for 35 percent of the world’s total naturalgas consumption in 2030, up from 32 percent in 2006.
To meet the projected growth in demand for natural gas,the world’s producers will need to increase annual pro-duction in 2030 to a level that is 49 trillion cubic feethigher than the 2006 total. Much of the increase innatural gas production is expected to come from thenon-OECD countries. In the IEO2009 reference case,natural gas production in the non-OECD nations in 2030is 41 trillion cubic feet higher than in 2006, accountingfor about 84 percent of the total increase in worldsupply. By region, the Middle East, non-OECD Europeand Eurasia, and non-OECD Asia each supplies about20 percent of the increase (Figure 5). Africa, which is animportant source of new natural gas production, pro-vides 15 percent of the total world increment.
Natural gas production from the OECD nations is pro-jected to increase by 7.8 trillion cubic feet from 2006 to2030 in the reference case. The largest increase amongthe OECD nations is projected for the United States, at5.3 trillion cubic feet. Unconventional natural gas is thelargest contributor to the growth in U.S. production, asrising prices and improvements in drilling technologyprovide the economic incentives necessary for exploita-tion of more costly resources. Unconventional naturalgas production—both from natural gas in tight sand for-mations and from shale formations—increases from 47percent of the U.S. total in 2006 to 56 percent in 2030.
In the absence of national policies and/or binding inter-national agreements that would limit or reduce green-house gas emissions, world coal consumption isprojected to increase from 127 quadrillion Btu in 2006 to190 quadrillion Btu in 2030, an average annual rate of1.7 percent. Much of the projected increase in coal useoccurs in the non-OECD Asia region, which accountsfor nearly 90 percent of the total world increase in coaluse from 2006 to 2030. In fact, much of the region’sincrease in energy demand is expected to be met by coal,particularly in the electric power and industrial sectors.For example, installed coal-fired generating capacity in
China is projected to nearly triple from 2006 to 2030, andcoal use in China’s industrial sector grows by nearly 60percent. The development of China’s electric power andindustrial sectors will require not only large-scale infra-structure investments but also substantial investment inboth coal mining and coal transportation infrastructure.
World net electricity generation increases by 77 percentin the reference case, from 18.0 trillion kilowatthoursin 2006 to 23.2 trillion kilowatthours in 2015 and 31.8trillion kilowatthours in 2030. Although the currenteconomic downturn is expected to dampen electricitydemand in the near term, the IEO2009 reference caseassumes that growth in electricity demand will return totrend after 2010. In general, the growth in OECD coun-tries, where electricity markets are well established andconsuming patterns are mature, is slower than in thenon-OECD countries, where a large amount of potentialdemand remains unsatisfied. In the reference case, totalnet generation in the non-OECD countries increases byan average of 3.5 percent per year, compared with anaverage of 1.2 percent per year in the OECD nations.
The rapid increase in world energy prices from 2003 to2008, combined with concerns about the environmentalconsequences of greenhouse gas emissions, has led torenewed interest in the development of alternatives tofossil fuels. With high world oil prices expected to returnand growth in demand for liquids and other energyexpected to resume when economies begin to recoverfrom the current global downturn, renewable energy isthe fastest-growing source of world electricity genera-tion in the IEO2009 reference case, supported both bythe expected high prices for fossil fuels and by govern-ment incentives for the development of alternativeenergy sources.
Energy Information Administration / International Energy Outlook 2009 3
Middle East
Non-OECD Europe/Eurasia
Non-OECD Asia
Africa
United States
Central & South America
Australia/New Zealand
Other OECD
0 2 4 6 8 10 12-2
Trillion Cubic Feet
Figure 5. Net Change in World Natural GasProduction, 2006-2030
Sources: 2006: Energy Information Administration (EIA),International Energy Annual 2006 (June-December 2008),web site www.eia.doe.gov/iea. Projections: EIA, WorldEnergy Projections Plus (2009).

From 2006 to 2030, world renewable energy use for elec-tricity generation grows by an average of 2.9 percent peryear (Figure 6), and the renewable share of world elec-tricity generation increases from 19 percent in 2006 to21 percent in 2030.3 Natural gas and coal are the secondand third fastest-growing energy sources for electricitygeneration in the projection; however, the outlook forcoal, in particular, could be altered substantially by anyfuture legislation that would reduce or limit the growthof greenhouse gas emissions.
Much of the world increase in renewable electricitysupply is fueled by hydropower and wind power. Of the3.3 trillion kilowatthours of new renewable generationadded over the projection period, 1.8 trillion kilowatt-hours (54 percent) is attributed to hydropower and 1.1trillion kilowatthours (33 percent) to wind. Except forthose two sources, most renewable energy technologiesare not economically competitive with fossil fuels overthe projection period, outside a limited number of nichemarkets. Solar power, for instance, typically is uneco-nomical but can be economical where electricity pricesare high and government incentives are available. Infact, government incentives or policies typically providethe primary support for construction of any renewablegeneration facilities.
The mix of renewable fuels consumed differs betweenthe OECD and non-OECD regions in the IEO2009 refer-ence case projection. In the OECD nations, the majority
of economically exploitable hydroelectric resourcesalready have been used, and there are few large-scalehydroelectric power projects planned for the future(Figure 7). As a result, most of the growth in renewableenergy use in the OECD countries is expected for othersources, led by wind and biomass. In the non-OECDnations, hydropower is the predominant source ofrenewable energy growth, with mid- to large-scalehydroelectric plants expected to be completed in China,India, Brazil, and a number of nations in Southeast Asia,including Vietnam and Laos. Wind-powered electricitygeneration also is expected to grow significantly in thenon-OECD countries, including substantial additions ofwind electricity to the grid in China.
Electricity generation from nuclear power is projected toincrease from about 2.7 trillion kilowatthours in 2006 to3.8 trillion kilowatthours in 2030, as concerns aboutrising fossil fuel prices, energy security, and greenhousegas emissions support the development of new nucleargeneration capacity. Higher fossil fuel prices allownuclear power to become economically competitivewith generation from coal, natural gas, and liquidsdespite the relatively high capital and maintenance costsassociated with nuclear power plants. Moreover, highercapacity utilization rates have been reported for manyexisting nuclear facilities, and it is anticipated that mostof the older nuclear power plants in the OECD countriesand non-OECD Eurasia will be granted extensions totheir operating lives.
4 Energy Information Administration / International Energy Outlook 2009
2006 2010 2015 2020 2025 20300
10
20
30
40Trillion Kilowatthours
Liquids
Coal
Natural Gas
Renewables
Nuclear
Figure 6. World Electricity Generation by Fuel,2006-2030
Sources: 2006: Energy Information Administration (EIA),International Energy Annual 2006 (June-December 2008),web site www.eia.doe.gov/iea. Projections: EIA, WorldEnergy Projections Plus (2009).
2006 2015OECD
2030 2006 2015 20300
1
2
3
4Trillion Kilowatthours
Hydropower
Wind
Other
Non-OECD
Figure 7. World Renewable Electricity Generationby Energy Source, 2006, 2015, and 2030
Sources: 2006: Energy Information Administration (EIA),International Energy Annual 2006 (June-December 2008),web site www.eia.doe.gov/iea. Projections: EIA, WorldEnergy Projections Plus (2009).
3The IEO2009 reference case does not reflect the provisions of American Recovery and Reinvestment Act of 2009 (ARRA2009). In theupdated AEO2009 reference case (April 2009), a significant expansion in the use of renewable fuels for U.S. electricity generation is projected,particularly in the near term. An extension of key Federal tax credits and a new loan guarantee program in ARRA2009 both stimulateincreased renewable generation relative to the published reference case (March 2009). In 2030, U.S. renewable electricity generation in thepublished reference case accounts for 14.2 percent of total U.S. net generation; but in the updated reference case, renewables account for 15.8percent of total U.S. net generation in 2030, or about 67 billion kilowatthours more than projected in the published reference case.

Despite the growing worldwide interest in nuclearpower development, there is considerable uncertaintyassociated with this energy source. Issues that couldslow the expansion of nuclear power in the futureinclude plant safety, radioactive waste disposal, andconcerns that weapons-grade uranium may be pro-duced from facilities installed to enrich uranium forcivilian nuclear power programs. These issues continueto raise public concerns in many countries and may hin-der the development of new nuclear power reactors.Nevertheless, the IEO2009 reference case incorporatesthe improved prospects for world nuclear power. TheIEO2009 projection for nuclear electricity generation in2025 is 25 percent higher than the projection publishedin IEO2004 only 5 years ago.
On a regional basis, the IEO2009 reference case projectsthe strongest growth in nuclear power for the countriesof non-OECD Asia, where nuclear power generation isprojected to grow at an average rate of 7.8 percent peryear from 2006 to 2030. Nuclear generation is projectedto increase by 8.9 percent per year in China and by9.9 percent per year in India. Outside Asia, the largestincrease in installed nuclear capacity among the non-OECD nations is projected for Russia, with increases innuclear power generation averaging 3.5 percent peryear. In contrast, OECD Europe—where some nationalgovernments, including Germany and Belgium, stillhave plans in place to phase out nuclear programsentirely—is expected to see a small decline in nuclearpower generation.
World Delivered Energy Useby SectorThe industrial sector uses more energy than any otherend-use sector, currently consuming about one-half ofthe world’s total delivered energy. Energy is consumedin the industrial sector by a diverse group of indus-tries—including manufacturing, agriculture, mining,and construction—and for a wide range of activities,such as processing and assembly, space conditioning,and lighting. Worldwide, industrial energy consump-tion is expected to grow from 175.0 quadrillion Btu in2006 to 245.6 quadrillion Btu in 2030.
Industrial energy demand varies across regions andcountries of the world, based on levels and mixes of eco-nomic activity and technological development, amongother factors. About 94 percent of the world increase inindustrial sector energy consumption is projected tooccur in the non-OECD economies, where—driven byrapid economic growth—industrial energy consump-tion grows at an average annual rate of 2.1 percent in thereference case. The key engines of non-OECD growth inthe projection are the so-called “BRIC” countries (Brazil,Russia, India, and China), which account for more than
two-thirds of the growth in non-OECD industrialenergy use through 2030 (Figure 8). Because the OECDnations have been undergoing a transition from manu-facturing economies to service economies in recentdecades and have relatively slow projected growth ineconomic output, industrial energy use in the OECDregion as a whole grows by an average of only 0.2 per-cent per year from 2006 to 2030.
The transportation is second only to the industrial sectorin terms of world energy use, and it is of particularimportance given the role of liquid fuels in meetingtransportation demand. The transportation share oftotal liquids consumption increases from 51 percent in2006 to 56 percent in 2030 in the IEO2009 reference case,accounting for nearly 80 percent of the total increase inworld liquids consumption. Much of the growth intransportation energy use is projected for the non-OECDnations, where rapidly expanding economies are expect-ed to see strong growth in liquids consumption astransportation systems become motorized and risingper-capita incomes increase the demand for personalmotor vehicle ownership. Non-OECD transportationenergy use increases by an average of 2.7 percent peryear from 2006 to 2030.
Major urban areas in the non-OECD nations are expect-ed to address transportation congestion and strains oninfrastructure with a variety of solutions, includingdevelopment of mass transit (bus and/or rail) and urbandesign that reduces vehicle-miles traveled, amongother improvements in transportation networks. In non-OECD Asia, for example, the reference case projects thatenergy use for personal motor vehicles (light-duty carsand trucks, as well as two- and three-wheel vehicles)
Energy Information Administration / International Energy Outlook 2009 5
4
2
3
6
35
45
21
67
OECD Total
Non-OECD
Brazil
Russia
India
China
“BRIC” Total
Other Non-OECD
Non-OECD Total
0 20 40 60 80 100
Quadrillion Btu
Figure 8. Net Increase in Industrial Energy Useby Region, 2006-2030
Sources: 2006: Energy Information Administration (EIA),International Energy Annual 2006 (June-December 2008),web site www.eia.doe.gov/iea. 2030: EIA, World Energy Pro-jections Plus (2009).

will increase by 3.6 percent per year from 2006 to 2030,while energy use for public passenger travel (rail andbus) also shows robust growth in energy use, averaging2.9 percent per year.
In the OECD nations, transportation energy consump-tion grows by a relatively modest average of 0.3 percentper year over the projection period. Transportationinfrastructure in the OECD countries generally is wellestablished. Roads and highways connect most popula-tion centers, and motorization levels (vehicles per 1,000people), which already are high, probably will reach sat-uration by 2030. As the OECD economies have becomemore service-oriented, the link between income and thetransportation of goods has weakened, and their rela-tively slow rates of GDP growth and population growthin the IEO2009 reference case lead to the expectation thattotal transportation energy demand in the OECD coun-tries will increase only modestly from 2006 to 2030.
World Carbon Dioxide EmissionsWorld carbon dioxide emissions are projected to risefrom 29.0 billion metric tons in 2006 to 33.1 billion metrictons in 2015 and 40.4 billion metric tons in 2030—anincrease of 39 percent over the projection period. Withstrong economic growth and continued heavy relianceon fossil fuels expected for most of the non-OECD econ-omies, much of the increase in carbon dioxide emissions
is projected to occur among the developing, non-OECDnations. In 2006, non-OECD emissions exceeded OECDemissions by 14 percent. In 2030, however, non-OECDemissions are projected to exceed OECD emissions by77 percent (Figure 9).
6 Energy Information Administration / International Energy Outlook 2009
2006 2010 2015 2020 2025 20300
10
20
30
40
50Billion Metric Tons
OECD Non-OECD World Total
29.031.0
33.135.4
37.940.4
Figure 9. World Carbon Dioxide Emissions,2006-2030
Sources: 2006: Energy Information Administration (EIA),International Energy Annual 2006 (June-December 2008),web site www.eia.doe.gov/iea. Projections: EIA, WorldEnergy Projections Plus (2009).

Chapter 1
World Energy Demand and Economic OutlookIn the IEO2009 projections, total world consumption of marketed energy is projected
to increase by 44 percent from 2006 to 2030. The largest projected increase
in energy demand is for the non-OECD economies.
In the IEO2009 reference case, world energy consump-tion increases from 472 quadrillion Btu in 2006 to 552quadrillion Btu in 2015 and 678 quadrillion Btu in2030—a total increase of 44 percent over the projectionperiod (Figure 10 and Table 1). Total world energy use in2030 is about 2 percent lower than projected in the Inter-national Energy Outlook 2008 (IEO2008), largely as theresult of a slower overall rate of economic growth in thisyear’s reference case.
The current economic downturn dampens worlddemand for energy in the near term, as manufacturingand consumer demand for goods and services slow.IEO2009 assumes, however, that most nations will beginto return to trend growth within the next 12 to 24months.
OECD member countries,4 for the most part, have theworld’s most established energy infrastructures. Incombination, they account for the largest share ofcurrent world energy consumption. The situation isexpected to change over the projection period, however,with more rapid growth in energy demand in emergingnon-OECD economies. In 2006, 51 percent of world
energy consumption was in the OECD economies; but in2030 their share falls to 41 percent in the reference case.
Energy Information Administration / International Energy Outlook 2009 7
Table 1. World Marketed Energy Consumption by Country Grouping, 2006-2030(Quadrillion Btu)
Region 2006 2010 2015 2020 2025 2030
Average AnnualPercent Change,
2006-2030
OECD . . . . . . . . . . . . . . . . . . . . . 241.7 242.8 252.4 261.3 269.5 278.2 0.6North America . . . . . . . . . . . . . . 121.3 121.1 125.9 130.3 135.6 141.7 0.6Europe . . . . . . . . . . . . . . . . . . . . 81.6 82.2 84.8 87.9 90.0 91.8 0.5Asia . . . . . . . . . . . . . . . . . . . . . . 38.7 39.5 41.8 43.1 43.9 44.6 0.6
Non-OECD . . . . . . . . . . . . . . . . . 230.8 265.4 299.1 334.4 367.8 400.1 2.3Europe and Eurasia . . . . . . . . . . 50.7 54.0 57.6 60.3 62.0 63.3 0.9Asia . . . . . . . . . . . . . . . . . . . . . . 117.6 139.2 163.2 190.3 215.4 239.6 3.0Middle East . . . . . . . . . . . . . . . . 23.8 27.7 30.3 32.2 34.6 37.7 1.9Africa . . . . . . . . . . . . . . . . . . . . . 14.5 16.2 17.7 19.1 20.6 21.8 1.7Central and South America . . . . 24.2 28.3 30.3 32.5 35.2 37.7 1.9
Total World . . . . . . . . . . . . . . . . . 472.4 508.3 551.5 595.7 637.3 678.3 1.5
Note: Totals may not equal sum of components due to independent rounding.Sources: 2006: Energy Information Administration (EIA), International Energy Annual 2006 (June-December 2008), web site
www.eia.doe.gov/iea. Projections: EIA, World Energy Projections Plus (2009).
283 308348 366
398
472508
552596
637678
1980
1985
1990
1995
2000
2006
2010
2015
2020
2025
2030
0
200
400
600
800Quadrillion Btu
History Projections
Figure 10. World Marketed Energy Consumption,1980-2030
Sources: History: Energy Information Administration (EIA),International Energy Annual 2006 (June-December 2008),web site www.eia.doe.gov/iea. Projections: EIA, WorldEnergy Projections Plus (2009).
4For consistency, OECD includes all members of the organization as of March 1, 2009, throughout all the time series included in thisreport.

OECD energy use grows slowly over the projectionperiod, averaging 0.6 percent per year, as comparedwith 2.3 percent per year for the emerging non-OECDeconomies (Figure 11).
China and India are the fastest-growing non-OECDeconomies, and they will be key world energy consum-ers in the future. Since 1990, energy consumption as ashare of total world energy use has increased signifi-cantly in both countries. China and India togetheraccounted for about 10 percent of the world’s totalenergy consumption in 1990, but in 2006 their combinedshare was 19 percent. Strong economic growth in both
countries continues over the projection period, withtheir combined energy use increasing nearly twofoldand making up 28 percent of world energy consumptionin 2030 in the reference case. In contrast, the U.S. share oftotal world energy consumption falls from 21 percent in2006 to about 17 percent in 2030 (Figure 12).
Non-OECD Asia shows the most robust growth of all thenon-OECD regions, with energy use rising by 104 per-cent from 2006 to 2030 (Figure 13). Energy consumptionin other non-OECD regions also grows strongly over theprojection period, with projected increases of around 60percent for the Middle East and for Central and SouthAmerica and 50 percent for Africa. A smaller increase,about 25 percent, is expected for non-OECD Europe andEurasia (including Russia and the other former SovietRepublics), as declining population and substantialgains in energy efficiency result from the replacement ofinefficient Soviet-era capital equipment.
This chapter presents an overview of the IEO2009 out-look for global marketed energy consumption by energysource. It includes discussions of the major assumptionsthat form the basis for the IEO2009 projections, includ-ing macroeconomic assumptions for the key OECD andnon-OECD regions.
As with any set of projections, there is significant uncer-tainty associated with the IEO2009 energy projections.Two sets of sensitivity cases, which vary some of theassumptions behind the projections, are also examinedin this chapter: the high and low economic growth casesand the high and low world oil price cases. The sensitiv-ity cases are intended to illustrate alternative scenariosrather than to identify any bounds on uncertainty,which can also be affected by policy and technologydevelopments as well as by price and growth paths.
8 Energy Information Administration / International Energy Outlook 2009
1980 1995 2006 2015 20300
100
200
300
400
500Quadrillion Btu
History Projections
OECD
Non-OECD
Figure 11. World Marketed Energy Consumption:OECD and Non-OECD, 1980-2030
Sources: History: Energy Information Administration (EIA),International Energy Annual 2006 (June-December 2008),web site www.eia.doe.gov/iea. Projections: EIA, WorldEnergy Projections Plus (2009).
348398
472508
596
678
1990 2000 2006 2010 2020 20300
200
400
600
800Quadrillion Btu
China and India
United States
Rest of World
History Projections
Figure 12. Marketed Energy Use by Region,1990-2030
Sources: History: Energy Information Administration (EIA),International Energy Annual 2006 (June-December 2008),web site www.eia.doe.gov/iea. Projections: EIA, WorldEnergy Projections Plus (2009).
106
150 167
231265
334
400
1980 1990 2000 2006 2010 2020 20300
100
200
300
400
500Quadrillion Btu
Non-OECD Asia
Middle East
Africa
Central and South America
Non-OECD Europe and Eurasia
History Projections
Figure 13. Marketed Energy Use in the Non-OECDEconomies by Region, 1980-2030
Sources: History: Energy Information Administration (EIA),International Energy Annual 2006 (June-December 2008),web site www.eia.doe.gov/iea. Projections: EIA, WorldEnergy Projections Plus (2009).

Outlook for World EnergyConsumption by SourceThe use of all energy sources increases over the timeframe of the IEO2009 reference case (Figure 14). Givenexpectations that world oil prices will remain relativelyhigh through most of the projection period, liquid fuelsand other petroleum5 are the world’s slowest growingsource of energy: liquids consumption increases at anaverage annual rate of 0.9 percent from 2006 to 2030.Renewables are the fastest-growing source of worldenergy, with consumption increasing by 3.0 percent peryear. Projected oil prices, as well as rising concern aboutthe environmental impacts of fossil fuel use and stronggovernment incentives for increasing renewable pene-tration in most countries around the world, improve theprospects for renewable energy sources worldwide.
Although liquid fuels are expected to remain the largestsource of energy, the liquids share of world marketedenergy consumption declines from 36 percent in 2006 to32 percent in 2030. The reference case assumes thatworld oil prices lead many energy users, especially inthe industrial and electric power sectors, to switch fromliquid fuels and other petroleum when feasible. From2006 to 2030, liquids consumption in the residential,commercial, and electric power sectors declines on aworldwide basis. For example, the projections show asteady decline of 0.3 percent per year in total world useof liquids for electricity generation. Nonetheless, thecountries of the Middle East continue to rely on liquids
for a sizable portion of their electricity supply, remain-ing near 25 percent in 2030.
In the transportation sector, liquids consumption isrelatively unaffected by projected world oil prices in thereference case. Although world oil prices in the IEO2009reference case are 80 percent higher in 2030 than the pro-jected prices in the IEO2008 reference case, the world’sconsumption of liquids for transportation in 2030 is only9 percent lower in IEO2009. In the absence of significanttechnological advances, liquids continue to dominatethe world’s transportation markets.
In the industrial sector, growth in liquids consumptionis slower than projected in last year’s outlook. Efficiencygains and fuel substitution slow the growth of liquidsconsumption in the industrial sector, especially in thenon-OECD regions, where there are more opportunitiesfor fuel switching. World liquids consumption forenergy in the industrial sector, which was projected toincrease by 1.1 percent per year from 2005 to 2030 in theIEO2008 reference case, increases by 0.7 per year overthe same period in IEO2009.
Natural gas remains an important fuel for electricitygeneration worldwide, because it is more efficient andless carbon-intensive than other fossil fuels. In theIEO2009 reference case, total natural gas consumptionincreases by 1.6 percent per year on average, from 104trillion cubic feet in 2006 to 153 trillion cubic feet in 2030,and its use in the electric power sector increases by 2.1percent per year. With world oil prices assumed torebound following the current economic downturn andthen rise through 2030, consumers are expected tochoose less expensive natural gas to meet their energyneeds whenever possible, particularly in the industrialsector, where, for example, newly constructed petro-chemical plants are expected to rely increasingly on nat-ural gas as a feedstock.
World coal consumption increases by 1.7 percent peryear on average from 2006 to 2030 (growing by 23 qua-drillion Btu from 2006 to 2015 and another 40 quadrillionBtu from 2015 to 2030) and accounts for 28 percent oftotal world energy consumption in 2030. In the absenceof policies or legislation that would limit the growth ofcoal use, the United States, China, and India areexpected to turn to coal in place of more expensive fuels.Together, the three nations account for 88 percent of theprojected net increase in coal consumption from 2006 to2030 (Figure 15). The only decreases in coal consump-tion are projected for OECD Europe and for Japan,where populations are either growing slowly or declin-ing, electricity demand growth is slow, and renewable
Energy Information Administration / International Energy Outlook 2009 9
1980 1995 2006 2015 20300
50
100
150
200
250Quadrillion Btu
History Projections
Liquids(Including Biofuels)
Natural Gas
Coal Renewables(Excluding Biofuels)
Nuclear
Figure 14. World Marketed Energy Use by FuelType, 1980-2030
Sources: History: Energy Information Administration (EIA),International Energy Annual 2006 (June-December 2008),web site www.eia.doe.gov/iea. Projections: EIA, WorldEnergy Projections Plus (2009).
5In IEO2009, “liquid fuels and other petroleum” includes a full array of liquid product supplies, both conventional and unconventional.Conventional liquids include crude oil and lease condensate, natural gas plant liquids, and refinery gain; unconventional liquids includebiofuels, gas-to-liquids, coal-to-liquids, and unconventional petroleum products (extra-heavy oils, oil shale, and bitumen) but do notinclude compressed natural gas (CNG), liquefied natural gas (LNG), or hydrogen.

energy sources, natural gas, and nuclear power arelikely to be chosen over coal for electricity generation.
Net electricity generation worldwide totals 31.8 trillionkilowatthours in 2030 in the reference case, 77 percenthigher than the 2006 total of 18.0 trillion kilowatthours.The strongest growth in electricity generation is pro-jected for the non-OECD countries. Non-OECD electric-ity generation increases by 3.5 percent per year in thereference case, as rising standards of living increasedemand for home appliances and the expansion ofcommercial services, including hospitals, office build-ings, and shopping malls. In the OECD nations, where
infrastructures are well established and populationgrowth is relatively slow, much slower growth in gener-ation is expected, averaging 1.2 percent per year from2006 to 2030.
Currently, natural gas and coal together account for thelargest share of total world electricity generation, atmore than 60 percent of global electricity supply. Theyremain the world’s most important sources of supply in2030, with a 64-percent share of total generation (Figure16). In non-OECD Asia, where coal resources are ample,higher prices for oil and natural gas make coal a moreeconomical source of energy for electricity generation.
Renewable energy sources are the fastest-growingenergy source for world electricity generation in theIEO2009 reference case, increasing by an average of 2.9percent per year from 2006 to 2030. Much of the growthis in hydroelectric power and wind power. Of the 3.3 tril-lion kilowatthours of new renewable generation addedover the projection period, 1.8 trillion kilowatthours (54percent) is attributed to hydroelectric power and 1.1 tril-lion kilowatthours (33 percent) to wind power (Figure17). Other than hydroelectric power, most renewabletechnologies are not able to compete economically withfossil fuels over the projection period, except in a limitednumber of niche markets. Government policies andincentives typically are the primary drivers for theconstruction of renewable generation facilities.
As renewable energy use increases worldwide, themix of fuels in the OECD and non-OECD regions differsin the reference case. In the OECD nations, the majorityof economically exploitable hydroelectric resources al-ready have been developed. With the exception of Can-ada and Turkey, there are few large-scale hydroelectric
10 Energy Information Administration / International Energy Outlook 2009
1980 1995 2006 2015 20300
20
40
60
80
100Quadrillion Btu
History Projections
China
United States
Rest of World
India
Figure 15. Coal Consumption in Selected WorldRegions, 1980-2030
Sources: History: Energy Information Administration (EIA),International Energy Annual 2006 (June-December 2008),web site www.eia.doe.gov/iea. Projections: EIA, WorldEnergy Projections Plus (2009).
2006 2010 2015 2020 2025 20300
10
20
30
40Trillion Kilowatthours
Liquids
Nuclear
Natural Gas
Coal
Renewables
Figure 16. World Electricity Generation by Fuel,2006-2030
Sources: 2006: Derived from Energy Information Adminis-tration (EIA), International Energy Annual 2006 (June-December 2008), web site www.eia.doe.gov/iea. Projections:EIA, World Energy Projections Plus (2009).
2006 2010 2015 2020 2025 20300
2
4
6
8Trillion Kilowatthours
Hydroelectricity
Wind
Geothermal
Other Renewables
Figure 17. World Renewable Electricity Generationby Source, 2006-2030
Sources: 2006: Energy Information Administration (EIA),International Energy Annual 2006 (June-December 2008),web site www.eia.doe.gov/iea. Projections: EIA, WorldEnergy Projections Plus (2009).

power projects planned for the future. Instead, mostrenewable energy growth in the OECD countries isexpected to come from nonhydroelectric sources, espe-cially wind and biomass. Many OECD countries, partic-ularly those in Europe, have government policies,including feed-in tariffs,6 tax incentives, and mar-ket-share quotas, that encourage the construction ofrenewable electricity facilities.
In contrast to the OECD countries, hydroelectric poweris expected to be the predominant source of renewableenergy growth in the non-OECD nations. Strong growthof hydroelectric generation, primarily from mid- tolarge-scale power plants, is expected in China, India,Brazil, Vietnam, and Laos. Growth rates for wind-powered electricity generation also are expected to behigh in the non-OECD countries, with the largest incre-ment in China, which accounts for 88 percent of the totalincrease in non-OECD wind generation. From 2 billionkilowatthours in 2006, generation from wind plants inChina increases to 315 billion kilowatthours in 2030.Still, the total increase in China’s wind-powered genera-tion is only about one-half the expected increase in thecountry’s hydroelectric generation (Figure 18).
Electricity generation from nuclear power worldwideincreases from 2.7 trillion kilowatthours in 2006 to 3.0trillion kilowatthours in 2015 and 3.8 trillion kilowatt-hours in 2030 in the IEO2009 reference case, as concernsabout rising fossil fuel prices, energy security, and
greenhouse gas emissions support the development ofnew nuclear generating capacity. Higher capacity utili-zation rates have been reported for many existingnuclear facilities, and it is expected that most of the olderplants now operating in OECD countries and innon-OECD Eurasia will be granted extensions to theiroperating lives.
There is still considerable uncertainty about the future ofnuclear power, however, and a number of issues couldslow the development of new nuclear power plants.Plant safety, radioactive waste disposal, and the prolif-eration of nuclear weapons, which continue to raise pub-lic concerns in many countries, may hinder plans fornew installations, and high capital and maintenancecosts may keep some countries from expanding theirnuclear power programs. Nevertheless, the IEO2009projection for world nuclear electricity generation in2025 is 25 percent higher than the projection in IEO2004just 5 years ago.
Most of the expansion of installed nuclear power capac-ity is expected in non-OECD countries (Figure 19).China, India, and Russia account for almost two-thirdsof the projected net increment in world nuclear powercapacity between 2006 and 2030. In the reference case,China adds 47 gigawatts of nuclear capacity between2006 and 2030, India 17 gigawatts, and Russia 21gigawatts. Several OECD nations with existing nuclearprograms also add new net capacity in the reference
Energy Information Administration / International Energy Outlook 2009 11
2006 2010 2015 2020 2025 20300
200
400
600
800
1,000
1,200Billion Kilowatthours
Hydroelectricity
Wind
Other Renewables
Figure 18. Renewable Electricity Generationin China by Fuel, 2006-2030
Sources: 2006: Energy Information Administration (EIA),International Energy Annual 2006 (June-December 2008),web site www.eia.doe.gov/iea. Projections: EIA, WorldEnergy Projections Plus (2009).
132
127
121
115
121 13
2
67 74
88
42 49
71
7
22
54
3 9
2010 15 23
2006 2015 20300
50
100
150
200
250
300Gigawatts
OECD Asia Non-OECD Europe/Eurasia
OECD Europe OECD North America
Rest of WorldChina India
Figure 19. World Nuclear Generating Capacityby Region, 2006, 2015, and 2030
Sources: 2006: Energy Information Administration (EIA),International Energy Annual 2006 (June-December 2008),web site www.eia.doe.gov/iea. 2015 and 2030: EIA, WorldEnergy Projections Plus (2009).
6A feed-in tariff is an incentive structure to encourage the adoption of renewable energy through government legislation. Under afeed-in tariff structure, regional or national electric utilities are obligated to purchase renewable electricity at a higher rate than retail, inorder to allow renewable energy sources to overcome price disadvantages.

case, including South Korea with 13 gigawatts, Japanwith 8 gigawatts, and the United States with 12gigawatts.7
In the United States, Title XVII of the Energy Policy Actof 2005 (EPACT2005, Public Law 109-58) authorizes theU.S. Department of Energy to issue loan guarantees forinnovative technologies that “avoid, reduce, or seques-ter greenhouse gases.” In addition, subsequent legisla-tive provisions in the Consolidated Appropriation Actof 2008 (Public Law 110-161) allocated $18.5 billion inguarantees for nuclear power plants [1]. That legislation,along with high fossil fuel prices, results in expectedincreases of 12.7 gigawatts of capacity at newly builtnuclear power plants between 2006 and 2030 and 3.7gigawatts from uprates at existing plants, offset in partby the retirement of 4.4 gigawatts of capacity at oldernuclear power plants.
Delivered Energy Consumption byEnd-Use SectorUnderstanding patterns in the consumption of energydelivered to end users is important to the developmentof projections for global energy use. Outside the trans-portation sector, which at present is dominated by liquidfuels, the mix of energy use in the residential, commer-cial, and industrial sectors varies widely by region,depending on a combination of regional factors, such asthe availability of energy resources, levels of economicdevelopment, and political, social, and demographicfactors.
Residential Sector
Energy use in the residential sector, which accounted forabout 15 percent of world delivered energy consump-tion in 2006, is defined as the energy consumed byhouseholds, excluding transportation uses. For residen-tial buildings, the physical size of the structures is onekey indicator of the amount of energy used by theiroccupants. Larger homes require more energy to pro-vide heating, air conditioning, and lighting, and theytend to include more energy-using appliances, such astelevisions and laundry equipment. Smaller structuresusually require less energy, because they contain lessspace to be heated or cooled, produce less heat transferwith the outdoor environment, and typically have feweroccupants. For instance, residential energy consumptionis lower in China, where the average residence currentlyhas an estimated 300 square feet of living space or lessper person, than in the United States, where the averageresidence has an estimated 680 square feet of livingspace per person [2].
The type and amount of energy used by householdsvary from country to country, depending on income lev-els, natural resources, climate, and available energyinfrastructure. In general, typical households in OECDnations use more energy than those in non-OECDnations, in part because higher income levels allowOECD households to have larger homes and purchasemore energy-using equipment. In the United States, forexample, GDP per capita in 2006 was about $43,000 (inreal 2005 dollars per person), and residential energy useper capita was estimated at 36.0 million Btu. In contrast,China’s per-capita income in 2006, at $4,550, was onlyabout one-tenth the U.S. level, and residential energyuse per capita was 4.0 million Btu.
Although the IEO2009 projections account for marketedenergy use only, households in many non-OECD coun-tries still rely heavily on traditional, nonmarketedenergy sources, including wood and waste, for heatingand cooking. Much of Africa remains unconnected topower grids, and the International Energy Agency esti-mates that the majority of households in sub-SaharanAfrica still rely on fuelwood and charcoal for cooking.More than 95 percent of rural households in Angola,Benin, Cameroon, Chad, Congo (Kinshasa), Ethiopia,Ghana, Sudan, and Zambia among others still usefuelwood and charcoal for cooking. [3]. Some areas ofChina and India also rely heavily on fuelwood, woodwaste, and charcoal for cooking. In China, about 55 per-cent of the rural population uses biomass for cooking, asdoes 87 percent of the rural population in India.Regional economic development should displace someof that use as incomes rise and marketed fuels, such aspropane and electricity, become more widely accessible.
Commercial Sector
The commercial sector—often referred to as the servicessector or the services and institutional sector—consistsof businesses, institutions, and organizations that pro-vide services. The sector encompasses many differenttypes of buildings and a wide range of activities andenergy-related services. Examples of commercial sectorfacilities include schools, stores, correctional institu-tions, restaurants, hotels, hospitals, museums, officebuildings, banks, and sports arenas. Most commercialenergy use occurs in buildings or structures, supplyingservices such as space heating, water heating, lighting,cooking, and cooling. Energy consumed for services notassociated with buildings, such as for traffic lights andcity water and sewer services, is also categorized as com-mercial energy use.
12 Energy Information Administration / International Energy Outlook 2009
7Additional incentives for renewable energy and improved energy efficiency measures included in ARRA2009 lower the prospects forU.S. nuclear power. In the updated AEO2009 reference case (April 2009), the projection for U.S. nuclear generating capacity in 2030 is 2.5gigawatts lower than in the published AEO2009 reference case (March 2009), and the net addition to U.S. installed nuclear capacity between2006 and 2030 is 9.9 gigawatts, bringing the 2030 total to 110.1 gigawatts in the updated AEO2009 reference case, as compared with 112.6gigawatts in the published reference case.

Economic trends and population growth drive commer-cial sector activity and the resulting energy use. Theneed for services (health, education, financial, and gov-ernment) increases as populations increase. The degreeto which additional needs are met depends in large mea-sure on economic resources—whether from domestic orforeign sources—and economic growth.
Economic growth also determines the degree to whichadditional activities are offered and utilized in the com-mercial sector. Higher levels of economic activity anddisposable income lead to increased demand for hotelsand restaurants to meet business and leisure require-ments; for office and retail space to house and servicenew and expanding businesses; and for cultural and lei-sure space such as theaters, galleries, and arenas. In thecommercial sector, as in the residential sector, energyuse per capita in the non-OECD countries is much lowerthan in the OECD countries. Non-OECD commercialenergy consumption per capita averaged only 1.3 mil-lion Btu in 2006, compared with the OECD average of16.3 million Btu.
Slow population growth in most of the OECD nationscontributes to slower anticipated rates of increase incommercial energy demand. In addition, continued effi-ciency improvements moderate the growth of energydemand over time, as energy-using equipment isreplaced with newer, more efficient stock. Conversely,continued economic growth is expected to includegrowth in business activity, with its associated energyuse, in areas such as retail and wholesale trade and busi-ness, financial services, and leisure services. The UnitedStates is the largest consumer of commercial deliveredenergy in the OECD and remains in that positionthroughout the projection, accounting for about 44 per-cent of the OECD total in 2030.
In the non-OECD nations, economic activity and com-merce are expected to increase rapidly, fueling addi-tional demand for energy in the service sectors.Population growth also is expected to be more rapidthan in the OECD countries, portending increases in theneed for education, health care, and social services andthe energy required to provide them. The energy neededto fuel growth in commercial buildings will be substan-tial, with total delivered commercial energy use amongthe non-OECD nations projected to grow by 2.7 percentper year from 2006 to 2030.
Industrial Sector
Energy is consumed in the industrial sector by a diversegroup of industries—including manufacturing, agricul-ture, mining, and construction—and for a wide range ofactivities, such as processing and assembly, space condi-tioning, and lighting. Industrial energy demand variesacross regions and countries of the world, based on the
level and mix of economic activity and technologicaldevelopment, among other factors. Industrial energyuse also includes natural gas and petroleum productsused as feedstocks to produce non-energy products,such as plastics. In aggregate, the industrial sector usesmore energy than any other end-use sector, consumingabout one-half of the world’s total delivered energy.
The OECD economies generally have more energy-efficient industrial operations and a mix of industrialoutput that is more heavily weighted towardnon-energy-intensive sectors than in the non-OECDcountries. As a result, the ratio of industrial sectorenergy consumption to total GDP tends to be higher inthe non-OECD economies than in the OECD economies.On average, industrial sector energy intensity in thenon-OECD countries is double that in the OECDcountries.
Transportation Sector
Energy use in the transportation sector includes theenergy consumed in moving people and goods by road,rail, air, water, and pipeline. The road transport compo-nent includes light-duty vehicles, such as automobiles,sport utility vehicles, minivans, small trucks, and motor-bikes, as well as heavy-duty vehicles, such as largetrucks used for moving freight and buses for passengertravel. Growth rates for economic activity and popula-tion are the key factors for transportation sector energydemand. Economic growth spurs increases in industrialoutput, which requires the movement of raw materialsto manufacturing sites, as well as the movement of man-ufactured goods to end users.
For both the non-OECD and OECD economies, steadilyincreasing demand for personal travel is a primary fac-tor underlying projected increases in energy demand fortransportation. Increases in urbanization and in per-sonal incomes have contributed to increases in air traveland motorization (more vehicles per capita) in the grow-ing economies. Modal shifts in the transport of goods areexpected to result from continued economic growth inboth OECD and non-OECD economies. For freighttransportation, trucking is expected to lead the growthin demand for transportation fuels. In addition, as tradeamong countries increases, the volume of freight trans-ported by air and marine vessels is expected to increaserapidly.
World Economic OutlookEconomic growth is among the most important factorsto be considered in projecting changes in world energyconsumption. In the IEO2009 projections, assumptionsabout regional economic growth—measured in termsof real GDP in 2005 U.S. dollars at purchasing powerparity rates—underlie the projections of regional energy
Energy Information Administration / International Energy Outlook 2009 13

demand. Although it is difficult to assess the full extentof the current global economic downturn, many analystshave stated that the world is in the midst of the worstrecession since World War II [4]. Nevertheless, theIEO2009 projections assume that the global downturnwill not be protracted and that in the mid- to long termpotential trend growth will return.
Over the 2006 to 2030 period, the world’s real GDPgrowth on a purchasing power parity basis is projectedto average 3.5 percent annually in the reference case(Table 2). In the long term, it is the ability to producegoods and services (the supply side) that determines thegrowth potential of any country’s economy. Growthpotential is influenced by population growth, labor forceparticipation rates, capital accumulation, and produc-tivity improvements. In addition, for the developingeconomies, progress in building human and physicalcapital infrastructures, establishing credible regulatorymechanisms to govern markets, and ensuring politicalstability play relatively more important roles in deter-mining their medium- to long-term growth potential.
Annual growth in world GDP over the 24-year projec-tion period is about the same as the rate recorded overthe past 25 years. Growth in the more mature industrial-ized economies of the OECD is expected to be slower inthe future; but growth in the emerging non-OECD econ-omies is projected to be higher in the future than in thepast. For the OECD, combined GDP increased by anannual average of 2.9 percent from 1982 to 2006 but isprojected to average 2.2 percent per year from 2006 to2030. In contrast, non-OECD GDP increased by anannual average of 4.1 percent over the past 25 years butis projected to average 4.9 percent per year from 2006 to2030, based in large on the projected strong growth in
China and India. With the non-OECD economiesaccounting for an increasing share of world GDP, theirmore rapid economic growth rates offset the slowergrowth rates for the OECD economies in the referencecase.
Although many non-OECD economies—particularlythose strongly dependent on exports for revenues—have been slowed by the economic downturn that beganin the OECD economies, a number of significant reformsthat have been implemented over the past years in keynon-OECD nations have improved and are likely to con-tinue improving their prospects for recovery and stronglong-term growth. Improved macroeconomic policies,trade liberalization, more flexible exchange rateregimes, and lower fiscal deficits have lowered theirnational inflation rates, reduced uncertainty, andimproved their overall investment climates. Moremicroeconomic structural reforms, such as privatizationand regulatory reform, have also played key roles. Ingeneral, such reforms have resulted in growth rates overmuch of the past decade that are above historical rates inmany of the developing economies. Those trends areexpected to resume when the OECD countries recoverfrom the current recession and to continue into the nextdecades.
OECD Economies
In the IEO2009 reference case, U.S. economic growthslows considerably in the near term as a result of therecent downturn in financial markets, with negative realGDP growth in 2009 in spite of the expectation that theeconomy will begin to recover in the fourth quarter of2009. The recession is expected to be more severe thanthe two most recent U.S. recessions, which began in1991 and 2001. The rate of growth in real GDP depends
14 Energy Information Administration / International Energy Outlook 2009
Table 2. World Gross Domestic Product by Country Grouping, 2006-2030(Billion 2005 Dollars)
Region 2006 2010 2015 2020 2025 2030
Average AnnualPercent Change,
2006-2030
OECD . . . . . . . . . . . . . . . . . . . . . 35,221 37,133 42,403 47,466 52,996 59,264 2.2North America . . . . . . . . . . . . . . 15,331 16,073 18,789 21,341 24,283 27,802 2.5Europe . . . . . . . . . . . . . . . . . . . . 14,224 15,015 16,839 18,811 20,894 23,105 2.0Asia . . . . . . . . . . . . . . . . . . . . . . 5,667 6,045 6,775 7,314 7,819 8,357 1.6
Non-OECD . . . . . . . . . . . . . . . . . 24,717 31,723 41,529 52,907 65,062 78,220 4.9Europe and Eurasia . . . . . . . . . . 3,159 3,940 4,865 5,725 6,536 7,381 3.6Asia . . . . . . . . . . . . . . . . . . . . . . 13,408 17,934 24,606 32,726 41,428 50,834 5.7Middle East . . . . . . . . . . . . . . . . 2,053 2,484 3,030 3,621 4,300 5,102 3.9Africa . . . . . . . . . . . . . . . . . . . . . 2,341 2,870 3,612 4,384 5,182 5,958 4.0Central and South America . . . . 3,757 4,495 5,415 6,450 7,615 8,945 3.7
Total World . . . . . . . . . . . . . . . . . 59,939 68,856 83,932 100,373 118,058 137,484 3.5
Note: All regional real GDP numbers presented in this table are based on purchasing power parity terms.Sources: IHS Global Insight, Inc., World Overview, Fourth Quarter 2008 (Lexington, MA, January 2009); and Energy Information
Administration, Annual Energy Outlook 2009, DOE/EIA-0383(2009) (Washington DC, March 2009).

mainly on assumptions about labor force growth andproductivity. In the reference case, growth in real GDPaverages 2.4 percent per year from 2006 to 2030.8
Like much of the rest of the world, Canada saw its eco-nomic growth slow precipitously in 2008, to an esti-mated 0.5 percent for the year, after several years inwhich its economy expanded by nearly 3.0 percent peryear. The country’s economy was strongly affected bothby the global economic downturn and by the rapidretreat of world energy prices, which sharply curtailedoutput and revenues from its energy sector [5]. Canada’srelatively conservative banking system has limited itsexposure to the “toxic assets” revealed by the financialcrisis in 2007-2008, but in the short run it is unlikely toavoid the negative economic impact of global recession[6].
The strong economic ties between Canada and theUnited States, in addition to depressed world energyprices starting in the second half of 2008, lead to slowergrowth in the near term for Canada’s economy. After2010, when the world economies are expected to be inrecovery and oil prices are expected to begin rising(favoring an expansion of production from the country’soil sands), Canada’s GDP growth averages about 2.2percent per year through 2030 in the reference case.
Similarly, Mexico’s close relationship to the U.S. econ-omy means that it too is likely to see a negative impactfrom the current downturn. About 80 percent of Mex-ico’s exports are sent to the United States, and in combi-nation with depressed world oil prices and the globalcredit crunch, its dependence on the U.S. economy hasslowed the growth of the Mexican economy. A return tohigh world oil prices and recovery of the U.S. economyafter 2010 are expected to support a return to Mexico’strend growth, with GDP increasing by an average of 3.4percent per year from 2006 to 2030.
For the economies of OECD Europe, prospects in theshort term are dimmed by the current turbulence ininternational financial markets and global economicrecession. Their combined GDP growth is estimated tohave slowed sharply, from 3.4 percent in 2006 and 3.1percent in 2007 to 1.4 percent in 2008 and an anticipatedcontraction of 0.2 percent in 2009. Over the long term,OECD Europe’s GDP growth is projected to average 2.0percent per year from 2006 to 2030, in line with what theOECD considers to be potential output growth [7].According to the International Monetary Fund, OECDEurope’s long-term growth prospects depend on its abil-ity to accelerate improvements in labor productivitythat have been lagging potential (in part because of the
region’s aging population), as well as improvements inthe structural flexibility of the various national econo-mies [8].
After maintaining relatively robust economic growth ofabout 2.0 percent per year between 2003 and 2007,Japan’s GDP growth rate slowed to 0.4 percent in 2008.In the fourth quarter of 2008, exports declined by 14 per-cent and industrial output fell by an annual rate of 20percent [9]. Although GDP growth should return as therest of the world’s economic situation improves after2010, the continuing decline in Japan’s aging labor forceis expected to slow its economic growth to averageannual rates of 1.3 percent from 2008 to 2015 and 0.5 per-cent from 2015 to 2030.
More robust economic growth is projected for the rest ofOECD Asia. In South Korea, GDP growth is projected toaverage 3.3 percent per year from 2006 to 2030. Theglobal downturn has led to sharp declines in exports anddomestic demand [10], and although the Bank of Koreahas tried to ease the pressure on its financial mar-kets—both by lowering interest rates six times betweenOctober 2008 and February 2009, to 2.0 percent, and byraising the cap on its low-rate commercial loans to $6.73billion (10 trillion Korean won) from $6.00 billion (9 tril-lion won) [11]—the country is widely believed to be inits first recession since the banking crisis of 1998 [12]. Asworld demand begins to improve after 2010, SouthKorea’s GDP growth is expected to return to trend. Inthe long term, however, its growth is expected to taperoff as the growth of its labor force slows.
GDP growth in Australia/New Zealand averages 3.0percent per year from 2006 to 2030 in the reference case.Although economic growth in both Australia and NewZealand has slowed markedly with the collapse of com-modity prices, the Reserve Bank of Australia and theReserve Bank of New Zealand have eased monetary pol-icies, helping to cushion the impact of the global down-turn [13]. Prospects in both countries are relativelyhealthy, given their consistent track records of fiscal pru-dence and structural reforms aimed at maintaining com-petitive product markets and flexible labor markets.
Non-OECD Economies
From 2006 to 2030, economic growth in non-OECDEurope and Eurasia as a whole average 3.6 percent peryear. For the past several years, the non-OECD nationsof Europe and Eurasia have largely been sheltered fromglobal economic uncertainties, recording strong eco-nomic growth in every year since 2000, primarily as aresult of robust domestic demand, the growth bonusassociated with ascension of some countries (including
Energy Information Administration / International Energy Outlook 2009 15
8GDP growth rates in the short term are substantially lower in the updated AEO2009 reference case (April 2009), but the long-run growthrate over the 24 year projection period is lower by less than 0.1 percentage point than in the published reference case (March 2009). Investmentand exports show the largest downward revisions, resulting from higher projections for U.S. inflation and interest rates and lower projec-tions for economic growth in other countries.

Estonia, Latvia, Lithuania, and Slovenia) to the Euro-pean Union, and the impacts of rising oil prices onoil-exporting nations (including Russia, Kazakhstan,Azerbaijan, and Turkmenistan).
In the wake of the recent problems in the global financialsystem, it became more difficult for banks and otherentities in non-OECD Europe and Eurasia to gain accessto foreign loans, particularly in Russia, Kazakhstan, andUkraine. The impact was softened somewhat by higherworld market prices for commodity exports [14], butwith the subsequent collapse of commodity prices andworsening global economic situation, the region’s eco-nomic growth is projected to decline in the near term. Inthe mid- to long term, a return to high world oil pricesstimulates investment outlays, especially in the energysector of the Caspian region. Given the volatility ofenergy market prices, however, it is unlikely that theeconomies of non-OECD Europe and Eurasia will beable to sustain the growth rates recently achieved untilthey achieve more broad-based diversification fromenergy production and exports. The long-term growthprospects for the former Soviet Republic economies ofEurasia hinge on their success in economic diversifica-tion, as well as further improvements in domestic finan-cial and product markets.
Much of the growth in world economic activity between2006 and 2030 is expected to occur among the nations ofnon-OECD Asia, where regional GDP growth is pro-jected to average 5.7 percent per year. China, non-OECDAsia’s largest economy, is expected to continue playinga major role in both the supply and demand sides of theglobal economy. IEO2009 projects an average annualgrowth rate of approximately 6.4 percent for China’seconomy from 2006 to 2030—the highest among all theworld’s economies.
Although some analysts expected that China’s economymight be decoupled from those of the United States andOECD Europe and thus might avoid any significantimpact from the economic downturn in those countries,it seems clear that this has not been the case [15]. Exportsaccount for 35 percent of China’s GDP, with the UnitedStates, Europe, and Asia taking 70 percent of its totalexports. As a result, while there is some evidence thatdomestic consumer demand has remained relativelystrong even as the world recession continues, manufac-turing and export growth have declined sharply, lead-ing to a reduction in near-term economic growth.
Structural issues that have implications for economicgrowth in China in the medium- to long term includethe pace of reform affecting inefficient state-ownedcompanies and a banking system that is carrying asignificant amount of nonperforming loans. In theIEO2009 reference case, development of domesticcapital markets is expected to continue, providing
macroeconomic stability and ensuring that China’s largedomestic savings are used more efficiently.
Although India’s economy is not as dependent onexport revenues as China’s is, its growth still has slowedas the result of downturns in output from its industrialand agricultural sectors. Nearly two-thirds of Indianhouseholds depend on agriculture for their income [16].India’s GDP growth is expected to slow in the near term,but prospects for its economy are positive in themid-term, as it continues to privatize state enterprisesand increasingly adopts free market policies. In theIEO2009 reference case, GDP growth in India averages5.6 percent per year from 2006 to 2030.
Accelerating structural reforms—including ending reg-ulatory impediments to the consolidation of labor-intensive industries, labor market and bankruptcyreforms, and agricultural and trade liberalization—remain essential for stimulating potential growth andreducing poverty in India over the medium to long term.With its vast and relatively inexpensive English-speaking labor force, India is well positioned to reap thebenefits of globalization.
Outside China and India, the impacts of the global reces-sion on the countries of non-OECD Asia are likely tovary. The economies of export-dependent countries(including Hong Kong, Singapore, and Taiwan) areexpected to weaken in the near term, as demand in theUnited States, Europe, and Asia declines [17]. Fornations where domestic demand remains healthy(including Vietnam and the Philippines), the impact ofthe global recession may be less severe [18]. Overall,long-term economic activity in the nations of non-OECDAsia is expected to remain robust. From 2006 to 2030,national economic growth rates for the region—exclud-ing China and India—average 4.8 percent per year, aslabor force growth rates decline and economies mature.
Rising oil production and prices have helped boost eco-nomic growth in the oil-exporting countries of the Mid-dle East, many of which have also benefited fromspillover effects on trade, tourism, and financial flowsfrom the region’s oil exporters. In recent years, real GDPgrowth rates in the Middle East have averaged around 6percent. Although the sharp decline in world oil priceswill slow economic growth in the near term, as pricesrecover in the mid-term, prospects for the region remainfavorable. The region’s reliance on oil revenues isexpected to continue for much of the projection period.
Substantially lower commodity prices and weak importdemand in the United States, OECD Europe, and Asiaare expected to dampen near-term growth potential inmuch of Africa. Africa’s national economies were able tomaintain a healthy pace of aggregate economic growth,in excess of 5 percent per year, from 2000 to 2007 largelybecause of increased earnings from fossil fuel exports,
16 Energy Information Administration / International Energy Outlook 2009

strong global demand and favorable international pricesfor some other export commodities, vigorous domesticdemand, and significant foreign direct investment andforeign aid [19]. If the global recession results in a slow-down of foreign direct investment in the region,long-term economic growth may be affected.
In the IEO2009 reference case, Africa’s combined econ-omy grows at an average annual rate of 4.0 percent from2006 to 2030—somewhat lower than IEO2008 projectionof 4.5 percent. The IEO2009 projection still is optimisticby historical standards. It is supported by the region’sstrong economic activity over the past 5 years, resultingfrom expansion of primary exports and robust domesticdemand in many of Africa’s national economies. Never-theless, both economic and political factors—such aslow savings and investment rates, lack of strong eco-nomic and political institutions, limited quantity andquality of infrastructure and human capital, negativeperceptions on the part of international investors, pro-tracted civil unrest and political disturbances, and espe-cially the impact of disease (notably HIV/AIDS)—present formidable obstacles to growth in a number ofAfrican countries.
The nations of Central and South America registered acombined 6-percent increase in GDP in 2004, which wastheir best performance in 20 years; however, theirgrowth prospects have been hampered by a weak inter-national credit environment and by domestic economicand/or political problems in a number of countries. Theproximity of the region to the United States and thetrade relationships of its national economies with theslowing U.S. economy will lead to slower economic
growth in the short term, but the long-term prospects forCentral and South America remain positive. Most coun-tries in the region have flexible exchange-rates regimes,positive trade balances, and relatively low fiscal deficitsand public debts. Regional inflation is lower than it wasin the mid-1990s, and its relatively young labor forcesupports the region’s economic growth prospects overthe next 30 years. Economic growth in Central and SouthAmerican averages 3.7 percent per year from 2006 to2030 in the reference case, as the region benefits from theexpected recovery in world economic growth after 2010and foreign capital flows are revived.
Major Sources of Uncertaintyin the ProjectionsAlternative Economic Growth Cases
Expectations for the future rates of economic growthare a major source of uncertainty in the IEO2009 projec-tions. To illustrate the uncertainties associated with eco-nomic growth trends, IEO2009 includes a high economicgrowth case and a low economic growth case in additionto the reference case. The two alternative growth casesuse different assumptions about future economicgrowth paths, while maintaining the same relationshipsbetween changes in GDP and changes in energy con-sumption that are used in the reference case.
In the high economic growth case, 0.5 percentage pointis added to the growth rate assumed for each country orcountry grouping in the reference case. In the low eco-nomic growth case, 0.5 percentage point is subtractedfrom the reference case growth rate. The IEO2009 refer-ence case shows total world energy consumption reach-ing 678 quadrillion Btu in 2030—278 quadrillion Btu inthe OECD countries and 400 quadrillion Btu in thenon-OECD countries. In the high growth case, worldenergy use in 2030 totals 733 quadrillion Btu—55 qua-drillion Btu (about 27 million barrels oil equivalent perday) higher than in the reference case. In the low growthcase, total world energy use in 2030 is 51 quadrillion Btu(25 million barrels oil equivalent per day) lower than inthe reference case. Thus, the projections for 2030 in thehigh and low economic growth cases define a range ofuncertainty equal to 106 quadrillion Btu (Figure 20).
Alternative World Oil Price Cases
Assumptions about world oil prices are another impor-tant factor that underscores the considerable uncertaintyin long-term energy market projections. The effects ofdifferent assumptions about future oil prices are illus-trated in IEO2009 by two alternative oil price cases. Inthe high price case, world oil prices (in real 2007 dollars)climb from $68 per barrel in 2006 to $200 per barrel in2030; in the low price case, they decline to $50 per barrelin 2015 and remain at about that level through 2030. In
Energy Information Administration / International Energy Outlook 2009 17
1980 1995 2006 2015 20300
200
400
600
800
Quadrillion Btu
History Projections
LowEconomic
Growth
Reference
HighEconomic
Growth
Figure 20. World Marketed Energy Consumptionin Three Economic Growth Cases,1980-2030
Sources: History: Energy Information Administration (EIA),International Energy Annual 2006 (June-December 2008),web site www.eia.doe.gov/iea. Projections: EIA, WorldEnergy Projections Plus (2009).

comparison, world oil prices rise to $130 per barrel in2030 in the reference case (Figure 21).
Although the difference in world oil prices between thehigh and low oil price cases is considerable, at $150 perbarrel in 2030, the projections for total world energy con-sumption in 2030 do not vary substantially among thecases. There is, however, a larger impact on the mix ofenergy fuels consumed. The projections for total worldenergy use in 2030 in the high and low oil price cases areseparated by 48 quadrillion Btu (Figure 22), as comparedwith the difference of 106 quadrillion Btu between thelow and high economic growth cases.
The potential effects of higher and lower oil prices onworld GDP can also be seen in the low and high pricecases. In the long run, on a worldwide basis, the projec-tions for economic growth are not affected substantiallyby the price assumptions. There are, however, some rel-atively large regional impacts. The most significant vari-ations are GDP decreases of around 2.0 percent in thehigh price case relative to the reference case in 2015 forsome regions outside the Middle East and, in theoil-exporting Middle East region, a 5.5-percent increasein GDP in 2015. The regional differences persist into thelong term, with GDP in the Middle East about 6.2 per-cent higher in 2030 in the high oil price case than in thereference case and GDP in some oil-importing regions(such as OECD Europe and Japan) between 2.0 percentand 3.0 percent lower in the high price case than in thereference case.
The most substantial impacts of the high and low oilprice assumptions are on the mix of energy fuels con-sumed in each region—particularly, fossil fuels (Figure23). In the high price case, total world liquids consump-tion in 2030 is about 34 quadrillion Btu lower than pro-jected in the reference case, natural gas consumption in2030 is 9 quadrillion Btu higher, and coal consumption is2 quadrillion Btu higher than in the reference case. Thedifferences for nuclear power and renewable energyconsumption between the two cases is very small, espe-cially in the near to mid-term, primarily because bothenergy sources are strongly influenced by governmentpolicies and incentives, and prices do not have a largeimpact on their development.
In the low oil price case, consumers increase their use ofliquids for transportation, and there is less incentive formovement away from liquids to other energy sources insectors where fuel substitution is fairly easy to achieve
18 Energy Information Administration / International Energy Outlook 2009
1980 1995 2006 2015 20300
50
100
150
200
2502007 Dollars per Barrel
History Projections
High WorldOil Price
Reference
Low WorldOil Price
$200
$50
$130
Figure 21. World Oil Prices in Three Price Cases,1980-2030
Source: Energy Information Administration (EIA), AnnualEnergy Outlook 2009, DOE/EIA-0383(2009) (Washington, DC,June 2009), web site www.eia.doe.gov/oiaf/aeo.
2006 2010 2015 2020 2025 20300
200
400
600
800Quadrillion Btu
High Price Reference Low Price
Figure 22. World Marketed Energy Consumptionin Three Oil Price Cases, 2006-2030
Sources: History: Energy Information Administration (EIA),International Energy Annual 2006 (June-December 2008),web site www.eia.doe.gov/iea. Projections: EIA, WorldEnergy Projections Plus (2009).
Reference High Price Low Price0
100
200
300Quadrillion Btu
Liquids Coal Natural Gas Renewables
Nuclear
Figure 23. World Marketed Energy Consumptionin Three Oil Price Cases, 2030
Source: Energy Information Administration, World EnergyProjections Plus (2009).

(as opposed to the transportation sector, where there arefew alternatives to liquid fuels). Total liquids consump-tion in 2030 is 28 quadrillion Btu higher in the low pricecase than projected in the reference case, reflectingincreased demand in all the end-use sectors. The trans-portation sector shows the largest increase in liquidsconsumption (12 quadrillion Btu) in 2030 in the lowprice case relative to the reference case (Figure 24), fol-lowed by the industrial sector (8 quadrillion Btu) and theelectric power sector (5 quadrillion Btu).
In the IEO2009 reference case, world oil prices begin torise after 2010 and reach $130 per barrel in 2030. As aresult, liquids consumption is curtailed in countries thathave other fuel options available—especially in the elec-tric power sector, where coal and other fuels can besubstituted. Worldwide use of liquids for electricity gen-eration falls by 0.8 quadrillion Btu from 2006 to 2030 inthe reference case. In the low price case, consumption ofliquids for electricity generation increases by 3.9 qua-drillion Btu, as the non-OECD countries retain theiroil-fired generating capacity in the lower priceenvironment.
References
Energy Information Administration / International Energy Outlook 2009 19
0
216
182
244
Reference High Price Low Price0
50
100
150
200
250
300Quadrillion Btu
Transportation
Industrial
Residential
Commercial
Electric Power
Figure 24. World Liquids Consumption in ThreePrice Cases, 2030
Source: Energy Information Administration, World EnergyProjections Plus (2009).
1. U.S. Department of Energy, Loan Guarantee Pro-gram, “Key Documents: Title XVII. Incentives forInnovative Technologies” (August 8, 2005), web sitewww.lgprogram.energy.gov.
2. After conversion (1 square meter = 10.76 squarefeet). Source: China Statistics 2006: Data from theNational Bureau of Statistics of the Peoples Republic ofChina, “Floor Space Completed and Housing Con-ditions of Urban and Rural Residents,” web sitewww.allcountries.org/china_statistics/10_32_floor_space_completed_and_housing.html.
3. International Energy Agency, World Energy Outlook2008 (Paris, France, November 2008), pp. 357 and365.
4. See, for example, IHS Global Insight, Inc., GlobalExecutive Summary (Lexington, MA, January 2009),p. 1; and International Monetary Fund, WorldEconomic Outlook: Update (January 28, 2009), website www.imf.org/external/pubs/ft/weo/2009/update/01/index.htm.
5. IHS Global Insight, Inc., Global Executive Summary:The Worst Recession in the Postwar Era (Lexington,MA, January 2009), p. 8.
6. International Monetary Fund, “Transcript of a Con-ference Call on Canada’s 2009 Article IV Consulta-tion” (Washington, DC, March 2009), web sitewww.imf.org/external/np/tr/2009/tr031109.htm.
7. Organization for Economic Cooperation and Devel-opment, OECD Economic Outlook No. 80 (Paris,
France, November 2006), Annex Table 21, “Poten-tial GDP, Employment and Capital Stock,” web sitewww.oecd.org/dataoecd/5/49/37841330.xls.
8. International Monetary Fund, World Economic Out-look October 2008 (Washington, DC, October 2008),pp. 55-56, web site www.imf.org/external/pubs/ft/weo/2008/02/pdf/text.pdf.
9. IHS Global Insight, Global Executive Summary: TheGlobal Outlook Has Darkened Again (Lexington, MA,February 2009), p. 3.
10. Seo Eun-kyung, “Update 2—Bank of Korea HoldsRates Amid Unease Over Currency,” Reuters IndiaNews Release (March 12, 2009), web site http://in.reuters.com.
11. “Bank of Korea Freezes Key Rate at 2%,” The KoreaTimes (March 12, 2009), web site www.koreatimes.co.kr; and M. Hadi, “The Bank of Korea’s Conun-drum,” The Wall Street Journal Online (March 12,2009), web site http://online.wsj.com/article/SB123686058646506849.html.
12. Seo Eun-kyung, “Update 2—Bank of Korea HoldsRates Amid Unease Over Currency,” Reuters IndiaNews Release (March 12, 2009), web site http://in.reuters.com.
13. International Monetary Fund, World Economic Out-look October 2008 (Washington, DC, October 2008),pp. 62-63, web site www.imf.org/external/pubs/ft/weo/2008/02/pdf/text.pdf.
14. IHS Global Insight, Global Executive Summary: TheWorst Recession in the Postwar Era (Lexington, MA,January 2009), p. 10.
15. E.J. Young, “Which Way Ahead for China?” EnergyStrategies for a Turbulent Economy: Perspectives from

20 Energy Information Administration / International Energy Outlook 2009
CERAWEEK 2009 (March 2009), web site www.cera.com (subscription site).
16. C. Innes, “Country Intelligence—Analysis: India:Growth Slows to Near Six-Year Low in India” (IHSGlobal Insight, Inc., February 27, 2009), web sitewww.globalinsight.com (subscription site).
17. IHS Global Insight, Global Executive Summary: TheWorst Recession in the Postwar Era (Lexington, MA,January 2009), p. 11.
18. J. Hoookway, “In Vietnam, Domestic DemandHelps Cushion Downturn’s Blow,” The Wall StreetJournal (March 16, 2009), p. A2.
19. United Nations, World Economic Situation andProspects 2008 (New York, NY, 2008), web sitewww.un.org/esa/policy/wess/wesp2008files/wesp2008.pdf.

Chapter 2
Liquid FuelsWorld liquids consumption in the IEO2009 reference case increases from 85 million barrels
per day in 2006 to 107 million barrels per day in 2030. Unconventional liquids,
at 13.4 million barrels per day, make up 12.6 percent of total liquids production in 2030.
Demand for liquid fuels and other petroleum9 increasesfrom 85.0 million barrels per day in 2006 to 106.6 millionbarrels per day in 2030 in the IEO2009 reference case,despite world oil prices that remain above $100 per bar-rel (in real 2007 dollars) from 2013 through the end of theprojection period. More than 80 percent of the increasein total liquids consumption is projected for the nationsof non-OECD Asia and the Middle East, where strongeconomic growth is expected (Figure 25). The transpor-tation sector accounts for the largest increment in totalliquids demand, at nearly 80 percent of the total worldincrease.
To satisfy the increase in world demand, liquids produc-tion—including conventional and unconventionalpetroleum and nonpetroleum liquids—increases by 22million barrels per day from 2006 to 2030 in the referencecase (Figure 26 and Table 3). Sustained high world oilprices in the reference case allow for the economicaldevelopment of unconventional resources and the
use of enhanced oil recovery technologies to increaseproduction of conventional resources. High oil pricesalso permit the development of additional conventionalresources through technically difficult, high-risk, andvery expensive projects, including those located inultra-deep water and the Arctic.
The countries making the most significant contributionsto growth of non-OPEC production in the reference caseare the United States and Brazil, as total non-OPEC pro-duction in 2030 rises to nearly 13 million barrels per dayabove the 2006 level and represents 59 percent of thetotal world increase. OPEC producers,10 in this case, areassumed to keep their investments in incremental pro-duction capacity below the levels that would be justifiedby high prices, providing only about 40 percent of theworld’s total liquids supply over the 2006-2030 period.
In 2006, world production of unconventional liquidstotaled 3.1 million barrels per day. In 2030,
Energy Information Administration / International Energy Outlook 2009 21
North America
Non-OECD Asia
OECD Europe
OECD Asia
Central and South America
Middle East
Non-OECD Europe and Eurasia
Africa
0 10 20 30 40
Million Barrels per Day
2006
2030
Figure 25. World Liquids Consumption by Regionand Country Group, 2006 and 2030
Sources: 2006: Derived from Energy Information Adminis-tration (EIA), International Energy Annual 2006 (June-December 2008), web site www.eia.doe.gov/iea. 2030: EIA,World Energy Projections Plus (2009).
2006 Reference High Price2030
Low Price0
50
100
150
200Million Barrels per Day
Non-OPEC Conventional
OPEC Conventional
Total Unconventional
48 45 54
34 27
54
12
183
51
42
13
Figure 26. World Liquids Supply in Three Cases,2006 and 2030
Sources: 2006: Energy Information Administration (EIA),Office of Energy Markets and End Use. 2030: EIA, GenerateWorld Oil Balance Model (2009).
9Liquid fuels and other petroleum (also referred to as “liquids”) include all petroleum products, natural gas liquids, biofuels, and liquidsderived from other hydrocarbon sources (coal to liquids and gas to liquids). Not included are compressed natural gas (CNG), liquefied natu-ral gas (LNG), and hydrogen.
10 Indonesia officially suspended its membership in OPEC on January 1, 2009. In this chapter, all references to OPEC exclude Indonesia.In addition, all time series have been updated to reflect country groupings as of January 1, 2009, so that Indonesia’s liquids production is ex-cluded from the OPEC totals for 1980 through 2030.

unconventional liquids production in the reference casetotals 13.4 million barrels per day and accounts for morethan 12 percent of total world liquids production, asunconventional resources from both OPEC and non-OPEC sources become increasingly competitive.Although production of unconventional petroleumliquids, such as Canada’s oil sands and Venezuela’sextra-heavy oil, is limited somewhat by environmentalconcerns and investment restrictions, production of un-conventional nonpetroleum liquids, such as biofuels,coal-to-liquids (CTL), and gas-to-liquids (GTL), isspurred by sustained, relatively high prices both in thereference case and in the high oil price cases (Figure 27).Development of nonpetroleum liquids production alsowill depend on country-specific programs or mandates.
World Liquids ConsumptionWorld liquids consumption in the IEO2009 referencecase increases from 85 million barrels per day (173 qua-drillion Btu) in 2006 to 107 million barrels per day (216quadrillion Btu) in 2030. Although world demand forliquids is dampened in the near term as a result of theglobal economic recession that began in 2008 and contin-ues into 2009, a return to trend growth is expected overthe long term as national economies recover. In particu-lar, the developing economies of non-OECD Asia andthe Middle East are expected to return to strong eco-nomic growth, accompanied by growing demand forenergy to fuel transportation and industrial activity.
22 Energy Information Administration / International Energy Outlook 2009
Table 3. World Liquid Fuels Production in the Reference Case, 2006-2030(Million Barrels per Day)
Source 2006 2010 2015 2020 2025 2030
Average AnnualPercent Change,
2006-2030OPECConventional Liquidsa . . . . . . . 34.0 35.0 37.3 38.8 40.2 42.3 0.9Extra-Heavy Oil . . . . . . . . . . . . 0.6 0.6 0.7 0.8 1.0 1.2 2.8Bitumen. . . . . . . . . . . . . . . . . . 0.0 0.0 0.0 0.0 0.0 0.0 —Coal-to-Liquids . . . . . . . . . . . . 0.0 0.0 0.0 0.0 0.0 0.0 —Gas-to-Liquids. . . . . . . . . . . . . 0.0 0.0 0.1 0.2 0.3 0.3 18.3Shale Oil . . . . . . . . . . . . . . . . . 0.0 0.0 0.0 0.0 0.0 0.0 —Biofuels . . . . . . . . . . . . . . . . . . 0.0 0.0 0.0 0.0 0.0 0.0 —
OPEC Total . . . . . . . . . . . . . 34.7 35.6 38.1 39.9 41.4 43.8 1.0Non-OPECConventional Liquidsa . . . . . . . 47.5 46.3 46.1 47.9 49.4 50.9 0.3Extra-Heavy Oil . . . . . . . . . . . . 0.0 0.0 0.0 0.0 0.1 0.1 14.3Bitumen. . . . . . . . . . . . . . . . . . 1.2 1.9 2.8 3.3 3.8 4.2 5.3Coal-to-Liquids . . . . . . . . . . . . 0.1 0.2 0.3 0.5 0.8 1.2 9.0Gas-to-Liquids. . . . . . . . . . . . . 0.0 0.0 0.1 0.1 0.1 0.1 —Shale Oil . . . . . . . . . . . . . . . . . 0.0 0.0 0.0 0.0 0.1 0.2 13.9Biofuels . . . . . . . . . . . . . . . . . . 0.8 1.9 2.8 3.8 5.0 5.8 8.6
Non-OPEC Totalb. . . . . . . . . 49.9 50.7 52.5 56.0 59.6 62.8 1.0WorldConventional Liquidsa . . . . . . . 81.5 81.3 83.4 86.7 89.6 93.1 0.6Extra-Heavy Oil . . . . . . . . . . . . 0.6 0.7 0.7 0.9 1.0 1.2 3.0Bitumen. . . . . . . . . . . . . . . . . . 1.2 1.9 2.8 3.3 3.8 4.2 5.3Coal-to-Liquids . . . . . . . . . . . . 0.1 0.2 0.3 0.5 0.8 1.2 9.0Gas-to-Liquids. . . . . . . . . . . . . 0.0 0.1 0.2 0.3 0.3 0.3 19.3Shale Oil . . . . . . . . . . . . . . . . . 0.0 0.0 0.0 0.0 0.1 0.2 13.9Biofuels . . . . . . . . . . . . . . . . . . 0.8 1.9 2.8 3.9 5.1 5.9 8.6
World Total . . . . . . . . . . . . . 84.6 86.3 90.6 95.9 101.1 106.6 1.0aIncludes conventional crude oil and lease condensate, natural gas plant liquids (NGPL), and refinery gain.bIncludes some U.S. petroleum product stock withdrawals, domestic sources of blending components, other hydrocarbons, and
ethers.OPEC = Organization of the Petroleum Exporting Countries (OPEC-12).Sources: History: Energy Information Administration (EIA), Office of Energy Markets and End Use. Projections: Generate World
Oil Balance Model (2009).

The increasing cost-competitiveness of other energysources causes many current users of liquids outside thetransportation sector to switch to other fuels, and as aresult the transportation share of total liquids consump-tion increases over time (Figure 28). In 2030, the trans-portation sector consumes 56 percent of total liquidssupplied, with the increase in volume consumedaccounting for 79 percent of the total increase in liquidsconsumption across all sectors from 2006 to 2030.
Strong expansion of liquids use is projected for thenon-OECD countries, fueled by a return to robust eco-nomic growth, burgeoning industrial activity, and rap-idly expanding transportation use. The largest increasein regional non-OECD consumption between 2006 and2030 is projected for non-OECD Asia, at 14.1 million bar-rels per day. By country, China (8.1 million barrels perday) and India (2.0 million barrels per day) show thelargest increases in demand in the region, and the pro-jected growth in China’s liquids demand is the largestfor any country worldwide. Large increases in liquidsconsumption are also expected in the Middle East region(3.3 million barrels per day) and Central and SouthAmerica (1.9 million barrels per day) (see Figure 25).
Liquids consumption in the OECD region generallygrows more slowly, reflecting expectations of slowlygrowing or declining populations and relatively sloweconomic growth in most of the OECD nations, as com-pared with the non-OECD nations, over the next twodecades. In Japan and OECD Europe, liquids consump-tion declines by an average of 0.4 and 0.2 percent,respectively.
The different growth trends projected for the non-OECDand OECD regions mean that total liquids demand inthe non-OECD countries surpasses that in the OECDcountries in 2021, when demand in non-OECD Asiaexceeds that in North America. In 2030, the United Statesstill consumes more liquids than China does, but the dif-ference between the two is less than one-half the differ-ence in 2006.
World Oil PricesA major factor in the IEO2009 projections is the assump-tion for future world oil prices. The impacts of world oilprices on energy demand are a considerable source ofuncertainty in the projections. In the reference case, theaverage world oil price rises from $61 per barrel in200911 to $110 per barrel in 2015 and $130 per barrel in2030 ($189 per barrel in nominal terms) (Figure 29). Inthe low price case, oil prices average $50 per barrel in2030 ($73 per barrel in nominal terms), compared with$200 per barrel ($289 per barrel in nominal terms) in thehigh price case. The projections for total liquids con-sumption in 2030 range from 90 million barrels per dayin the high price case to 120 million barrels per day in thelow price case, reflecting the substantial range of uncer-tainty in the projections. The three world oil price pathsin IEO2009 are consistent with those in the AnnualEnergy Outlook 2009.
The three oil price cases are distinct scenarios, eachreflecting alternative assumptions about the sources andcosts of world oil supplies. The reference case reflectsan assumed decision by OPEC member countries to
Energy Information Administration / International Energy Outlook 2009 23
2006 Reference Low Price2030
High Price0
5
10
15
20Million Barrels per Day
Oil Sands/Bitumen
Biofuels
Extra-Heavy Oil
Coal-to-Liquids
Gas-to-Liquids
Shale Oil/Other
Figure 27. World Production of UnconventionalLiquid Fuels, 2006-2030
Sources: 2006: Energy Information Administration (EIA),Office of Energy Markets and End Use. 2030: EIA, GenerateWorld Oil Balance Model (2009).
173 175 183194
205216
2006 2010 2015 2020 2025 20300
100
200
300Quadrillion Btu
Transportation
Industrial
Electric Power
Residential/Commercial
Figure 28. World Liquids Consumption by Sector,2006-2030
Sources: 2006: Derived from Energy Information Adminis-tration (EIA), International Energy Annual 2006 (June-December 2008), web site www.eia.doe.gov/iea. Projections:EIA, World Energy Projections Plus (2009).
11 The world oil price reported in IEO2009 is for light sweet crude oil delivered to Cushing, Oklahoma. All oil prices are in real 2007 dol-lars per barrel, unless otherwise noted.

maintain the organization’s aggregate production atapproximately 40 percent of world liquids supply. As aresult, roughly 60 percent of the projected increase in liq-uid fuels consumption in the reference case comes fromnon-OPEC production, including high-cost projects andprojects in countries with unattractive fiscal or politicalregimes.
The high oil price case assumes that several non-OPECcountries further restrict access to or increase taxes onproduction from prospective areas, and that the OPECmember countries reduce their production substantiallybelow current levels. Oil prices rise above the referencecase levels, dampening demand for liquid fuels andenabling increased production from those high-cost con-ventional and unconventional non-OPEC resources thatstill are accessible and attractive for exploration anddevelopment.
The low oil price case assumes greater access to, andmore attractive fiscal regimes in, several prospectivenon-OPEC areas, including Russia and the Caspianregion, as well as increased production from OPECmember countries. Consequently, oil prices fall belowreference case levels, resulting in increased worlddemand for liquid fuels and decreased production fromconventional and unconventional resources in non-OPEC countries that currently have attractive fiscalregimes.
Recent events illustrate some of the ways in which sup-ply of and demand for liquids affect oil prices. The first 6months of 2008 saw a continuation of the previous 5years of increasing oil prices, which spurred company
commitments to relatively high-cost exploration andproduction projects, such as those in ultra-deep waterand oil sands, even though high demand for steel, engi-neers, oil field services, and other inputs were drivingup costs. An apparent lack of demand response to highprices in developing countries (China and India, in par-ticular) led to expectations of continuing high oil prices.Rising demand and lagging supply led some analysts tobelieve that a price of $200 per barrel was plausible in thenear term [1].
By July 2008, when world oil prices neared $150 per bar-rel, it had become apparent that petroleum consumptionin the first half of the year was lower than anticipatedand that economic growth also was slowing [2]. Augustsaw the beginning of the current financial crisis and afurther weakening of demand [3]. Since September 2008,the global economic downturn has reduced consumers’current and prospective near-term demand for oil.
In the second half of 2008, producer and consumerexpectations regarding the imbalance of supply anddemand in the world oil market were essentiallyreversed. Before August, market expectations for thefuture economy indicated that demand would outpacesupply despite planned increases in production capac-ity. After September, expectations became so dismal thatOPEC’s announcement of a 1.5-million-barrel-per-dayproduction cut was followed by a drop in oil prices [4].
Although the impacts of the current economic downturnand financial crisis on petroleum demand are likely to belarge in the near term, they also are likely to be relativelyshort-lived. National economies and oil demand areexpected to begin recovering in 2010. In contrast, theirimpacts on oil production capacity probably will not berealized until 2010-2013, when current investments innew capacity, should they be made, will begin toincrease oil production [5]. As a result, just at the timewhen demand is expected to recover, physical limits onproduction capacity could lead to another wave of priceincreases, in a cyclical pattern that is not new to theworld oil market.
Developments in the past year demonstrate how quicklyand drastically the fundamentals of oil prices and theworld liquids market as a whole can change. Within amatter of months, the change in current and prospectiveworld liquids demand has affected the perceived needfor additional access to conventional resources anddevelopment of unconventional liquids supply andreversed OPEC production decisions. Rather thanattempting to forecast how supply and demand funda-mentals and perceptions will change between now and2030, IEO2009 uses the three oil price cases to reflect dif-ferent assumptions about future liquids supply levels,sources, and costs.
24 Energy Information Administration / International Energy Outlook 2009
1980 1995 2007 2015 20300
50
100
150
200
2007 Dollars per Barrel
High Price
Low Price
Reference
History Projections
$200
$50
$130
Figure 29. World Oil Prices in Three Cases,1980-2030
Sources: History: Energy Information Administration (EIA),International Energy Annual 2006 (June-December 2008),web site www.eia.doe.gov/iea. Projections: EIA, AnnualEnergy Outlook 2009, DOE/EIA-0383(2009) (Washington, DC,June 2009), web site www.eia.doe.gov/oiaf/aeo.

World Liquids ProductionIn the IEO2009 reference case, world liquids productionin 2030 exceeds the 2006 level by 22 million barrels perday. Increases in production are expected for both OPECand non-OPEC producers; however, 59 percent of thetotal increase is expected to come from non-OPEC areas,with 44 percent from non-OPEC unconventional liquidsproduction alone. In 2030, OPEC production totals 44million barrels per day and non-OPEC production totals63 million barrels per day in the reference case.
The reference case assumes that OPEC producers willchoose to maintain their market share of world liquidssupply and will invest in incremental production capac-ity to maintain an approximate 40-percent share of totalglobal liquids production through 2030. Increasing vol-umes of conventional liquids (crude oil and lease con-densates, natural gas plant liquids [NGPL], and refinerygain) from OPEC members contribute 8.3 million barrelsper day to the total increase in world liquids productionfrom 2006 to 2030, while conventional liquids suppliedfrom non-OPEC nations contribute 3.3 million barrelsper day.
Unconventional liquids represent the largest share ofgrowth over the projection period, because high oilprices make them more competitive economically.Unconventional fuels account for 47 percent of theincrease in total production from 2006 to 2030, or 10.4million barrels per day, of which 9.6 million barrels perday comes from non-OPEC sources. High oil prices,improvements in exploration and extraction technolo-gies, emphasis on recovery efficiency, and the emer-gence and continued growth of unconventional resourceproduction are the primary factors leading to the growthof non-OPEC liquids production in the reference case.
The IEO2009 projections are based on a two-stage ana-lytical approach. Projections of liquids productionbefore 2015 are based largely on a project-by-projectassessment of production volumes and associatedscheduling timelines, with consideration given to thedecline rates of active projects, planned exploration anddevelopment activity, and country-specific geopoliticalsituations and fiscal regimes. The extensive and detailedinformation available about such projects, includingproject scheduling and the investment and developmentplans of companies and countries, make it possible totake a detailed approach to modeling supply. There areoften lengthy delays, however, between the point atwhich supply projects are announced and when theybegin producing. In addition, many projects have beendelayed recently as a result of lower expectations for
growth in world liquids demand in the near termbecause of the global economic slowdown and the diffi-culty of obtaining credit to finance production projectsduring the global credit crisis.
Because projects generally are not publicized more than7 to 10 years before their first production, project-by-project analyses are unlikely to provide a complete rep-resentation of company or country production plansand achievable production volumes. Instead, produc-tion decisions made after 2015 are assumed to be basedpredominantly on resource availability and the result-ing economic viability of production. Geopolitical andother “above-ground” constraints12 are not assumed todisappear entirely after 2015, however. Longstandingabove-ground factors for which there are no indicationsof significant future changes—for instance, the govern-ment-imposed investment conditions currently in placein Iran, or OPEC adherence to production quotas—areexpected to continue to affect world supplies long after2015. Moreover, even if above-ground constraints wereminimized, expansion of production capacity still couldbe delayed, depending on technical difficulty and sched-uling constraints for the types of projects likely to bedeveloped in different countries.
For some resource-rich countries it is assumed that cur-rent political barriers to increasing production will notcontinue after 2015. For instance, both Mexico and Vene-zuela currently have legislation that restricts foreignownership of hydrocarbon resources. Their nationaliza-tion of resources has discouraged investment—bothforeign and domestic—and hindered their ability toincrease or even maintain historical production levels.In the reference case, both Mexico and Venezuela areassumed to ease restrictions at some point after 2015,allowing some additional foreign investment or involve-ment in their oil sectors that will facilitate increases inliquids production, including from deepwater prospectsin Mexico and extra-heavy oils in Venezuela’s Orinocobelt.
Iraq is another resource-rich country where currentlythere are significant impediments to investment in theupstream hydrocarbon sector. Liquids production inIraq dropped substantially in 2003 after the U.S.-ledinvasion. From 2002 to 2003 production declined from2.0 million barrels per day to 1.3 million barrels per day.Since then, Iraq’s production has recovered to approxi-mately pre-invasion levels, although the recovery hasbeen slow and inconsistent. Although Iraq’s productionlevels are not expected to increase substantially in thenear term, it is assumed that current levels of infra-structure destruction and political, as well as legal,
Energy Information Administration / International Energy Outlook 2009 25
12 “Above-ground” constraints refer to those nongeological factors that might affect supply, including: government policies that limit ac-cess to resources; conflict; terrorist activity; lack of technological advances or access to technology; price constraints on the economical de-velopment of resources; labor shortages; materials shortages; weather; environmental protection actions; and other short- and long-termgeopolitical considerations.

uncertainty will be diminished, leading to renewedinvestment and development activity and followedby fairly significant growth in production from 2015through 2030.
Non-OPEC Production
The return to and maintenance of high oil prices pro-jected in the IEO2009 reference case are expected toencourage producers in non-OPEC nations to continueinvestment in conventional liquids production capacityand increase investment in enhanced oil recovery (EOR)projects and unconventional liquids production. Non-OPEC production increases steadily in the projection,from 50 million barrels per day in 2006 to 63 million bar-rels per day in 2030, as high prices attract investment inareas previously considered uneconomical, and fears ofsupply restrictions encourage some net consumingnations to expand unconventional liquids productionfrom domestic resources, such as coal and biomass.
Despite the maturity of most non-OPEC producing bas-ins, conventional liquids production in the referencecase increases from 48 million barrels per day in 2006 to51 million barrels per day in 2030, led by productiongains in Brazil, Russia, Kazakhstan, and the UnitedStates. Among non-OPEC producers, the lack of manyprospects for new, large conventional petroleum liquidsprojects and declines in production from existing con-ventional fields result in heavy investment in the devel-opment of smaller fields. Producers are expected toconcentrate their efforts on more efficient exploitation offields already in production, either through the use ofmore advanced technology for primary recovery effortsor through EOR. Those efforts are expected to allowmost non-OPEC producers to maintain or slow produc-tion declines but not to raise production volumes.
Large increases in non-OPEC production of conven-tional petroleum liquids are expected to come from therelatively few regions with recent large discoveries orhigh undiscovered resource potential. Significant gainsin conventional production are projected for the Caspianarea (Kazakhstan) and South America (Brazil) (Figure30). Canada is expected to be a major non-OPEC sup-plier of liquids, with its unconventional bitumen (oilsands) production more than compensating for pro-jected declines in its conventional oil production.
In the reference case, unconventional liquids productionfrom non-OPEC suppliers rises to 6 million barrels perday in 2015 and 12 million barrels per day in 2030. In thehigh oil price case, non-OPEC unconventional liquidsproduction rises to 17 million barrels per day in 2030, assignificantly higher prices encourage the developmentof alternative fuel sources, up to the limits imposed byexpected environmental protection measures andindustry expansion in general. In the low oil price case,
fewer unconventional resources become economicallycompetitive, and non-OPEC production of unconven-tional liquids in 2030 totals only 9 million barrels perday.
The most significant decline in non-OPEC liquids pro-duction is projected for the North Sea (which includesoffshore production from Norway, the United King-dom, the Netherlands, and Germany), where there arediminishing prospects for new discoveries capable ofcompensating for the decline of existing fields. All thecountries currently producing North Sea oil are expect-ed to continue encouraging investment and providingopen access to development.
The second-largest decline in non-OPEC liquids produc-tion is projected for Mexico, where liquids productiondrops to approximately 1.9 million barrels per day in2020 before rebounding slowly to 2.3 million barrelsper day in 2030—still 1.4 million barrels per day belowthe 2006 production volume. The projected rebounddepends entirely on the development of potentialresources in the deepwater Gulf of Mexico, which mustbegin some years in advance of any increase inproduction.
The outlook for Mexico’s liquids production is markedlydifferent from the projection 2 years ago in IEO2007,which had a low point of about 3.0 million barrels perday in 2012 followed by a long-term recovery from 2013to 2030. The lower projection this year is based ondeclines in production from the Cantarell basin thathave been more severe than expected, along with morepessimistic assumptions about future investment, bothforeign and domestic, in Mexico’s deepwater produc-tion. It is assumed, however, that Mexico will have the
26 Energy Information Administration / International Energy Outlook 2009
Russia
Asia
United States
OECD Europe
Mexico
Africa
Caspian Region
Canada
Brazil
0 5 10 15
Million Barrels per Day
2006
2030
Figure 30. Non-OPEC Conventional LiquidsProduction by Region, 2006 and 2030
Sources: 2006: Energy Information Administration (EIA),Office of Energy Markets and End Use. 2030: Energy Informa-tion Administration, Generate World Oil Balance Model (2009).

resources to support a long-term recovery in its total liq-uids production, primarily because of the potential fornew resource discoveries in the Gulf of Mexico. Theextent and timing of the expected recovery will dependon the level of economic access granted to foreign inves-tors, because the national oil company, PEMEX, cur-rently does not have the technical capability or financialmeans to develop potential deepwater resources in theGulf of Mexico.
Canada’s production of conventional liquids declines byjust over 1.0 million barrels per day from 2006 to 2030.Unconventional petroleum liquids from oil sands areexpected to more than offset the decline, however, sothat total production increases by 2.1 million barrels perday in the reference case, to 5.4 million barrels per day in2030.
The largest increase in non-OPEC total liquids produc-tion is projected for the United States, where conven-tional production increases from 7.8 million barrels perday in 2006 to 10.2 million barrels per day in 2030.Although U.S. production of conventional liquids hasbeen in decline for many years, it is expected to grow inthe projection, both as a result of deepwater offshoreprojects that are scheduled to begin producing in thenear term, and because application of enhanced oilrecovery (EOR) technologies will increase production inthe long term. Thus, total U.S. production of crude oiloffshore increases from 1.4 million barrels per day in2006 to about 2.0 million barrels per day in 2010 and 2.7million barrels per day in 2030 in the reference case, asoil production using EOR increases more than fivefold,from 0.3 million barrels per day in 2006 to 1.7 millionbarrels per day in 2030.
Unconventional liquids also are projected to be anincreasingly important source of domestic supply in theUnited States. In 2030, liquid fuels production fromunconventional sources includes 257 thousand barrelsper day from CTL, 1,880 thousand barrels per day frombiofuels (ethanol and biodiesel), and 144 thousand bar-rels per day from oil shale.
U.S. ethanol production alone is projected to increase to1.4 million barrels per day, in part because of the Federalrenewable fuels standard (RFS). Progress toward meet-ing the RFS is complicated, however, by slowing growthin U.S. petroleum consumption through 2030. The pushfor more fuel-efficient automobiles, which slows theincrease in motor gasoline consumption in the referencecase, also slows progress toward meeting the RFS,because more efficient gasoline motors and the growingpenetration of hybrids reduce the demand for ethanol ingasoline fuel blends. In addition, a 10-percent limit onethanol in gasoline for most of the current fleet of pas-senger vehicles delays further market penetration until
more E85-compatible vehicles are in use and the marketinfrastructure for E85 and other biofuels is expanded toaccommodate the distribution and sale of largervolumes.
U.S. crude oil production is sensitive to projected oilprices. In 2030, offshore crude oil production is 3.0 mil-lion barrels per day in the high oil price case and 2.1 mil-lion barrels per day in the low oil price case. Similarly,onshore crude oil production is 4.8 million barrels perday in the high oil price case in 2030 and 3.0 million bar-rels per day in the low oil price case.
The second-largest contribution to non-OPEC liquidsproduction in the reference case comes from Brazil,where total production increases by 3.7 million barrelsper day from 2006 to 2030, with 3.0 million barrels perday of the increase coming from conventional liquidsproduction. This strong growth in Brazil’s conventionalliquids production results in part from expansions atproducing fields that currently are either in progress orplanned. In addition, recent discoveries in the Camposand Santos basins, including the massive Tupi andrelated Guara and Iara subsalt discoveries,13 add to pro-duction in the mid- and long term and suggest the pres-ence of other large fields in the same formation. The vastsize of the subsalt potential in Brazil, and the shortfallsof the current licensing and bidding structure associatedwith block boundary issues created by the geographicdistribution of each of the subsalt deposits, have causedBrazil to consider restructuring its licensing and biddingprocess and the terms for foreign investment.
Although Petrobras has repeatedly proven itself as aleader in deepwater development and is known to havethe technical capabilities to develop subsalt prospects, itis not expected to have the resources (financial, labor,etc.) or ultimate inclination to develop them on its own.The IEO2009 high and low oil price cases assume differ-ent investment terms offered by Brazil to foreign inves-tors and hence different rates of subsalt development,with the high price case assumption of tighter terms ofaccess resulting in average annual growth in conven-tional liquids production of 3 percent and additionalproduction of 2.1 million barrels per day in 2030. Thelow price case assumes very open terms of access, result-ing in average annual growth of 5 percent and addi-tional production of 4.1 million barrels per day in 2030.
In addition to the expected growth in Brazil’s conven-tional liquids production, its ethanol productionincreases to 0.9 million barrels per day in 2030 in the ref-erence case, as a result of steady increases in yields andexpansion of crop production. Brazil’s major ethanolproduction is derived from sugar cane, which currentlyis the highest yielding and least expensive feedstock forethanol. Brazil also has a large amount of previously
Energy Information Administration / International Energy Outlook 2009 27
13 “Subsalt” refers to rock formations that lie beneath long, horizontal layers of salt and may contain hydrocarbons.

cleared but underutilized pasture land available forsugar cane cultivation. The country’s domestic con-sumption is not expected to keep pace with its expand-ing ethanol production, making Brazil a net ethanolexporter; therefore, its production will depend largelyon other countries’ policies and demand for ethanol. Thecurrent U.S. tariff on imported ethanol makes importsfrom Brazil prohibitively expensive.
In the high oil price case, Brazil’s ethanol productiontotals 1.3 million barrels per day in 2030, reflectinghigher demand for ethanol both at home and abroad andreduced import tariffs in other countries. The low oilprice case assumes reduced domestic and internationaldemand for ethanol, resulting in 0.8 million barrels perday of production in 2030. The projected reduction inBrazil’s domestic demand in the low price case is rela-tively small, however, because ethanol currentlyaccounts for almost 50 percent of the fuel used by its gas-oline-powered vehicles, and because Brazil has a man-datory minimum of 25 percent ethanol in gasolineblends.
Russia and Kazakhstan are the other prominent sourcesof growth in non-OPEC liquids production in theIEO2009 reference case. Both are located in non-OECDEurope and Eurasia, a region prone to territorial dis-putes, transportation blockages, contractual changes,and political intervention. Russia’s production isexpected to decline in the near term because of tax poli-cies that have caused companies to operate at a netfinancial loss—a large disincentive for investment inresource development. After declining to less than 9.2million barrels in 2011, Russia’s liquids productionbegins a slow increase to 9.5 million barrels per day in2015, as cautious investors, who are continuously deal-ing with adjustments in taxation levels, respond to anexpected stabilization of taxes and a rising world oilprice. As a result, production increases to 10.9 millionbarrels per day in 2020 and 11.9 million barrels per dayin 2030 in the reference case.
Russia’s production varies significantly across the oilprice cases, according to different assumptions about thelevels of economic access granted to both foreign anddomestic investors in the long term. Productionincreases from 2015 to 2030 are projected to be less than0.5 million barrels per day in the high price case and 4.7million barrels per day in the low price case. Althoughexploration in eastern Siberia is expected during the pro-jection period, exploration in the Arctic is not expected.
Mid-term growth in Kazakhstan’s liquids productionwill depend predominantly on the resources of theKashagan and Tengiz oil fields and the ability of inves-tors to transport production from those projects to theworld market. Although known and potential resourcesare sufficient to support production growth, a current
lack of easily accessible export routes could hinder theirdevelopment [6]. Currently, exports are limited to fiveroutes. The two primary transportation modes are bypipeline (operated by the Caspian Pipeline Consortium)and by rail, which together allow for a total of 0.8 millionbarrels per day to be shipped to Russia. In addition, apipeline from Kazakhstan to China currently has acapacity of 0.2 million barrels per day, and barge ship-ments to Azerbaijan and to Iran provide a combinedexport capacity of approximately 0.1 million barrels perday. Over the next few years, pipeline capacity to Russiaand China and the capacity of barge shipments to Iranare expected roughly to double.
Because of Kazakhstan’s geographical position, itsexport potential depends not only on resource availabil-ity and extractability but also on the construction ofexport routes—a task that will require regional coopera-tion. Although transportation of extracted resources is asignificant concern that could possibly limit increases inproduction levels, it is not the only potential problem.Kazakhstan has previously demonstrated a lack ofregard for contract sanctity and has forced renegotiationof investment returns. The high oil price case assumesthat Kazakhstan will again change the terms of projectreturns and effectively discourage high levels of addi-tional foreign investment. Thus, the country’s liquidsproduction in 2030 ranges from 2.9 million barrels perday in the high price case to 3.9 million barrels per day inthe low price case.
OPEC Production
Total liquids production from OPEC member countriesincreases at an average annual rate of 1.0 percent, result-ing in the production of 43.8 million barrels of liquidsper day in 2030, of which 29.5 million barrels per dayoriginates in the Middle East (Figure 31). Throughoutthe projection, Saudi Arabia remains the largest liquidsproducer in OPEC, with production increasing from2006 levels by 1.3 million barrels per day, to 12.0 millionbarrels per day in 2030 in the reference case. The increasein total production equates to an average annual growthrate of only 0.5 percent, based on the assumption thatSaudi Arabia will continue with currently announcedplans (albeit on delayed project timelines) and will seekto maintain spare production capacity above 2.0 millionbarrels per day.
OPEC decisions regarding investment in additional pro-duction capacity are the primary difference between thethree IEO2009 oil price cases. The low price caseassumes that OPEC countries will increase investmenteither through their own national oil companies or byallowing greater economic access to foreign investors,depending on the country. OPEC is assumed to expandproduction capacity in an attempt to maximize govern-ment revenue through production levels rather than byprice controls. In this case, production levels increase by
28 Energy Information Administration / International Energy Outlook 2009

22.8 million barrels per day, to 57.4 million barrels perday in 2030, or approximately 48 percent of total worldliquids production in the low price case.
In the high oil price case, the cartel nature of OPEC isassumed to strengthen over time. In this case, OPECmember countries contribute to the maintenance ofrecord high prices by further restricting their productiontargets each year. As a result, production levels declineby 6.4 million barrels per day, to 28.2 million barrels perday in 2030, or 31 percent of total world liquidsproduction.
Iraq is projected to increase its liquids production by anaverage of 3.9 percent per year in the reference case, forthe highest annual growth rate in total liquids produc-tion among all producers. The projection is based on anassumption that the conflict in Iraq will be resolved inthe long term, making resource availability the mostimportant factor in its ability to increase production.Continued infrastructure disruptions and legislativeuncertainty are expected to limit production growth inthe mid-term to 2.8 percent per year, adding 0.4 millionbarrels per day between 2010 and 2015. In the longerterm, if the country’s liquids production capability isstabilized as projected in the reference case, investmentin oil production could increase by as much as 8.5 per-cent annually from 2016 to 2020 before settling to a moremodest 1.8 percent annually from 2020 to 2030. The factthat Iraq has the resources necessary to support suchgrowth in the long run, even though production waslimited to 2.0 million barrels per day in 2006, shows theimportance of political developments in shaping thefuture of Iraq’s oil sector.
Qatar is projected to have the second-highest averageannual growth in total liquids production from 2006 to
2030, at 3.3 percent, with total volumes increasing from1.1 million barrels per day in 2006 to 2.5 million barrelsper day in 2030. Only one-half of the increase is expectedto come from production of crude oil and lease conden-sate, with NGPL production contributing 0.5 millionbarrels per day and GTL projects another 0.2 million bar-rels per day. Despite the current negative outlook formany previously announced GTL projects around theworld, a return to, and persistence of, historically highoil prices in the reference case is expected to facilitate thedelayed start of Qatar’s Pearl facility (0.1 million barrelsper day) and expansion of the Oryx facility (addinganother 0.1 million barrels per day).
Angola, despite receiving a production target of 1.9 mil-lion barrels per day from OPEC in December 2007, isprojected to have the third-largest average annualincrease in total liquids production from 2006 to 2030, at2.7 percent, almost entirely attributable to increasingproduction of crude oil and condensate from offshoreprojects [7]. Production targets established by OPEC arenot expected to impede the development of projects inAngola, where total liquids production increases to 2.7million barrels per day in 2030 in the reference case.Essentially the same assumptions apply to Nigeria,where a higher level of known resources enables pro-duction to grow by an average of 1.4 percent per year, to3.4 million barrels per day in 2030. For both Angola andNigeria, the projections for total liquids production in2030 vary by approximately 2.0 million barrels per daybetween the low price and high oil price cases.
Total liquids production in Iran is expected to berestricted in the mid-term by political factors, which arenot limited to international relations but encompass avariety of factors, including the effectiveness of thenational oil company’s operations and the ability of thegovernment and foreign investors to agree on contractterms. In the reference case, Iran’s oil productiondeclines through 2020 because of both financial andpolitical constraints on the development of new oil andnatural gas prospects. In addition, it is assumed thatIran’s domestic use of natural gas for electricity genera-tion and for heating in residential and commercial build-ings will limit the amount available for improving oilrecovery through natural gas reinjection. In the longterm, however, liquids production in Iran is projected toreturn to 2006 levels by 2030 in the reference case. In thealternative oil price cases, production in 2030 varies by3.0 million barrels per day, from 2.6 million barrels perday in the high price case to 5.6 million barrels per day inthe low price case.
Recent history suggests that Venezuela’s national gov-ernment reacts to high oil prices by tightening invest-ment terms for foreign direct investment and limitingaccess to its reserves. As a result, in the reference case,with prices rebounding after 2012 and remaining at
Energy Information Administration / International Energy Outlook 2009 29
Middle East
West Africa
North Africa
South America
0 5 10 15 20 25 30 35
Million Barrels per Day
2006
2030
Figure 31. OPEC Conventional Liquids Productionby Region, 2006 and 2030
Sources: 2006: Energy Information Administration (EIA),Office of Energy Markets and End Use. 2030: Energy Informa-tion Administration, Generate World Oil Balance Model (2009).

historically high levels through 2030, further mandatedchanges in contractual terms along with threats ofenergy sector nationalization are likely to hinder pro-duction potential in the near term and discourageinvestment in and development of additional projects inthe long term. In the reference case, Venezuela’s produc-tion growth is projected to come mainly fromextra-heavy oil production in the Orinoco belt and islimited to about 0.6 million barrels per day from 2006 to2030.
Unconventional Production
Unconventional liquids play an increasingly importantrole in meeting demand for liquid fuels over the courseof the IEO2009 projections. In the reference case, 12.6percent of world liquids supply in 2030 comes fromunconventional sources, including 1.5 million barrelsper day from OPEC and 11.9 million from non-OPECsources. Although the volume and composition ofunconventional production vary between the IEO2009oil price cases (from 17.8 million barrels per day in thehigh price case to 12.4 million barrels per day in the lowprice case), the geographic origin of each type of uncon-ventional liquid does not vary by much, because theirproduction usually is limited to countries where projectsalready have been announced or are under way.
OPEC’s unconventional production consists predomi-nantly of extra-heavy oil from Venezuela’s Orinoco beltand GTL production from Qatar. In the reference case,Venezuela’s extra-heavy oil production increases from0.6 million barrels per day in 2006 to 1.2 million barrelsper day in 2030, and Qatar’s GTL production increasesfrom a negligible amount in 2006 to 0.2 million barrelsper day in 2030. Although resources to support thoseproduction levels abound in the two countries, largeinvestments will be needed to bring them to market, andthe timing of such investment is uncertain.
Outside OPEC, unconventional liquids productioncomes from a diverse group of countries and resourcetypes. As a whole, non-OPEC unconventional liquidsproduction is projected to increase by 9.6 million barrelsper day from 2006 to 2030, with 65 percent coming fromOECD countries. The countries that make the largestcontributions to the increase in non-OPEC production ofunconventional liquids from 2006 to 2030 are Canada(an increase of 3.1 million barrels per day), the UnitedStates (2.2 million barrels per day), China (1.0 millionbarrels per day), and Brazil (0.7 million barrels per day).
Canada’s production of bitumen from oil sands makesup more than 35 percent of total non-OPEC unconven-tional production in 2030 in the reference, low oil price,and high oil price cases, ranging from 3.7 million barrelsper day in the low price case to 6.5 million barrels perday in the high price case. The differences in productionvolumes across the price cases is determined mostly by
limitations on economic access to both conventional andunconventional resources and the actions taken by indi-vidual consuming countries to lower dependence onforeign energy sources. Although price levels in the highand low price cases are each approximately 50 percentdifferent from the reference case, the distribution of pro-jections of unconventional liquids production does notnecessarily vary by a proportionate degree. With worldoil prices in the low price case still high enough to sup-port Canada’s bitumen production, 2030 production lev-els are only 0.5 million barrels per day lower in the lowprice case and 2.3 million barrels per day higher in thehigh price case than projected in the reference case.
The world’s total production of biofuels increases by 5.0million barrels per day from 2006 to 2030 in the referencecase, to 5.9 million barrels per day, for an average annualgrowth rate of 8.6 percent. The countries expected toprovide the largest increases in biofuels productionfrom 2006 to 2030 are the United States (1.5 million bar-rels per day) and Brazil (0.74 million barrels per day). Inaddition, production increases of 440 thousand barrelsper day in China and 457 thousand barrels per day inSouth America (excluding Brazil) also are projected inthe reference case. As is true for most renewable energysources, government policies are the most important fac-tor influencing biofuel production. In order to achievenational goals of reducing greenhouse gas emissionsand bolstering energy security, many countries havemandated targets for biofuel use and provided tax cred-its to biofuel producers that are designed to be phasedout over time as the cost of biofuel production falls andoil prices rise.
Biofuels also become more economically competitivewith conventional oil products in the high and low oilprice cases, depending on the oil price assumed. In thelow price case, only the least expensive and mostcost-effective feedstocks and production technologiesare competitive. In the high price case, prototype pro-duction processes are used more widely. Thus, worldbiofuels production in 2030 totals 4.8 million barrels perday in the low price case and 7.2 million barrels in thehigh price case. The growth of biofuel production slowsin all the cases in the near term as current-generationcrops reach their economic potential but picks up againaround 2012 with the advent of new technologies usingcellulosic feedstocks.
China is the largest CTL producer in all the oil pricecases, with 2030 production levels ranging from 0.1 mil-lion barrels per day (48 percent of the world total) in thelow price case to 1.2 million barrels per day (63 percentof the world total) in the high price case. Other majorproducers include the United States and South Africa,both producing about 0.3 million barrels per day in 2030in the reference and high price cases and less than 0.1million barrels per day in the low price case.
30 Energy Information Administration / International Energy Outlook 2009

GTL makes the smallest contribution to total unconven-tional liquids production in all the IEO2009 cases. In thereference and low oil price cases, GTL production is lim-ited primarily to Qatar, although South Africa and Nige-ria also produce small volumes in the reference case. Inthe high oil price case, the United States rapidly becomesthe world’s largest producer of GTL, accounting for 0.4million barrels per day to the world total of 0.7 millionbarrels per day in 2030.
Tables G1-G9 in Appendix G show the ranges of produc-tion potential for both OPEC and non-OPEC producersof unconventional liquids. As discussed in detail above,geopolitical issues in a number of the OPEC countries,including Iraq, Iran, Venezuela, and Nigeria, make it dif-ficult to estimate future production levels. As a result,there is a high level of uncertainty associated with thereference case assumptions and projections for OPECproduction through 2030.
Oil Reserves and ResourcesAs of January 1, 2009, proved world oil reserves, asreported by the Oil & Gas Journal, were estimated at1,342 billion barrels—10 billion barrels (about 1 percent)higher than the estimate for 2008 [8]. According to theOil & Gas Journal, 56 percent of the world’s proved oilreserves are in the Middle East (Figure 32). Just under 80percent of the world’s proved reserves are concentratedin eight countries, of which only Canada (with oil sandsincluded) and Russia are not OPEC members (Table 4).
Proved reserves of crude oil are the estimated quantitiesthat geological and engineering data indicate can berecovered in future years from known reservoirs,assuming existing technology and current economic and
operating conditions. Companies whose stocks are pub-licly traded on U.S. stock markets are required by theU.S. Securities and Exchange Commission (SEC) toreport their holdings of domestic and internationalproved reserves, following specific guidelines. In 2008,the SEC revised some of its rules for reporting reserves(see box on page 32). Country-level estimates of provedreserves are developed from the data reported to theSEC, from foreign government reports, and from inter-national geologic assessments. The estimates are notalways updated annually.
Whereas proved reserves include only those estimatedquantities of crude oil from known reservoirs, they arejust a subset of the entire potential oil resource base.Resource base estimates include estimated quantities ofboth discovered and undiscovered liquids that have thepotential to be classified as reserves at some time in thefuture. The resource base may include oil that currentlyis not technically recoverable but could become recover-able in the future as technologies advance.
Readers may notice that, in some cases in the IEO2009projections, country-level volumes for cumulative pro-duction through 2030 exceed the estimates of proved
Energy Information Administration / International Energy Outlook 2009 31
Table 4. World Oil Reserves by Country as ofJanuary 1, 2009(Billion Barrels)
Country Oil ReservesSaudi Arabia . . . . . . . . . . . 266.7Canadaa. . . . . . . . . . . . . . . 178.1Iran. . . . . . . . . . . . . . . . . . . 136.2Iraq. . . . . . . . . . . . . . . . . . . 115.0Kuwait . . . . . . . . . . . . . . . . 104.0Venezuela . . . . . . . . . . . . . 99.4United Arab Emirates. . . . . 97.8Russia . . . . . . . . . . . . . . . . 60.0Libya . . . . . . . . . . . . . . . . . 43.7Nigeria . . . . . . . . . . . . . . . . 36.2Kazakhstan . . . . . . . . . . . . 30.0United States . . . . . . . . . . . 21.3China . . . . . . . . . . . . . . . . . 16.0Qatar . . . . . . . . . . . . . . . . . 15.2Brazil . . . . . . . . . . . . . . . . . 12.6Algeria . . . . . . . . . . . . . . . . 12.2Mexico . . . . . . . . . . . . . . . . 10.5Angola . . . . . . . . . . . . . . . . 9.0Azerbaijan . . . . . . . . . . . . . 7.0Norway. . . . . . . . . . . . . . . . 6.7Rest of World . . . . . . . . . . . 64.6
World Total . . . . . . . . . . . . 1,342.2aIncludes 5.4 billion barrels of conventional crude oil and
condensate.Source: “Worldwide Look at Reserves and Production,” Oil &
Gas Journal, Vol. 106, No. 48 (December 22, 2008), pp. 23-24.
746
210
123
117
99
34
14
Middle East
North America
Central & South America
Africa
Eurasia
Asia
Europe
0 200 400 600 800
Billion Barrels
World Total:1,342 Billion Barrels
Figure 32. World Proved Oil Reservesby Geographic Region as ofJanuary 1, 2009
Source: “Worldwide Look at Reserves and Production,” Oil &Gas Journal, Vol. 106, No. 48 (December 22, 2008), pp. 23-24.

reserves. This does not imply that resources and thephysical limits of production have not been consideredin the development of the projections or that theyassume rapid declines in production immediately afterthe end of the projection period as reserves are depleted.EIA carefully considers resource availability in alllong-term country-level projections, the aggregation ofwhich gives the total world production projection; how-ever, proved reserves are not an appropriate measurefor judging total resource availability in the long run.
In order to construct realistic and plausible projectionsfor liquids production, and especially for petroleum liq-uids production, underlying analysis must both con-sider production beyond the intended end of theprojection period and base production projections onthe physical realities and limitations of production. Theimportance of approaching an assessment of liquidsproduction in this way is illustrated by the recent historyof U.S. reserve estimates. Whereas the United Statesreported 22.5 billion barrels of proved reserves in 1998,proved reserves of 21.3 billion barrels were reported in2008—a decrease of only 1.2 billion barrels despite thecumulative 22.2 billion barrels of liquids supplied fromU.S. reserves between 1998 and 2008.
Proved reserves cannot provide an accurate assessmentof the physical limits on future production but rather areintended to provide insight as to company- or coun-try-level development plans in the very near term. Infact, because of the particularly rigid requirements forthe classification of resources as proved reserves, partic-ularly by the U.S. SEC,14 even the cumulative produc-tion levels from individual development projects mayexceed the initial estimates of proved reserves.
EIA attempts to address the lack of applicability ofproved reserves estimates to long-term production pro-jections by developing a production methodology basedon the true physical limits of production, initially-in-place (IIP) volumes and technologically limited recoveryfactors (RF). By basing long-term production assess-ments on resources rather than reserves, EIA is able topresent projections that are physically achievable andcan be supported beyond the 2030 projection horizon.The realization of such production levels depends onfuture growth in world demand, taking into consider-ation such above-ground limitations on production asprofitability and specific national regulations, amongothers.
References
32 Energy Information Administration / International Energy Outlook 2009
Recent Changes in SEC Regulations
In December 2008, the U.S. Securities and ExchangeCommission (SEC) approved a new set of regulationsto govern company reporting of oil and natural gasreserves and production. The new regulations areexpected to become effective as of January 1, 2010.They are intended to bring company reporting to theSEC in line with current industry realities by expand-ing: the range of technologies recognized for provingreserves, to include seismic and other “reliable” mod-ern technologies; the types of production reported, toinclude unconventional liquids, such as bitumen andshale oil; and the levels of certainty about reserve esti-mates, to include “probable” and “possible” as well as“proven.”
In addition, the new regulations require companies touse average of start-of-month prices for each month ofthe year in calculating year-end reserves, rather thanthe previous practice of using price only as of Decem-ber 31—which did not account for volatility in oil andnatural gas prices or potential differences between theyearly average price and the price on a single day(December 31). The new pricing methodology isimportant for reserve reporting, because reserves, bydefinition, must be economical to produce. The previ-ous practice of using one day’s price to estimatecompany reserves had the undesirable effect of trans-forming the volatility of oil and natural gas prices intovolatility of reserve estimates.
1. “Oil Price ‘May Hit $200 a Barrel,’” BBC News (May7, 2008), web site http://news.bbc.co.uk/2/hi/business/7387203.stm.
2. Energy Information Administration, “Declines inU.S. Petroleum Consumption Expected To Con-tinue,” This Week in Petroleum (Washington, DC,August 13, 2008), web site http://tonto.eia.doe.gov/oog/info/twip/twiparch/080813/twipprint.html.
3. Energy Information Administration, Short-TermEnergy Outlook (Washington, DC, August 2008),web site www.eia.doe.gov/pub/forecasting/steo/oldsteos/aug08.pdf.
4. M. Georgy and P. Mackey, “OPEC Agrees SharpOutput Cut, Oil Slide Goes On,” Reuters News Ser-vice (October 24, 2008), web site www.reuters.com/article/newsOne/idUSTRE49L50I20081024.
14 The U.S. SEC guidelines are seen as particularly rigid because of the limited extraction technologies they recognize and because theybase the economic viability of reserves on oil prices for the last day of trading in a year rather than an annual average. Under current rules, acompany can generally meet the “reasonable certainty” standard necessary to establish proved reserves only by using actual production orflow tests. In June 2008, the SEC formally proposed changes to the guidelines that would not only expand the extraction technologies recog-nized and the price used to determine economic viability but also expand the resources eligible to be classified as oil reserves by includingoil sands and other unconventional oil deposits.

Energy Information Administration / International Energy Outlook 2009 33
5. Energy Information Administration, Short-TermEnergy Outlook (Washington, DC, April 2009),Table 9a, web site www.eia.doe.gov/pub/forecasting/steo/oldsteos/apr08.pdf.
6. Energy Information Administration, Country Anal-ysis Briefs, “Kazakhstan” (Washington, DC, Febru-ary 2008), web site www.eia.doe.gov/emeu/cabs/Kazakhstan/Background.html.
7. Energy Information Administration, Country Anal-ysis Briefs, “Angola” (Washington, DC, March2008), web site www.eia.doe.gov/emeu/cabs/Angola/Background.html.
8. “Worldwide Look at Reserves and Production,” Oil& Gas Journal, Vol. 106, No. 48 (December 22, 2008),pp. 23-24, web site www.ogj.com (subscriptionsite).


Chapter 3
Natural GasIn the IEO2009 reference case, natural gas consumption in the non-OECD countries grows
more than twice as fast as in the OECD countries. Production increases in the non-OECD
region account for more than 80 percent of the growth in world production from 2006 to 2030.
Worldwide, total natural gas consumption increases byan average of 1.6 percent per year in the IEO2009 refer-ence case, from 104 trillion cubic feet in 2006 to 153 tril-lion cubic feet in 2030 (Figure 33). With world oil pricesassumed to return to previous high levels after 2012 andremain high through the end of the projection, consum-ers opt for the comparatively less expensive natural gasfor their energy needs whenever possible. In addition,because natural gas produces less carbon dioxide whenit is burned than does either coal or petroleum, govern-ments implementing national or regional plans toreduce greenhouse gas emissions may encourage its useto displace other fossil fuels.
Natural gas remains a key energy source for industrialsector uses and electricity generation throughout theprojection. The industrial sector currently consumesmore natural gas than any other end-use sector and isexpected to continue that trend through 2030, when 40percent of world natural gas consumption is projected tobe used for industrial purposes. In particular, new petro-chemical plants are expected to rely increasingly on nat-ural gas as a feedstock—particularly in the Middle East,where major oil producers, working to maximize reve-nues from oil exports, turn to natural gas for domesticuses.
In the electric power sector, natural gas is an attractivechoice for new generating plants because of its relativefuel efficiency and low carbon dioxide intensity. Elec-tricity generation accounts for 35 percent of the world’stotal natural gas consumption in 2030, up from 32 per-cent in 2006.
In 2006, OECD member countries consumed 52 trillioncubic feet of natural gas and non-OECD countries con-sumed 53 trillion cubic feet, surpassing OECD gas con-sumption for the first time since the fall of the SovietUnion in 1991. In the IEO2009 reference case, natural gasconsumption in the non-OECD countries grows morethan twice as fast as consumption in the OECD coun-tries, with 2.2 percent average annual growth from 2006to 2030 for non-OECD countries, compared with anaverage of 0.9 percent for the OECD countries. Thenon-OECD countries account for 74 percent of the totalworld increment in natural gas consumption over theprojection period, and the non-OECD share of totalworld natural gas consumption increases from 50 per-cent in 2006 to 58 percent in 2030.
The OECD countries accounted for 38 percent of theworld’s total natural gas production and 50 percent ofnatural gas consumption in 2006, making them depend-ent on imports from non-OECD sources for 25 percent oftheir total consumption. In 2030, the OECD countriesaccount for 31 percent of production and 42 percent ofconsumption, with their dependence on non-OECD nat-ural gas only slightly higher than in 2006, at 27 percent.In the non-OECD regions, net exports grow more slowlythan total production. In 2030, 17 percent of non-OECDproduction is consumed in OECD countries, down from19 percent in 2006.
World Natural Gas DemandOECD Countries
In the IEO2009 reference case, natural gas consumptionin North America increases by an average of 0.8 percentper year from 2006 to 2030 (Figure 34). In the UnitedStates—the world’s largest natural gas consumer—con-sumption in most of the end-use sectors increases slowlythrough 2030. Natural gas consumption in the U.S. elec-tric power sector, however, increases rapidly from 2006through 2025 in response to generators’ concerns aboutthe potential for new legislation limiting greenhouse gas
Energy Information Administration / International Energy Outlook 2009 35
1980 1995 2006 2015 20300
50
100
150
200Trillion Cubic Feet
History Projections
OECD
Total
Non-OECD
Figure 33. World Natural Gas Consumption,1980-2030
Sources: History: Energy Information Administration (EIA),International Energy Annual 2006 (June-December 2008),web site www.eia.doe.gov/iea. Projections: EIA, WorldEnergy Projections Plus (2009).

emissions. Those concerns are addressed in the refer-emissions. Those concerns are addressed in the refer-ence case by the addition of a risk premium on newcarbon-intensive coal-fired generating capacity, whichstimulates investment in less carbon-intensive natu-ral-gas-fired capacity. In addition, the capital costs fornew natural gas power plants are lower than those fornuclear and renewable alternatives.
After 2025, the growth in U.S. natural gas consumptionfor electricity generation is slowed by rising natural gasprices, growing generation from renewables, and theintroduction of clean coal-fired capacity. As a result, nat-ural-gas-fired electricity generation in 2030 is 94 percentof the 2025 peak level. With the other end-use sectorsshowing slow but steady growth in consumption, totalU.S. demand for natural gas in 2030 is 2.7 trillion cubicfeet above the 2006 total of 21.7 trillion cubic feet.15
Canada’s total natural gas consumption increasessteadily, by 1.5 percent per year, in the reference case,from 3.3 trillion cubic feet in 2006 to 4.7 trillion cubic feetin 2030. The strongest growth is in the industrial sector,averaging 1.8 percent per year, and in the electric powersector, averaging 1.3 percent per year. The rapid growth
projected for Canada’s industrial natural gas consump-tion is based in large part on the expectation that pur-chased natural gas will be consumed in increasingquantities for mining of the country’s oil sands deposits.In 2006, an estimated 12 percent of Canada’s total natu-ral gas consumption was used for oil sands production;in 2030, that share could reach 22 percent of the coun-try’s total gas use.16
In Mexico, more than 90 percent of natural gas consump-tion occurs in the industrial and electricity generationsectors combined. Although growth is projected in allsectors, the share of total consumption accounted for bythe country’s industrial and electric power sectors con-tinues to increase through 2030. The strongest growth isprojected for the electricity generation sector, at an aver-age annual rate of 4.1 percent, with consumptionincreasing almost threefold from 2006 to 2030, while nat-ural gas use in the industrial sector grows by 1.8 percentper year. In 2006, the amount of natural gas consumedfor electricity generation in Mexico was about one-halfthe amount consumed in the industrial sector; in 2030, itis expected to be nearly equal to consumption in theindustrial sector.
Natural gas consumption in OECD Europe grows by amodest 1.0 percent per year on average, from 19.2 tril-lion cubic feet in 2006 to 21.5 trillion cubic feet in 2015and 24.1 trillion cubic feet in 2030—mostly as a result ofincreasing use for electricity generation. Many nationsin OECD Europe have made commitments to reducecarbon dioxide emissions, bolstering the incentive forgovernments to encourage natural gas use in place ofother fossil fuels. In addition, given the long lead timesand high costs associated with constructing new nuclearcapacity, as well as the expected retirement of someexisting nuclear facilities, natural gas and renewableenergy sources become the fuels of choice for new gener-ating capacity. In the IEO2009 reference case, natural gasis the second fastest-growing source of energy for elec-tricity generation in the region, at 2.0 percent per year, ascompared with renewables at 3.2 percent per year . Nat-ural gas use in the region’s electric power sectorincreases from 5.8 trillion cubic feet in 2006 to 7.7 trillioncubic feet in 2015 and 9.3 trillion cubic feet in 2030.
Natural gas consumption in OECD Asia grows on aver-age by 1.0 percent per year from 2006 to 2030. Japan,
36 Energy Information Administration / International Energy Outlook 2009
2006United States
2030 2006Canada
2030 2006Mexico
20300
5
10
15
20
25
30Trillion Cubic Feet
Industrial
Electric Power
Other
Figure 34. Natural Gas Consumption inNorth America by Country and Sector,2006 and 2030
Sources: 2006: Energy Information Administration (EIA),International Energy Annual 2006 (June-December 2008),web site www.eia.doe.gov/iea. Projections: EIA, WorldEnergy Projections Plus (2009).
15 Cumulative U.S. natural gas consumption from 2006 to 2030 is reduced by 6 percent in the updated AEO2009 reference case (April 2009)relative to the published AEO2009 reference case (March 2009). About 70 percent of the reduction is attributable to reduced use of natural gasfor electricity generation, largely as a result of incentives for increased use of renewable fuels in ARRA2009. The difference between thecases narrows somewhat toward the end of the projection period, as natural gas displaces some of the later increase in coal use in the pub-lished AEO2009 reference case, due to somewhat more favorable prices. In the updated reference case, total U.S. natural gas consumption in-creases by 1.8 trillion cubic feet, to 23.5 trillion cubic feet in 2030.
16 Total projected oil sands production in the IEO2009 reference case in 2030 is 4.2 million barrels per day. The natural gas efficiency of oilsands production is assumed to improve to around 0.66 million cubic feet of purchased natural gas consumed per barrel of oil sands pro-duced, and the amount of purchased natural gas used for oil sands production is just over 1 trillion cubic feet in 2030. There is considerableroom for variation, however, because several factors can influence future rates of natural gas use in oil sands production, including the qual-ity of reservoirs, degree of upgrading, and development and penetration of technologies that would replace natural gas with coke or bitu-men in the production process.
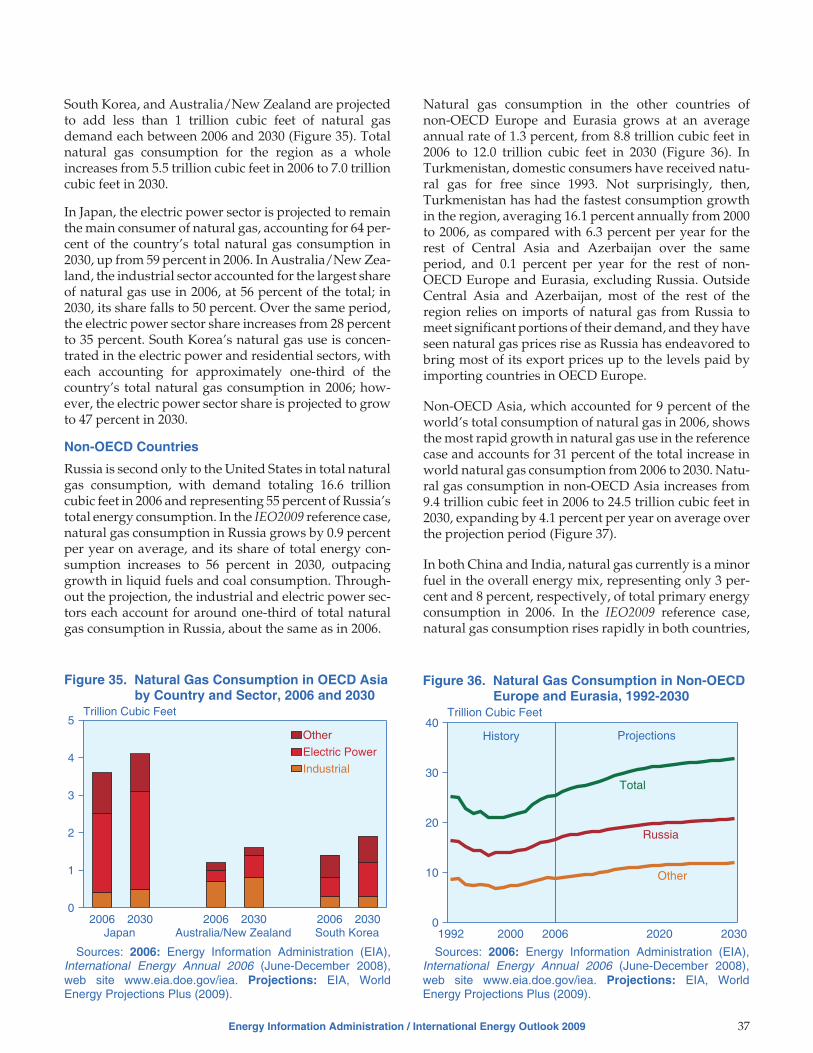
South Korea, and Australia/New Zealand are projectedto add less than 1 trillion cubic feet of natural gasdemand each between 2006 and 2030 (Figure 35). Totalnatural gas consumption for the region as a wholeincreases from 5.5 trillion cubic feet in 2006 to 7.0 trillioncubic feet in 2030.
In Japan, the electric power sector is projected to remainthe main consumer of natural gas, accounting for 64 per-cent of the country’s total natural gas consumption in2030, up from 59 percent in 2006. In Australia/New Zea-land, the industrial sector accounted for the largest shareof natural gas use in 2006, at 56 percent of the total; in2030, its share falls to 50 percent. Over the same period,the electric power sector share increases from 28 percentto 35 percent. South Korea’s natural gas use is concen-trated in the electric power and residential sectors, witheach accounting for approximately one-third of thecountry’s total natural gas consumption in 2006; how-ever, the electric power sector share is projected to growto 47 percent in 2030.
Non-OECD Countries
Russia is second only to the United States in total naturalgas consumption, with demand totaling 16.6 trillioncubic feet in 2006 and representing 55 percent of Russia’stotal energy consumption. In the IEO2009 reference case,natural gas consumption in Russia grows by 0.9 percentper year on average, and its share of total energy con-sumption increases to 56 percent in 2030, outpacinggrowth in liquid fuels and coal consumption. Through-out the projection, the industrial and electric power sec-tors each account for around one-third of total naturalgas consumption in Russia, about the same as in 2006.
Natural gas consumption in the other countries ofnon-OECD Europe and Eurasia grows at an averageannual rate of 1.3 percent, from 8.8 trillion cubic feet in2006 to 12.0 trillion cubic feet in 2030 (Figure 36). InTurkmenistan, domestic consumers have received natu-ral gas for free since 1993. Not surprisingly, then,Turkmenistan has had the fastest consumption growthin the region, averaging 16.1 percent annually from 2000to 2006, as compared with 6.3 percent per year for therest of Central Asia and Azerbaijan over the sameperiod, and 0.1 percent per year for the rest of non-OECD Europe and Eurasia, excluding Russia. OutsideCentral Asia and Azerbaijan, most of the rest of theregion relies on imports of natural gas from Russia tomeet significant portions of their demand, and they haveseen natural gas prices rise as Russia has endeavored tobring most of its export prices up to the levels paid byimporting countries in OECD Europe.
Non-OECD Asia, which accounted for 9 percent of theworld’s total consumption of natural gas in 2006, showsthe most rapid growth in natural gas use in the referencecase and accounts for 31 percent of the total increase inworld natural gas consumption from 2006 to 2030. Natu-ral gas consumption in non-OECD Asia increases from9.4 trillion cubic feet in 2006 to 24.5 trillion cubic feet in2030, expanding by 4.1 percent per year on average overthe projection period (Figure 37).
In both China and India, natural gas currently is a minorfuel in the overall energy mix, representing only 3 per-cent and 8 percent, respectively, of total primary energyconsumption in 2006. In the IEO2009 reference case,natural gas consumption rises rapidly in both countries,
Energy Information Administration / International Energy Outlook 2009 37
2006Japan
2030 2006Australia/New Zealand
2030 2006South Korea
20300
1
2
3
4
5Trillion Cubic Feet
Industrial
Electric Power
Other
Figure 35. Natural Gas Consumption in OECD Asiaby Country and Sector, 2006 and 2030
Sources: 2006: Energy Information Administration (EIA),International Energy Annual 2006 (June-December 2008),web site www.eia.doe.gov/iea. Projections: EIA, WorldEnergy Projections Plus (2009).
1992 2000 2006 2020 20300
10
20
30
40Trillion Cubic Feet
History Projections
Other
Total
Russia
Figure 36. Natural Gas Consumption in Non-OECDEurope and Eurasia, 1992-2030
Sources: 2006: Energy Information Administration (EIA),International Energy Annual 2006 (June-December 2008),web site www.eia.doe.gov/iea. Projections: EIA, WorldEnergy Projections Plus (2009).

growing by 5.2 percent per year in China and 4.2 percentper year in India, on average from 2006 to 2030.
In the rest of the non-OECD Asia countries, natural gasalready is a prominent fuel in the energy mix, represent-ing 23 percent of total primary energy consumption in2006. Their combined annual consumption of naturalgas increases more slowly than in either China or India,averaging 3.6-percent growth per year. With consump-tion starting from a much larger base, however, the restof non-OECD Asia adds more natural gas consumptionover the projection period than do China and India com-bined. Together, China and India are projected to con-sume 7.1 trillion cubic feet more natural gas in 2030 thanin 2006, as compared with an increase of 8.1 trillion cubicfeet for the rest of non-OECD Asia.
Natural gas consumption grows at average annual ratesof 2.0 percent in the Middle East and 3.2 percent inAfrica from 2006 to 2030. There is very little infrastruc-ture on the continent for intraregional trade of naturalgas, and Algeria, Nigeria, Egypt, and Libya—the majorAfrican producers—also are the major consumers. Thefour countries plus South Africa and Tunisia, accountedfor 94 percent of Africa’s natural gas consumption in2006. Intraregional infrastructure also is limited in theMiddle East, although both Dubai (in the United ArabEmirates) and Kuwait have plans to begin importingLNG to meet peak summer demands for natural gas [1].
In Central and South America, natural gas is the fast-est-growing energy source in the reference case, withdemand increasing on average by 2.4 percent per year,from 4.5 trillion cubic feet in 2006 to 8.1 trillion cubic feetin 2030. For Brazil, the region’s largest economy, naturalgas consumption more than doubles—from 0.7 trillion
cubic feet in 2006 to 1.8 trillion cubic feet in 2030. Severalcountries in the region are particularly intent on increas-ing the penetration of natural gas for power generation,in order to diversify electricity fuel mixes that currentlyare heavily reliant on hydropower (and thus vulnerableto drought) and reduce the use of more expensiveoil-fired generation often used to supplement electricitysupply.
Although pipeline infrastructure is in place to movenatural gas from Argentina to Brazil, Chile, and Uru-guay and from Bolivia to Argentina and Brazil, recentconcerns about the security of supply have spurreddevelopment of LNG regasification terminals in theimporting nations. Specifically, Argentina became theregion’s first LNG importer in May 2008; Chile has plansto add two LNG regasification plants by 2010; a singleterminal has been proposed for Uruguay; and Brazilplans to open three LNG terminals in the next severalyears [2].
World Natural Gas ProductionIn order to meet the demand growth projected in theIEO2009 reference case, the world’s natural gas produc-ers will need to increase supplies by 48 trillion cubic feetbetween 2006 and 2030. Much of the increase in supply isexpected to come from non-OECD countries, which inthe reference case account for 84 percent of the totalincrease in world natural gas production from 2006 to2030. Non-OECD natural gas production grows by anaverage 2.1 percent per year in the reference case, from65 trillion cubic feet in 2006 to 106 trillion cubic feet in2030 (Table 5), while OECD production grows by only0.8 percent per year, from 40 trillion cubic feet to 47 tril-lion cubic feet.
With more than 40 percent of the world’s proved naturalgas reserves, the Middle East accounts for the largestincrease in regional natural gas production from 2006 to2030 in the reference case and more than one-fifth of thetotal increment in world natural gas production. Cur-rently, there are four major natural gas producers in theMiddle East: Iran, Saudi Arabia, Qatar, and the UnitedArab Emirates, which together accounted for 83 percentof the natural gas produced in the Middle East in 2006.Each of the four countries has announced plans toexpand natural gas production in order to meet theexpected increase in regional demand and/or to supplymarkets outside the region.
In Saudi Arabia there has been a concerted effort toincrease natural gas production specifically for domesticconsumption. At present, Saudi Arabia produces 90 per-cent of its natural gas from associated oil and natural gasfields; however, there may be fluctuations in oil produc-tion when Saudi Arabia balances global supply anddemand, which also will affect the production of naturalgas.
38 Energy Information Administration / International Energy Outlook 2009
2006 2010 2015 2020 2025 20300
5
10
15
20
25
30Trillion Cubic Feet
China
India
Other
Figure 37. Natural Gas Consumption inNon-OECD Asia, 2006-2030
Sources: 2006: Energy Information Administration (EIA),International Energy Annual 2006 (June-December 2008),web site www.eia.doe.gov/iea. Projections: EIA, WorldEnergy Projections Plus (2009).

To reduce the dependence of its natural gas productionon oil production, Saudi Arabia has begun efforts toincrease production from nonassociated natural gasfields. To that end, in 2003 private investment for naturalgas exploration projects was invited at four sites in theRub al-Khali desert [3]. Although 27 exploration wellsare to be drilled at the sites by the end of 2009, resultshave not been encouraging thus far, and relatively lowfixed prices set by Saudi Arabia for the natural gas havemade the projects less attractive to foreign participants[4]. The Saudi national oil company, Saudi Aramco, onthe other hand, has made several nonassociated naturalgas finds near existing oil fields, some of which areexpected to begin producing in the near term, includingthe Karan natural gas project, scheduled to begin pro-ducing 1.8 billion cubic feet per day in 2012.
Iran has the world’s second-largest reserves of naturalgas, after Russia, and currently is the Middle East’s larg-est natural gas producer. Political barriers—includingU.S. sanctions and international concerns about thecountry’s nuclear power ambitions—have loweredinterest in foreign direct investment in the country’s nat-ural gas sector. The largest natural gas developmentproject in Iran is the offshore South Pars field, discov-ered in 1990, which is estimated to contain between 350and 490 trillion cubic feet of natural gas reserves [5].Located 62 miles offshore, South Pars has a 28-phasedevelopment plan spanning 20 years, with each phaseset to produce more than 1 billion cubic feet per day. Iranhas set a goal to raise marketed natural gas productionto between 9 and 10 trillion cubic feet per year by 2010,more than double its 2006 marketed production of
Energy Information Administration / International Energy Outlook 2009 39
Table 5. World Natural Gas Production by Region and Country, 2006-2030(Trillion Cubic Feet)
Region/Country 2006
Projections Average AnnualPercent Change,
2006-20302010 2015 2020 2025 2030
OECD North America . . . . . . . . . . . . . . . 26.6 27.7 27.9 29.0 31.1 31.9 0.8United Statesa . . . . . . . . . . . . . . . . . . . . . 18.3 20.1 20.5 21.5 23.3 23.6 1.1Canada . . . . . . . . . . . . . . . . . . . . . . . . . . 6.5 5.5 5.4 5.4 5.6 5.7 -0.6Mexico . . . . . . . . . . . . . . . . . . . . . . . . . . . 1.7 2.1 2.1 2.1 2.3 2.5 1.6
OECD Europe. . . . . . . . . . . . . . . . . . . . . . 10.7 10.9 11.0 10.9 10.7 10.4 -0.1OECD Asia . . . . . . . . . . . . . . . . . . . . . . . . 1.8 2.3 2.8 3.6 4.0 4.6 3.9Japan. . . . . . . . . . . . . . . . . . . . . . . . . . . . 0.2 0.2 0.2 0.2 0.2 0.2 0.0South Korea. . . . . . . . . . . . . . . . . . . . . . . 0.0 0.0 0.0 0.0 0.0 0.0 0.0Australia/New Zealand . . . . . . . . . . . . . . 1.7 2.1 2.6 3.4 3.8 4.4 4.2Total OECD. . . . . . . . . . . . . . . . . . . . . . 39.1 40.9 41.7 43.4 45.8 46.9 0.8
Non-OECD Europe and Eurasia . . . . . . . 30.0 31.8 35.0 36.8 38.2 40.3 1.2Russia . . . . . . . . . . . . . . . . . . . . . . . . . . . 23.2 24.3 26.7 28.0 29.2 31.3 1.3Other Non-OECD Europe and Eurasia . . 6.8 7.6 8.3 8.9 9.0 9.1 1.2
Non-OECD Asia . . . . . . . . . . . . . . . . . . . . 11.1 13.0 15.6 17.3 18.7 19.8 2.5China . . . . . . . . . . . . . . . . . . . . . . . . . . . . 2.1 2.5 3.4 3.8 4.2 4.3 3.1India. . . . . . . . . . . . . . . . . . . . . . . . . . . . . 1.1 1.6 2.0 2.3 2.4 2.4 3.3Other Non-OECD Asia . . . . . . . . . . . . . . 7.9 8.9 10.3 11.2 12.1 13.2 2.2
Middle East. . . . . . . . . . . . . . . . . . . . . . . . 12.0 14.8 17.8 19.9 22.0 22.6 2.7Africa . . . . . . . . . . . . . . . . . . . . . . . . . . . . 6.6 7.9 9.6 11.6 12.8 13.9 3.2Central and South America . . . . . . . . . . 5.1 6.2 7.0 7.8 8.6 9.1 2.5Brazil . . . . . . . . . . . . . . . . . . . . . . . . . . . . 0.3 0.6 1.0 1.2 1.5 1.6 6.6Other Central and South America . . . . . . 4.7 5.5 6.0 6.5 7.1 7.5 1.9Total Non-OECD . . . . . . . . . . . . . . . . . 64.6 73.6 85.0 93.4 100.3 105.8 2.1
Total World. . . . . . . . . . . . . . . . . . . . . . . . 103.8 114.5 126.7 136.8 146.1 152.7 1.6aIncludes supplemental production or forecast discrepancy. For details, see Energy Information Administration (EIA), Annual
Energy Outlook 2009, p. 135, Table A13, “Natural Gas Supply, Disposition, and Prices.”Note: Totals may not equal sum of components due to independent rounding.Sources: History: EIA, International Energy Annual 2006 (June-December 2008), web site www.eia.doe.gov/iea. Projections:
United States: EIA, Annual Energy Outlook 2009, DOE/EIA-0383(2009) (Washington, DC, June 2009), web site www.eia.doe.gov/oiaf/aeo. Others: EIA, World Energy Projections Plus (2009).

4.4 trillion cubic feet. That goal may be difficult toachieve, however, without attracting substantial foreigninvestment in the near term.
The world’s second-largest regional increase in naturalgas production is expected in non-OECD Europe andEurasia, which includes Russia. In the reference case,natural gas production in non-OECD Europe and Eur-asia increases from 30.0 trillion cubic feet in 2006 to 40.3trillion cubic feet in 2030. Russia remains the region’smost important natural gas producer, providing the sin-gle largest increment in production, from 23.2 trillioncubic feet in 2006 to 31.3 trillion cubic feet in 2030.
Russia’s Yamal Peninsula in northwestern Siberia hasample natural gas resources and should provide a majorincrease in Russian production over the long term. In2008, state-owned Gazprom began construction of atrunk pipeline to connect Bovanenkovo field, the largeston the Yamal peninsula, to existing pipeline infrastruc-ture. Also in 2008, Gazprom drilled the first productionwell in the Bovanenkovo field [6]. Gazprom intends toincrease production from the Yamal peninsula to 12.7trillion cubic feet by 2030, both to meet domesticdemand for natural gas and to double the size of itsexports from current levels.
Developing new sources of natural gas is a priority forGazprom, given that production at its three largest fields(Yamburg, Urengoy, and Medvezh’ye) is in decline [7].There is concern that the global economic recession mayreduce both domestic and export demand for naturalgas in the short run and dampen investment in Russia’snatural gas sector. In the IEO2009 reference case, how-ever, investment delays are not expected to hinder thegrowth of Russian supplies.
Two other major natural gas projects also are underwayin Russia: one to develop the resources around SakhalinIsland on the country’s east coast and another to developthe Shtokman field, off its western Arctic coast. TheSakhalin-1 project began supplying modest amounts ofnatural gas to domestic consumers in 2007. Productionvolumes from the first development phase are limited,however, until all the parties involved can agree on howthe natural gas should be exported. Production from thesecond development phase will be exported as LNG,beginning in the first half of 2009, with supplies from theSakhalin-2 LNG facility expected to reach its total capac-ity of 9.6 million metric tons in 2010 [8]. The Shtokmannatural gas and condensate field in the Barents Sea isofficially scheduled to begin producing 840 billion cubicfeet of natural gas in 2013 (shipped via pipeline), withadditional supplies for LNG anticipated beginning in2014 [9]. That schedule may, however, prove to beoverly ambitious.
Substantial growth in natural gas production also is pro-jected for Africa, increasing from 6.6 trillion cubic feet in
2006 to 9.6 trillion cubic feet in 2015 and 13.9 trillioncubic feet in 2030. Currently, more than 85 percent ofAfrica’s natural gas is produced in Algeria, Egypt, andNigeria, which together accounted for 81 percent ofAfrica’s proved natural gas reserves as of January 1,2009, with a combined total of 402 trillion cubic feet [10].
Nigeria has the most attractive geology for natural gasexploration and development and, in terms of reserves,the greatest potential to increase production. With aslightly larger quantity of proved reserves than Algeria,Nigeria produced only about one-third the amount ofnatural gas produced by Algeria in 20006. Security con-cerns and uncertainty over access terms are expected toinhibit resource development in Nigeria, however, andits contribution to the expected increase in Africa’s natu-ral gas production is more modest than its reserves andgeology would imply. The rest of the productionincrease is spread over a number of countries, includingAlgeria, Egypt, Libya and Angola.
In the IEO2009 reference case, non-OECD Asia’s naturalgas production increases by 8.8 trillion cubic feet from2006 to 2030, with 2.2 trillion cubic feet of the incrementcoming from China, 1.3 trillion cubic feet from India,and 5.3 trillion cubic feet from the rest of non-OECDAsia. The strongest growth in natural gas production inrecent years has come from China, with increases aver-aging 13.6 percent per year from 2000 to 2006. China ispoised to become the region’s largest natural gas pro-ducer, as production has declined in recent years inIndonesia and the increases in China’s production haveoutpaced those from the region’s other major producers,Malaysia, Pakistan, and India.
Natural gas production from the OECD nationsincreases by 7.8 trillion cubic feet from 2006 to 2030 inthe reference case. The largest regional increases are pro-jected for the United States, at 5.3 trillion cubic feet, andAustralia/New Zealand, at 2.8 trillion cubic feet. Theprojected production increases for the two regions areoffset in part by production declines in Canada andOECD Europe, where existing conventional natural gasfields are in decline.
From 2006 to 2030, total U.S. natural gas production peryear increases by more than 5 trillion cubic feet, even asonshore lower 48 conventional production (fromsmaller and deeper deposits) continues to taper off.Unconventional natural gas is the largest contributor tothe growth in U.S. production, as rising prices andimprovements in drilling technology provide the eco-nomic incentives necessary for exploitation of morecostly resources. Unconventional natural gas produc-tion increases from 47 percent of the U.S. total in 2006 to56 percent in 2030.
Natural gas in tight sand formations is the largest sourceof unconventional production, accounting for 30 percent
40 Energy Information Administration / International Energy Outlook 2009

of total U.S. production in 2030, and production fromshale formations is the fastest-growing source, with anassumed 267 trillion cubic feet of undiscovered techni-cally recoverable resources. Production of natural gasfrom shales increases from 1.1 trillion cubic feet in 2006to 4.2 trillion cubic feet, or 18 percent of total U.S. pro-duction, in 2030. The expected growth in natural gasproduction from shales is far from certain, however, andcontinued exploration is needed to provide additionalinformation on the resource potential.
Natural gas production in Australia/New Zealandgrows from 1.7 trillion cubic feet in 2006 to 4.4 trillioncubic feet in 2030 in the reference case, at an average rateof 4.2 percent per year—the strongest growth in naturalgas production among the OECD countries. In 2006,Australia’s production was far larger than New Zea-land’s, at 1.5 trillion cubic feet and 0.1 trillion cubic feet,respectively. Australia continues to dominate produc-tion in the region throughout the projection, given itslarge resource base and plans for expanding productionof natural gas both for domestic use and for export.
The Carnarvon Basin—located off the Northwest shelfin Western Australia—is one of the country’s mostimportant natural gas producing areas, holding an esti-mated 62 trillion cubic feet of probable reserves. In addi-tion, new development in the deepwater Timor Sea atBrowse Basin is expected to bring even more natural gasto market in the future [11]. There also has been consid-erable interest in developing Australia’s coalbed meth-ane resources, especially as a fuel for LNG production.Five projects to produce coalbed methane for conversionto LNG currently are planned or under development inAustralia, with LNG production from the first project(the 1.5 million metric ton Fisherman’s Landing projectin Queensland) scheduled to begin in late 2012 [12].
Natural Gas Import DependenceOECD Countries
OECD North America is largely a self-contained marketfor natural gas. Although North America imported 631billion cubic feet of natural gas from other regions in2006 through six LNG regasification terminals, includ-ing one in Mexico and five in the United States, thoseimports accounted for only 2 percent of its total naturalgas consumption. Three new regasification terminalsbecame operational during 2007 and 2008, including thefirst on North America’s Pacific Coast; and six morewere being commissioned or were under construction atthe beginning of 2009, including the first regasificationterminal in Canada.
With North America’s reliance on imports of natural gasprojected to grow somewhat in the short to mid-term(Figure 38), imports rise to 6 percent as a share of totalnatural gas consumption in the region before falling
back to 4 percent in 2030. An expected decline in U.S.demand for imports in the later years of the projection isthe result of an increase in domestic production fromunconventional sources and improvements in clean coaltechnology that allow for increased generation fromcoal-fired power plants, reducing demand for naturalgas in the power sector. Consequently, U.S. dependenceon natural gas imports declines from 17 percent in 2006to 3 percent in 2030, as Canada’s production and exportsdecline, and as domestic production from shale andother unconventional sources increases. Mexico, on theother hand, becomes more dependent on importsthrough most of the projection period, as productionand investment in its natural gas sector fail to keep upwith consumption growth. The shortfall in Mexico’sdomestic natural gas supply is expected to be balancedby pipeline imports from the United States and importsof LNG.
The dependence of OECD Europe on imported naturalgas continues to increase in the reference case, asdemand grows modestly and indigenous natural gasproduction declines. In 2006, 44 percent of OECDEurope’s total natural gas demand was met withimports from outside the region. Imports from twocountries, Russia and Algeria, accounted for more than30 percent of the region’s total consumption. In 2030, netimports make up 57 percent of total natural gas con-sumption. OECD Europe’s import dependence is anarea of concern, particularly because natural gas export-ers have signed several cooperation agreements (see boxon page 42), and parts of the region have experiencedsupply disruptions during three of the past four winters.
In January 2006, Russia’s Gazprom cut natural gas sup-plies to Ukraine. Natural gas prices, pipeline transit fees,
Energy Information Administration / International Energy Outlook 2009 41
2006 2010 2015 2020 2025 20300
20
40
60
80
100
Net Imports as Percent of Total Consumption
Japan
North America
Europe
South Korea
Figure 38. Imports as Share of OECD Natural GasConsumption by Market, 2006-2030
Sources: 2006: Energy Information Administration (EIA),International Energy Annual 2006 (June-December 2008),web site www.eia.doe.gov/iea. Projections: EIA, WorldEnergy Projections Plus (2009).

42 Energy Information Administration / International Energy Outlook 2009
Gas Exporting Countries Forum: What Is GECF and What Is Its Objective?
The Gas Exporting Countries Forum (GECF) wasestablished in 2001, with the objective of generating“tangible cooperation among gas producing andexporting countries.”a In May 2001, 10 countriesattended the first Ministerial Meeting of the GECF inTehran, Iran,band since then it has held ministerial-level meetings almost every year. The membership hasfluctuated from year to year, because the forum hashad no formal structure, no membership requirements,and no dues.c Topics discussed under the auspices ofthe GECF have included the structure of the organiza-tion, new regulatory policies in consuming countries,development of a natural gas supply and demandmodel, and various studies to be conducted for thebenefit of the membership.d
At the Sixth Ministerial Meeting of GECF, Russiaagreed to conduct a study of current and possiblefuture pricing regimes for natural gas, fueling fears inconsuming countries that the organization couldbecome a producers’ cartel similar to OPEC. Indeed,since its creation, concerns have been raised in the nat-ural gas importing countries that GECF could becomea “Gas OPEC” that would restrict natural gas produc-tion in order to increase prices; however, representa-tives of many of GECF’s most important members interms of their current involvement in the global naturalgas trade have stated publicly that they do not thinkthe GECF should be anything like OPEC, nor do theybelieve that OPEC-style controls are even possible inthe natural gas market. Iran and Venezuela, on theother hand, have repeatedly made comparisonsbetween the GECF and OPEC.e The importance of
statements from those two countries on the subject ofGECF’s role is not clear, however, in that neither coun-try is a major exporter of natural gas. In fact, Iran cur-rently imports almost as much natural gas as it exports(although it is a major holder of natural gas reserves).Venezuela exports no natural gas but does importsmall volumes from Colombia.
The most significant development for GECF in 2008was its adoption of a formal charter at its Seventh Min-isterial Meeting in Russia in December. Representa-tives from 17 countries attended the meeting.f TheForum agreed to establish permanent headquarters inDoha, Qatar, and adopted a charter formalizing itsgoals: “to foster mutual interests by favouring dia-logue between producers, consumers, government andindustry, and to promote a stable and transparentenergy market.”g According to the Islamic Republic ofIran News Network (IRINN), the newly formed Execu-tive Committee of the GECF is to hold its first meetingin Doha, Qatar, in March 2009, at which it will discusscandidates to serve as GECF Secretary General,approve a budget for the organization, and discuss“membership fees, the establishment of the secretariat,and financial issues.”h
Another significant development in 2008 was a cooper-ation agreement formed between Russia, Iran, andQatar in October in Tehran, Iran. The Oil Minister ofIran, Gholamhossein Nozari, subsequently announcedthat the three countries had agreed to establish a“Gas OPEC”; however, the chief executive of Russia’s
(continued on page 43)
aH. Hallouche, “The Gas Exporting Countries Forum: Is It Really a Gas OPEC in the Making?” (Oxford, UK: Oxford, Institute for EnergyStudies, June 2006), p. 12, web site www.oxfordenergy.org/pdfs/NG13.pdf.
bH. Hallouche, “The Gas Exporting Countries Forum: Is It Really a Gas OPEC in the Making?”, p. 17. The 10 countries included Algeria,Brunei, Indonesia, Iran, Malaysia, Nigeria, Oman, Qatar, Russia, and Turkmenistan. Norway also attended as an observer.
cAccording to the GECF web site (www.gecforum.org), in 2009 there were 14 members of GECF: Algeria, Bolivia, Brunei, Egypt, Indo-nesia, Iran, Libya, Malaysia, Nigeria, Qatar, Russia, Trinidad and Tobago, the United Arab Emirates, and Venezuela. Equatorial Guineaand Norway are listed as observers.
dSee the GECF website (www.gecforum.org) for official statements released after the third, fourth, and fifth Ministerial Meetings.eDeputy head of Gazprom, Alexander Medvedev; Russian Energy Minister, Sergei Shmatko; Qatari Oil Minister, Abdullah al-Attiyah;
Algerian Oil Minister, Chakib Khelil; President of Indonesia’s Pertamina, Ari Soemarno; and Chairman of Libya’s National Oil Com-pany, Shokri Ghanem all have been quoted in recent publications, speaking against the prospect of a gas OPEC. See A. Glazov and C.Tellinghuisen, “World’s Top Gas Holders Launch ‘Gas OPEC,’” Oil Daily, Vol. 58, No. 205 (October 22, 2008), pp. 1-2, web sitewww.energyintel.com (subscription site); “Gas Troika Talks, But Gas Forum Stumbles,” World Gas Intelligence, Vol. 19, No. 44 (October29, 2008), pp. 1-2, web site www.energyintel.com (subscription site); “Russia, Iran and Qatar Form Gas OPEC’s Core,” International GasReport, No. 610 (November 3, 2008), pp. 7-8, web site www.platts.com (subscription site); “Gas Exporters Agree Charter” and “GasExporters ‘Pose No Threat,’” International Gas Report, No. 612 (December 1, 2008), pp. 31-32; and L. Palti, “Gas Exporters Set Up FormalOrganization,” Oil Daily, Vol. 58, No. 248 (December 24, 2008), pp. 1-2.
fAlgeria, Bolivia, Brunei, Egypt, Indonesia, Iran, Libya, Malaysia, Nigeria, Qatar, Russia, Trinidad and Tobago, the United ArabEmirates, and Venezuela attended as member countries. Norway and Equatorial Guinea attended as observer countries (during themeeting, Equatorial Guinea applied for membership). Kazakhstan attended as a guest and was granted observer status.
g“GECF Signs Charter; Formalises Association,” IHS Global Insight (December 24, 2008), web site www.globalinsight.com/SDA/SDADetail15418.htm.
h“‘Gas OPEC’ To Hold Landmark Meeting in Doha,” The Tehran Times (March 7, 2009), web site www.tehrantimes.com/index_View.asp?code=190541.

and debts owed by Ukraine all were at issue. The conflictwas resolved three days later [13]. In January 2008,Turkmenistan cut natural gas exports to Iran, and Iranreacted by cutting exports to Turkey to make up for thelost imports from Turkmenistan. In turn, Turkey cut itsexports of natural gas (originally imported fromAzerbaijan) to Greece to make up for the lost importsfrom Iran. Subsequently, Gazprom increased its exportsof natural gas to Turkey.
More recently, in January 2009, another dispute withUkraine again led Russia to curtail natural gas exports toUkraine [14]. The basic issues were the same as in 2006:natural gas prices, pipeline transit fees, and debts owedby Ukraine. In this instance, however, rather than lastingthree days, the dispute lasted almost three weeks. OnJanuary 1, Russia reduced natural gas deliveries to theUkrainian border, but some gas continued to flow acrossUkraine to downstream customers. On January 7, allnatural gas exports via Ukraine stopped, as Russia andUkraine blamed each other for shutting down the pipe-lines. Natural gas flows were not resumed until January20, when Russia and Ukraine finally reached an agree-ment on prices and pipeline transit fees [15].
In OECD Asia, Japan and South Korea continue to bealmost entirely dependent on LNG imports for naturalgas supplies. The two countries continue to be majorplayers in LNG markets (with Japan representing 41percent of global LNG imports in 2006 and South Korea15 percent) despite consuming relatively small amountsof natural gas on a global scale (representing 3 and 1 per-cent, respectively, of world consumption in 2006). SouthKorea could begin receiving natural gas supplies bypipeline from Russia sometime after 2015, but Japan andSouth Korea are expected to remain influential in LNGmarkets even as growth in global production of LNGoutpaces their import demand.
Much of the growth in Australia’s natural gas produc-tion is expected to support planned or proposed LNGexport projects, although it is possible that some projectsand the related production increases could be delayed.Pluto LNG, currently under construction in Australia, isone of the few natural gas liquefaction projects for whicha final investment decision has been made in the past
few years [16]. Rising costs for liquefaction projects haveled many companies around the world to delay projectcommitments, and decisions on other projects could bedelayed as a result of the current global financial crisisand the impending global oversupply of LNG. Projectsin Australia face additional hurdles, including a West-ern Australia policy that requires new export projects toreserve 15 percent of production for domestic use. Also,LNG liquefaction plants are significant contributors toAustralia’s carbon dioxide emissions, and new obliga-tions under Australia’s Carbon Pollution ReductionScheme, enacted in December 2008 (and to commence in2010), may make some liquefaction projects uneconomi-cal [17].
Non-OECD Countries
In the near term, Russia’s net exports of natural gas as apercentage of production are projected to decline, as theglobal economic slowdown affects demand in Europeand, in turn, Russia’s pipeline exports to Europeancountries. In the longer-term, the reference case assumesthat the necessary investments will be made to developRussia’s vast natural gas resources, allowing it to con-tinue supplying increasing volumes of natural gas to itsneighbors. Exports, which represented 28 percent ofRussia’s natural gas production in 2006, are projected tofall to 26 percent in 2010 before growing to more than 30percent in 2030. Production of natural gas in Russiagrows by 1.3 percent per year on average in the IEO2009reference case, from 23 trillion cubic feet in 2006 to 31trillion cubic feet in 2030.
Natural gas production in the Middle East and in Africais expected to become oriented more toward exports asthe Medgaz pipeline from Algeria to Spain comes on lineand new liquefaction capacity comes on line in Qatar,Algeria, Yemen, and Angola. Both the Middle East andAfrica are projected to increase production by more than40 percent from 2006 to 2015. In the Middle East, netexports as a share of total natural gas production growfrom 14 percent in 2006 to 24 percent in 2015. In Africa,exports grow from 55 percent of production in 2006 to 57percent in 2010, before falling back to 56 percent in 2015.After 2015, the pace of export developments in thetwo regions slows, and with their domestic demand
Energy Information Administration / International Energy Outlook 2009 43
Gas Exporting Countries Forum: What Is GECF and What Is Its Objective? (continued)
Gazprom, Alexei Miller, referred to the agreement as a“Gas Troika,”i which is how the group generally hasbeen characterized since its initial meeting. The pur-poses of the Gas Troika are unclear. One that has beenstated is to examine possible joint projects for natural
gas development among the three nations. Anotherseems to be to push the GECF forward. For example,Alexei Miller has been quoted as saying that heexpected the Gas Troika to be a “locomotive” for theGECF.j
iA. Glazov and C. Tellinghuisen, “World’s Top Gas Holders Launch ‘Gas OPEC,’” Oil Daily, Vol. 58, No. 205 (October 22, 2008), pp. 1-2,web site www.energyintel.com (subscription site).
j“Gas Troika Ambitions,” World Gas Intelligence, Vol. 19, No. 44 (October 29, 2008), pp. 1-2, web site www.energyintel.com (subscriptionsite).

continuing to grow, the rate of increase in the exportshare of production in the Middle East slows, while theexport share of Africa’s natural gas production declines.
India’s dependence on imported LNG is projected to bereduced in the short term, when new natural gas pro-duction from the Krishna Godavari Basin comes on line.Accordingly, the import share of India’s natural gas con-sumption falls from 20 percent in 2006 to 13 percent in2010 (Figure 39). Much of India’s current production,however, comes from more mature natural gas fieldsthat are beginning to decline, and in 2030 India is pro-jected to be dependent on imports for more than 30 per-cent of its total natural gas consumption. Pipelines tobring natural gas from Iran, Central Asia, or Myanmarhave been discussed in the past, but to date no firmagreements have been reached.
China’s dependence on natural gas imports growsthroughout the projection period. Although new sup-plies from Sichuan province are expected to come online in the short term, and the country’s total domesticproduction of natural gas increases by 3.1 percent peryear on average from 2006 to 2030 in the reference case,production growth cannot keep up with demandgrowth. In 2030, China could be dependent on importsfor more than one-third of its total natural gas consump-tion. To help meet its growing need for imports, Chinaopened its first LNG regasification facility in 2006 atGuangdong [18]. Shanghai LNG was to be the secondregasification terminal in China, with startup in early2009; however, a fatal accident at the facility duringpipeline testing has delayed its startup. Instead, FujianLNG, which is expected to begin operation in mid-2009,will be China’s second LNG receiving terminal [19].Additionally, the first imports of natural gas into Chinaby pipeline are expected by 2011, when a new pipelinefrom Turkmenistan via Kazakhstan is to be inaugurated[20].
In 2006, the rest of non-OECD Asia (excluding Chinaand India) was a net exporter of natural gas. Three coun-tries—Indonesia, Malaysia, and Brunei—currently haveLNG export facilities. There also have been several pro-posals made to build LNG liquefaction facilities inPapua New Guinea. Although Indonesia’s LNG exportspeaked in 1999 at about 30 million metric tons (1.4 tril-lion cubic feet of natural gas) and had declined to about23 million metric tons (1.1 trillion cubic feet of naturalgas) in 2006, a new liquefaction facility, TangguhLNG, is scheduled to come on line in 2009, temporarilyreversing the decline in the country’s total LNG exports.Production from the two LNG facilities currently in
operation in Indonesia is expected to continue declining[21].
In this grouping (non-OECD Asia excluding China andIndia), only one country, Taiwan, currently has an LNGimport terminal, although there have been proposals tobuild regasification terminals in Singapore, Pakistan,Thailand, the Philippines, and Indonesia. In 2006, netexports equaled 24 percent of total production in thegroup of countries, but with domestic demand continu-ing to grow, imports are projected to account for 6 per-cent of their total natural gas consumption in 2030 in theIEO2009 reference case.
On a percentage basis, Brazil’s natural gas productionshows the most rapid growth in the reference case.Starting from 0.3 trillion cubic feet in 2006, Brazil’s pro-duction is projected to grow by an average of 6.6 percentper year to 2030. In 2006, Brazil depended on importsfrom Bolivia for nearly one-half of its natural gas con-sumption; in 2030, its import dependence is less than 10percent of total consumption. In the short to mid-term,however, Brazil is planning to increase imports. TwoLNG import terminals are expected to start up in 2009,and there are plans to build at least one more regasifi-cation terminal in the country [22]. At the same time,Brazil is also discussing the possibility of building anLNG liquefaction facility that would allow it to supplyits own regasification terminals throughout the countryor to export small volumes to neighboring countries.
World Natural Gas ReservesHistorically, world natural gas reserves have generallytrended upward (Figure 40). As of January 1, 2009,proved world natural gas reserves, as reported by Oil &Gas Journal,17 were estimated at 6,254 trillion cubic feet—69 trillion cubic feet higher than the estimate of 6,186 tril-lion cubic feet for 2008 [23]. Reserves have remained rel-atively flat since 2004, despite growing demand fornatural gas, implying that, thus far, producers have beenable to continue replenishing reserves successfully withnew resources over time.
The largest increases in reported natural gas reserves in2009 were for Iran and the United States. Iran added anestimated 43 trillion cubic feet (a 5-percent increase over2008 proved reserves) and the United States added 27trillion cubic feet (a 13-percent increase). There weresmaller, but still substantial, reported increases inreserves in Indonesia, Kuwait, Venezuela, and Libya.Reserves in Indonesia and Kuwait both rose by 13 per-cent—with Indonesia’s reserves increasing by 12 trillion
44 Energy Information Administration / International Energy Outlook 2009
17 Proved reserves, as reported by the Oil & Gas Journal, are estimated quantities that can be recovered under present technology andprices. Natural gas reserves reported by Oil & Gas Journal are compiled from voluntary survey responses and do not always reflect the mostrecent changes. U.S. proved reserves of natural gas are reported by the Energy Information Administration and are defined as the estimatedquantities of natural gas reserves as of December 31, 2008, which analysis of geological and engineering data demonstrate with reasonablecertainty to be recoverable in future years from known reservoirs under existing economic and operating conditions. Significant natural gasdiscoveries made in 2008 are not likely to be reflected in the reported reserves.

cubic feet and Kuwait’s by 7 trillion cubic feet. Vene-zuela added nearly 5 trillion cubic feet of reserves (a3-percent increase), and Libya added 4 trillion cubic feet(a 9-percent increase).
Much of the increase in U.S. natural gas reserves resultsfrom expanded knowledge and exploration of shaleresources. Outside the United States there has beenalmost no exploration of shale resources, and corre-spondingly little is known about the resource potentialin other countries. Technologies that have greatlyimproved the economics of U.S. shale plays, including
horizontal drilling and hydraulic fracturing, probablycan be adapted to resource plays in other parts of theworld. These technologies may, for instance, be appliedin Europe before too long. A few North Americanenergy companies have begun to explore potential shaleplays in Central and Western Europe. At the same time,a few European energy companies have invested inNorth American shale plays. As the technologies areapplied in other regions, economically recoverablenatural gas reserves in the rest of the world are likely toincrease, as they have in the United States.
The largest reported declines in natural gas reserves in2009 were in Kazakhstan (a decrease of 15 trillion cubicfeet) and Qatar (13 trillion cubic feet). The Kazakhstandecline represents a 15-percent drop, although at 85 tril-lion cubic feet, the country still holds significant provedreserves. Given the vast resources in Qatar (now about892 trillion cubic feet), the 2009 decrease amounts to onlya 1-percent decline in the country’s total provedreserves. Turkmenistan also reported a fairly substantialdecrease in reserves of 6 trillion cubic feet (6 percent).Germany and the United Kingdom reported smallerdecreases, but they represent more significant shares ofthe two countries’ total reserves. For Germany, thereported decrease of 3 trillion cubic feet amounts to a31-percent reduction in proved reserves. For the UnitedKingdom, the decrease of 2 trillion cubic feet amounts toa 17-percent reduction.
Almost three-quarters of the world’s natural gasreserves are located in the Middle East and Eurasia(Figure 41). Russia, Iran, and Qatar together accountedfor about 57 percent of the world’s natural gas reservesas of January 1, 2009 (Table 6).
Energy Information Administration / International Energy Outlook 2009 45
1980 1985 1990 1995 2000 2005 20090
1,000
2,000
3,000
4,000
5,000
6,000
7,000Trillion Cubic Feet
OECD
Total
Non-OECD Europe and Eurasia
Other Non-OECD
Figure 40. World Natural Gas Reserves by CountryGrouping, 1980-2008
Sources: 1980-1993: “Worldwide Oil and Gas at a Glance,”International Petroleum Encyclopedia (Tulsa, OK: PennWellPublishing, various issues). 1994-2009: Oil & Gas Journal(various issues).
2006 2010 2015 2020 2025 20300
20
40
60
80
100
Net Imports as Percent of National Consumption
Brazil
China
India
Figure 39. Imports as Share of Non-OECDNatural Gas Consumption by Country,2006-2030
Sources: 2006: Energy Information Administration (EIA),International Energy Annual 2006 (June-December 2008),web site www.eia.doe.gov/iea. Projections: EIA, WorldEnergy Projections Plus (2009).
2,549
2,020
490
415
283
262
167
Middle East
Eurasia
Africa
Asia
North America
Central and South America
Europe
0 1,000 2,000 3,000
Trillion Cubic Feet
World Total:6,254 Trillion Cubic Feet
Figure 41. World Natural Gas Reservesby Geographic Region as ofJanuary 1, 2009
Source: “Worldwide Look at Reserves and Production,” Oil &Gas Journal, Vol. 106, No. 48 (December 22, 2008), pp. 22-23.

Despite high rates of increase in natural gas consump-tion, particularly over the past decade, reserves-to-production ratios for most regions are substantial.Worldwide, the reserves-to-production ratio is esti-mated at 63 years [24]. By region, the highest ratios areabout 48 years for Central and South America, 78 yearsfor Russia, 79 years for Africa, and more than 100 yearsfor the Middle East.
References
46 Energy Information Administration / International Energy Outlook 2009
1. FACTS Global Energy, Asia-Pacific LNG Monthly(May 2008), p. 3.
2. “LNG Project Inventory: South America,” Zeus Liq-uefied Natural Gas Report, Vol. 19, No. 6 (March 25,2009), pp. 24-25; and “Uruguay To Play Local HubRole,” Platts International Gas Report, No. 620 (March30, 2009), pp. 24-25.
3. S. Ciszuk, “Saudi Arabia: Country Reports: Oil &Gas: Upstream,” IHS Global Insight, Inc. (February10, 2009), web site www.globalinsight.com (sub-scription site).
Table 6. World Natural Gas Reserves by Countryas of January 1, 2009
Country
Reserves(Trillion
Cubic Feet)
Percent ofWorldTotal
World . . . . . . . . . . . . . . . . . 6,254 100.0Top 20 Countries. . . . . . . . 5,674 90.7Russia . . . . . . . . . . . . . . . . 1,680 26.9Iran . . . . . . . . . . . . . . . . . . 992 15.9Qatar . . . . . . . . . . . . . . . . . 892 14.3Saudi Arabia . . . . . . . . . . . 258 4.1United States. . . . . . . . . . . 238 3.8United Arab Emirates . . . . 214 3.4Nigeria. . . . . . . . . . . . . . . . 184 2.9Venezuela . . . . . . . . . . . . . 171 2.7Algeria . . . . . . . . . . . . . . . . 159 2.5Iraq . . . . . . . . . . . . . . . . . . 112 1.8Indonesia. . . . . . . . . . . . . . 106 1.7Turkmenistan . . . . . . . . . . 94 1.5Kazakhstan . . . . . . . . . . . . 85 1.4Malaysia . . . . . . . . . . . . . . 83 1.3Norway . . . . . . . . . . . . . . . 82 1.3China. . . . . . . . . . . . . . . . . 80 1.3Uzbekistan . . . . . . . . . . . . 65 1.0Kuwait . . . . . . . . . . . . . . . . 63 1.0Egypt . . . . . . . . . . . . . . . . . 59 0.9Canada . . . . . . . . . . . . . . . 58 0.9
Rest of World. . . . . . . . . . . 581 9.3
Source: “Worldwide Look at Reserves and Production,” Oil &Gas Journal, Vol. 106, No. 48 (December 22, 2008), pp. 22-23.
4. A. Schindelar, “Saudi Aramco Beleaguered by Pro-ject Delays,” The Oil Daily, Vol. 58, No. 115 (June 16,2008), pp. 1 and 2.
5. S. Ciszuk, “Iran: Country Reports: Oil & Gas:Upstream,” IHS Global Insight, Inc. (September 19,2008), web site www.globalinsight.com (subscrip-tion site).
6. GAZPROM News Release, “Gazprom LaunchesYamal Megaproject” (December 3, 2008), web sitewww.gazprom.com/eng/news/2008/12/32740.shtml.
7. IHS Global Insight, Inc., European Natural Gas Sup-ply and Demand Report (Lexington, MA, January2009), p. 35.
8. IHS Global Insight, Inc., European Natural Gas Sup-ply and Demand Report (Lexington, MA, January2009), p. 35; and GAZPROM News Release, “FirstRussian LNG Plant Launched in Sakhalin” (Febru-ary 18, 2009), web site www.gazprom.com/eng/news/2009/02/34304.sthml.
9. GAZPROM Corporate Web Site, “About/MajorProjects/Shtokman Project” (undated), web sitewww.gazprom.com/eng/articles/article21712.shtml.
10. “Worldwide Look at Reserves and Production,” Oil& Gas Journal, Vol. 106, No. 48 (December 22, 2008),pp. 22-23, web site www.ogj.com (subscriptionsite).
11. T. Grieder, “Australia: Country Reports: Oil & Gas:Upstream,” IHS Global Insight, Inc. (November 6,2007), web site www.globalinsight.com (subscrip-tion site).
12. R. Al-Rikabi, “Global Recession Complicates Aus-tralian, PNG LNG Projects,” World Gas Intelligence,Vol. 20, No. 8 (February 25, 2009), p. 8.
13. S. Blakely and T. Gustafson, “Russian-UkrainianGas: Why It’s Different This Time.” CambridgeEnergy Research Associates Decision Brief (January2009), web site www.cera.com (subscription site).
14. S. Blakely and T. Gustafson, “It’s Not Over Till It’sOver: The Russian Ukrainian Gas Crisis in Perspec-tive,” Cambridge Energy Research Associates DecisionBrief (January 19, 2009), web site www.cera.com(subscription site).
15. “Crux of Gazprom, Ukraine Deals,” World Gas Intel-ligence, Vol. 20, No. 3 (January 21, 2009), p. 3.
16. R. Al-Rikabi, “Global Recession Complicates Aus-tralian, PNG LNG Projects,” World Gas Intelligence,Vol. 20, No. 8 (February 25, 2009), p. 8.
17. “Official News—December 2008,” AustralianEmbassy and Mission to the European Commu-nities Belgium-Luxembourg (December 2008), website www.eu.mission.gov.au/bsls/offnews_dec08.html.
Energy Information Administration / International Energy Outlook 2009 47
18. Luo Weizhong, “China LNG Spot Trading Prac-tices,” U.S.–China Oil & Gas Industry Forum,Forum 8 (September 10, 2007), web site www.uschinaogf.org.
19. “CNOOC begins Fujian LNG storage expansion,”LNGpedia (January 4, 2009), web site www.lngpedia.com/cnooc-begins-fujian-lng-storage-expansion-report.
20. Yen Ling Song, “Soaring Usage, Imports PushChina Toward Gas Price Reform,” World Gas Intelli-gence, Vol. 20, No. 3 (January 21, 2009), p. 8.
21. “Indonesia’s Inward Looking LNG Strategy, WorldGas Intelligence, Vol. 20, No. 8 (February 25, 2009), p.3.
22. “Petrobras into LNG, Slowly But Surely,” World GasIntelligence, Vol. 20, No. 5 (February 11, 2009), pp.4-5.
23. “Worldwide Look at Reserves and Production,” Oil& Gas Journal, Vol. 106, No. 48 (December 22, 2008),pp. 22-23, web site www.ogj.com (subscriptionsite).
24. BP Statistical Review of World Energy 2008 (London,UK, June 2008), p. 22, web site www.bp.com.


Chapter 4
CoalIn the IEO2009 reference case, world coal consumption increases by 49 percent
from 2006 to 2030, and coal’s share of world energy consumption increases
from 27 percent in 2006 to 28 percent in 2030.
In the IEO2009 reference case, world coal consumptionincreases by 49 percent over the projection period, from127.5 quadrillion Btu in 2006 to 190.2 quadrillion Btu in2030 (Figure 42). The growth rate for coal consumptionis fairly even over the period, averaging 1.9 percent peryear from 2006 to 2015 and 1.6 percent per year from2015 to 2030—generally reflecting the growth trends forboth world GDP and world primary energy consump-tion. Regionally, increased use of coal in non-OECDcountries accounts for 94 percent of the total growth inworld coal consumption over the entire period.
In 2006, coal accounted for 27 percent of world energyconsumption (Figure 43). Of the coal produced world-wide in 2006, 62 percent was shipped to electricity pro-ducers, 34 percent to industrial consumers, and most ofthe remaining 4 percent to coal consumers in the resi-dential and commercial sectors. Coal’s share of totalworld energy consumption increases to 28 percent in2030 in the IEO2009 reference case. In the electric powersector its share declines slightly, from 42 percent in 2006to 41 percent in 2020, and then increases to 42 percent in2030.
International coal trade grows by 40 percent in the refer-ence case, from 19.7 quadrillion Btu in 2006 to 27.6
quadrillion Btu in 2030. The share of total world coalconsumption accounted for by internationally tradedcoal remains near the 2006 level of 15 percent through-out the projection period.
World Coal ConsumptionOECD Countries
Coal consumption in the OECD countries increases inthe reference case from 46.9 quadrillion Btu in 2006 to47.8 quadrillion Btu in 2015 and 50.7 quadrillion Btuin 2030 (Figure 44). The increase represents averagegrowth of 0.3 percent per year over the entire period and0.4 percent per year from 2015 to 2030. Despite increasesin North America and OECD Asia, coal consumption inthe OECD countries, which represented 37 percent ofthe world total in 2006, declines to 27 percent of the totalin 2030.
North America
Coal use in the United States totaled 22.5 quadrillion Btuin 2006—92 percent of total coal use in North Americaand 48 percent of the OECD total. U.S. coal demand risesto 26.6 quadrillion Btu in 2030 in the IEO2009 reference
Energy Information Administration / International Energy Outlook 2009 49
1980 1995 2006 2015 20300
50
100
150
200
250Quadrillion Btu
History Projections
OECD
Total
Non-OECD
Figure 42. World Coal Consumption by CountryGrouping, 1980-2030
Sources: History: Energy Information Administration (EIA),International Energy Annual 2006 (June-December 2008),web site www.eia.doe.gov/iea. Projections: EIA, WorldEnergy Projections Plus (2009).
42
25
4
27
41
25
4
27
42
24
4
28
Electricity Industrial Other Sectors Total0
20
40
60
80
100Percent
2006 2015 2030
Figure 43. Coal Share of World EnergyConsumption by Sector, 2006, 2015,and 2030
Sources: 2006: Derived from Energy Information Adminis-tration (EIA), International Energy Annual 2006 (June-December 2008), web site www.eia.doe.gov/iea. 2015 and2030: EIA, World Energy Projections Plus (2009).

case. The United States has substantial coal reserves andrelies heavily on coal for electricity generation, a posi-tion that continues in the projections. Coal’s share oftotal U.S. electricity generation (including electricityproduced at combined heat and power plants in theindustrial and commercial sectors) declines from 49 per-cent in 2006 to 47 percent in 2030.18
Increasing coal use for electricity generation at new andexisting plants, combined with the startup of severalcoal-to-liquids (CTL) plants, leads to modest growth inU.S. coal consumption, averaging 0.7 percent per yearfrom 2006 to 2030. Although an assumed risk premiumfor carbon-intensive technologies dampens investmentin new coal-fired power plants in the United States, theprojected increase in coal-fired electricity generation stillis larger than for any other fuel. Increased generationfrom coal-fired power plants accounts for 39 percent ofthe growth in total U.S. electricity generation from 2006to 2030.
Generation from renewables (including conventionalhydroelectric resources) also increases substantially inthe forecast, accounting for 32 percent of the growth intotal electricity generation, followed by natural gas at 18percent. Production of coal-based synthetic liquidsincreases to 257,000 barrels per day in 2030. The projec-tions for both coal-fired electricity generation and coal-based synthetic liquids could change significantly, how-ever, if changes are made in U.S. laws and policies, par-ticularly those regarding greenhouse gas emissions.
In Canada and Mexico, small increases in coal consump-tion (0.2 quadrillion Btu for each country) are expectedover the period. As a result, the two countries essentiallymaintain their combined 8-percent share of NorthAmerica’s total coal consumption through 2030. In Mex-ico, 0.7 gigawatts of coal-fired generating capacity is cur-rently under construction at Lazaro Cardenas on thePacific coast. In addition, Mexico’s Energy Ministry hasindicated the potential for additional coal-fired generat-ing projects in the next decade, to be supplied by coalproduced locally [1]; however, development of the newcoal-fired power plants and associated mines is contin-gent on minability and coal quality assessments of somerecently identified resources in the Coahuila coal basinin northeast Mexico.
OECD Europe
Total coal consumption in the countries of OECDEurope declines slightly in the reference case, from 13.2quadrillion Btu in 2006 (28 percent of the OECD total) to12.0 quadrillion Btu in 2030 (24 percent of the OECDtotal). In 2006, the major coal-consuming countries ofOECD Europe included Germany, Poland, the UnitedKingdom, Spain, Italy, Turkey, and the Czech Republic.Low-Btu coal is an important domestic source of energyfor OECD Europe, which also relies heavily on importsof hard coal.19 In 2006, lignite accounted for 47 percent oftotal coal consumption in OECD Europe on a tonnagebasis and 24 percent on a Btu basis [2]. Plans to replace orrefurbish existing coal-fired capacity in a number of thecountries of OECD Europe are an indication that coalwill continue to play an important role in the overallenergy mix [3].
Coal consumption in OECD Europe remains relativelyflat throughout 2030, as governments enact policies todiscourage its use, largely in response to environmentalconcerns, and growth in overall energy consumption ismodest, averaging 0.5 percent per year. Other factorsthat are likely to restrain overall growth in coal con-sumption in the region include continuing penetrationof natural gas in both the electricity and industrial sec-tors, growing use of renewable fuels, and continuingpressure on member countries of the European Union toreduce subsidies that support domestic production ofhard coal.
OECD Asia
In addition to being major consumers of coal, the nationsof OECD Asia play an important role in internationalcoal trade. In 2006 they used 9.4 quadrillion Btu of coal,representing 20 percent of total OECD coal con-sumption. OECD Asia’s coal demand increases by 0.4
50 Energy Information Administration / International Energy Outlook 2009
NorthAmerica
OECDEurope
OECDAsia
Total OECD0
25
50
75Quadrillion Btu
1980 2006 2015 2030
Figure 44. OECD Coal Consumptionby Region, 1980, 2006, 2015, and 2030
Sources: 1980 and 2006: Energy Information Administration(EIA), International Energy Annual 2006 (June-December2008), web site www.eia.doe.gov/iea. 2015 and 2030: EIA,World Energy Projections Plus (2009).
18 Primarily as the result of additional incentives for renewable fuels in ARRA2009, U.S. coal-fired generation in 2030 is slightly lower inthe updated AEO2009 reference case (April 2009) than in the published AEO2009 reference case projection (March 2009) discussed in this re-port. As a result, the projection for coal’s share of total U.S. electricity generation in 2030 also is slightly lower, at 46 percent.
19 Internationally, the term “hard coal” is used to describe anthracite and bituminous coal. In data published by the International EnergyAgency, coal of subbituminous rank is classified as hard coal for some countries and as brown coal (with lignite) for others.

quadrillion Btu over the projection period, to 9.8 qua-drillion Btu in 2030 (19 percent of the OECD total). In2006, Australia was the world’s leading coal exporter,supplying 6.2 quadrillion Btu of coal to the internationalmarket. Japan and South Korea were the leading import-ers, receiving 4.5 and 2.0 quadrillion Btu of coal, respec-tively [4]. With Japan’s coal use decreasing in the longterm, Australia, New Zealand, and South Korea accountfor nearly all the projected growth in OECD Asia’sdemand for coal.
Coal consumption in Australia/New Zealand increasesby an average of 0.5 percent per year, from 2.6 quadril-lion Btu in 2006 to 2.9 quadrillion Btu in 2030. Of the twocountries, Australia is by far the larger coal consumer, at97 percent of the regional total in 2006. With substantialcoal reserves (primarily in Australia), the region contin-ues to rely heavily on coal for electricity generation;however, coal’s share of total generation declines gradu-ally. Compared with coal, generation from bothrenewables and natural gas increases at a more rapidpace, with the result that those fuels capture an increas-ing share of Australia/New Zealand’s total generation.Coal-fired power plants supplied 70 percent of theregion’s total electricity generation in 2006, as comparedwith a projected 58-percent share in 2030 in the referencecase.
South Korea’s total coal consumption increases by 0.7quadrillion Btu from 2006 to 2030, primarily to fuel exist-ing and planned electric power plants. South Korea’sgenerating companies have announced plans to con-struct more than 6 gigawatts of new coal-fired capacityat existing sites over the next few years, including three500-megawatt units that began operation at Korea
East-West Power Company’s Dangjin plant in 2006 and2007 [5].
Non-OECD Countries
Led by strong economic growth and rising energydemand in non-OECD Asia, total coal consumption inthe non-OECD countries increases to 139.6 quadrillionBtu in 2030, an increase of 73 percent over the 2006 total(Figure 45). The increase of 59.0 quadrillion Btu, whichrepresents 94 percent of the projected increase in totalworld coal consumption, underscores the continuingimportance of coal in meeting overall energy demand inthe non-OECD nations. Over the entire IEO2009 refer-ence case horizon, coal accounts for about one-third oftotal non-OECD energy consumption.
Non-OECD Asia
The countries of non-OECD Asia account for 90 percentof the projected increase in world coal consumptionfrom 2006 to 2030. Strong economic growth is expectedfor non-OECD Asia, averaging 5.7 percent per year from2006 to 2030, with China’s economy averaging 6.4 per-cent per year and India’s by 5.6 percent per year. Muchof the increase in demand for energy in non-OECD Asia,particularly in the electric power and industrial sectors,is expected to be met by coal.
Coal use in China’s electricity sector increases from 24.9quadrillion Btu in 2006 to 57.3 quadrillion Btu in 2030, atan average rate of 3.5 percent per year (Figure 46). Incomparison, coal consumption in the U.S. electric powersector is projected to grow by 0.7 percent annually, from20.7 quadrillion Btu in 2006 to 24.3 quadrillion Btu in2030. At the beginning of 2006, China had an estimated350 gigawatts of coal-fired capacity in operation. To
Energy Information Administration / International Energy Outlook 2009 51
Non-OECDEurope
and Eurasia
Non-OECDAsia
OtherNon-OECD
TotalNon-OECD
0
50
100
150Quadrillion Btu
1980 2006 2015 2030
Figure 45. Non-OECD Coal Consumptionby Region, 1980, 2006, 2015, and 2030
Sources: 1980 and 2006: Energy Information Administration(EIA), International Energy Annual 2006 (June-December2008), web site www.eia.doe.gov/iea. 2015 and 2030: EIA,World Energy Projections Plus (2009).
25 24
3
52
3730
3
70
57
38
3
98
Electricity Industrial Other Sectors Total0
20
40
60
80
100
120Quadrillion Btu
2006 2015 2030
Figure 46. Coal Consumption in China by Sector,2006, 2015, and 2030
Sources: 2006: Energy Information Administration (EIA),International Energy Annual 2006 (June-December 2008),web site www.eia.doe.gov/iea. 2015 and 2030: EIA, WorldEnergy Projections Plus (2009).

meet the demand for electricity that is expected toaccompany its rapid economic growth, an additional600 gigawatts of coal-fired capacity (net of retirements)is projected to be brought on line in China by 2030,requiring large financial investments in new coal-firedpower plants and associated electricity transmission anddistribution systems. In the near term, the IEO2009 pro-jections show a substantial amount of new coal builds,with 192 gigawatts of capacity additions between 2006and 2010.
In addition to required investments in China’s electricpower industry, the large increase in Chinese coaldemand projected in the IEO2009 reference case indi-cates a continuing need for substantial investments inboth coal mining and coal transportation infrastructure.Examples of some recent and forthcoming investmentsin China’s rail transportation system include majorcapacity expansions for some of the country’s existingcoal railways, the planned construction of several newcoal railways, the scheduled delivery of 300 modernGeneral Electric locomotives to the Chinese RailwaysMinistry by 2010, and an estimated $100 billion ofinvestment in rail services included in China’s recentlyapproved stimulus package [6].
More than one-half (52 percent) of China’s coal use in2006 was in the non-electricity sectors, primarily in theindustrial sector. China was the world’s leading pro-ducer of both steel and pig iron in 2006 [7]. Over the pro-jection period, coal demand in China’s non-electricitysectors is expected to increase by 13.9 quadrillion Btu, to51 percent above the 2006 level.
Because China has limited reserves of oil and naturalgas, coal remains the leading source of energy in itsindustrial sector. In large part, coal’s declining share ofindustrial energy consumption in China is the result ofincreasing use of electricity in the sector; however, thatincrease also can be viewed indirectly as an increase incoal consumption, given that coal-fired power plants areprojected to satisfy approximately three-fourths ofChina’s total power generation requirements through-out the period from 2006 to 2030. Electricity’s share oftotal industrial energy use rises from 18 percent in 2006to 28 percent in 2030, while coal’s share drops from 61percent to 51 percent.
Another potential source of future coal demand in Chinais the production of coal-based synthetic liquids. Rapiddevelopment of a CTL industry in China was stronglyanticipated several years ago, but the government’s con-cerns about a number of factors, such as potential strainson water resources and shortages of coal supply, led toincreased oversight of the emerging industry. As aresult, many proposed CTL projects lack official govern-ment approval and are now on hold.
One plant that has been approved is the ShenhuaGroup’s direct coal liquefaction facility located inChina’s Inner Mongolia Autonomous Region. Construc-tion of the plant’s first phase was completed in late 2008,but initial production runs revealed a number ofproblems in the production process [8]. Following somecorrective modifications, new production trials areexpected later in 2009, with commercial production nowscheduled to commence sometime in 2010. The plant hasan initial design capacity of about 20,000 barrels per day[9]. Depending on the successful startup and commer-cial operation of its first phase, Shenhua plans an even-tual expansion of the plant’s capacity to 100,000 barrelsper day. In the IEO2009 reference case, China’s CTL pro-duction increases to about 537,000 barrels per day in2030, corresponding to a little less than 4 percent of thecountry’s total liquids consumption.
In India, more than 71 percent of the growth in coal con-sumption is expected to be in the electric power sectorand most of the remainder in the industrial sector.In 2006, India’s coal-fired power plants consumed 5.9quadrillion Btu of coal, representing 63 percent of thecountry’s total coal demand. Coal use for electricity gen-eration in India is projected to grow by 1.9 percent peryear, to 9.3 quadrillion Btu in 2030, as an additional 65gigawatts of coal-fired capacity (net of retirements) isbrought on line. As a result, India’s coal-fired generatingcapacity increases from 78 gigawatts in 2006 to 142 giga-watts in 2030.
Currently, India’s government has tentative plans toadd more than 50 gigawatts of new coal-fired generatingcapacity during the period covered by its eleventhpower plan (a 5-year period ending in March 2012) [10].During India’s most recent 5-year power plan period,which ended in March 2007, only about 12 gigawatts ofthe 20 gigawatts of new coal-fired generating capacitythat had been planned was actually completed. In addi-tion to the coal projects listed in the preliminary docu-ments for the eleventh power plan, including one “ultramega” coal-fired plant with a capacity of 4 gigawatts, theIndian government is pursuing the development ofeight more “ultra mega” projects with a total combinedcoal-fired generating capability of 32 gigawatts [11].
In the other nations of non-OECD Asia, coal consump-tion grows by an average of 3.0 percent per year, from5.1 quadrillion Btu in 2006 to 10.4 quadrillion Btu in2030, with increases in both the electric power andindustrial sectors. In the electric power sector, signifi-cant growth in coal consumption is expected in Indone-sia and Vietnam, where considerable amounts of newcoal-fired generating capacity are expected to come online before 2030.
52 Energy Information Administration / International Energy Outlook 2009

Non-OECD Europe and Eurasia
Coal consumption in non-OECD Europe and Eurasiaincreases in the IEO2009 reference case by an average of0.3 percent per year, from 8.7 quadrillion Btu in 2006 to9.4 quadrillion Btu in 2030. Russia alone has an esti-mated 173 billion tons of recoverable reserves (19 per-cent of the world total), and the other countries ofnon-OECD Europe and Eurasia have an additional 95billion tons (10 percent of the world total).20
Russia is the largest coal consumer among the nations ofnon-OECD Europe and Eurasia, at 4.6 quadrillion Btu in2006, or 52 percent of the total for non-OECD Europeand Eurasia. Coal supplied 15 percent of Russia’s totalenergy requirements in 2006, and coal-fired powerplants provided 23 percent of its electricity. In the refer-ence case, coal consumption in Russia in 2030 totals 5.2quadrillion Btu, its share of Russia’s total energy con-sumption drops slightly to 14 percent, and its share ofelectricity generation declines to 20 percent. Nearlyone-half of the projected growth in electricity demandfrom 2006 to 2030 is met by natural-gas-fired powerplants, with coal and nuclear plants accounting for mostof the remainder. The natural gas share of Russia’s totalelectricity generation increases from 39 percent in 2006to 43 percent in 2030.
In March 2008, the Russian government approved a newlong-range plan for the country’s electric power sectorthrough 2020 [12]. In general, the plan lays out a detailedroadmap of capacity additions and retirements and newtransmission infrastructure. In terms of capacity addi-tions, one of the key objectives of the plan is to curbgrowth in natural-gas-fired generation in order to freeup natural gas for export. The plan anticipates someadditional growth in natural gas consumption in thepower sector through 2020, as does the IEO2009 refer-ence case, but it differs from the IEO2009 projection inthat it anticipates more generation from coal-fired andnuclear power plants and more rapid growth in totalelectricity generation.
One of the key uncertainties in Russia’s new long-rangepower plan is the extent to which the new owners ofRussia’s various regional and wholesale generatingcompanies will adhere to the specific planned additionsand retirements outlined in the government plan. Inmid-2008, Russia’s former power monopoly, UnifiedEnergy System (UES), completed the process of sellingall but one of the regional and wholesale generatingcompanies it once controlled. Ownership of those enti-ties is now in the hands of various domestic and interna-tional energy companies. Thus far, the new owners haveshown some reluctance to add the 36 gigawatts of newcoal-fired capacity specified in Russia’s long-rangepower plan by 2015, with their expansion plans in
mid-2008 indicating a total of about 20 gigawatts of newcoal builds for the period [13].
Coal consumption in Other Non-OECD Europe andEurasia remain near the 2006 level of 4.2 quadrillion Btuthrough 2030, although the reference case does showsome increase in consumption for electricity generation.From 2006 to 2030, coal, natural gas, and nuclear powerare projected to satisfy nearly all the region’s additionalelectricity requirements, with increased output fromcoal-fired plants meeting 19 percent of the growth, natu-ral-gas-fired plants 57 percent, and nuclear plants 23percent. Coal’s share of total electricity generationdeclines only slightly, from 27 percent in 2006 to 25 per-cent in 2030. Currently in the region, a number of newcoal-fired power projects are in the planning stages [14].Lignite mined locally is the proposed fuel for most ofthose plants, although imported coal is the likely fuelsource for several plants that may be constructed incoastal areas.
Africa
Africa’s coal consumption increases by 1.1 quadrillionBtu from 2006 to 2030 in the reference case. South Africacurrently accounts for 92 percent of the coal consumedon the continent and is expected to continue to accountfor much of Africa’s total coal consumption over the pro-jection period.
In South Africa, increasing demand for electricity inrecent years has led to a decision by Eskom, the coun-try’s state-owned electricity supplier, to restart threelarge coal-fired plants (Camden, Grootvlei, and Komati)that have been closed for more than a decade [15]. Theindividual units at those plants, with a combined gener-ating capacity of 3.8 gigawatts, are scheduled to returnto service between 2006 and 2011. In addition, Eskom isproceeding with the construction of two new coal-firedpower plants, Medupi and Kusile, with a combined gen-erating capacity of 9.6 gigawatts. The 12 individual unitsat the Medupi and Kusile plants are scheduled to befully operational by the end of 2016.
Recent power shortages and a general lack of spare gen-erating capacity in southern Africa also have led toincreased interest in new coal-fired power projects incountries other than South Africa. Of particular signifi-cance are major investments being made by severalinternational energy companies to develop coal reservesin Mozambique and Botswana for the purpose of sup-plying both international markets and domesticcoal-fired generating plants [16].
In the industrial sector, increasing use of coal in Africa isexpected for several purposes, including the productionof steam and process heat for industrial applications,production of coke for the steel industry, and
Energy Information Administration / International Energy Outlook 2009 53
20 Throughout this chapter, tons refer to short tons (2,000 pounds).

production of coal-based synthetic liquids. Currently,two large-scale CTL plants in South Africa (Sasol II andSasol III) supply slightly more than 20 percent of thecountry’s total liquid fuel requirements [17]. The twoplants together are capable of producing 150,000 barrelsof synthetic liquids per day.
Central and South America
Central and South America consumed 0.8 quadrillionBtu of coal in 2006. Brazil, with the world’s tenth-largeststeel industry in 2006, accounted for 54 percent of theregion’s coal demand; Chile, Colombia, Puerto Rico,Peru, and Argentina accounted for most of the remain-der [18]. In the projections, coal consumption in Centraland South America increases by 0.8 quadrillion Btu from2006 to 2030, with 75 percent of the increase in Brazil,primarily for coke manufacture and electricity genera-tion. Brazil’s steel companies currently plan to expand
production capacity by a substantial amount over themid-term to meet increasing domestic and internationaldemand for steel [19].
Middle East
Countries in the Middle East consumed 0.4 quadrillionBtu of coal in 2006. Israel accounted for 85 percent of thetotal and Iran most of the remainder. The region’s coaluse increases only slightly in the reference case, to 0.5quadrillion Btu in 2030.
World Coal ProductionFrom 2006 to 2030, coal production in China, the UnitedStates, and India increases by 43.5 quadrillion Btu, 3.2quadrillion Btu, and 1.8 quadrillion Btu, respectively, inthe IEO2009 reference case (Table 7), which assumes thatmost of the demand for coal in the three countries will
54 Energy Information Administration / International Energy Outlook 2009
Table 7. World Coal Production by Region, 2006-2030(Quadrillion Btu)
Region 2006 2010 2015 2020 2025 2030
Average AnnualPercent Change,
2006-2030
OECD North America . . . . . . . . . . . 25.5 26.0 26.8 26.8 27.5 29.5 0.6United States. . . . . . . . . . . . . . . . . . 23.8 24.0 24.5 24.5 25.1 27.0 0.5Canada . . . . . . . . . . . . . . . . . . . . . . 1.5 1.8 2.1 2.1 2.1 2.2 1.5Mexico . . . . . . . . . . . . . . . . . . . . . . . 0.2 0.2 0.3 0.3 0.3 0.3 1.0
OECD Europe. . . . . . . . . . . . . . . . . . 7.5 7.1 6.7 6.7 6.5 6.5 -0.6
OECD Asia . . . . . . . . . . . . . . . . . . . . 8.8 9.7 10.6 11.3 12.3 13.4 1.8Japan. . . . . . . . . . . . . . . . . . . . . . . . 0.0 0.0 0.0 0.0 0.0 0.0 —South Korea . . . . . . . . . . . . . . . . . . 0.1 0.1 0.1 0.0 0.1 0.0 -0.6Australia/New Zealand . . . . . . . . . . 8.7 9.6 10.6 11.2 12.2 13.3 1.8
Total OECD . . . . . . . . . . . . . . . . . 41.8 42.9 44.1 44.7 46.3 49.4 0.7
Non-OECD Europe and Eurasia . . . 10.4 10.9 11.5 11.4 11.3 11.6 0.4Russia . . . . . . . . . . . . . . . . . . . . . . . 6.1 6.8 7.4 7.4 7.3 7.6 0.9Other . . . . . . . . . . . . . . . . . . . . . . . . 4.3 4.1 4.1 4.0 4.0 4.0 -0.3
Non-OECD Asia . . . . . . . . . . . . . . . . 68.3 78.4 85.7 95.5 107.0 117.6 2.3China . . . . . . . . . . . . . . . . . . . . . . . . 52.8 62.2 69.4 78.3 88.4 96.3 2.5India. . . . . . . . . . . . . . . . . . . . . . . . . 8.2 8.7 8.8 9.2 9.4 10.0 0.8Other . . . . . . . . . . . . . . . . . . . . . . . . 7.3 7.5 7.5 8.0 9.2 11.3 1.8
Middle East . . . . . . . . . . . . . . . . . . . 0.0 0.0 0.1 0.1 0.1 0.1 1.3
Africa . . . . . . . . . . . . . . . . . . . . . . . . 5.9 6.2 6.6 6.7 7.3 7.8 1.2
Central and South America . . . . . . 2.0 2.3 2.9 3.6 3.6 4.3 3.1Brazil . . . . . . . . . . . . . . . . . . . . . . . . 0.1 0.1 0.1 0.1 0.1 0.1 1.3Other . . . . . . . . . . . . . . . . . . . . . . . . 2.0 2.2 2.9 3.5 3.5 4.1 3.2Total Non-OECD . . . . . . . . . . . . . 86.7 97.8 106.8 117.2 129.3 141.3 2.1
Total World. . . . . . . . . . . . . . . . . . . . 128.5 140.7 150.9 161.9 175.6 190.7 1.7
Note: The projections of regional coal production represent the sum of consumption and exports by region, less imports. With theexception of the United States, Canada, and Mexico, the projected levels of coal trade in the IEO2009 forecast represent seaborneshipments of coal, excluding generally small quantities of non-seaborne or overland coal trade.
Sources: 2006: Energy Information Administration (EIA), International Energy Annual 2006 (June-December 2008), web sitewww.eia.doe.gov/iea. Projections: EIA, World Energy Projections Plus (2009); and National Energy Modeling System, runIEO2009.D040709E.

continue to be met by domestic production. Coal pro-duction in Australia/New Zealand and Other non-OECD Asia also is projected to rise substantially. Theincrease in coal production for Australia/New Zealand(4.6 quadrillion Btu) is expected to be used primarily forexports from Australia. Production growth in Othernon-OECD Asia (4.0 quadrillion Btu) is attributable toboth rising levels of coal consumption and exports. Theprojected increases in coal production for these fiveregions dominate the overall trends for the OECD andnon-OECD, accounting for virtually all the increase innet production for OECD countries and 90 percent of theincrease for non-OECD countries. Rising internationaltrade also is expected to support production increases inRussia, Africa, and Central and South America (exclud-ing Brazil).
World Coal TradeAt the end of 2008, in response to the global economiccrisis, worldwide demand for coal imports fell precipi-tously, and the ensuing coal supply glut promptedmany mines in coal exporting countries to lower theirproduction levels. Although the break from intenseglobal coal demand could provide an opportunity forcoal trade infrastructure—including mine, rail, and portcapacity—an opportunity to catch up with the previousyears’ fast-paced growth, many infrastructure projectsin the early stages are likely to be deferred. Projects thatare in progress, however, are assumed to continue.Despite the global economic crisis, the duration of whichis uncertain, over the long run the volumes of total coaltraded internationally increase steadily through 2030(Table 8). The increase in coal trade through 2030 reflectsthe projected worldwide growth in coal consumptionfor the same period, particularly in non-OECD Asia.
Trade in coking coal—an essential input for the produc-tion of iron used to make steel—has been subject torecent cutbacks, with some companies reducing steeloutput by as much as 30 percent; however, many coun-tries are adopting economic stimulus packages to sup-port infrastructure investments, which presumably willrequire steel. The impact of the stimulus packages oncoal markets is uncertain and is not explicitly repre-sented in the IEO2009 projections. In the long run, whenthe current glut of steel in the market has been workedthrough and economic growth resumes, demand forimports of coking coal is expected to begin rising again.
Although both steam coal and coking coal are tradedinternationally, most of the trade is in steam coal, whichrepresents 72 percent of world coal trade in 2030, similarto current levels. In 2007, 58 percent of the world’sexported steam coal was imported by Asian countries,and their share of the total in 2030 is projected to be 65percent. The share of coking coal imports destined for
Asian countries increases from 61 percent in 2007 to 67percent in 2030.
International coal trade accounted for about 16 percentof total world coal consumption in 2007, and in theIEO2009 reference case it is projected to grow at an aver-age annual rate of 1.2 percent, from about 20.8 quadril-lion Btu in 2007 to 27.6 quadrillion Btu in 2030. Becausethe largest increases in coal consumption through 2030are projected for non-OECD Asia—particularly China,which is expected to meet most of the increase in its coaldemand with domestic supply rather than seaborneimports—the share of coal trade as a percentage ofglobal coal consumption falls to 14 percent in 2030. Aus-tralia and Indonesia are well situated geographically tocontinue as the leading suppliers of internationallytraded coal, especially to Asia, over the period. SouthAmerica is projected to expand its role as an interna-tional supplier of coal, primarily as a result of increasingcoal production in Colombia.
Coal Exports
The top four exporters of steam coal in 2007 were Indo-nesia, Australia, South America (Colombia and Vene-zuela), and southern Africa (South Africa, Mozambique,and Botswana). Although Indonesia currently is theworld’s largest exporter of steam coal, Australia isexpected to be the leader in most years of the projection,after many of its capacity investments are in place. Chinais projected to be only the sixth-largest exporter of steamcoal in 2030. Australia, Canada, and the United Statesrank as the three top exporters of coking coal over theprojection period. Among the regions expected toexpand their international coal trade by 2030 are Austra-lia, South America, southern Africa, and Eurasia (pri-marily Russia). In Vietnam and China, increases indomestic demand for coal are expected to constrain coalexports.
Already the world’s leading exporter of coal, Australiadominates future international coal trade in the refer-ence case as it continues to improve its inland transpor-tation and port infrastructure to expedite coal shipmentsto international markets. A new coal terminal at Koora-gang Island, in New South Wales, will add about 1.5quadrillion Btu of capacity, about half of which isexpected to be operational by 2011 [20]. Expansion ofQueensland’s Dalrymple Bay port in 2009 is expected toincrease its annual export capacity from about 1.8 qua-drillion Btu to 2.2 quadrillion Btu [21]. Australia remainsthe primary exporter of metallurgical coal to Asian mar-kets, supplying about 76 percent of Asia’s importdemand for coking coal in 2030, compared with about 70percent in 2007.
Russia is among the coal-exporting countries that haveshown some indication of pulling back in the short term
Energy Information Administration / International Energy Outlook 2009 55

56 Energy Information Administration / International Energy Outlook 2009
Table 8. World Coal Flows by Importing and Exporting Regions, Reference Case, 2007, 2015, and 2030(Quadrillion Btu)
Exporters
Importers
Steam Coking Total
Europea Asia Americas Totalb Europea Asiac Americas Totalb Europea Asia Americas Totalb
2007Australia . . . . . . . . . . . 0.11 2.64 0.13 2.88 0.85 2.62 0.22 3.68 0.96 5.25 0.34 6.56
United States. . . . . . . . 0.24 0.00 0.33 0.57 0.56 0.03 0.29 0.88 0.80 0.03 0.62 1.45
Southern Africad . . . . . 1.30 0.30 0.03 1.66 0.02 0.00 0.00 0.02 1.32 0.30 0.03 1.68
Eurasia . . . . . . . . . . . . 1.14 0.36 0.01 1.51 0.08 0.11 0.00 0.18 1.22 0.46 0.01 1.69
Poland . . . . . . . . . . . . . 0.16 0.00 0.00 0.16 0.01 0.00 0.00 0.01 0.17 0.00 0.00 0.17
Canada . . . . . . . . . . . . 0.01 0.08 0.02 0.11 0.22 0.40 0.10 0.73 0.23 0.48 0.12 0.83
China . . . . . . . . . . . . . . 0.07 1.22 0.01 1.29 0.00 0.07 0.00 0.07 0.07 1.29 0.01 1.36
South Americae . . . . . . 1.00 0.00 0.89 1.90 0.00 0.00 0.00 0.00 1.00 0.00 0.89 1.90
Vietnam . . . . . . . . . . . . 0.00 0.62 0.00 0.62 0.00 0.00 0.00 0.00 0.00 0.62 0.00 0.62
Indonesiaf . . . . . . . . . . 0.43 3.34 0.16 3.99 0.00 0.52 0.00 0.52 0.43 3.86 0.16 4.52
Total . . . . . . . . . . . . . 4.46 8.56 1.57 14.69 1.73 3.74 0.61 6.08 6.19 12.30 2.18 20.77
2015
Australia . . . . . . . . . . . 0.03 4.10 0.01 4.14 0.38 3.19 0.24 3.80 0.41 7.28 0.25 7.95
United States. . . . . . . . 0.37 0.02 0.21 0.60 0.52 0.03 0.37 0.93 0.90 0.05 0.58 1.53
Southern Africad . . . . . 1.64 0.50 0.14 2.27 0.05 0.08 0.02 0.15 1.68 0.58 0.15 2.42
Eurasia . . . . . . . . . . . . 1.42 0.49 0.00 1.90 0.07 0.21 0.00 0.28 1.49 0.69 0.00 2.18
Poland . . . . . . . . . . . . . 0.13 0.00 0.01 0.14 0.03 0.00 0.00 0.03 0.15 0.00 0.01 0.16
Canada . . . . . . . . . . . . 0.03 0.00 0.07 0.11 0.48 0.32 0.07 0.87 0.51 0.32 0.14 0.97
China . . . . . . . . . . . . . . 0.00 0.97 0.00 0.97 0.00 0.02 0.00 0.02 0.00 0.99 0.00 0.99
South Americae . . . . . . 1.79 0.00 0.97 2.76 0.00 0.00 0.00 0.00 1.79 0.00 0.97 2.76
Vietnam . . . . . . . . . . . . 0.00 0.24 0.00 0.24 0.00 0.00 0.00 0.00 0.00 0.24 0.00 0.24
Indonesiaf . . . . . . . . . . 0.00 3.73 0.08 3.81 0.01 0.49 0.00 0.50 0.01 4.22 0.08 4.31
Total . . . . . . . . . . . . . 5.41 10.03 1.49 16.94 1.53 4.35 0.70 6.58 6.94 14.38 2.19 23.51
2030
Australia . . . . . . . . . . . 0.00 5.51 0.00 5.51 0.64 3.92 0.41 4.97 0.64 9.43 0.41 10.48
United States. . . . . . . . 0.25 0.01 0.31 0.57 0.31 0.00 0.31 0.62 0.56 0.01 0.62 1.19
Southern Africad . . . . . 0.99 1.29 0.20 2.47 0.05 0.17 0.03 0.24 1.04 1.46 0.22 2.72
Eurasia . . . . . . . . . . . . 1.41 0.59 0.00 2.00 0.14 0.24 0.00 0.39 1.56 0.83 0.00 2.39
Poland . . . . . . . . . . . . . 0.07 0.00 0.02 0.09 0.01 0.00 0.00 0.01 0.08 0.00 0.02 0.10
Canada . . . . . . . . . . . . 0.00 0.00 0.00 0.00 0.39 0.30 0.25 0.94 0.39 0.30 0.25 0.94
China . . . . . . . . . . . . . . 0.00 0.97 0.00 0.97 0.00 0.02 0.00 0.02 0.00 0.99 0.00 0.99
South Americae . . . . . . 2.15 0.38 1.43 3.95 0.00 0.00 0.00 0.00 2.15 0.38 1.43 3.95
Vietnam . . . . . . . . . . . . 0.00 0.24 0.00 0.24 0.00 0.00 0.00 0.00 0.00 0.24 0.00 0.24
Indonesiaf . . . . . . . . . . 0.00 3.91 0.17 4.08 0.00 0.50 0.00 0.50 0.00 4.41 0.17 4.58
Total . . . . . . . . . . . . . 4.87 12.90 2.12 19.88 1.54 5.16 1.00 7.70 6.41 18.06 3.12 27.58
aEurope/Mediterranean, including coal shipments to the Middle East and Africa.bIn 2007, total world coal flows include a balancing item used to reconcile discrepancies between reported exports and imports. The 2007
balancing items by coal type were 0.098 quadrillion Btu (steam coal), 0.002 quadrillion Btu (coking coal), and 0.102 quadrillion Btu (total).cIncludes 0.50 quadrillion Btu of coal for pulverized coal injection at blast furnaces shipped to Japanese steelmakers in 2007.dSouthern Africa includes South Africa, Mozambique, and Botswana.eCoal exports from South America are projected to originate from mines in Colombia and Venezuela.fIncludes shipments from other countries not modeled for the projection period. The 2007 exports from other countries by coal type were
0.10 quadrillion Btu (steam coal), 0.02 quadrillion Btu (coking coal), and 0.12 quadrillion Btu (total).Notes: Data exclude non-seaborne shipments of coal to Europe and Asia. Totals may not equal sum of components due to independent
rounding.Sources: 2007: SSY Consultancy and Research, Ltd., SSY’s Coal Trade Forecast, Vol. 17, No. 1 (London, UK, July 2008); and Energy
Information Administration, Quarterly Coal Report, October-December 2007, DOE/EIA-0121(2007/4Q) (Washington, DC, March 2008).2015 and 2030: Energy Information Administration, National Energy Modeling System, run IEO2009.D040709E.

in the wake of softening global demand for coal. Forexample, Mechel, a Russian producer of metallurgicalcoal, plans to reduce capital expenditures over the next 5years in response to the global economic slowdown [22];and Evraz, another Russian coal producer, has given upa license to develop a coking coal resource in theMezhegey coal deposit [23].
Hurt by weak cash flows, some coal producers are hop-ing to benefit from a portion of Russia’s multibillion-dollar stimulus package [24]. Some planned infrastruc-ture improvements may be delayed in the short term asrail tariffs, which are needed to support some of theinvestments, are reduced and some coal mines close orreduce production [25]; however, as demand growthresumes, Russia is expected to expand its coal supplycapability. For example, coal exports to Asia will be facil-itated by capacity expansion at the new port of Muchka,where SUEK (Siberian Coal Energy Company) has builtabout 0.3 quadrillion Btu of an annual export capacity,and Mechel has plans for about 0.7 quadrillion Btu ofexport capacity at the new Muchka Bay Terminal 2 [26].From an 8-percent share in 2007, Eurasia (primarily Rus-sia) is expected to supply 9 percent of the coal tradedinternationally in 2030.
South America is projected to remain the third-largestexporter of coal worldwide in 2030, primarily as a resultof continued increases in exports from Colombia. Theexpansion will require investments in mine capacity, railinfrastructure, and port capacity, such as the currentproposal to build a tunnel that would expedite coaltransportation via truck to Colombia’s Pacific Oceanport of Buenaventura when it is completed in 2013.Expansion projects on Colombia’s Caribbean coastinclude a coal terminal at the port of Cienaga and anexpanded river-to-port terminal at Barranquilla, eachwith an annual capacity of about 0.9 quadrillion Btu [27].
Indonesia also has demonstrated its potential for signifi-cant growth in coal exports, with an increase of about 3.7quadrillion Btu in annual exports over the past decade.From 2007 to 2030, Indonesia’s annual coal exports areprojected to average about 4.5 quadrillion Btu; however,continued strength in Indonesia’s coal exports dependson investment in resource exploration, the developmentof new mines, and the ability to attract foreign invest-ment. In late 2008, despite global financial uncertainty,Coal India announced plans to acquire Indonesian coalreserves. The Indonesian company PT Adaro EnergyTbk also reiterated plans to expand its export capacityfrom about 1.0 quadrillion Btu to 1.8 quadrillion Btu by2013 and pursue other investments that would lowerinternal transportation costs [28]. Over the long term,areas of uncertainty for Indonesian exports include therate of growth in its domestic coal consumption, the ade-quacy of its internal transportation infrastructure, and
environmental concerns. Through 2030, Indonesia isexpected to continue to be an important source of coalsupply coal to other nations.
Despite strong growth in coal exports from Vietnambetween 2003 and 2007, the government plans to restrictexports in the future. State-owned Vinacomin, the larg-est coal producer in Vietnam, has announced plans tobegin importing coal from Indonesia [29]. In theIEO2009 reference case, Vietnam’s coal exports declineslightly in the short term as a result of softening globaldemand (rather than burgeoning domestic coal con-sumption). In later years, however, Vietnam’s domesticcoal demand is expected to compete more strongly forthe country’s limited domestic coal production.
The African countries of Mozambique and Botswana areexpected to play an emerging role in world coal trade, asimporting countries seek to secure additional sources ofsupply. For example, India’s Tata Steel, Brazil’sCompanhia Vale do Rio Doce (CVRD), and Australia’sRiversdale all have financial stakes in mine operations inthe Moatize basin of Mozambique [30]. An expansion ofthe port of Beira in Mozambique to handle an annualcapacity of about 0.5 quadrillion Btu is also planned [31],and the rail link between Moatize coal basin and Beira(Sena Railway) is being updated. Interest in Botswanaincludes plans to expand mining and to construct a rail-road that will connect inland coal mines to a port on theNamibian coast.
South Africa’s coal exports have remained flat over thepast few years, with a permanent solution for domesticinfrastructure and energy supply problems yet to befound; however, coal mining is expected to continueplaying an important role in South Africa’s economy. Ascheduled expansion of the Richards Bay Coal Terminalto about 2.2 quadrillion Btu of annual capacity in 2009will support South Africa’s continued role as an interna-tional coal supplier [32].
Coal Imports
Asia
Asia poses a large area of uncertainty for world coaltrade projections. In particular, China has the potentialto influence the market both as an importer and as anexporter. For example, a significant increase in China’scoal imports could put upward pressure on world coalprices. In the IEO2009 reference case, China’s coalimports total 3.3 quadrillion Btu and its exports total 1.0quadrillion Btu in 2030. Even with a substantial increasein imports, however, most of the coal consumed inChina will continue to be supplied by its own coalmines.
India’s coal imports in 2030 are projected to be threetimes the 2007 level, spurred by rising imports of both
Energy Information Administration / International Energy Outlook 2009 57

coking and steam coal. India’s large electricity plantsplanned for coastal areas are to be fueled by importedsteam coal. In light of current limits on available globalinvestment capital and the size and associated risk of theprojects, however, it is uncertain whether India’smega-size coal plants will meet their original timelines.The Indian government is trying to accelerate invest-ment in generation and infrastructure, but recent solici-tations have resulted in fewer bids than expected [33].Planned investments in India also include port expan-sions at Paradip and Goa [34].
India has domestic resources of coking coal, but theirquality is poor in comparison with foreign-sourced cok-ing coal. India’s long-term plans include expansion of itssteel industry to between 165 and 198 million tons ofcrude steel output by 2020, up from about 59 milliontons in 2007 [35], with increased imports of coking coalsupporting the expansion. Growth in steel production isnecessary for India to expand and improve infrastruc-ture essential for economic development.
Although 2001 marked the final year of significant Japa-nese coal production [36], Japan has continued to rely oncoal and is expected to remain the world’s largest coalimporter in most years of the projection. Australia pro-vides for about 60 percent of Japan’s coal supply (bothsteam and metallurgical coal), and China supplies about20 percent of its steam coal imports. Japan’s purchases ofcoal from Indonesia increased by 157 percent between2000 and 2007. Japanese companies also have pursuedinvestments in coal production in other countries,including Russia and Canada [37].
Because Japan lacks significant resources of its own, it islikely to continue seeking diverse sources of long-termsupply even during the global economic recession. Inthe short term, however, Japan (along with other coun-tries that import coking coal) reportedly is trying to cutback on contracted imports of coking coal. Japan is aleader in steel production, ranking second only to Chinaamong world steel producers [38], and is projected tocontinue to import coking coal for use in its steelmakingplants in 2030.
South Korea also is expected to continue importing mostof the coal it consumes. With planned increases incoal-fired generating capacity, South Korea and Taiwantogether are projected to maintain a share of worldimports at about 16 percent in 2030 despite sizableincreases in coal imports by other countries.
Europe, Middle East, and Africa
In the IEO2009 reference case, total coal imports to theEurope/Mediterranean market (including the MiddleEast and Africa) in 2030 are slightly above 2007 levels(Figure 47). With most European countries placinggreater emphasis on natural gas in their power sectors,
coal becomes a less significant component of the fuelmix for electricity generation. In Turkey, however, elec-tricity demand and steel industry growth are projectedto offset some of the decline in Europe’s coal imports.Italy’s conversion of power plants from oil to coal also isprojected to increase its coal imports, and Germany’splanned closure of its remaining hard coal mines by 2018is expected to result in increasing imports of coal forelectricity generation [39]. Europe’s demand for lowersulfur coal (from South America and Eurasia, for exam-ple) will be tempered over time by the gradual additionof flue gas desulfurization equipment at existingcoal-fired power plants. In the Middle East, Israelaccounts for the largest portion of the increase in coalimports over the projection period as it expands its useof coal-fired generation.
The Americas
In the mid- to long term, port expansions are expected tofacilitate U.S. coal imports, which increase by about 1.1quadrillion Btu from 2007 to 2030. In 2008, Kinder Mor-gan Energy Partners LP completed an expansion ofannual capacity at its import terminal in Newport News,Virginia, by 6 million tons (about 0.4 quadrillion Btu);and in late 2009, it received an air permit enabling it toexpand its coal terminal in Jacksonville, Florida [40].Although imports remain a relatively small share of U.S.coal consumption in 2030 (4 percent), the increase repre-sents a shift for the United States from a net exporter of
58 Energy Information Administration / International Energy Outlook 2009
1995 2000 2007 2015 2020 2025 20300
5
10
15
20
25
30Quadrillion Btu
History Projections
Europe/Mediterranean
Asia
Total
Americas
Figure 47. Coal Imports by Major ImportingRegion, 1995-2030
Sources: History: SSY Consultancy and Research, Ltd.,SSY’s Coal Trade Forecast, Vol. 17, No. 1 (London, UK, July2008); International Energy Agency, Coal Information 2008(Paris, France, August 2008), and previous issues; and EnergyInformation Administration (EIA), Quarterly Coal Report, Octo-ber-December 2007, DOE/EIA-0121(2007/4Q) (Washington,DC, March 2008), and previous issues; Btu conversions fromshort tons are estimates by EIA’s Office of Integrated Analysisand Forecasting. Projections: EIA, National Energy ModelingSystem run IEO2009.D040709E.

coal to a net importer. With declining productivity andmining difficulties in Central Appalachia and risingdomestic demand for coal, imports are expected tobecome increasingly competitive for coastal States in theEast and Southeast. South America (Colombia, in partic-ular) is expected to be an important source of U.S. coalimports.
Canada has been the largest importer of U.S. coal inrecent years, but exports of U.S. steam coal to Canada in2030 are projected to fall below their 2007 level. A por-tion of Ontario’s coal-fired generating capacity isexpected to be shut down over the projection period forenvironmental reasons, as legislated by the Provincialgovernment.
Brazil’s steelmaking capacity is projected to more thandouble by 2018, to 88 million tons from 37 million tons in2007 [41]. With rich reserves of iron ore but no coking-grade coal, Brazil’s steel industry will need moreimports of coking coal from Australia, Canada, theUnited States, and southern Africa. Overall, SouthAmerica’s imports of coking coal—driven primarily bydemand in Brazil—are projected to grow from about 0.4quadrillion Btu in 2007 to 0.9 quadrillion Btu in 2030.
World Coal ReservesTotal recoverable reserves of coal around the world areestimated at 929 billion tons—reflecting a currentreserves-to-production ratio of 137 (Table 9).21 His-torically, estimates of world recoverable coal reserves,although relatively stable, have declined gradually from1,145 billion tons in 1991 to 1,083 billion tons in 2000 and929 billion tons in 2006 [42]. The most recent assessmentof world coal reserves includes a substantial downwardadjustment for India, from 102 billion tons in 2003 to 62billion tons in 2006—reportedly attributable to betterdata, which permitted the estimation of recoverable coalreserves as compared with previous estimates ofin-place coal reserves. Estimated reserves for OECDEurope of 32 billion tons in the most recent assessmentalso are substantially lower than the 2003 assessment of43 billion tons. Much of the downward adjustment forOECD Europe is a result of lower estimates for Poland,Turkey, and the Czech Republic. Poland’s reassessmentof estimated recoverable coal reserves from 15 billiontons in 2003 to 8 billion tons in 2006 reflects the use ofmore restrictive criteria for geologic reliability [43].
Energy Information Administration / International Energy Outlook 2009 59
Table 9. World Recoverable Coal Reserves as of January 1, 2006(Billion Short Tons)
Region/Country
Recoverable Reserves by Coal Rank
2006Production
Reserves-to-Production
Ratio (Years)
Bituminousand
AnthraciteSubbitumi-
nous Lignite Total
World Total . . . . . . . . . . . . . . . . . . . . . . 471.3 293.1 164.9 929.3 6.8 137United Statesa. . . . . . . . . . . . . . . . . . . . . 120.1 109.3 33.3 262.7 1.2 226Russia. . . . . . . . . . . . . . . . . . . . . . . . . . . 54.1 107.4 11.5 173.1 0.3 536China . . . . . . . . . . . . . . . . . . . . . . . . . . . 68.6 37.1 20.5 126.2 2.6 48Other Non-OECD Europe and Eurasia. . 49.1 19.0 27.3 95.3 0.3 293Australia and New Zealand . . . . . . . . . . 40.9 2.5 41.6 85.1 0.4 200India . . . . . . . . . . . . . . . . . . . . . . . . . . . . 57.6 0.0 4.7 62.3 0.5 125Africa . . . . . . . . . . . . . . . . . . . . . . . . . . . 54.5 0.2 0.0 54.7 0.3 199OECD Europe. . . . . . . . . . . . . . . . . . . . . 9.3 3.4 19.0 31.7 0.7 48Other Central and South America . . . . . 8.0 2.2 0.0 10.2 0.1 129Other Non-OECD Asia . . . . . . . . . . . . . . 2.5 2.7 4.5 9.7 0.3 29Brazil. . . . . . . . . . . . . . . . . . . . . . . . . . . . 0.0 7.8 0.0 7.8 0.0 1,109Canada . . . . . . . . . . . . . . . . . . . . . . . . . . 3.8 1.0 2.5 7.3 0.1 100Otherb . . . . . . . . . . . . . . . . . . . . . . . . . . . 2.9 0.5 0.1 3.4 0.0 195aData for the United States represent recoverable coal estimates as of January 1, 2008.bIncludes Mexico, Middle East, Japan, and South Korea.Sources: United States: Energy Information Administration (EIA), unpublished data from the Coal Reserves Database (March
2009). All Other Countries: World Energy Council, 2007 Survey of Energy Sources, 21st Edition (London, UK: Elsevier, September2007), and EIA, International Energy Annual 2006 (June-December 2008), web site www.eia.doe.gov/iea.
21 Recoverable reserves are those quantities of coal which geological and engineering information indicates with reasonable certainty canbe extracted in the future under existing economic and operating conditions. Because recoverable reserves are a subset of total coal re-sources, recoverable reserve estimates for a number of countries, including China and the United States, could increase substantially as coalmining technology improves and as additional geological assessments of the coal resource base are completed. The reserves-to-productionratio is based on the reserves estimates and data on world coal production for 2006 shown in Table 9.

Although coal deposits are widely distributed, 80 per-cent of the world’s recoverable reserves are located infive regions: the United States (28 percent), Russia (19percent), China (14 percent), Other Non-OECD Europeand Eurasia (10 percent), and Australia/New Zealand (9percent). In 2006 those five regions, taken together, pro-duced 4.9 billion tons (95.8 quadrillion Btu) of coal, rep-resenting 71 percent (75 percent on a Btu basis) of totalworld coal production [44]. By rank, anthracite and bitu-minous coal account for 51 percent of the world’s esti-mated recoverable coal reserves on a tonnage basis,subbituminous coal accounts for 32 percent, and ligniteaccounts for 18 percent.
Quality and geological characteristics of coal depositsare important parameters for coal reserves. Coal is a het-erogeneous source of energy, with quality (for example,characteristics such as heat, sulfur, and ash content)varying significantly by region and even within individ-ual coal seams. At the top end of the quality spectrumare premium-grade bituminous coals, or coking coals,used to manufacture coke for the steelmaking process.Coking coals produced in the United States have an esti-mated heat content of 26.3 million Btu per ton and rela-tively low sulfur content of approximately 0.8 percent byweight [45]. At the other end of the spectrum arereserves of low-Btu lignite. On a Btu basis, lignitereserves show considerable variation. Estimates pub-lished by the International Energy Agency for 2006 indi-cate that the average heat content of lignite in majorproducing countries varies from a low of 4.5 million Btuper ton in Greece to a high of 12.4 million Btu per ton inCanada [46].
References
60 Energy Information Administration / International Energy Outlook 2009
1. “Mexico Adding Coal Generation As Natural GasReserves Dwindle,” Platts Coal Outlook, Vol. 32, No.2 (January 14, 2008), p. 5.
2. Energy Information Administration, InternationalEnergy Annual 2006 (June-December 2008), Table5.4, web site www.eia.doe.gov/iea; and Interna-tional Energy Agency, Databases for Coal Informa-tion: 2006 Edition: Coal Production, Trade, Demand(II.3, II.8), web site www.iea.org.
3. “PiE’s New Plant Tracker—January 2009,” Power inEurope, No. 542 (January 12, 2009).
4. International Energy Agency, Coal Information 2008(Paris, France, August 2008), pp. III.195 and III.203.
5. Korea Electric Power Corporation, web sitewww.kepco.co.kr; Korea East-West Power Co.,Ltd., web site www.ewp.co.kr; Korea South-EastPower Co., Ltd., web site www.kosep.co.kr; KoreaMidland Power Co., Ltd., web site www.komipo.co.kr; Korea Western Power Co., Ltd, web sitewww.westernpower.co.kr; and Korea SouthernPower Co., Ltd., web site www.kospo.co.kr.
6. A. Sagawa and K. Koizumi, “Present State and Out-look of China’s Coal Industry” (December 2007: TheInstitute of Energy Economics, Japan), web sitehttp://eneken.ieej.or.jp/data/en/data/pdf/410.pdf; D. Miller, “7 China Stocks To Turn Crisis IntoOpportunity,” (January 7, 2009), web site http://seekingalpha.com/article/113583-7-china-stocks-to-turn-crisis-into-opportunity; M. Hutchinson,“Five Ways To Profit From China’s Stimulus Plan”(November 11, 2008), web site http://seekingalpha.com/article/105309-five-ways-to-profit-from-china-s-stimulus-plan; China Mining Association,“China To Invest 150 Bln Yuan in Railways inCoal-Rich Shanxi Province” (December 8, 2008),web site www.chinamining.org/Investment/2008-12-08/1228698848d19914.html; China MiningAssociation, “Shenhua Group Corp Coal MinerStarts Mongol Railway” (January 9, 2009), web sitewww.chinamining.org/Investment/2009-01-21/1232500635d21200.html; and Wang Xiaolin,“Shenhua Group—Present and Future” (Beijing,China, April 23, 2004), web site www.iea.org/Textbase/work/2004/coal/ShenhuaEng.pdf.
7. International Iron and Steel Institute, web sitewww.worldsteel.org.
8. “Shenua CTL Project Delayed; To Come OnlineNext Year,” Dow Jones International News (February26, 2009).
9. R.L. Hershey, Coal-to-Liquids Production in China:Final Report, prepared by Z, Inc., for the EnergyInformation Administration, Contract No. DE-AT01-07EI40197 (February 20, 2008), pp. 6-8.
10. Central Electricity Authority & Confederation ofIndian Industry, White Paper on Strategy for 11th Plan(August 2007), web site http://cea.nic.in/planning/white%20paper.pdf; and Government ofIndia, Central Electricity Authority, Power Scenarioat a Glance (January 2009), web site www.cea.nic.in.
11. Government of India, Outcome Budget of Ministry ofPower 2007-2008 (April 2007), pp. 92-93, web sitewww.powermin.nic.in/reports/pdf/Outcome_Budget_2007-08.pdf; and Government of India,Ministry of Power, Development of Ultra Mega PowerProjects (October 2007), web site http://powermin.nic.in/whats_new/pdf/development_of_project.pdf.
12. S. Mahnovski and T. Gustafson, The RussianLong-Range Power Plan: An Uneasy Marriage of Cen-tral Planning and Markets (Cambridge EnergyResearch Associates, June 11, 2008), web site www.cera.com/aspx/cda/client/report/reportpreview.aspx?CID=9549&KID= (subscription site).
13. S. Shuster and J. Cowhig, “Russia Power FirmsTurn Away From Coal As Cost Surges” (Reuters

Energy Information Administration / International Energy Outlook 2009 61
UK, July 7, 2008), web site http://uk.reuters.com/article/oilRpt/idUKL0749460320080707.
14. “New Power Generation Project Tracker January2009,” Platts Energy in East Europe, No. 137 (January30, 2009), web site www.platts.com (subscriptionsite).
15. Eskom, Annual Report 2008 (July 2008), web sitewww.eskom.co.za/annreport08; and Eskom, NewBuild News, Issue 6 (January 2009),” web sitewww.eskom.co.za/content/New%20Build%20News%20%20(Issue%206%20Jan%202009).pdf.
16. Platts, “Analysis: Africa Coal,” Energy Economist,Issue 328 (February 1, 2009), web site www.platts.com/Electric%20Power/Newsletters%20&%20Reports/Energy%20Economist (subscription site);allAfrica.com, “Mozambique: Riversdale HopesTo Export Tete Coal by Late 2010” (February 10,2009), web site http://allafrica.com/stories/200902100592.html; Global Insight, Inc., “ChineseFirm To Invest US$970 mil. In New Coal-FiredPower Plant in Botswana” (December 3, 2008), website www.globalinsight.com (subscription site); andGlobal Insight, Inc., “Botswana’s Mmamabula CoalProject on Track for Start-Up in Late 2012” (Decem-ber 5, 2008); web site www.globalinsight.com (sub-scription site).
17. Sasol, Sasol Facts 08: A Blueprint to the World of SasolEdition (May 2008), web site http://sasol.investoreports.com/sasol_sf_2008/index.php; Ericvan de Venter, “Update on the Sasol-Lurgi Technol-ogy Company Business Activities and the Applica-tion of the S-L FBDB Gasification Technology(Including an Overview of Sasol’s CTL BusinessActivities),” presentation at the 2007 GasificationTechnologies Council Conference (San Francisco,CA, October 15-17, 2007), web site http://www.gasification.org/Docs/Conferences/2007/10VAND.pdf; and Energy Information Administra-tion, International Energy Annual 2006 (June- Decem-ber 2008), Table 1.2, web site www.eia.doe.gov/iea.
18. International Iron and Steel Institute, Steel in Fig-ure: Search statistics archive, Steel production, website www.worldsteel.org; and Energy InformationAdministration, International Energy Annual 2006(June-December 2008), Table E.4, web site www.eia.doe.gov/iea.
19. R. Pregnaca, “Can Brazil Live Up to Its Steel Power-house Billing?,” American Metal Market (August 21,2008), web site amm.com/2008-08-21_16-39-54.html (subscription site); and “Brazil Steel SectorSees Output Up 135 pct by 2018,” Reuters (January29, 2008), web site www.reuters.com/article/companyNews/idUSN2941534820080129.
20. I. Kirkwood, “Deciphering the Coal Industry,” TheNewcastle Herald (January 3, 2009), web site www.
nswtrains.com.au/nsw-trains-articles/2009/1/3/deciphering-the-coal-industry.
21. T. Grant-Taylor, “Australia’s Dalrymple Bay CoalTerminal Expansion Delayed,” Herald Sun (May 29,2008), web site www.news.com.au/heraldsun/story/0,21985,23774661-664,00.html.
22. P. Devitt, R. Paxton, and A. Barker, “RPT—Russia’sMechel To Scale Back $5.5 bln Capex Plan,” Reuters(October 30, 2008), web site www.reuters.com/article/companyNewsAndPR/idUSLU23894120081030.
23. “Evraz Abandons Right To Develop RussianCoal Reserve,” Business News Europe, InvestorWeekly (January 26, 2009), web site www.businessneweurope.eu/dispatch7350 (subscriptionsite).
24. A. Kueppers and P. Blackburn, “Russia CokingCoal Firms Seek State Relief Package,” Reuters(November 27, 2008), web site www.reuters.com/article/companyNewsAndPR/idUSLR54777620081127.
25. “Russian Rail Bottlenecks Trim Shipments,” ArgusCoal Transportation Report, Vol. 28, No. 4 (January27, 2009 ), p. 8.
26. “SUEK of Russia Started Coal Shipments to JapanThrough Muchka; Two Cargoes of 20,000 MT EachAfter Turn of the Year,” Tex Energy Report (February3, 2009), web site www.texreport.co.jp/xenglish(subscription site); I. Zhitomirsky, Mechel, News,“Mechel OAO Commences Construction of CoalTransshipment Complex at Vanino Port” (Septem-ber 9, 2008), web site www.mechel.com/news/article.wbp?article-id=96E8D4FA-6F89-42F6-A6ED-E0664ABC37CD.
27. “Colombia Moves Ahead on Port Expansions,”Argus Coal Transportation Report, Vol. 28, No. 4 (Jan-uary 29, 2009), pp. 6-7.
28. B. Cassell, “Adaro Takes Hard Look at Budget ButStill Plans Big Coal Expansion,” SNL Interactive(February 4, 2009), web site www.snl.com (sub-scription site).
29. B. Thomas and W. Zhu, “Vietnam To Cut CoalExports, May Phase Out Shipments (Update 2),”Bloomberg (February 15, 2008), web site www.bloomberg.com/apps/news?pid=newsarchive&sid=axT.gsmXorfw.
30. “Moatize Basin Shaping Up As a Coal Province—Riversdale,” Steel Guru (September 11, 2008), website http://steelguru.com/news/index/2008/09/11/NjI2NDA%3D/Moatize_Basin_shaping_up_as_a_coal_province_-_Riversdale. html.
31. C. Mangwiro, “Mozambique in Talks To Fund $180Mln Coal Terminal,” Reuters (September 29, 2007),
62 Energy Information Administration / International Energy Outlook 2009
web site www.reuters.com/article/bondsNews/idUSL2920474220070929.
32. Richards Bay Coal Terminal Company Limited,“Phase V Expansion,” web site www.rbct.co.za/default.asp?id=1087 (not dated).
33. S. Saraf, “India Responds to Global Crisis,” Platt’sPower in Asia, No. 520 (January 22, 2009), p. 11.
34. “Paradip Port Invites Financial Bids for 2 Deep-Draught Berths,” Business Line (January 6, 2009),web site www.mjunction.in/market_news/logistics_1/paradip_port_invites_financial.php;“Govt Clears Three Port Projects Worth Rs 2,000 cr,”The Economic Times (January 9, 2009), web site www.mjunction.in/market_news/logistics_1/govt_clears_three_port_project.php.
35. B. Mukherji, “Reforms Seen Failing To RemoveIndian Mine Shackles,” Reuters (October 7,2007), web site www.reuters.com/article/companyNewsAndPR/idUSSP7159720071009; andWorld Steel Organization, Media Centre, NewsReleases, “World Crude Steel Production Decreasesby 1.2% in 2008,” web site www.worldsteel.org/?action=newsdetail&id=257.
36. Energy Information Administration, InternationalEnergy Annual 2006 (June-December 2008), Table2.5, web site www.eia.doe.gov/iea.
37. Y. Inoue and H. Lawson, “Japan’s Sumitomo CorpEyes Russia’s Elga Coal Mine,” Reuters (November21, 2007), web site http://uk.reuters.com/article/oilRpt/idUKT26814420071121; and B.Cassell, “Japan’s Mitsui Takes Bigger Stake in Can-ada’s Cline Mining,” SNL Interactive (July, 9, 2008),web site www.snl.com (subscription site).
38. World Steel Organization, Media Centre, NewsReleases, “World Crude Steel Production Decreasesby 1.2% in 2008,” web site www.worldsteel.org/?action=newsdetail&id=257.
39. C. Dougherty, “Germany Finds Solution to ItsWithering Coal Mines,” International Herald Tribune(June 14, 2007), web site www.iht.com.
40. W. Browning and K. Morgan “Coal Markets in 2009:Let the Games Begin Anew,” Presentation to the 7thAnnual Coal Trading Conference, December 11-12,New York, NY, World Coal Trading Association,Events, web site www.coaltrade.org/events/documents/Browning.pdf.
41. “Jim Walters Links Mine and Port Expansions,”Argus Coal Transportation Report, Vol. 26, No. 23(November 6, 2007), p. 5.
42. Energy Information Administration, InternationalEnergy Annual 1991, DOE/EIA-0219(91) (Washing-ton, DC, December 1992), Table 33; and InternationalEnergy Annual 2001, DOE/EIA-0219(2001) (Wash-ington, DC, March 2003), Table 8.2.
43. World Energy Council, 2007 Survey of EnergySources, 21st Edition (London, UK, September2007), pp. 25-26.
44. Energy Information Administration, InternationalEnergy Annual 2006 (June-December 2008), Table2.5, web site www.eia.doe.gov/iea.
45. Energy Information Administration, Form EIA-5,“Quarterly Coal Consumption and Quality Report,Coke Plants.”
46. International Energy Agency, Coal Information 2008(Paris, France, August 2008), p. xxxv.

Chapter 5
ElectricityWorld electricity generation increases by 77 percent from 2006 to 2030 in the IEO2009
reference case. The non-OECD countries are projected to account for
58 percent of world electricity use in 2030.
World net electricity generation increases by an averageof 2.4 percent per year from 2006 to 2030 in the IEO2009
reference case. Electricity is projected to supply anincreasing share of the world’s total energy demand andis the fastest-growing form of end-use energy world-wide in the mid-term. Since 1990, growth in net electric-ity generation has outpaced the growth in total energyconsumption (2.9 percent per year and 1.9 percent peryear, respectively), and the growth in demand for elec-tricity continues to outpace growth in total energy usethroughout the projection (Figure 48).
World net electricity generation increases by 77 percentin the reference case, from 18.0 trillion kilowatthours in2006 to 23.2 trillion kilowatthours in 2015 and 31.8 tril-lion kilowatthours in 2030 (Table 10). Although the cur-rent recession is expected to dampen electricity demandin the near term, the reference case projection does notanticipate that the recession will be prolonged andexpects growth in electricity demand to return to trendafter 2010. The impact of the recession on electricity con-sumption is likely to be felt most strongly in the indus-trial sector, as manufacturing slows as a result of lowerdemand for manufactured products. Demand in thebuilding sector is less sensitive to changing economic
conditions than the industrial sector, because peoplegenerally continue to consume electricity for space heat-ing and cooling, cooking, refrigeration, and hot waterheating even in a recession.
In general, growth in the OECD countries, where elec-tricity markets are well established and consuming pat-terns are mature, is slower than in the non-OECDcountries, where a large amount of demand goes unmetat present. The International Energy Agency estimatesthat nearly 32 percent of the population in the develop-ing non-OECD countries (excluding non-OECD Europeand Eurasia) did not have access to electricity in 2005—atotal of about 1.6 billion people [1]. Regionally, sub-Saharan Africa fares the worst: more than 75 percent ofthe population remains without access to power. Highprojected economic growth rates support strongincreases in demand for electricity among the develop-ing regions of the world through the end of the projec-tion period.
The non-OECD nations consumed 45 percent of theworld’s total electricity supply in 2006, and their share ofworld consumption is poised to increase over the projec-tion period. In 2030, non-OECD nations account for 58percent of world electricity use, and the OECD sharedeclines to 42 percent (Figure 49). In the developingcountries, strong economic growth translates to grow-ing demand for electricity. Increases in income percapita lead to improved standards of living, rising con-sumer demand for lighting and appliances, and growingrequirements for electricity in the industrial sector. As aresult, total net electricity generation in the non-OECDcountries increases by an average of 3.5 percent per yearin the reference case, led by non-OECD Asia (includingChina and India), with annual increases averaging 4.4percent from 2006 to 2030 (Figure 50). In contrast, netgeneration among the OECD nations grows by an aver-age of 1.2 percent per year from 2006 to 2030.
Electricity Supply by Energy SourceThe mix of primary fuels used to generate electricity haschanged a great deal over the past four decades on aworldwide basis. Coal continues to be the fuel mostwidely used for electricity generation, although genera-tion from nuclear power increased rapidly from the1970s through the 1980s, and natural-gas-fired genera-tion grew rapidly in the 1980s and 1990s. The use of oil
Energy Information Administration / International Energy Outlook 2009 63
1990 2000 2006 2010 2020 20300
1
2
3
4Index, 1990 = 1
History Projections
TotalEnergy
Consumption
NetElectricity
Generation
Figure 48. Growth in World Electric PowerGeneration and Total EnergyConsumption, 1990-2030
Sources: History: Energy Information Administration (EIA),International Energy Annual 2006 (June-December 2008),web site www.eia.doe.gov/iea. Projections: EIA, WorldEnergy Projections Plus (2009).

for electricity generation has been declining since themid-1970s, when the oil embargo by Arab producers in1973-1974 and the Iranian Revolution in 1979 caused oilprices to increase to levels much higher than those forother fuels.
Although world oil prices contracted strongly at the endof 2008 and into 2009, the high prices recorded between2003 and 2008, combined with concerns about the envi-ronmental consequences of greenhouse gas emissions,renewed interest in the development of alternatives tofossil fuels—specifically, nuclear power and renewableenergy sources. The IEO2009 reference case does notexpect oil prices to remain at current levels. As econo-mies begin to recover from the global recession, so toodoes the demand for liquids and other energy. As aresult, long-term prospects continue to improve for gen-eration from both nuclear and renewable energysources—supported by government incentives and byhigh fossil fuel prices. Natural gas and coal are the sec-ond- and third fastest-growing sources of energy forelectricity generation in the projection, although the out-look for coal, in particular, could be altered substantiallyby any future legislation that aims to reduce or limit thegrowth of greenhouse gas emissions.
Coal
In the IEO2009 reference case, coal continues to fuel thelargest share of worldwide electric power production,by a wide margin (Figure 51). In 2006, coal-fired genera-tion accounted for 41 percent of world electricity supply;in 2030, its share is projected to be 43 percent. Sustainedhigh prices for oil and natural gas make coal-fired gener-ation more attractive economically, particularly innations that are rich in coal resources, which includeChina, India, and the United States. World net coal-firedgeneration nearly doubles over the projection period,from 7.4 trillion kilowatthours in 2006 to 9.5 trillionkilowatthours in 2015 and 13.6 trillion kilowatthours in2030.
The outlook for coal-fired generation could be alteredsubstantially by international agreements to reducegreenhouse gas emissions. The electric power sectoroffers some of the most cost-effective opportunities forreducing carbon dioxide emissions in many countries.Coal is both the world’s most widely used source ofenergy for power generation and also the most carbon-intensive energy source. If a cost, either implicit orexplicit, were applied to carbon dioxide emissions,there are several alternative no- or low-emission
64 Energy Information Administration / International Energy Outlook 2009
Table 10. OECD and Non-OECD Net Electricty Generation by Energy Source, 2006-2030(Trillion Kilowatthours)
Region 2006 2010 2015 2020 2025 2030
Average AnnualPercent Change,
2006-2030
OECDLiquids . . . . . . . . . . . . . . . . . . . . 0.3 0.3 0.3 0.3 0.3 0.3 -0.4Natural Gas . . . . . . . . . . . . . . . . 2.0 2.2 2.4 2.7 3.0 3.1 1.8Coal . . . . . . . . . . . . . . . . . . . . . . 3.7 3.9 4.0 4.0 4.0 4.3 0.6Nuclear . . . . . . . . . . . . . . . . . . . 2.2 2.3 2.4 2.4 2.5 2.6 0.6Renewables . . . . . . . . . . . . . . . . 1.6 1.9 2.2 2.5 2.8 2.9 2.5Total OECD. . . . . . . . . . . . . . . 9.9 10.6 11.3 11.9 12.6 13.2 1.2
Non-OECDLiquids . . . . . . . . . . . . . . . . . . . . 0.6 0.6 0.6 0.6 0.6 0.6 0.1Natural Gas . . . . . . . . . . . . . . . . 1.6 2.0 2.5 3.0 3.4 3.7 3.6Coal . . . . . . . . . . . . . . . . . . . . . . 3.7 4.8 5.5 6.4 7.8 9.2 3.9Nuclear . . . . . . . . . . . . . . . . . . . 0.4 0.5 0.7 0.9 1.2 1.3 4.8Renewables . . . . . . . . . . . . . . . . 1.8 2.2 2.7 3.2 3.4 3.8 3.2Total Non-OECD. . . . . . . . . . . 8.0 10.0 12.0 14.1 16.3 18.6 3.5
WorldLiquids . . . . . . . . . . . . . . . . . . . . 0.9 0.9 0.9 0.9 0.9 0.9 -0.1Natural Gas . . . . . . . . . . . . . . . . 3.6 4.2 4.9 5.7 6.4 6.8 2.7Coal . . . . . . . . . . . . . . . . . . . . . . 7.4 8.7 9.5 10.4 11.8 13.6 2.5Nuclear . . . . . . . . . . . . . . . . . . . 2.7 2.8 3.0 3.4 3.6 3.8 1.5Renewables . . . . . . . . . . . . . . . . 3.4 4.1 4.9 5.7 6.1 6.7 2.9Total World . . . . . . . . . . . . . . . 18.0 20.6 23.2 26.0 28.9 31.8 2.4
Note: Totals may not equal sum of components due to independent rounding.Sources: 2006: Derived from Energy Information Administration (EIA), International Energy Annual 2006 (June-December 2008),
web site www.eia.doe.gov/iea. Projections: EIA, World Energy Projections Plus (2009).

technologies that currently are commercially proven orunder development, which could be used to replacesome coal-fired generation. Implementing the technolo-gies would not require expensive, large-scale changes inthe power distribution infrastructure or in electricity-using equipment.
It could be more difficult, however, to achieve similarresults in other end-use sectors. In the transportationsector, for instance, large-scale reduction of carbondioxide emissions probably would require extensivechanges in the motor vehicle fleet, fueling stations, andfuel distribution systems, at tremendous expense. In
contrast, substitution of nuclear power and renewablesfor fossil fuels in the electric power sector would be acomparatively inexpensive way to reduce emissions, aswould improving the efficiency of electric appliances.
Natural Gas
Over the 2006 to 2030 projection period, natural-gas-fired electricity generation increases by 2.7 percent peryear, making gas the fastest-growing power source afterrenewables in the IEO2009 reference case. Generationfrom natural gas worldwide increases from 3.6 trillionkilowatthours in 2006 to 6.8 trillion kilowatthours in2030, but the total amount of electricity generated fromnatural gas continues to be only about one-half the totalfor coal, even in 2030. Natural-gas-fired combined-cyclecapacity is an attractive choice for new power plantsbecause of its fuel efficiency, operating flexibility (it canbe brought online in minutes rather than the hours ittakes for coal-fired and some other generating capacity),relatively short planning and construction times(months instead of the years that nuclear power plantstypically require), and capital costs that are lower thanthose for other technologies.
Liquid Fuels and Other Petroleum
With world oil prices projected to return to relativelyhigh levels, reaching $130 per barrel (in real 2007 dollars)in 2030, liquids are the only energy source for powergeneration that does not grow on a worldwide basis.Most nations are expected to respond to high oil pricesby reducing or eliminating their use of oil for genera-tion—opting instead for more economical sources ofelectricity, including coal. Although the recent decline inworld oil prices has forestalled the retreat from oil-firedgeneration in the near term, nations turn to alternative
Energy Information Administration / International Energy Outlook 2009 65
2006 2010 2015 2020 2025 20300
5
10
15Trillion Kilowatthours
LiquidsNuclear
RenewablesNatural Gas
Coal
Figure 51. World Electricity Generation by Fuel,2006-2030
Sources: 2006: Derived from Energy Information Adminis-tration (EIA), International Energy Annual 2006 (June-December 2008), web site www.eia.doe.gov/iea. Projections:EIA, World Energy Projections Plus (2009).
1980 1990 2006 2020 20300
5
10
15Trillion Kilowatthours
Non-OECD Asia
Middle East
Africa
Central and South America
Non-OECD Europe and Eurasia
Series 7
History Projections
Figure 50. Non-OECD Net Electricity Generationby Region, 1980-2030
Sources: History: Energy Information Administration (EIA),International Energy Annual 2006 (June-December 2008),web site www.eia.doe.gov/iea. Projections: EIA, WorldEnergy Projections Plus (2009).
1980 1990 2006 2020 20300
10
20
30
40Trillion Kilowatthours
History Projections
Total
Non-OECD
OECD
Figure 49. World Net Electric Power Generation,1980-2030
Sources: History: Energy Information Administration (EIA),International Energy Annual 2006 (June-December 2008),web site www.eia.doe.gov/iea. Projections: EIA, WorldEnergy Projections Plus (2009).

fuels for their power sources as oil prices rebound. From2006 to 2015, oil-fired generation grows by 0.7 percentper year; thereafter, with world oil prices above $100 perbarrel and rising after 2015, generation from liquids fallsby an average of 0.5 percent per year. Modest growth inliquids generation in the later years of the projection,particularly in the Middle East, is more than offset bydeclines in all other regions.
Nuclear Power
Electricity generation from nuclear power is projected toincrease from about 2.7 trillion kilowatthours in 2006 to3.8 trillion kilowatthours in 2030, as concerns about ris-ing fossil fuel prices, energy security, and greenhousegas emissions support the development of new nucleargeneration capacity. High prices for fossil fuels allownuclear power to become economically competitivewith generation from coal, natural gas, and liquidsdespite the relatively high capital and maintenance costsassociated with nuclear power plants. Moreover, highercapacity utilization rates have been reported for manyexisting nuclear facilities, and it is anticipated that mostof the older nuclear power plants in the OECD countriesand non-OECD Eurasia will be granted extensions totheir operating lives.
Around the world, nuclear generation is attracting newinterest as countries look to increase the diversity oftheir energy supplies, improve energy security, and pro-vide a low-carbon alternative to fossil fuels. Still, there isconsiderable uncertainty associated with nuclear power.Issues that could slow the expansion of nuclear power inthe future include plant safety, radioactive waste dis-posal, and concerns that weapons-grade uranium maybe produced from centrifuges installed to enrich ura-nium for civilian nuclear power programs. Those issuescontinue to raise public concern in many countries andmay hinder the development of new nuclear powerreactors. Nevertheless, the IEO2009 reference case incor-porates improved prospects for world nuclear power.The IEO2009 projection for nuclear electricity generationin 2025 is 25 percent higher than the projection pub-lished 5 years ago in IEO2004.
On a regional basis, the IEO2009 reference case projectsthe strongest growth in nuclear power for the countriesof non-OECD Asia (Figure 52). Non-OECD Asia’snuclear power generation is projected to grow at anaverage annual rate of 7.8 percent from 2006 to 2030,including projected increases of 8.9 percent per year inChina and 9.9 percent per year in India. Outside Asia,the largest increase in installed nuclear capacity amongthe non-OECD nations is projected for Russia, wherenuclear power generation increases by an average of 3.5percent per year. In contrast, OECD Europe is expectedto see a small decline in nuclear power generation, assome national governments (including Germany and
Belgium) still have plans in place to phase out nuclearprograms entirely.
To address the uncertainty inherent in projections ofnuclear power growth in the long term, a two-stepapproach is used to formulate the outlook for nuclearpower. In the near term (through 2015), projections arebased primarily on the current activities of the nuclearpower industry and national governments. Because ofthe long permitting and construction lead times associ-ated with nuclear power plants, there is general agree-ment among analysts on which nuclear projectsare likely to become operational in the mid-term. After2015, the projections are based on a combination ofannounced plans or goals at the country and regionallevels and consideration of other issues facing the devel-opment of nuclear power, including economics,geopolitical issues, technology advances, and environ-mental policies. The availability of potential uraniumresources is also considered as part of the IEO2009 mod-eling effort. At production costs between $40 and $80 perkilogram of uranium, total uranium reserves in excess of3.8 billion metric tons will be sufficient to meet the 2.7billion metric tons that would be needed to support theprojected growth in nuclear generation worldwide [2].
Hydroelectric, Wind, Geothermal, and OtherRenewable Generation
Renewable energy is the fastest-growing source of elec-tricity generation in the IEO2009 reference case. Totalgeneration from renewable resources increases by 2.9percent annually, and the renewable share of world elec-tricity generation grows from 19 percent in 2006 to 21percent in 2030. Much of the increase is expected to be inhydroelectric power and wind power. Generation from
66 Energy Information Administration / International Energy Outlook 2009
2006 2010 2020 20300.00
0.25
0.50
0.75
1.00
1.25
Trillion Kilowatthours
United States OECD Europe China JapanRussia India Other Asia Rest of World
Figure 52. World Net Electricity Generation fromNuclear Power by Region, 2006-2030
Sources: 2006: Energy Information Administration (EIA),International Energy Annual 2006 (June-December 2008),web site www.eia.doe.gov/iea. Projections: EIA, WorldEnergy Projections Plus (2009).

wind energy, in particular, has grown swiftly over thepast decade, from 11 gigawatts of net installed capacityat the beginning of 2000 to 121 gigawatts at the end of2008—a trend that is projected to continue into thefuture [3]. Of the 3.3 trillion kilowatthours of newrenewable generation added over the projection period,1.8 trillion kilowatthours (54 percent) is attributed tohydroelectric power and 1.1 trillion kilowatthours (33percent) to wind (Table 11).22
Although renewable energy sources have positiveenvironmental and energy security properties, mostrenewable technologies other than hydroelectricity arenot able to compete economically with fossil fuels dur-ing the projection period outside a few regions. Solarpower, for instance, is currently a “niche” source ofrenewable energy but can be economical where
electricity prices are especially high or governmentincentives are available (see box on page 68). In fact, gov-ernment policies or incentives often provide the primarymotivation for construction of renewable generationfacilities.
Changes in the mix of renewable fuels used for electric-ity generation are expected to differ between the OECDand non-OECD regions in the IEO2009 reference case. Inthe OECD nations, the majority of economically exploit-able hydroelectric resources already have been used;and, with the exceptions of Canada and Turkey, thereare few large-scale hydroelectric power projects plannedfor the future. As a result, most renewable energygrowth in the OECD countries is expected to come fromnonhydroelectric sources, especially wind and biomass.Many OECD countries, particularly those in Europe,
Energy Information Administration / International Energy Outlook 2009 67
Table 11. OECD and Non-OECD Renewable Electricty Generation by Energy Source, 2006-2030(Billion Kilowatthours)
Region 2006 2010 2015 2020 2025 2030
Average AnnualPercent Change,
2006-2030
OECDHydropower . . . . . . . . . . . . . . . . 1,274 1,321 1,396 1,447 1,496 1,530 0.8Wind. . . . . . . . . . . . . . . . . . . . . . 113 258 418 572 713 842 8.7Geothermal . . . . . . . . . . . . . . . . 35 45 54 57 59 62 2.4Other . . . . . . . . . . . . . . . . . . . . . 212 263 354 438 487 513 3.7Total OECD. . . . . . . . . . . . . . . 1,635 1,888 2,222 2,515 2,756 2,948 2.5
Non-OECDHydropower . . . . . . . . . . . . . . . . 1,723 2,060 2,491 2,911 3,098 3,242 2.7Wind. . . . . . . . . . . . . . . . . . . . . . 14 53 82 115 150 372 14.6Geothermal . . . . . . . . . . . . . . . . 19 29 40 42 45 47 3.8Other . . . . . . . . . . . . . . . . . . . . . 33 41 64 83 100 114 5.3Total Non-OECD. . . . . . . . . . . 1,790 2,184 2,676 3,151 3,393 3,776 3.2
WorldHydropower . . . . . . . . . . . . . . . . 2,997 3,381 3,887 4,359 4,594 4,773 2.0Wind. . . . . . . . . . . . . . . . . . . . . . 127 312 500 687 864 1,214 9.9Geothermal . . . . . . . . . . . . . . . . 55 75 93 99 104 109 2.9Other . . . . . . . . . . . . . . . . . . . . . 246 304 418 521 587 628 4.0Total World . . . . . . . . . . . . . . . 3,424 4,072 4,898 5,666 6,149 6,724 2.9
Notes: Totals may not equal sum of components due to independent rounding. Numbers for the United States in this table arebased on the published AEO2009 reference case (March 2009). In the updated AEO2009 reference case (April 2009), which incor-porates provisions from ARRA2009 that stimulate increased renewable generation, a significant expansion in the use of renewablefuels is projected. As a result, in the projections for 2030, total world electricity generation from hydropower rises to 4,771 billionkilowatthours, total generation from wind rises to 1,291 billion kilowatthours, total generation from geothermal energy rises to 111 bil-lion kilowatthours, and total generation from other renewables rises to 594 billion kilowatthours.
Sources: 2006: Derived from Energy Information Administration (EIA), International Energy Annual 2006 (June-December 2008),web site www.eia.doe.gov/iea. Projections: EIA, World Energy Projections Plus (2009).
22 In the updated AEO2009 reference case (April 2009), a significant expansion in U.S. use of renewable fuels for electricity generation isprojected, particularly in the near term. An extension of key Federal tax credits and a new loan guarantee program in ARRA2009 both stimu-late increased renewable generation relative to the projection in the published AEO2009 reference case (March 2009). U.S. renewable genera-tion in 2030 is 9 percent higher in the updated reference case than in the published reference case. As a result, incorporating the U.S. projectionsfrom the updated AEO2009 reference case results in an increase in total world renewable generation of 3.4 trillion kilowatthours over the pro-jection period, of which 1.8 trillion kilowatthours (53 percent of the total increase) is hydroelectric power and 1.2 trillion kilowatthours (35percent) is wind power.

68 Energy Information Administration / International Energy Outlook 2009
Solar Photovoltaic and Solar Thermal Electric Technologies
Solar power is one of the fastest-growing sources ofrenewable energy worldwide. Many nations, con-cerned about the environmental impacts of electricitygeneration from fossil fuels or from large-scale hydro-electric plants, have been turning to solar power as anenvironmentally benign alternative. The solar energythat reaches the earth can be harnessed to generateelectric power, and the potential for large-scale appli-cations of solar power has improved markedly inrecent years. Two solar power technologies—solarphotovoltaic and solar thermal—are widely employedtoday, and their use is likely to increase in the future.
Solar photovoltaic technologies convert sunlightdirectly into electricity by using photons from the sun’slight to excite electrons into higher states of energy.The resultant voltage differential across cells allows fora flow of electric current. Because individual solar cellsare very small and produce a few watts of power atmost, they are connected together in solar panels thatcan be arranged in arrays to increase electricity output.The arrangement of arrays is one major advantage ofphotovoltaic technologies, because they can be made invirtually any size to fit a specific application.
One popular application of solar photovoltaics is insolar panel installations on residential roofs, which canbe scaled to accommodate house size and electricityneeds. Although the technology now is used mostoften in small residential applications, it can be scaledup to create larger power plants, such as the 14-mega-watt Nellis solar plant in Nevada with some 70,000panels and the 11-megawatt solar plant in Serpa, Por-tugal, with 52,000 panels.
At present, the cost of electricity produced from solarphotovolatics generally is too high to compete withwholesale electricity. In sunny locations, however, thecost can be as low as 23 cents per kilowatthour,a whichmay be competitive with the delivered price of electric-ity to retail customers in areas where electricity pricesare high, as they are in California, Southern Spain, andItaly.b On the basis of installed cost per megawatt, solarphotovoltaic installations are relatively costly, becausethe panel components are expensive and the conver-sion of solar energy to electricity in the cells still is
inefficient. From conversion efficiencies of 5 to 6 per-cent for the first solar cells built in the 1950s, there hasbeen an improvement to efficiencies of 12 to 18 percentfor modern commercial wafer-silicon cells.c
Efficiency gains, coupled with other technologicaladvances, have reduced the cost of solar photovoltaiccapacity from approximately $300 per watt in 1956d toless than $5 per watt in 2009.e EIA’s Annual Energy Out-look 2009 projects that, by 2030, overnight capacity costsfor new generating plants using solar photovoltaicswill be 37 percent lower than the 2009 costs. In addi-tion, the efficiency of solar photovoltaic applications isexpected to improve as the technology continues to bedeveloped. As a result, U.S. solar photovoltaic generat-ing capacity is projected to increase from 30 megawattsin 2006 to 381 megawatts in 2030 (see figures on page69).
Although prices for electricity from photovoltaics maynot become widely competitive with wholesale pricesfor electricity from conventional generating technolo-gies within the next 25 years, they may be competitivewith high retail electricity prices in sunny regions.Already, photovoltaic technology is gaining marketshare in countries where declining prices and govern-ment-backed financial incentives have led to increasedusage. In Germany, for example, a feed-in tariff of 27cents per kilowatthourf has produced an explosion inthe use of solar photovoltaics, and in Japan the govern-ment has set a target for 30 percent of all households tohave solar panels installed by 2030.
Solar thermal technologies produce electricity by con-centrating the sun’s heat to boil a liquid and using thesteam to rotate a generator turbine, in much the sameway that electricity is produced from steam plantspowered by coal or natural gas. There are two maintypes of solar thermal power plants: towers and para-bolic troughs. A solar power tower consists of a largearray of sun-tracking mirrors, which are used to reflectthe sun’s rays onto a central tower. When the rays hitthe tower’s receiving panel, their heat is transferred toa fluid medium that is boiled to produce steam. Solarpower towers have been demonstrated successfully,
(continued on page 69)
aU.S. Department of Energy, Solar Energy Technologies Program Multi Year Program Plan 2008-2012 (Washington, DC, April 18, 2008),p. 18, web site www1.eere.energy.gov/solar/pdfs/solar_program_mypp_2008-2012.pdf. In comparison, wholesale electricity pricesaveraged 5.42 cents per kilowatthour in California in 2009.
bBecause retail electricity prices in the United States include generation, transmission, and distribution costs, prices paid by consumersare higher than average retail prices per kilowatthour.
cU.S. Department of Energy, Solar Energy Technologies Program Multi Year Program Plan 2008-2012, p. 119.dSouthface Energy Institute, “History of Solar,” web site www.southface.org/solar/solar-roadmap/solar_how-to/history-of-solar.
htm.eSolarbuzz LLC, “Solar Module Retail Price Environment,” web site www.solarbuzz.com/Moduleprices.htm.fUnder a feed-in tariff structure, regional or national electric utilities are obligated to purchase renewable electricity at a higher rate
than retail, in order to allow renewable energy sources to overcome price disadvantages.

have government policies, including feed-in tariffs,23 taxincentives, and market share quotas, that encourage theconstruction of renewable electricity facilities.
In the non-OECD countries, hydroelectric power is ex-pected to be the predominant source of renewable ener-gy growth. Strong growth in hydroelectric generation,
Energy Information Administration / International Energy Outlook 2009 69
Solar Photovoltaic and Solar Thermal Electric Technologies (continued)
but they still are in the early stages of technology devel-opment. The world’s largest solar power tower,located in Spain, is the 15-megawatt Solar Tres PowerTower.
The most commonly used solar thermal technology isthe parabolic trough, in which a parabolic reflectorfocuses the sun’s rays on a heat pipe that runs thelength of the trough and transports heated fluid to acentral power station. Most parabolic trough installa-tions consist of a field of reflectors concentrated on acentral location, where the working fluid is heated toproduce steam. The world’s largest parabolic troughinstallation is the Kramer Junction Solar Electric Gener-ating System in California, which consists of five 30-megawatt parabolic trough arrays. Total U.S. installedsolar thermal capacity, currently 400 megawatts, isprojected to increase to 859 megawatts in 2030 (seefigure below).
Solar thermal power plants are designed to be large-scale grid-connected plants, but at present they gener-ally cannot be used as baseload generators, becausethey do not produce heat at night or during the daywhen clouds block the sun. Some advances have been
made in storing solar energy by using it to heat liquidsodium, which can be used later to boil water and pro-duce the steam needed to power a generator turbine.The process is time-limited, however, and can extend aplant’s operations by only a few hours at best. In somecases, storage times of 4 to 16 hours have beenachieved, sufficient to allow electricity from solar ther-mal generators to be sold when it is more valuable,during the peak demand hours of 7-9 am and 5-7 pm.
Solar technologies have benefited from much researchand development over the past two decades, bringingdown the delivered price of solar electricity. Today,electricity from residential photovoltaics is marketedto compete with high-priced retail electricity. In thefuture, it is possible that utility-scale photovoltaicplants will compete with wholesale electricity genera-tion, provided that further technological advances areachieved. Solar thermal power plants are intended tocompete with wholesale generation, especially frompeaking plants, and they may become more competi-tive over time if heat storage technologies improve,costs decrease, and/or policies to mitigate carbon diox-ide emissions are adopted.
2011 2015 2020 2025 20300
1
2
3
4
5
6
72007 Dollars per Watt
Solar Thermal
Solar Photovoltaic
Projected U.S. Average Installed Capital Costsfor New Solar Electricity Generating Plants,2011-2030
Source: Energy Information Administration, AEO2009National Energy Modeling System, run AEO2009.D120908A.
1995 2000 2006 2010 2015 2020 2025 20300
200
400
600
800
1,000Megawatts
Solar Thermal
Solar Photovoltaic
History Projections
U.S. Solar Thermal and Solar PhotovoltaicInstalled Net Summer Generating Capacity,1995-2030
Source: Energy Information Administration, AEO2009National Energy Modeling System, run AEO2009.D120908A.
23 A feed-in tariff is an incentive structure to encourage the adoption of renewable energy through government legislation. Under afeed-in tariff structure, regional or national electricity utilities are obligated to purchase renewable electricity at a higher rate than retail,guaranteeing the renewable generator a positive return on its investment and allowing renewable energy sources to overcome price disad-vantages.

primarily from mid- to large-scale power plants, isexpected in China, India, Brazil, and a number of nationsin Southeast Asia, including Vietnam and Laos. Growthrates for wind-powered generation also are expected tobe high in non-OECD countries. The most substantialadditions of electricity supply generated from windpower may be centered in China.
The IEO2009 projections for renewable energy sourcesinclude only marketed renewables. Non-marketed (non-commercial) biofuels from plant and animal resourcesare an important source of energy, however, particularlyin the developing non-OECD economies. The Interna-tional Energy Agency has estimated that approximately2.5 billion people in developing countries depend on tra-ditional biomass as their main cooking fuel [4]. Non-marketed fuels and distributed renewables (renewableenergy consumed at the site of production, such asoff-grid solar photovoltaic panels) are not included inthe projections, however, because comprehensive dataon their use are not available. Further, the full impacts ofthe current global economic downturn and credit crisison the potential for growth of marketed renewable gen-eration are not known. The reference case assumes thatthese issues may delay some projects in the short termbut will not affect the long-term growth of electricitygeneration from renewable resources.
Regional OutlookIn the IEO2009 reference case, the highest projectedgrowth rates for electricity generation are for thenon-OECD nations, where strong economic growth andrising personal incomes drive the projected growth indemand for electric power. In the OECD countries—where electric power infrastructures are relativelymature, national populations generally are expected togrow slowly or decline, and GDP growth is expected tobe slower than in the developing nations—demand forelectricity is projected to grow much more slowly than inthe non-OECD countries. In the reference case, non-OECD electricity generation increases by 3.5 percent peryear, as compared with 1.2 percent per year in the OECDnations.
OECD Economies
North America
North America currently accounts for the largestregional share of world electricity generation, at 27 per-cent of the total in 2006. That share declines over thecourse of the projection period, as the non-OECDnations experience fast-paced growth in demand for
electric power. In 2030, North America accounts for only20 percent of the world’s electric power generation.
The United States is the largest consumer of electricity inNorth America and is projected to remain in that posi-tion through 2030 (Figure 53). U.S. electricity genera-tion—including both generation by electric powerproducers and on-site generation—increases slowly, atan average annual rate of 1.0 percent.24 Canada, like theUnited States, has a mature electricity market, and itsgeneration is projected to increase by 1.4 percent peryear from 2006 to 2030. Mexico’s electricity generationgrows at a faster rate—averaging 2.8 percent per yearthrough 2030—reflecting the underdeveloped state ofthe country’s electric power infrastructure (and thus thegreater potential for expansion) relative to Canada andthe United States.
There are large differences in the mix of energy sourcesused to generate electricity in the three countries thatmake up OECD North America, and those differencesare likely to become more pronounced in the future(Figure 54). In the United States, coal is the leadingsource of energy for power generation, accounting for 49percent of the 2006 total; but in Canada, hydroelectricityprovided 59 percent of the nation’s electricity generationin 2006. Most of Mexico’s electricity generation currentlyis fueled by petroleum-based liquids and natural gas,which together accounted for 60 percent of its total elec-tricity generation in 2006. In the reference case, U.S. reli-ance on coal decreases slightly, to 47 percent in
70 Energy Information Administration / International Energy Outlook 2009
1980 1990 2000 2006 2010 2015 2020 2025 20300
2
4
6
8Trillion Kilowatthours
United States
Canada
Mexico
History Projections
Figure 53. Net Electricity Generation in OECDNorth America, 1980-2030
Sources: History: Energy Information Administration (EIA),International Energy Annual 2006 (June-December 2008),web site www.eia.doe.gov/iea. Projections: EIA, WorldEnergy Projections Plus (2009).
24 Primarily as the result of slower macroeconomic growth, U.S. net electricity generation grows more slowly (averaging 0.9 percent peryear) in the updated AEO2009 reference case (April 2009) than in the published AEO2009 reference case (March 2009) discussed in this report.

2030;25 Canada’s hydropower continues to be the pre-dominant energy source for electricity generation,although its share of the total falls to 54 percent in 2030;and the natural gas share of Mexico’s total electricitygeneration increases from 35 percent in 2006 to 62 per-cent in 2030.
Although coal remains the most important fuel for U.S.electricity generation, slower growth in the demand forelectricity and increasing concern about greenhouse gasemissions affect the coal markets by slowing the growthin demand for coal-fired generation in this year’s out-look relative to the IEO2008 projection. Even though themix of investments in new power plants relies less oncoal than in recent outlooks, however, coal remains thedominant fuel for generation because of continued reli-ance on existing coal-fired plants and the addition ofsome new ones in the absence of an explicit policy toreduce greenhouse gas emissions.
In contrast to coal, natural gas plays a larger role in U.S.generation projections than in recent IEOs, because it is
less carbon intensive than coal, and because it is muchless expensive to build new natural-gas-fired plants thanto build either new renewable or new nuclear plants.Electricity generation from natural gas in 2030 is 37 per-cent higher in the IEO2009 reference case than was pro-jected in the IEO2008 reference case.26 A key factor in thechange is slower growth in coal use as a result of envi-ronmental concerns and the possible impacts of relatedfuture policies that would reduce the number of newcoal-fired plants added.
Generation from renewable energy sources in theUnited States increases in response to requirements inmore than one-half of the 50 States for minimum renew-able generation or capacity shares. Renewable genera-tion in the IEO2009 reference case is substantially higherthan in last year’s projections, with the share of genera-tion coming from renewable energy sources growingfrom 9.5 percent in 2006 to 14.2 percent in 2030.27 Federalsubsidies for renewable generation are assumed toexpire as enacted; however, if those subsidies wereextended, a much larger increase in renewable genera-tion would be expected.
Electricity generation from nuclear power plantsaccounts for 18 percent of total U.S. generation in 2030 inthe IEO2009 reference case.28 From 2006 to 2030, theUnited States is expected to add 12.7 gigawatts of capac-ity at newly built nuclear power plants and 3.7 gigawattsfrom uprates of existing plants—offset in part by theretirement of 4.4 gigawatts of capacity at older nuclearpower plants. The increase in U.S. nuclear capacity isattributed to policies enacted to spur nuclear powergrowth, as well as concerns about greenhouse gas emis-sions, which limit additions of coal-fired plants in theprojection.
In Canada, generation from natural gas is projected toincrease by 2.5 percent per year from 2006 to 2030, whilecoal-fired generation increases by 0.8 percent per year,nuclear by 1.5 percent per year, hydroelectricity by 1.0percent per year, wind by 13.1 percent per year, andother renewable energy sources by 3.5 percent per year.Oil-fired generation, on the other hand, declines by 0.6percent per year.
Energy Information Administration / International Energy Outlook 2009 71
2006 2030 2006 2030 2006 20300
20
40
60
80
100Percent of Total
Liquids
Coal
Natural Gas
Renewables
Nuclear
United States Canada Mexico
Figure 54. Net Electricity Generation in OECDNorth America by Fuel, 2006 and 2030
Sources: 2006: Derived from Energy Information Adminis-tration (EIA), International Energy Annual 2006 (June-December 2008), web site www.eia.doe.gov/iea. 2030: EIA,World Energy Projections Plus (2009).
25 Primarily as the result of additional incentives for renewable fuels included in ARRA2009, U.S. coal-fired generation in 2030 is slightlylower in the updated AEO2009 reference case (April 2009) than in the published reference case (March 2009). As a result, coal’s share of totalU.S. electricity generation in 2030 is slightly lower (at 46 percent) in the updated reference case.
26 Primarily as a result of lower assumptions for macroeconomic growth in the updated AEO2009 reference case (April 2009), U.S. natural-gas-fired generation in 2030 is about 4 percent lower than in the published reference case (March 2009).
27 In the updated AEO2009 reference case (April 2009), a significant expansion in the use of renewable fuels for U.S. electricity generationis projected, particularly in the near term. An extension of key Federal tax credits and a new loan guarantee program in ARRA2009 bothstimulate increased renewable generation relative to the published reference case (March 2009). In 2030, U.S. renewable electricity generationis about 9 percent higher in the updated reference case and accounts for 15.8 percent of total U.S. net generation.
28 Additional incentives for renewable energy and improved energy efficiency measures included in ARRA2009 lower the prospects forU.S. nuclear power. In the updated AEO2009 reference case (April 2009), the projection for U.S. nuclear generating capacity in 2030 is 2.5gigawatts lower than in the published reference case (March 2009), and the net addition to U.S. installed nuclear capacity between 2006 and2030 is 9.9 gigawatts, bringing the 2030 total to 110.1 gigawatts in the updated reference case, as compared with 112.6 gigawatts in the pub-lished reference case. In both cases, nuclear generation accounts for 18 percent of total U.S. net generation in 2030.

In Ontario—Canada’s largest provincial electricity con-sumer—the government maintains that it will close itsfour coal-fired plants (Atikokan, Lambton, Nonticoke,and Thunder Bay) by December 31, 2014, citing environ-mental and health concerns [5]. The government plansto replace coal-fired capacity with natural gas, nuclear,hydroelectricity, and wind, along with increased conser-vation measures. At present, coal provides about 16percent of Ontario’s electric power. In the IEO2009 refer-ence case, the retirement of Ontario’s coal-fired facilitiesis offset by increases elsewhere in the country—notably,Alberta and Nova Scotia. As a result, Canada’s coal-firedgeneration rises modestly, from about 106 billionkilowatthours in 2006 to 128 billion kilowatthours in2030.
Hydroelectric power is, and is expected to remain, theprimary source of electricity in Canada. In 2006, hydro-electric generation provided 59 percent of the country’stotal generation. While the hydropower share falls to 54percent in 2030, wind’s share grows from less than 1 per-cent in 2006 to 6 percent in 2030. As a result, the renew-able share of Canada’s overall generation remainsroughly constant throughout the projection.
As one of the few OECD countries with untappedhydroelectric potential, Canada currently has severallarge- and small-scale hydroelectric facilities currentlyeither planned or under construction. Hydro-Québechas announced plans to construct a 768-megawatt facil-ity near Eastman and a smaller 125-megawatt facility atSarcelle in Québec, both of which are expected to be fullycommissioned by 2012 [6]. Other planned hydroelectricprojects include the 2,260-megawatt Lower ChurchillRiver project in Newfoundland and Labrador, the1,550-megawatt Romaine River project in Québec, andthe 200-megawatt Wuskwatim project in Manitoba [7].The IEO2009 reference case does not anticipate that allplanned projects will be constructed, but given Canada’shistorical experience with hydropower and the commit-ments for construction, new hydroelectric capacityaccounts for 15,610 megawatts of additional renewablecapacity projected to be added in Canada between 2006and 2030.
Canada also has plans to continue expanding its windpower capacity. From 2,246 megawatts of installedcapacity at the beginning of 2009 [8], the total is pro-jected to increase to nearly 24,000 megawatts in 2030 inthe reference case. Almost 3,000 megawatts of windcapacity is currently under construction or under devel-opment in Quebec alone. Growth in wind capacity hasbeen so rapid that Canada’s federal wind incentive pro-gram, “ecoENERGY for Renewable Power,” whichallows the deployment of 4,000 megawatts of renewableenergy by 2011, will use the remainder of its funding bythe end of 2009 [9].
In addition to the incentive programs of Canada’s fed-eral government, several provincial governments haveinstituted their own incentives to support the construc-tion of new wind capacity. Ontario’s Renewable EnergyStandard Offer Program has helped support robustgrowth in wind installations over the past several years,and installed wind capacity in the province has risenfrom 0.6 megawatts in 1995 to more than 780 megawattsin January 2009 [10]. The Standard Offer Program paysall small renewable energy generators (with installedcapacity less than 10 megawatts) 11.0 cents (Canadian)per kilowatthour of electricity delivered to local electric-ity distributors [11] and 42.0 cents per kilowatthour forelectricity from solar photovoltaic projects. Contractsbetween Ontario Power Authority and the small renew-able generators last for a term of 20 years, and beginningin 2007 a portion of the rate paid to generators was to beindexed annually for inflation. Continued support fromCanada’s federal and provincial governments—alongwith the sustained higher world oil prices in the IEO2009reference case—is expected to provide momentum forthe projected increase in the country’s use of windpower for electricity generation.
Mexico’s electricity generation increases by an averageof 2.8 percent annually from 2006 to 2030—double therate for Canada and triple the rate for the United States.The Mexican government has recognized the need forthe country’s electricity infrastructure to keep pacewith the fast-paced growth anticipated for electricitydemand. In July 2007, the government unveiled its2007-2012 National Infrastructure Programme, whichincluded plans to invest $25.3 billion to improve andexpand electricity infrastructure [12]. As part of the pro-gram, the government has set a goal to increase installedgenerating capacity by 8.6 gigawatts from 2006 to 2012.The country is well on its way to meeting the govern-ment target. The 1,135-megawatt Tamazunchale com-bined-cycle plant became operational in June 2007 (andthere are plans to expand the generating capacity to5,000 megawatts eventually), and several other plantsunder construction will bring on line another 840 mega-watts in 2009, 650 megawatts in 2010, and 750 mega-watts in 2012 [13].
Most of the projected increase in Mexico’s electricitygeneration in the IEO2009 reference case is fueled bynatural gas, as the Mexican government implementsplans to reduce the country’s use of diesel and fuel oil inthe power sector [14]. Natural-gas-fired generation ismore than triples in the projection, from 80 billionkilowatthours in 2006 to 268 billion kilowatthours in2030. The resulting growth in Mexico’s demand for nat-ural gas strongly outpaces its growth in production,leaving the country dependent on pipeline imports fromthe United States and LNG from other countries. Cur-rently, Mexico has one LNG import terminal, Altimira,
72 Energy Information Administration / International Energy Outlook 2009

operating on the Gulf Coast and another, Costa Azul, onthe Pacific Coast. A contract tender for a third terminalat Manzanillo, also on the Pacific Coast, was awarded inMarch 2008, and the project is scheduled for completionby 2011 [15]. New coal-fired plants also are planned, tohelp diversify the fuel mix for power generation. The651-megawatt Pacifico coal-fired plant currently isunder construction, with a scheduled completion date of2010 [16].
Although much of the growth in Mexico’s electric powersector is expected to be in the form of natural-gas-firedgeneration, renewable energy resources are expected tobe the second fastest-growing source of generation inthe projection. Mexico’s renewable generation increasesby 1.5 percent per year from 2006 to 2030, comparedwith a 5.2 percent per year for natural-gas-fired genera-tion. The country’s current renewable generation energymix is split largely between hydroelectricity (76 percent)and geothermal energy (17 percent). Two major hydro-electric projects are under way: the 750-megawattLa Yesca facility, which is scheduled for completion by2012, and the planned 900-megawatt La Parota project,which is expected to be completed by 2015 [17].
Mexico also plans to add substantial wind generation toits power resource mix. During 2006 alone, the country’sinstalled wind capacity increased from 2.2 megawatts to86.5 megawatts [18]. Although no additional windcapacity was installed in Mexico in 2008, there are ambi-tious plans to add another 700 megawatts of wind capac-ity by 2010, including 400 megawatts planned byindependent power producers and a 100-megawattexpansion of the existing 83-megawatt La Venta windfarm [19].
OECD Europe
Electricity generation in the nations of OECD Europeincreases by an average of 1.3 percent per year in theIEO2009 reference case, from 3.4 trillion kilowatthoursin 2006 to 4.0 trillion kilowatthours in 2015 and 4.6 tril-lion kilowatthours in 2030. Because most of the countriesin OECD Europe have relatively stable populations andmature electricity markets, most growth in electricitydemand is expected to come from those nations withmore robust population growth (including Turkey, Ire-land, and Spain) and from the newest OECD members(including the Czech Republic, Hungary, and Poland),whose economic growth rates exceed the OECD averagethrough the projection period. In addition, as environ-mental concerns remain prominent in the region, there isa concerted effort to switch from coal and liquids use toelectricity in the industrial sector.
Renewable energy is OECD Europe’s fastest-growingsource of electricity generation in the IEO2009 reference
case. The use of renewables for electricity generation isprojected to grow by 3.1 percent per year through 2030,and the increase is almost entirely from nonhydropowersources. Because most of the economically feasiblehydroelectric resources in Europe already have beendeveloped, the countries of OECD Europe haveswitched their focus to alternative renewable energycapacity—consisting mainly of wind turbines—over thepast decade. At present, seven of the world’s ten largestmarkets for wind-powered electricity generation arein Europe,29 and the 27-member European Unionaccounted for 54 percent of the world’s total installedwind capacity at the end of 2008 [20].
OECD Europe’s leading position worldwide in windpower capacity is projected to be maintained through2030, with growth in generation from wind sourcesaveraging 8.9 percent per year, even though the refer-ence case assumes no enactment of additional interna-tional legislation to limit greenhouse gas emissionsduring the period. The robust growth in wind power,coupled with a mature hydropower sector, causes elec-tricity generation from wind power to surpass hydro-electric generation by the end of the projection period(Figure 55). A lack of additional land for installation ofnew wind turbines will force many European countrieseither to “repower” their existing fleets by replacing oldturbines with larger, more effective (higher capacityrated) ones or to build significant portions of futurecapacity offshore, especially in the North Sea and BalticSea.
The growth of nonhydropower renewable energysources in OECD Europe is encouraged by some of the
Energy Information Administration / International Energy Outlook 2009 73
2006 2010 2015 2020 2025 20300.0
0.1
0.2
0.3
0.4
0.5
0.6
0.7Trillion Kilowatthours
Hydroelectricity
Geothermal
Other Renewables
Wind
Figure 55. Renewable Electricity Generation inOECD Europe by Fuel, 2006-2030
Sources: 2006: Derived from Energy Information Adminis-tration (EIA), International Energy Annual 2006 (June-December 2008), web site www.eia.doe.gov/iea. Projections:EIA, World Energy Projections Plus (2009).
29 According to the Global Wind Energy Council, at the end of 2008 the 10 countries with the largest amounts of installed wind capacitywere the United States, Germany, Spain, China, India, Italy, France, the United Kingdom, Denmark, and Portugal.

world’s most favorable renewable energy policies. TheEuropean Union has set a binding target to produce 21percent of electricity generation from renewable sourcesby 2010 [21] and has reaffirmed the goal of increasingrenewable energy use with its December 2008 “climateand energy policy,” which mandates that 20 percent oftotal energy production must come from renewables by2020 [22]. Approximately 19 percent of the EuropeanUnion’s electricity came from renewable sources in 2006.
The IEO2009 reference case does not anticipate that allthe renewable energy targets in the European Union willbe met on time, especially because of the uncertainimpact of the current economic and fiscal conditions onthe financing of electricity projects and the adherence tostated goals. Nevertheless, current laws are expected tolead to the construction of more renewable capacity thanwould have occurred in their absence. In addition, someindividual countries provide economic incentives topromote the expansion of renewable electricity. Ger-many, Spain, and Denmark—the leaders in OECDEurope’s installed wind capacity—have enacted feed-intariffs that guarantee above-market rates for electricitygenerated from renewable sources and, typically, lastfor 20 years from the completion of a power plant. Aslong as European governments support such price pre-miums for renewable electricity, robust growth inrenewable generation is likely to continue.
Natural gas is the second fastest-growing source ofpower generation after renewables in the outlook forOECD Europe, increasing at an average rate of 2.3 per-cent per year from 2006 to 2030. Although the growthstill is quite strong considering that total electricitydemand increases by only 1.3 percent per year, it issomewhat slower than the 3.9-percent annual increaseprojected for natural-gas-fired generation in last year’soutlook. The difference results in part from the morerobust growth projected for the region’s renewable gen-eration and in part from concerns about the security ofpower supplies. Russia is Europe’s major natural gassupplier, and in 2009, for the second time since 2006, itcut off deliveries of natural gas through Ukraine in a dis-pute with that country over pricing. Although naturalgas storage and LNG supplies were sufficient to preventOECD Europe from being physically affected by the cut-off, the event did underscore Europe’s dependence onRussian supplies, particularly as domestic regional pro-duction continues to decline. Nearly 65 percent of Rus-sia’s exported natural gas is delivered through Ukraine,which is substantially lower than in 1998 (95 percent)but still much higher than Russia’s 2015 goal of 40 per-cent [23].
Nuclear power has gained renewed interest in Europe asconcerns about greenhouse gas emissions and secureelectricity supplies have increased. Although OECD
Europe’s total nuclear capacity declines from 132 giga-watts in 2006 to 119 gigawatts in 2020 in the referencecase, that decrease is followed by a net increase to 121gigawatts in 2030. Belgium and Germany, with substan-tial nuclear programs, have policies in effect to reducetheir use of nuclear power in the future; however, it isunclear whether their planned closures of nuclear powerplants actually will take place, given that nuclear plantsprovide baseload capacity while producing no carbondioxide emissions. Further, many European nationspreviously staunchly against nuclear power have beenrevisiting their stances. Sweden’s government, forinstance, announced in February 2009 that it wouldmove to halt its plan to phase out nuclear power by 2010and reverse its 30-year ban on building new nuclearcapacity [24]. Italy has also announced its intention todiversify its electric power fuel mix by building nuclearpower plants [25].
Renewed interest and moves to reverse legislative banson nuclear power have led to more license extensionsand fewer retirements of operating nuclear power plantsthan were expected in assessments in previous outlooks.In addition, the IEO2009 reference anticipates some newbuilds (about 18 gigawatts of new nuclear capacity) inFrance, Finland, and possibly other countries of OECDEurope. On the other hand, the significant investmentsbeing made in renewable energy sources may lessen theopportunities for new nuclear capacity.
Coal accounted for nearly 30 percent of OECD Europe’snet electricity generation in 2006, but concerns about car-bon dioxide emissions and global warming couldreduce that share in the future. On the other hand, incountries that rely heavily on coal for their electricitysupplies, it may be difficult to reduce coal use substan-tially and at the same time carry out plans to dismantlenuclear power programs, in spite of the strong growthprojected for renewable generation. In particular, coalprovides about 55 percent of total electricity generationin Germany and 95 percent in Poland [26]. In theIEO2009 reference case, electricity from coal remains animportant part of supply in OECD Europe, increasing ata relatively slow average rate of 0.1 percent per yearfrom 2006 to 2030.
OECD Asia
Total electricity generation in OECD Asia increases byan average of 1.2 percent per year in the reference case,from 1.7 trillion kilowatthours in 2006 to 2.2 trillionkilowatthours in 2030. Japan accounts for the largestshare of electricity generation in the region today andcontinues to do so in the mid-term projection, despitehaving the slowest-growing electricity market in theregion and the slowest among all the OECD countries,averaging 0.6-percent per year, as compared with 1.5percent per year for Australia/New Zealand and 2.3
74 Energy Information Administration / International Energy Outlook 2009

percent per year for South Korea (Figure 56). Japan’selectricity markets are well established, and its agingpopulation and relatively slow projected economicgrowth in the mid-term translate into slow growth indemand for electric power. In contrast, both Austra-lia/New Zealand and South Korea are expected to havemore robust income and population growth, leading tomore rapid growth in demand for electricity.
The fuel mix for electricity generation varies widelyamong the three economies that make up the OECDAsia region. In Japan, natural gas, coal, and nuclearpower make up the bulk of the current electric powermix, with natural gas and nuclear accounting for about53 percent of total generation and coal another 28 per-cent. The remaining portion is split between renewablesand petroleum-based liquids. Japan’s reliance onnuclear power and natural gas is projected to increasesomewhat over the projection period, to 60 percent oftotal generation in 2030. Coal’s share of generationdeclines to 22 percent, being displaced by natural gas,nuclear, and—to a much smaller extent—renewableenergy sources.
As is true for much of the OECD, wind power isexpected to be Japan’s fastest-growing source of renew-able energy, increasing by 7.4 percent per year in theIEO2009 reference case. Although wind power develop-ment is expected to continue, it has encountered difficul-ties because of limited government policy support andweather-related technological problems. Japan’s currenttarget for electricity from nonhydroelectric renewablesources is 1.63 percent by 2014, a relatively modest goalthat is unlikely to encourage as much growth in Japan asin countries with more aggressive policies [27]. Inclem-ent weather also has had a negative impact on winddevelopment in Japan, with typhoons and lightningstrikes damaging wind turbines and driving up the costof wind farms in the country. Despite its current strategyof investing in research to develop J-Class wind turbinesthat can better withstand adverse weather conditions[28], wind remains a modest source of electric power forJapan in the IEO2009 reference case, accounting for lessthan 1 percent of total electricity generation in 2030, ascompared with hydropower’s 8-percent share of thetotal in 2030.
Australia and New Zealand, as a region, rely on coal forabout 70 percent of electricity generation, based largelyon Australia’s rich coal resource base (9 percent of theworld’s total coal reserves). The remaining regional gen-eration is supplied by natural gas and renewable energysources—mostly hydropower, wind, and, in New Zea-land, geothermal. The Australia/New Zealand regionuses negligible amounts of oil for electricity generationand no nuclear power, and that is not expected to changeover the projection period. Natural-gas-fired generationis expected to grow strongly in the region, at 2.9 percent
per year from 2006 to 2030, reducing the coal share to 58percent at the end of the projection.
In South Korea, coal and nuclear power currently pro-vide 41 percent and 38 percent of total electricity genera-tion, respectively. Natural-gas-fired generation growsquickly in the reference case projection, but despite adoubling of electricity generation from natural gas, itsshare of total generation increases only from 16 percentin 2006 to 19 percent in 2030. Coal and nuclear powercontinue to provide most of the South Korea’s electricitygeneration, with a combined 77 percent of total electric-ity in 2030.
Non-OECD Economies
Non-OECD Europe and Eurasia
Total electricity generation in non-OECD Europe andEurasia grows at an average rate of 2.0 percent per yearin the IEO2009 reference case, from 1.5 trillion kilowatt-hours in 2006 to 2.0 trillion kilowatthours in 2015 and 2.4trillion kilowatthours in 2030. Russia, with the largesteconomy in non-OECD Europe and Eurasia, accountedfor around 60 percent of the region’s total generation in2006 and is expected to retain approximately that sharethroughout the projection (Figure 57).
Natural gas and nuclear power are expected to supplymuch of the growth in electricity generation in theregion. As a whole, non-OECD Europe and Eurasia hasample resources of natural gas, equal to nearly one-thirdof the world’s total proved natural gas reserves. As aresult, natural-gas-fired generation grows robustly inthe outlook, by an average annual rate of 2.7 percentfrom 2006 to 2030.
Energy Information Administration / International Energy Outlook 2009 75
2006 2010 2015 2020 2025 20300.0
0.2
0.4
0.6
0.8
1.0
1.2
1.4Trillion Kilowatthours
Japan South Korea Australia/New Zealand
Figure 56. Net Electricity Generation in OECD Asia,2006-2030
Sources: 2006: Energy Information Administration (EIA),International Energy Annual 2006 (June-December 2008),web site www.eia.doe.gov/iea. Projections: EIA, WorldEnergy Projections Plus (2009).

Generation from nuclear power also grows strongly inthe region, averaging 2.8 percent per year. Much of theincrease is expected in Russia. In 2006, the Russian gov-ernment released Resolution 605, which set a federal tar-get program for nuclear power development. Thesection of the resolution titled “Development of theNuclear Industry in Russia 2007-2010 and -2015” statesthat 10 nuclear power reactors are to be completed by2015: Volgodonsk 2, 3, and 4; Kalinin 4; Novoronezh 2-1and 2-2; Leningrad 2-1, 2-2, and 2-3; and Beloyarsky 4[29]. In addition, a total of 40 reactors are supposed to beconstructed by 2030, raising Russia’s nuclear generatingcapacity by 2 gigawatts per year from 2012 to 2014 andby 3 gigawatts per year from 2014 to 2020, bringing thetotal to 40 gigawatts [30] and increasing the nuclearshare of total generation to 23 percent by 2020 [31]. TheIEO2009 reference case takes a more conservative viewof the rate at which new nuclear power plants will comeon line in Russia, and the outlook includes some delay inmeeting the current construction schedule. A net total of5 gigawatts of nuclear generating capacity is added toRussia’s existing 23 gigawatts by 2015 and another 16gigawatts by 2030.
Renewable generation in non-OECD Europe and Eur-asia, almost entirely from hydropower facilities, in-creases relatively slowly, by an average of 0.7 percentper year, largely as a result of repairs and expansions atexisting sites. Notable exceptions include the 3,000-megawatt Boguchan Dam in Russia and the 3,600-megawatt Rogun Dam in Tajikistan [32]. Constructionbegan on Boguchan in 1980 and on Rogun in 1976, butwork ceased when the former Soviet Union experiencedeconomic difficulties in the 1980s. Construction hasrecently been restarted on the Boguchan Dam, which is
expected to be completed by 2012. Work on the RogunDam has been suspended but should begin again in thenear term. Growth of nonhydropower renewable gener-ation is projected to be negligible.
Non-OECD Asia
Non-OECD Asia—led by China and India—has the fast-est projected regional growth in electric power genera-tion worldwide, averaging 4.4 percent per year from2006 to 2030 in the reference case. Although the globaleconomic recession has an impact on the region’s near-term economic growth, in the long term the economiesof non-OECD Asia are expected to expand strongly,with corresponding increases in demand for electricityin both the building and industrial sectors. Total electric-ity generation in non-OECD Asia rises by nearlytwo-thirds between 2006 and 2015, from 4.4 trillionkilowatthours to 7.3 trillion kilowatthours. After 2015the growth in electricity demand moderates as infra-structure matures and patterns of energy use in theregional economies begin to resemble those in the moreestablished OECD nations. Still, electricity demandincreases by 46 percent between 2015 and 2025, and byanother 17 percent between 2025 and 2030. In 2030, netgeneration in non-OECD Asia totals 12.4 trillion kilo-watthours in the reference case.
Coal accounts for two-thirds of the electricity generationin non-OECD Asia (Figure 58), dominated by generationin China and India. Both countries already rely heavilyon coal to produce electric power. In 2006, coal’s share ofgeneration was an estimated 79 percent in China and 71percent in India. Efforts to diversify the fuel mix awayfrom coal are expected to meet with limited success, andit is likely that coal will remain the dominant source of
76 Energy Information Administration / International Energy Outlook 2009
2006 2010 2015 2020 2025 20300
2
4
6
8
10Trillion Kilowatthours
Liquids
Nuclear
RenewablesNatural Gas
Coal
Figure 58. Net Electricity Generation in Non-OECDAsia by Fuel, 2006-2030
Sources: 2006: Derived from Energy Information Adminis-tration (EIA), International Energy Annual 2006 (June-December 2008), web site www.eia.doe.gov/iea. Projections:EIA, World Energy Projections Plus (2009).
2006 2010 2015 2020 2025 20300.0
0.4
0.8
1.2
1.6Trillion Kilowatthours
Russia Other
Figure 57. Net Electricity Generation in Non-OECDEurope and Eurasia, 2006-2030
Sources: 2006: Energy Information Administration (EIA),International Energy Annual 2006 (June-December 2008),web site www.eia.doe.gov/iea. Projections: EIA, WorldEnergy Projections Plus (2009).

power generation in both countries. In the IEO2009 ref-erence case, the coal share of electricity generationdeclines to 56 percent in India and 75 percent in China in2030.
Throughout non-OECD Asia, consumption of liquidsand other petroleum for electricity generation is pro-jected to decline, as relatively high world oil prices makeother fuels more attractive economically. Although theliquids share of electricity generation in non-OECD Asiafalls from 4 percent in 2006 to about 1 percent in 2030,some oil-fired generation is expected to continue to beneeded. Many rural areas currently do not have access totransmission lines, and until transmission infrastructurecan be put in place, noncommercial energy sources areexpected to be replaced with electricity from diesel-firedgenerators.
Non-OECD Asia leads the world in installing newnuclear capacity in the IEO2009 reference case, account-ing for 54 percent of the projected net increment innuclear capacity worldwide (or 72 gigawatts of the total132-gigawatt increase). China, in particular, has expan-sive plans for nuclear power, with a net 47 gigawatts ofadditional capacity projected to be installed by 2030.Currently, 11 nuclear power plants are under construc-tion in China, including 6 for which construction wasstarted in 2008 [33]. With generation from coal, naturalgas, and renewable energy sources also expected to con-tinue increasing rapidly, however, the nuclear share oftotal generation in China increases only from 2 percentin 2006 to 5 percent in 2030.
India also has plans to boost its nuclear power genera-tion. From 3 gigawatts of installed nuclear power capac-ity in operation today, India has set an ambitious goal ofincreasing its nuclear generating capacity to 20 giga-watts by 2020 and 40 gigawatts by 2030 [34]. Six nucleargenerating stations are under construction now, four ofwhich are scheduled for completion by the end of 2009.There is considerable optimism for the future develop-ment of India’s nuclear program, in part because of the“123 Agreement” signed by the United States and Indiain October 2008.30 The agreement allows India—despitethe fact it has not joined the Nuclear Non-ProliferationTreaty—to import nuclear materials, nuclear technol-ogy, and fuel [35]. The projected increase in nuclearcapacity in the IEO2009 reference case is somewhatslower than anticipated by India’s government, with 17gigawatts of net installed capacity becoming operationalby 2030.
In addition to China and India, several other countries innon-OECD Asia are expected to begin or expand nuclearpower programs. In the reference case, new nuclearpower capacity is installed in Vietnam, Indonesia, andPakistan by 2030. The impact of high fossil fuel prices,
combined with concerns about security of energysupplies, leads many nations in the region to considerdiversifying the fuel mix for their power generation byadding a nuclear component.
Electricity generation from renewable energy sources innon-OECD Asia is projected to grow at an averageannual rate of 4.7 percent, increasing the renewableshare of the region’s total generation from 16 percent in2006 to 17 percent in 2030. Mid- to large-scale hydroelec-tric facilities provide much of the increment. Severalcountries have hydropower facilities either planned orunder construction, including Vietnam, Malaysia, Paki-stan, and Myanmar (the former Burma). Almost 50hydropower facilities, with a combined 3,398 megawattsof capacity, are under construction in Vietnam’s Son Laprovince, including the 2,400-megawatt Son La and520-megawatt Houi Quang projects, both of which arescheduled for completion before 2015 [36]. Malaysiaexpects to complete its 2,400-megawatt Bakun Dam by2011, although the project has experienced a number ofdelays and setbacks in the past [37]. Pakistan andMyanmar also have substantial hydropower develop-ment plans, but those plans have been discounted in theIEO2009 reference case to reflect the two countries’ his-torical difficulties in acquiring foreign direct investmentfor infrastructure projects.
India has plans to more than double its installed hydro-power capacity by 2030. In its Eleventh and TwelfthFive-Year Plans, which span 2007 through 2017, India’sCentral Electricity Authority has identified 40,943 mega-watts of hydroelectric capacity that it intends to build.Although the IEO2009 reference case does not assumethat all the planned capacity will be completed, morethan one-third of the announced projects are under con-struction already and are expected to be completed by2020 [38].
India’s federal government is attempting to incentivizethe development of hydropower across the nation. Leg-islation has been proposed to allow private hydroelec-tric power developers to be eligible over a 5-year periodfor a tariff that would guarantee a fixed return on invest-ment and allow generators to improve their returns byselling up to 40 percent of their electricity on the spotmarket. In addition, India’s federal hydropower inten-tions are being supported by state authorities. The stategovernment in Himachal Pradesh has plans to commer-cialize a substantial portion of the state’s reported 21,000megawatts of hydroelectric power potential, adding5,744 megawatts of hydroelectric capacity before 2015,which would nearly double the existing capacity [39].Also, the 2,000-megawatt lower Subansiri facility underconstruction in Arunachal Pradesh is expected to becompleted by 2012 [40].
Energy Information Administration / International Energy Outlook 2009 77
30 The United States has negotiated 123 agreements with several countries. The agreements are part of the U.S. Atomic Energy Act of1954, which promotes the peaceful pursuit of nuclear power among nations.

Similar to India, China also has a number of large-scalehydroelectric projects under construction. The 18,200-megawatt Three Gorges Dam project’s final generatorwent on line in October 2008, and the Three GorgesProject Development Corporation plans to furtherincrease the project’s total installed capacity to 22,400megawatts by 2012 [41]. In addition, work continues onthe 12,600-megawatt Xiluodu project on the Jisha River(scheduled for completion in 2020 as part of a 14-facilityhydropower development plan). The country’s third-largest hydroelectric facility, the 6,300-megawatt Long-tan project on the Hongshui River, is scheduled for com-pletion before the end of 2009 [42]. China also has theworld’s tallest dam (at nearly 985 feet) currently underconstruction, as part of the 3,600-megawatt Jinping Iproject on the Yalong River, which is scheduled forcompletion in 2014 as part of a plan by the ErtanHydropower Development Company to construct 21facilities with 34,620 megawatts of hydroelectric capac-ity on the Yalong [43].
The China Power Investment Corporation began con-struction on the first of a proposed 13-dam hydroelectricpower system on the Yellow River in 2007, with plans foran ultimate total installed capacity of 8,000 megawatts.The first part of the system, the 360-megawatt Banduoproject, is scheduled to become operational by 2011 [44].The Chinese government has set a 300-gigawatt targetfor hydroelectric capacity in 2020. Including those men-tioned above, the country has a sufficient number of pro-jects under construction or in development to meet thetarget. China’s aggressive hydropower developmentplan is expected to increase hydroelectricity generationby 4.0 percent per year, more than doubling the coun-try’s total hydroelectricity generation by 2030.
Although hydroelectric projects dominate the renew-able energy mix in non-OECD Asia, generation fromnonhydroelectric renewable energy sources, especiallywind, also is expected to grow significantly. At the endof 2008, China completed installation of its 10,000thmegawatt of wind capacity, achieving its 2010 target afull year ahead of the schedule set out by the NationalDevelopment and Reform Commission [45]. The Chi-nese government has established a 30,000-megawatt tar-get for installed wind capacity by 2020; however, at thecurrent installation rate of at least 3,000 megawatts ofwind capacity a year, China is projected to have 40,000megawatts of wind capacity installed by 2020. TheIEO2009 reference case anticipates that electricity fromwind plants in China will grow by 23.2 percent per year,from 2 billion kilowatthours in 2006 to 315 billionkilowatthours in 2030.
Geothermal energy, while a small contributor tonon-OECD Asia’s total electricity generation, plays animportant role in the Philippines and Indonesia. With
the second-largest amount of installed geothermalcapacity in the world, the Philippines generated morethan 17 percent of its total electricity from geothermalsources in 2007 [46]. Indonesia, with the fifth-largestinstalled geothermal capacity, generated just over 5 per-cent of its electricity from geothermal energy in 2005, thelast year for which reliable data are available [47].Although the Indonesian geothermal industry sufferedsetbacks from the country’s 1997 financial crisis, there isstrong potential for future geothermal development,with more than 20 gigawatts of geothermal potentialavailable [48]. Both the Philippines and Indonesia haveannounced plans to increase their installed geothermalcapacities in the coming years.
Middle East
Electricity generation in the Middle East region growsby 2.2 percent per year in the reference case, from 0.6 tril-lion kilowatthours in 2006 to 1.1 trillion kilowatthours in2030. The region’s young and rapidly growing popula-tion and an expected strong increase in national incomeare expected to result in rapid growth in demand forelectric power. Iran, Saudi Arabia, and the United ArabEmirates (UAE) account for two-thirds of the regionaldemand for electricity, and demand has increasedsharply over the past several years in each of the coun-tries. From 2000 to 2006, Iran’s net generation increasedby an average of 9.1 percent per year; Saudi Arabia’s by6.1 percent per year; and the UAE’s by 8.9 percent peryear.
The Middle East depends on natural gas and petroleumliquids to generate most of its electricity and is projectedto continue that reliance through 2030 (Figure 59). In
78 Energy Information Administration / International Energy Outlook 2009
2006 2010 2015 2020 2025 20300.0
0.2
0.4
0.6
0.8Trillion Kilowatthours
Liquids
NuclearRenewables
Natural Gas
Coal
Figure 59. Net Electricity Generation in theMiddle East by Fuel, 2006-2030
Sources: 2006: Derived from Energy Information Adminis-tration (EIA), International Energy Annual 2006 (June-December 2008), web site www.eia.doe.gov/iea. Projections:EIA, World Energy Projections Plus (2009).

2006, natural gas supplied 56 percent of electricity gen-eration in the Middle East and liquids 35 percent. In2030, the natural gas share is projected to be 67 percentand the liquids share 23 percent. There has been a con-certed effort by many of the petroleum exporters in theregion to develop their natural gas resources for use indomestic power generation. Petroleum is a valuableexport commodity for many nations in the Middle East,and there is increasing interest in the use of domesticnatural gas for electricity generation in order to makemore oil assets available for export.
Given the collapse of world oil prices at the end of 2008,oil-fired generation in the Middle East is likely toincrease in the short-run, particularly in majoroil-exporting nations that rely on associated natural gasproduction to fulfill growing demand for natural gas inthe power sector. In Saudi Arabia, for instance, associ-ated natural gas from oil production accounts for 60 per-cent of total natural gas supply [49]. As Saudi oilproduction has been reduced both as a reaction to thelowered worldwide demand for liquids and in anattempt to stabilize oil prices, the associated natural gasproduction has slowed as well. Until world oil pricesand demand recover from current lows and productionof both oil and natural gas begins to rise, petroleum islikely to continue being used to supplement natural gasin the power sector. In the IEO2009 reference case, liq-uids-fired generation in the Middle East grows from 228billion kilowatthours in 2006 to 248 billion kilowatt-hours in 2015 and 254 billion kilowatthours in 2030.
Other energy sources make only minor contributions toelectricity supply in the Middle East. Israel is the onlycountry in the region that uses significant amounts ofcoal to generate electric power [50], and Iran, with thecompletion of its Bushehr 1 reactor expected in 2011, isthe only one projected to add nuclear capacity. OtherMiddle Eastern countries recently have expressed someinterest in increasing both coal-fired and nuclear genera-tion, however, in response to concerns about diversify-ing the electricity fuel mix and meeting the region’sfast-paced growth in electricity demand. For example,Oman announced in 2008 that it would construct thePersian Gulf’s first coal-fired power plant at Duqm [51].Although details have not been released, it is expectedthat the plant—if constructed—would have a capacitybetween 1,000 and 2,000 megawatts and could be com-pleted as early as 2012. The UAE, Saudi Arabia, and Bah-rain also have considered adding coal-fired capacity[52].
In addition to Iran, several other Middle Eastern nationshave announced intentions to pursue nuclear powerprograms in recent years. In 2007, the six-nation GulfCooperation Council31 completed a feasibility study, in
cooperation with the International Atomic Energy Asso-ciation, of the potential for a regional nuclear power anddesalinization program, while also announcing theirintention to pursue a peaceful nuclear program [53]. TheUAE government in 2008 announced plans to have three1,500-megawatt nuclear power plants completed by2020 and has since signed nuclear cooperative agree-ments with France, Japan, the United Kingdom, and theUnited States [54]. Jordan also has announced its inten-tion to add nuclear capacity [55], and in 2009 the Kuwaiticabinet announced that it would form a national com-mittee on nuclear energy use for peaceful purposes [56].Even given the considerable interest in nuclear powerthat has arisen in the region, however, IEO2009 expectsthat economic and political issues, in concert with thelong lead times usually associated with beginning anuclear program, will mean that beyond Iran’s Bushehr1 reactor, only the UAE will add one additional nuclearpower plant in the Middle East over the course of theprojection.
Although there is little incentive for countries in theMiddle East to increase their use of renewable energysources (the renewable share of the region’s total elec-tricity generation increases only from 4 percent in 2006to 5 percent in 2030 in the reference case), there havebeen some recent developments in renewable energyuse in the region. Iran, which generated 9 percent of itselectricity from hydropower in 2006, is developing 94new hydroelectric power plants, 5 of which are expectedto come on line before March 2010 [57]. Constructionalso continues on Masdar City in Abu Dhabi, a “zero car-bon” city that will be powered by 190 megawatts of solarphotovoltaic cells and 20 megawatts of wind power [58].The first phase of construction is expected to be com-pleted by the end of 2009.
Africa
Demand for electricity in Africa grows at an averageannual rate of 2.6 percent in the IEO2009 reference case.Fossil-fuel-fired generation supplied 81 percent of theregion’s total electricity in 2006, and reliance on fossilfuels is expected to continue through 2030. Coal-firedpower plants, which were the region’s largest source ofelectricity in 2006, accounting for 46 percent of total gen-eration, are projected to provide a 37-percent share in2030, and natural-gas-fired generation is projected toexpand strongly, from 25 percent of the total in 2006 to39 percent in 2030 (Figure 60).
At present, South Africa’s two nuclear reactors are theonly ones operating in the region, accounting for about2 percent of Africa’s total electricity generation. Reportssuggest that construction of a new Pebble Bed ModularReactor could begin in South Africa in 2010, with ananticipated completion date of 2014; however, the
Energy Information Administration / International Energy Outlook 2009 79
31 Gulf Cooperation Council members are Saudi Arabia, Kuwait, Bahrain, the United Arab Emirates, Qatar, and Oman.

project has had various setbacks since it was originallyinitiated in 1993, and it is uncertain whether the currentschedule will be met [59]. In addition, Egypt’s govern-ment has moved forward with its plans to construct anuclear power project, signing a nuclear power coopera-tion agreement with Russia in 2008 and awarding a con-tract to U.S.-based Bechtel to design the new powerplant, tentatively to be located at Dabaa, about 100 mileswest of Alexandria [60]. In the reference case, 1,100megawatts of net nuclear capacity is projected to becomeoperational in Africa over the 2006-2030 period, and thenuclear share of the region’s total generation remains at2 percent through the end of the period.
Generation from hydropower and other marketedrenewable energy sources is expected to grow slowly inAfrica. As they have in the past, nonmarketed renew-ables are expected to continue providing energy toAfrica’s rural areas; however, it is often difficult forAfrican nations to find funding or international supportfor larger commercial projects. Plans for several hydro-electric projects in the region have been advancedrecently, however, and they may help boost supplies ofmarketed renewable energy in the mid-term. Several(although not all) of the announced projects are expectedto be completed by 2030, allowing the region’s con-sumption of marketed renewable energy to grow by 1.8percent per year from 2006 to 2030. For example, Ethio-pia is finishing work on three hydroelectric facilities: the300-megawatt Takeze power station, the 460-megawattAnabeles, and the 420-megawatt Gilgel Gibe II, all ofwhich are scheduled for completion at the end of 2009[61].
Central and South America
Electricity generation in Central and South Americaincreases by 2.2 percent per year in the IEO2009 refer-ence case, from 0.9 trillion kilowatthours in 2006 to 1.2trillion kilowatthours in 2015 and 1.6 trillion kilowatt-hours in 2030. The present global economic crisis isaffecting the region’s economies and thus their electric-ity markets, lowering demand for electricity, especiallyin the industrial sector. In the longer term, however, theregion’s electricity markets are expected to return totrend growth as the economic difficulties recede.
The fuel mix for electricity generation in Central andSouth America is dominated by hydroelectric power,which accounted for two-thirds of the region’s total netelectricity generation in 2006. Of the top seven electricitygenerating countries in the region, six generate morethan 55 percent of their total electricity from hydro-power—Brazil, Venezuela, Paraguay, Colombia, Chile,and Peru.32 In Brazil, the region’s largest economy,hydropower provided almost 84 percent of electricitygeneration in 2006 (Figure 61). The country has been try-ing to diversify its electricity supply fuel mix away fromhydroelectric power because of the risk of power short-ages during times of severe drought. In the BrazilianNational Energy Plan for 2008-2017, the government hasset a goal to reduce reliance on hydropower to 78 per-cent [62]. To achieve that target, the government hasannounced plans to increase nuclear power capacity,beginning with the completion of the long-idled1,000-megawatt Angra-3 project [63]. Construction is setto begin in April 2009, and the reactor is scheduled tobegin coming on line in 2014. Brazil also has plans to
80 Energy Information Administration / International Energy Outlook 2009
2006 2010 2015 2020 2025 20300.0
0.2
0.4
0.6
0.8Trillion Kilowatthours
Liquids
NuclearRenewables
Natural Gas
Coal
Figure 60. Net Electricity Generation in Africaby Fuel, 2006-2030
Sources: 2006: Derived from Energy Information Adminis-tration (EIA), International Energy Annual 2006 (June-December 2008), web site www.eia.doe.gov/iea. Projections:EIA, World Energy Projections Plus (2009).
2006 2010 2015 2020 2025 20300.0
0.2
0.4
0.6
0.8Trillion Kilowatthours
Nuclear
Other RenewablesHydropower
CoalLiquids
Natural Gas
Figure 61. Net Electricity Generation in Brazilby Fuel, 2006-2030
Sources: 2006: Derived from Energy Information Adminis-tration (EIA), International Energy Annual 2006 (June-December 2008), web site www.eia.doe.gov/iea. Projections:EIA, World Energy Projections Plus (2009).
32 Argentina is the region’s second-largest electricity generator but derives only about one-third of its electricity from hydropower.

construct four additional 1,000-megawatt nuclear plantsbeginning in 2015. In the IEO2009 reference case, onlythe Anagra-3 project is projected to be completed by2015, and none of the other planned nuclear projects inBrazil is expected to be completed before 2030.
In the past, the Brazilian government has tried relativelyunsuccessfully to attract substantial investment in natu-ral-gas-fired power plants, mostly because of the highercosts of natural-gas-fired generation relative to hydro-electric power and because of concerns about the secu-rity of natural gas supplies. Brazil has relied onimported Bolivian natural gas for much of its supply,but concerns about the impact of Bolivia’s nationaliza-tion of its energy sector on foreign investment in thecountry’s natural gas production has led Brazil to looktoward LNG imports for secure supplies. Brazil hasinvested strongly in its LNG infrastructure, and its thirdLNG regasification plant is scheduled for completion in2013 [64]. With Brazil diversifying its natural gas sup-plies, substantially increasing domestic production, andresolving to reduce the hydroelectric share of genera-tion, natural gas is projected to be its fastest-growingsource of electricity, increasing by 7.1 percent per yearon average from 2006 to 2030.
Several other nations in Central and South America havebeen trying to increase the amounts of natural gas usedin their generation fuel mixes by increasing both pipe-line and LNG supplies. Chile, for instance, relies onArgentina for its natural gas supplies, but beginning in2004, Argentina began to restrict its exports after it wasunable to meet its own domestic supply. As a result,Chile has been forced to use diesel-fueled electric gener-ating capacity periodically to avoid power outages dur-ing the winter months [65]. In response to the lack of asecure source of natural gas from Argentina, Chile hasbegun construction on two LNG regasification projects.The Quintero facility is expected to become operationalin June 2009, and the second Mejillones facility sched-uled for completion by the end of 2010. In the IEO2009reference case, natural-gas-fired generation in Centraland South America (excluding Brazil) increases by anaverage 2.5 percent per year, and the natural gas share oftotal electricity generation rises from 21 percent in 2006to 27 percent in 2030 (Figure 62).
Brazil still has plans to continue expanding its hydro-electric generation over the projection period, includingthe construction of two plants on the Rio Madeira inRondonia—the 3,150-megawatt Santo Antonio and the3,326-megawatt Jirau hydroelectric facilities. The twoplants, with completion dates scheduled for 2012-2015,are expected to help Brazil meet electricity demand inthe mid-term [66]. In the long term, electricity demandcould be met in part by the 11,181-megawatt Belo Montedam, which is scheduled to receive bids for construction
in 2009; however, each of the three projects could be sub-ject to delay as a result of legal challenges. An injunctionto stop the construction of the Jirau power plant, forexample, was overturned in 2008 after the plaintiff’s sec-ond appeal [67].
Brazil also is interested in increasing the use of other,nonhydroelectric renewable resources in the future—notably, wind. Wind power generation in Brazil growsby 14.8 percent per year in the IEO2009 reference case,from 250 million kilowatthours in 2006 to 6,890 millionkilowatthours in 2030. Despite that robust growth pro-jection, however, wind remains a modest component ofBrazil’s renewable energy mix in the reference case, ascompared with the projected growth in hydroelectricgeneration to 646,600 million kilowatthours in 2030.
Increases in Brazil’s electricity generation from non-hydropower renewable energy sources have been sup-ported primarily by the federal Program of Incentivesfor Alternative Electricity Sources (PROINFA). Phase Iof the program guaranteed power purchase agreementsfor 3,300 megawatts of biomass, wind, and small hydro-electric capacity through 2008. A second phase ofPROINFA was intended to increase nonhydroelectricgeneration to 10 percent of total electricity generation by2027, but insufficient utilization of Phase I has reducedthe likelihood that Phase II will be implemented [68].Until a replacement policy is enacted, growth in Brazil’snonhydroelectric renewable generation is expected to berelatively slow in comparison with the growth in othersources of electricity generation.
Energy Information Administration / International Energy Outlook 2009 81
2006 2010 2015 2020 2025 20300.0
0.2
0.4
0.6
0.8Trillion Kilowatthours
Nuclear
Other RenewablesHydropower
CoalLiquids
Natural Gas
Figure 62. Net Electricity Generation in OtherCentral and South America by Fuel,2006-2030
Sources: 2006: Derived from Energy Information Adminis-tration (EIA), International Energy Annual 2006 (June-December 2008), web site www.eia.doe.gov/iea. Projections:EIA, World Energy Projections Plus (2009).

References
82 Energy Information Administration / International Energy Outlook 2009
1. International Energy Agency, World Energy Outlook2006 (Paris, France, November 2006), p. 567.
2. Energy Information Administration, InternationalEnergy Outlook 2008, DOE/EIA-0484(2008) (Wash-ington, DC, September 2008), p. 67.
3. World Wind Energy Association, World WindEnergy Report 2008 (February 2009), p. 4, web sitewww.wwindea.org.
4. International Energy Agency, World Energy Outlook2008 (Paris, France, November 2008), p. 177.
5. Ontario Ministry of Energy and Infrastructure,“Frequently Asked Questions” (as of February 23,2009), web site www.mei.gov.on.ca/english/energy/electricity.
6. Hydro Québec, “Eastmain-1-A/Sarcelle/RupertProject,” web site www.hydroquebec.com/rupert/en/index.htm.
7. Natural Energy Board Canada, Canada’s EnergyFuture: Reference Case and Scenarios to 2030 (Ottawa,Ontario, Canada, November 2007), p. 31; andHydro Québec Production, Complexe de La Romaine:Etude d’impact sur l’environnment (December 2007),p. iii.
8. Canadian Wind Energy Association, “CanadaBecomes 12th Country in the World To Surpass2,000 MW of Installed Wind Energy Capacity”(press release, December 10, 2008), web site www.canwea.ca/media/release/release_e.php?newsId=51.
9. Canadian Wind Energy Association, “Federal/Pro-vincial Incentives on Wind Energy” (May 2008),web site www.canwea.ca/images/uploads/File/Fed_and_provincial_initiatives_may_2008.pdf.
10. Canadian Wind Energy Association, “CanadianWind Farms” (January 2009), web site www.canwea.ca/farms/index_e.php.
11. Ontario Power Authority, Standard Offer Program—Renewable Energy for Small Electricity Generators: AnIntroductory Guide (Toronto, Ontario, Canada),web site http://powerauthority.on.ca/SOP/Stor-age/ 44/3985_SOPInformationBrochure.pdf.
12. IHS Global Insight, Inc., “Mexico: Country Reports:Utilities: Electricity and Gas” (January 27, 2009),web site www.globalinsight.com (subscriptionsite).
13. “Tamazunchale I CCGT Plant, Mexico,” power-technology.com web site: Industry Projects (undated)web site www.power-technology.com/projects/tamazunchale.
14. J. Roeder, “Natural Gas Replacing Fuel Oil and Die-sel in Mexico’s Power Plants,” The Oil Daily, Vol. 59,No. 19 (January 29, 2009), p. 5.
15. IHS Global Insight, Inc., “Mexico: Country Reports,Oil & Gas Downstream” (December 18, 2008), website www.globalinsight.com (subscription site).
16. IHS Global Insight, Inc., “Mexico: Country Reports:Utilities: Electricity and Gas” (January 27, 2009),web site www.globalinsight.com (subscriptionsite).
17. S. Frias, “In-Depth Look at the National Infrastruc-ture Program for CFE,” Railroad Commission ofTexas, Texas Trade Mission to Mexico 2008 (August27-29,2008), web site www.rrc.state.tx.us/commissioners/carrillo/mexico/2008.
18. World Wind Energy Association, World WindEnergy Report 2008 (Bonn/Toronto, February 2009),p. 12, web site www.wwindea.org.
19. International Energy Agency, IEA Wind EnergyAnnual 2007 (Boulder, CO, July 2008), p. 181.
20. Global Wind Energy Council, “US and China inRace to the Top of Global Wind Industry” (pressrelease, February 2, 2009), web site www.gwec.net.
21. European Parliament, Directive 2001/77/EC,“Renewable Energy: The Promotion of ElectricityFrom Renewable Energy Sources” (2001), web sitehttp://europa.eu/scadplus/leg/en/lvb/l27035.htm.
22. European Parliament, “EU Climate and EnergyPolicy” (December 2008), web site http://ec.europa.eu/climateaction/docs/climate-energy_summary_en.pdf.
23. Cambridge Energy Research Associates, “It’s NotOver Till It’s Over: The Russian-Ukrainian Gas Cri-sis in Perspective,” CERA Decision Brief (Cambridge,MA, January 2009), p. 4.
24. “Recalled to Half-Life,” The Economist, Vol. 390, No.8618 (February 14-20, 2009), pp. 60-61.
25. “Nuclear the ‘only solution’ to Italy’s energyimports,” World Nuclear News (January 9, 2009), website www.world-nuclear-news.org.
26. “German Utilities Fear Gas, German Public FearsCoal,” World Gas Intelligence, Vol. 19, No. 9 (Febru-ary 27, 2008), p. 7; and “Carbon Emissions PriceCould Test Polish Devotion to Coal,” World GasIntelligence, Vol. 19, No. 13 (March 26, 2008), p. 7.
27. REN21, Renewables 2007 Global Status Report(Paris, France, 2008), p.41, web site www.ren21.net/pdf/RE2007_Global_Status_Report.pdf.
28. International Energy Agency, IEA Wind EnergyAnnual Report 2007 (Paris, France, July 2008), p. 163.
29. S.I. Antipov, “Nuclear Industry of Russia Todayand Tomorrow,” Papers from the PBNC 2006 Confer-ence of the Pacific Nuclear Society (October 15-20,2006), web site www.pacificnuclear.org/pnc/publications.html.

Energy Information Administration / International Energy Outlook 2009 83
30. “Nuclear Power Engineering in Russia,”Rosenergoatom Concern OJSC, Virtual Museum(copyright 2000-2009), web site http://museum.rosenergoatom.ru/eng/modern/russia/index.wbp.
31. “Nuclear Power in Russia,” World Nuclear Associa-tion: Information Papers: Country Briefings (February25, 2009), web site www.world-nuclear.org.
32. World Energy Council, 2007 Survey of EnergyResources (London, United Kingdom, 2007), p. 310;and International Water and Power, “PowerMachines Wins Brazil Order, Sends Unit toBoguchanskaya” (August 20, 2008), web site www.waterpowermagazine.com/story.asp?sectioncod=130&storyCode=2050664.
33. International Atomic Energy Association, PowerReactor Information System (as of March 2, 2009),web site www.iaea.org/programmes/a2/index.html.
34. M. Schneider, “2008 World Nuclear Industry StatusReport: Asia,” Bulletin of the Atomic Scientists (Sep-tember 18, 2008), web site www.thebulletin.org/web-edition/reports/2008-world-nuclear-industry-status-report/2008-world-nuclear-industry-status-re-0; and Indian National Congress web site,“India’s Nuclear Energy Programme and the 123Agreement with United States” (undated), web sitewww.aicc.org.in/documents-detail.php?id=29.
35. B. Pradhan and A. Chaudhary, “Singh, Bush AffirmU.S.-India Nuclear Deal Commitment,” BloombergNews Service (July 9, 2008), web site www.bloomberg.com; and “USIBC Concludes SuccessfulCommercial Nuclear Trade Mission to India,”India Post News Service (January 23, 2009), web sitehttp://indiapost.com/article/techbiz/5269/1/print.
36. “Son La Pushes Hydro Program,” Power in Asia, No.509 (August 14, 2008), p. 17.
37. A. Netto, “New Doubts Over Malaysia’s BakunDam,” Asia Times Online (July 10, 2007), web sitewww.atimes.com.
38. Central Energy Authority, Hydro Development Planfor 12th Five Year Plan (2012-2017) (New Delhi,India, September 2008), pp. i and iv, web sitewww.cea.nic.in/hydro/Hydro%20Development%20Plan%20for%2012th%20Five%20Year%20Plan.pdf.
39. “Himachal Pradesh Pushes Hydro Generation Pro-jects,” Power in Asia, No. 488 (October 11, 2007), p.14.
40. “Private Players for Developing Hydro Projects inArunachal,” The Economic Times of India (December19, 2007), web site www.economictimes.indiatimes.com.
41. Probe International Editorial, “Probe InternationalAsks Canadian Government Provide Legal AidThree Gorges Dam Victims” (January 23, 2008), website www.probeinternational.org.
42. “Longtan Enters Operation,” Power in Asia, No. 494(January 3, 2008), p. 23.
43. “Asian Experiences,” International Water PowerMagazine (October 1, 2007), web site www.waterpowermagazine.com.
44. “Banduo Project Starts Construction,” Power in Asia,No. 488 (October 11, 2007), p. 19.
45. United Press International, “China Increases ItsWind Power” (Beijing, January 19, 2009), web sitewww.upi.com/Energy_Resources/2009/01/19/China_increases_its_wind_power/UPI-58981232388248.
46. Philippine Department of Energy, Power Statistics,“Power Sector Situationer, 2007,” p. 2, web sitewww.doe.gov.ph/EP/Powerstat.htm.
47. World Energy Council, 2007 Survey of EnergyResources (London, United Kingdom, October 2007),p. 440.
48. World Energy Council, 2007 Survey of EnergyResources (London, United Kingdom, October 2007),p. 458.
49. “OPEC Cut Poses Gas Problem for Saudi Arabia,”’The Oil Daily, Vol. 50, No. 40 (March 2, 2009), p. 7.
50. International Energy Agency, Energy Balances ofNon-OECD Countries, 2004-2006, 2007 Edition(Paris, France, 2007), web site www.iea.org/w/bookshop/add.aspx?id=31.
51. K. Maree, “Gulf’s First Coal-Fired Power Plant ToBe Built at Duqm: Muscat Approves Project As Con-cerns Grow Over Future Energy Sources,” MEEDMiddle East Economic Digest (April 25, 2008), web sitewww.meed.com/power (subscription site).
52. D. Candappa and T. Austin, “Oman Eyes Gulf’sFirst Coal Power Plant—Report,” Reuters UK NewsRelease (January 26, 2008), web site http://uk.reuters.com.
53. “Keeping Up With the (Nuclear) Joneses” (March26, 2008), web site www.forbes.com.
54. “Nuclear Power in the United Arab Emirates,”World Nuclear Association Information Papers(January 2009), web site www.world-nuclear.org;E. Lake, “U.S.-UAE Nuclear Deal To Test Obama,”Washington Times (January 6, 2009), web sitewww.washingtontimes.com; and “Resources on theUnited Arab Emirates Nuclear Energy Program and123 Agreement,” web site www.usuae123.com.
55. “Keeping Up With the (Nuclear) Joneses” (March26, 2008), web site forbes.com.

84 Energy Information Administration / International Energy Outlook 2009
56. “Kuwait To Form Nuclear Energy Commission,”World Nuclear News: Nuclear Policies (March 3, 2009),web site www.world-nuclear-news.org.
57. Global Insight, Inc., “Iran: Investment in Hydro-power to Continue as Iran Pushes 94 Dam ProjectsForward” (January 13, 2009), web site www.globalinsight.com.
58. D. Dilworth, “Zero Carbon; Zero Waste in AbuDhabi,” Business Week (August 1, 2007), web sitewww.businessweek.com/innovate/content/aug2007/id2007081_901739.htm.
59. World Nuclear Association, “Nuclear Power inSouth Africa” (February 2009), web site www.world-nuclear.org/info/inf88.html.
60. T. Carlisle, “Egypt Awards Nuclear Power Con-tract,” The National Newspaper (December 22, 2008),web site www.thenational.ae.
61. Global Insight, Inc., “Ethiopia-Kenya: Ethiopia ToExport Electricity to Kenya from Gilgel Gibe 2Hydropower Plant” (August 19, 2008), web sitewww.globalinsight.com.
62. N. Viana, “Brazil Energy Proposal Said To Contra-dict Poznan Promises,” Climate Media Partnership
(January 15, 2009), web site www.climatemediapartnership.org.
63. “Nuclear Power in Brazil,” World Nuclear Associa-tion, Information Papers, Country Briefings(December 2008), web site www.world-nuclear.org.
64. L. Viscidi, “Brazil Plans To Have Third LNG Termi-nal Up and Running by 2013,” The Oil Daily, Vol. 59,No. 30 (February 13, 2009), p. 2.
65. L. Viscidi, “Argentina Ups Gas Exports to Chile,Region Appears Well Supplied,” The Oil Daily, Vol.59, No. 41 (March 3, 2009), p. 5.
66. Global Insight, Inc., “Brazil: Date Set for BrazilianHydroelectric Power Plant Tender” (January 28,2008), web site www.globalinsight.com.
67. Global Insight, Inc., “Brazil: Environmental AgencyWins Second Appeal Overturning Brazilian CourtInjunction Against Power Plant” (December 8,2008), web site www.globalinsight.com.
68. Global Wind Energy Council, “The PROINFA Pro-gram,” Global Wind 2007 Report (May 2008), p. 22,web site www.gwec.net/fileadmin/documents/test2/gwec-08-update_FINAL.pdf.

Chapter 6
Industrial Sector Energy ConsumptionWorldwide industrial energy consumption increases by an average of
1.4 percent per year from 2006 to 2030 in the IEO2009 reference case.
Much of the growth is expected to occur in the developing non-OECD nations.
The world’s industries make up a diverse sector thatincludes manufacturing, agriculture, mining, and con-struction. Industrial energy demand varies acrossregions and countries, depending on the level and mixof economic activity and technological development,among other factors. Energy is consumed in the indus-trial sector for a wide range of activities, such as process-ing and assembly, space conditioning, and lighting.Industrial energy use also includes natural gas andpetroleum products used as feedstocks to produce non-energy products, such as plastics. In aggregate, theindustrial sector uses more energy than any otherend-use sector, consuming about one-half of the world’stotal delivered energy.
Over the next 25 years, worldwide industrial energyconsumption is projected to grow from 175.0 quadrillionBtu in 2006 to 245.6 quadrillion Btu in 2030 (Table 12). Inthe IEO2009 reference case, world industrial energydemand increases at an average annual rate of 1.4 per-cent to 2030. National economic growth rates return tohistorical trends when the current economic downturnends, with much of the subsequent growth in industrialsector energy demand expected to occur in the develop-ing non-OECD nations.
Currently, non-OECD economies consume 58 percent ofglobal delivered energy in the industrial sector. In theperiod through 2030, industrial energy use in the
Energy Information Administration / International Energy Outlook 2009 85
Table 12. OECD and Non-OECD Industrial Energy Consumption by Source, 2006-2030(Quadrillion Btu)
Region 2006 2010 2015 2020 2025 2030
Average AnnualPercent Change,
2006-2030
OECDLiquids . . . . . . . . . . . . . . . . . . . . 31.3 27.8 28.2 28.2 28.2 28.4 -0.4Natural Gas . . . . . . . . . . . . . . . . 19.1 19.5 20.5 21.0 21.7 22.4 0.7Coal . . . . . . . . . . . . . . . . . . . . . . 9.2 8.6 8.5 8.4 8.4 8.5 -0.3Electricity . . . . . . . . . . . . . . . . . . 11.2 11.5 12.3 12.8 13.2 13.7 0.8Renewables . . . . . . . . . . . . . . . . 2.4 2.7 2.9 3.3 3.8 4.1 2.2Total OECD. . . . . . . . . . . . . . . 73.1 70.0 72.3 73.7 75.5 77.1 0.2
Non-OECDLiquids . . . . . . . . . . . . . . . . . . . . 29.2 31.4 33.6 36.7 39.4 41.8 1.5Natural Gas . . . . . . . . . . . . . . . . 23.2 26.9 31.8 35.2 38.0 40.5 2.3Coal . . . . . . . . . . . . . . . . . . . . . . 34.2 37.8 41.8 46.2 49.3 51.2 1.7Electricity . . . . . . . . . . . . . . . . . . 14.9 19.6 23.4 27.4 31.3 34.6 3.6Renewables . . . . . . . . . . . . . . . . 0.3 0.3 0.3 0.3 0.3 0.3 0.1Total Non-OECD. . . . . . . . . . . 101.9 115.9 131.0 145.7 158.2 168.5 2.1
WorldLiquids . . . . . . . . . . . . . . . . . . . . 60.5 59.2 61.8 64.9 67.6 70.3 0.6Natural Gas . . . . . . . . . . . . . . . . 42.3 46.4 52.3 56.1 59.8 62.9 1.7Coal . . . . . . . . . . . . . . . . . . . . . . 43.4 46.4 50.3 54.7 57.8 59.7 1.3Electricity . . . . . . . . . . . . . . . . . . 26.2 31.0 35.7 40.1 44.5 48.4 2.6Renewables . . . . . . . . . . . . . . . . 2.7 2.9 3.2 3.6 4.1 4.3 2.0Total World . . . . . . . . . . . . . . . 175.0 185.9 203.3 219.4 233.7 245.6 1.4
Note: Totals may not equal sum of components due to independent rounding.Sources: 2006: Derived from Energy Information Administration (EIA), International Energy Annual 2006 (June-December 2008),
web site www.eia.doe.gov/iea. Projections: EIA, World Energy Projections Plus (2009).

non-OECD countries is expected to grow at a rate of 2.1percent per year, compared with 0.2 percent per year inthe OECD countries (Figure 63). Thus, 94 percent of thegrowth in industrial energy use from 2006 to 2030 is pro-jected to take place in non-OECD countries. In 2030,non-OECD nations are expected to consume 69 percentof total delivered energy in the world’s industrial sector.
Fuel prices shape the mix of fuel consumption in theindustrial sector, as industrial enterprises are assumedto choose the cheapest fuels available to them, wheneverpossible. Because liquids are more expensive than otherfuels, world industrial sector liquids use increases at anaverage annual rate of only 0.6 percent in the projection(Figure 64), and the share of liquid fuels in the industrialfuel mix declines. The liquids share is displaced primar-ily by electricity use, which grows by an average of 2.6percent per year from 2006 to 2030.
At present, the overall industrial fuel mixes in the OECDand non-OECD countries differ, especially for liquidsand coal. In 2006, liquids made up 43 percent of indus-trial energy use in the OECD countries, compared with29 percent in the non-OECD countries; however, OECDindustrial liquids use declines at a rate of 0.4 percent peryear between 2006 and 2030, while non-OECD liquidsuse increases at a rate of 1.5 percent per year. In 2030, thenon-OECD industrial sector consumes 41.8 quadrillionBtu of energy from liquids, compared with 28.4 quadril-lion Btu for the OECD industrial sector.
Coal use in the industrial sector also is considerablymore prominent in non-OECD nations than in theOECD nations, especially in China and India, whichhave abundant domestic coal reserves and less stringent
environmental regulations. Coal represented 13 percentof OECD industrial energy use in 2006 and is projectedto decline by an average of 0.3 percent per year over theprojection period. In non-OECD nations, coal repre-sented 34 percent of industrial energy us in 2006 andincreases by an average of 1.7 percent per year.
Total industrial energy consumption in each region is aproduct of the energy intensity of industrial output—asmeasured by the energy consumed per unit of output—and the level of industrial output. To capture thedynamics of industrial energy consumption, those twoelements must be examined in concert. This chapterfocuses on the policy and economic trends that driveboth the changes in the energy intensity of production inkey industries and the trade and development patternsthat affect the levels of industrial output in differentareas.
Energy-intensive industries, which consume most of theenergy in the industrial sector, have focused on reducingtheir energy consumption for years, because energy rep-resents a large portion of their costs [1]. Enterprises canreduce energy use in numerous ways. Industrial pro-cesses can be improved to reduce energy waste andrecover energy, often process heat, which would other-wise be lost. Recycling material and fuel inputs alsoimproves efficiency. Public policies aimed at reducinggreenhouse gas emissions often include mandates forheavy industry to lower the energy intensity of produc-tion, especially in OECD countries.
Policies governing greenhouse gas emissions also caninfluence the location of new energy-intensive industrialenterprises. The phenomenon of industries relocating
86 Energy Information Administration / International Energy Outlook 2009
73 70 72 74 76 77
102116
131146
158169
2006 2010 2015 2020 2025 20300
50
100
150
200Quadrillion Btu
OECD Non-OECD
Figure 63. OECD and Non-OECD Industrial SectorEnergy Consumption, 2006-2030
Sources: 2006: Derived from Energy Information Adminis-tration (EIA), International Energy Annual 2006 (June-December 2008), web site www.eia.doe.gov/iea. Projections:EIA, World Energy Projections Plus (2009).
60
42
43
26
3
175
70
63
60
48
4
246
Liquids
Natural Gas
Coal
Electricity
Renewables
Total
0 50 100 150 200 250 300
Quadrillion Btu
2006
2030
Figure 64. World Industrial Sector EnergyConsumption by Fuel, 2006 and 2030
Sources: 2006: Derived from Energy Information Adminis-tration (EIA), International Energy Annual 2006 (June-December 2008), web site www.eia.doe.gov/iea. 2030: EIA,World Energy Projections Plus (2009).

their emissions-intensive facilities to less restrictiveoperating environments, know as “carbon leakage,” isonly one of many factors influencing global patterns ofindustrial output [2]. Countries’ development trajecto-ries also play a major role. When economies initiallybegin to develop, industrial energy use rises as manufac-turing output begins to take up a larger portion of GDP,as has taken place already in many non-OECD econo-mies (most clearly in China). When the developing econ-omies attain higher levels of economic development,they begin to transition to service-oriented economies,and their industrial energy use begins to level off as canbe seen currently in OECD countries.
The following section describes patterns of energy use inthe world’s most energy-intensive industries. Subse-quent sections examine specific patterns of industrialenergy use in the major OECD and non-OECD regions.
Energy-Intensive IndustriesFive industries account for 68 percent of all energy usedin the industrial sector (Figure 65): chemicals (29 per-cent), iron and steel (20 percent), nonmetallic minerals(10 percent), pulp and paper (6 percent), and nonferrousmetals (3 percent) [3]. The quantity and fuel mix offuture industrial energy consumption will be deter-mined largely by energy use in those five industries. Inaddition, the same industries emit large quantities ofcarbon dioxide, related to both their energy use and theirproduction processes (see box on page 88).
The largest industrial consumer of energy is the chemi-cal sector, which made up 29 percent of total world
industrial energy consumption in 2006. Energy repre-sents 60 percent of the industry’s cost structure and aneven higher percentage in the petrochemical subsector,which uses energy products as feedstocks. Petrochemi-cal feedstocks account for 60 percent of the energy usedin the chemicals sector. Intermediate petrochemicalproducts, or “building blocks,” which go into productssuch as plastics, require a fixed amount of hydrocarbonfeedstock input. In other words, for any given amount ofchemical output a fixed amount of feedstock is required,depending on the fundamental chemical process of pro-duction, which greatly reduces opportunities for reduc-ing fuel use [4].
By volume, the largest “building block” in the petro-chemical sector is ethylene, which can be produced byvarious chemical processes. In Europe and Asia, ethyl-ene is produced primarily from naphtha, which isrefined from crude oil. In North America and the MiddleEast, where domestic supplies of natural gas are moreabundant, ethylene is produced from ethane, which typ-ically is obtained from natural gas. Because petrochemi-cal feedstocks represent such a large share of industrialenergy use, patterns of feedstock use play a substantialrole in determining each region’s fuel mix.
In recent years, most of the expansion of petrochemicalproduction and consumption has taken place in non-OECD Asia. Although the global recession will slowdemand growth for a time, continued aggressive expan-sion of petrochemical manufacturing capacity in Asiaand the Middle East points toward further growth of thepetrochemical industry over the projection period. Since2004, capital expenditures in the chemical sector of theAsia-Pacific region have outpaced those in North Amer-ica and Europe combined. That trend is likely to con-tinue through 2013 [5]. The chemical sector also is likelyto continue using hydrocarbon feedstocks throughoutthe projection period, although the high oil prices ofrecent years have sparked interest in the use of alterna-tive renewable feedstocks, such as agricultural (“chem-urgy”) products, which could gain some market share33
during the forecast period [6].
The next-largest industrial user of energy is iron andsteel, which accounts for about 20 percent of industrialenergy consumption. Across the iron and steel sector asa whole, energy represents roughly 15 percent of pro-duction costs [7]. The amount of energy used in the pro-duction of steel varies greatly, however, depending onthe process used. In the blast furnace process, super-heated oxygen is blown into a furnace containing ironore and coke. The iron ore is reduced (meaning that oxy-gen molecules in the ore bond with the carbon), leavingmolten iron and carbon dioxide [8]. Coal use and heat
Energy Information Administration / International Energy Outlook 2009 87
Chemicals
Iron and Steel
Nonmetallic Minerals
Pulp and Paper
Nonferrous Metals
Other
0 10 20 30 40
Percent of Total
20%
10%
6%
3%
32%
29%
Figure 65. World Industrial Sector EnergyConsumption by Major Energy-IntensiveIndustry Shares, 2005
Source: International Energy Agency Data Services, WorldEnergy Balances (2007), web site http://data.iea.org (subscrip-tion site).
33 Analysts estimate that world oil prices must be sustained at $50 to $60 per barrel in order for this technology to be economicallyfeasible.

generation make this process tremendously energy-intensive, and in addition it requires metallurgical coal,or coking coal, which is more costly than steam coalbecause of its lower ash and sulfur content.
Electric arc furnaces, the other major type of steel pro-duction facility, produce steel by using an electriccurrent to melt scrap metal. The process is more energy-efficient and produces less carbon dioxide than the blast
88 Energy Information Administration / International Energy Outlook 2009
Process-Related Emissions in the Industrial Sector
Carbon dioxide emissions in the industrial sector resultfrom both energy use and production processes.Together, energy- and process-related emissions in theindustrial sector account for about one-fourth of globalcarbon dioxide emissions.a Process-related emissionsare a direct byproduct of production. Because releasesof carbon dioxide are inherent in the production of ironand steel, cement, and aluminum, the potential forreducing process-related emissions is limited. As aresult, carbon abatement will face significant techno-logical challenges in the industrial sector. In addition,there are no economical substitutes for these materialsor their production processes, and none is likely beavailable in the near term.
The largest carbon dioxide emitter in the industrial sec-tor is the iron and steel industry. In addition to beingtremendously energy-intensive, the blast furnace pro-cess for steel production generates carbon dioxidedirectly. When super-heated oxygen (O) is blown into ablast furnace containing coal coke and iron oxide(FE2O3), the oxygen fuses with carbon in the coke toproduce carbon monoxide (CO) which, at high temper-atures, reduces iron oxide by removing the oxygen toproduce pure molten iron (Fe) and carbon dioxide. Theprimary chemical reaction involved in the process is:
Fe2O3 + 3CO � 2Fe + 3CO2 .
Two-thirds of the world’s steel production uses blastfurnaces, including 90 percent of the steel made inChina, which is the world’s fastest-growing steel pro-ducer.b
The situation is similar in the cement industry. The pri-mary ingredient in marketed cement is cement clinker,composed largely of calcium oxide (CaO). Clinker isproduced by superheating quarried and ground rawmaterials in a massive kiln. The most abundant mate-rial in the process is limestone (CaCO3). The chemicalreaction involved in heating limestone is:
CaCO3 � CaO + CO2 .
Although there are many possible ways to improveenergy efficiency in the cement production process, the
fundamental chemistry of producing cement clinkerwill always result in direct emissions of carbon diox-ide. Cement industry groups point out that cement andconcrete are important components of environmen-tally friendly development because of their durabilityand energy performance.c To the extent that that istrue, demand for cement is likely to remain strong evenin the most carbon-constrained future scenario, anddirect emissions from cement production will remainan issue.
The basic process involved in producing aluminumalso emits carbon dioxide directly. Aluminum is pro-duced by running an electrical current through a mol-ten mixture of electrolyte and refined alumina (Al2O3).In the process, carbon (C) from a graphite anode fuseswith and removes oxygen from the alumina to producemolten aluminum metal. A simplified version of thereaction is:
2Al2O3 + 3C � 4Al + 3CO2 .
Just as cement will continue to be a component ofenergy efficiency improvements in the buildings sec-tor, aluminum will play a role in reducing fuel use inthe transportation sector. Specifically, fuel economy issubstantially improved when aluminum is used toreduce the weight of vehicles. Although aluminumproduction from recycled scrap metal would avoidmost of the process-related emissions, most of the alu-minum sold in world markets probably will come fromprimary production for the foreseeable future.
The inability of major energy users (and carbon diox-ide emitters) in the industrial sector—including theiron and steel, cement, and aluminum industries—toremove carbon dioxide from their production pro-cesses limits their ability to respond to climate changeinitiatives. The situation is further complicated in thatdemand for their products is unlikely to subside in thenear future. As a result, policy regimes insituted byOECD nations to address carbon dioxide emissionsalready have begun to afford those industries specialtreatment.
aInternational Energy Agency, Energy Technology Perspectives: Scenarios and Strategies to 2050 (Paris, France, June 2008), p. 471.bWorld Steel Association, “World Steel in Figures 2008” (2008), web site www.worldsteel.org/pictures/publicationfiles/
WSIF%202008%202nd%20edition.pdf.cPortland Cement Association, “Sustainable Development” (2008), web site www.cement.org/newsroom/newsroom_reference_
sustain.asp.

furnace process, but it depends on a reliable supply ofdiscarded steel. Currently, two-thirds of global steelproduction uses the blast furnace process. The onlymajor steel producers that make a majority of their steelusing the electric arc furnace process are the UnitedStates (59 percent) and India (58 percent) [9].
Earlier this decade, non-OECD economies witnessed a(now-subsiding) boom in steel production and con-sumption that drove up global production and prices.Fueled by demand from the construction and manufac-turing sectors, China has become the world’s largeststeel manufacturer, producing more steel than the sevennext-largest producers combined (Figure 66). Ninetypercent of China’s production employs the blast-furnacemethod [10]. A major effect of increased steel productionhas been a sharp rise in the price of scrap metal, whichhas made the blast furnace method of production morecost-effective, especially in non-OECD countries that donot have large inventories of scrap metal. When scrapsteel becomes available and cheap enough to have aclear cost advantage over iron ore, use of electric arc fur-naces in non-OECD countries will increase, reducingcoal use and increasing electricity use.
After iron and steel, the next largest energy-consumingindustry is nonmetallic minerals, which includescement, glass, brick, and ceramics. Production of thosematerials requires a substantial amount of heat andaccounts for 10 percent of global industrial energy use.The most significant nonmetallic minerals industry iscement production, which accounts for 83 percent ofenergy use in the nonmetallic minerals sector [11].Although the cement industry in OECD countries hasimproved energy efficiency over the years by switchingfrom the “wet kiln” production process to the “dry kiln”
process, which requires less heat [12], energy costs stillconstitute 40 percent of the total cost of cement produc-tion [13].
Although OECD countries are beginning to add someadditional cement production capacity, the primarygrowth in cement production over the next few years isexpected to be in non-OECD countries. As is the case forsteel, the growth in cement production is fueled bygrowing demand in the construction sector [14]. In thecoming years, the energy efficiency of cement produc-tion is likely to increase as a result of continued improve-ments in kiln technology, the use of recycled material(such as used tires) as fuel, and increased use of addi-tives to reduce the amount of clinker (the primary ingre-dient in marketed cement) needed to produce a givenamount of cement [15].
Pulp and paper production accounts for 6 percent ofglobal industrial energy use. Paper manufacturing is anenergy-intensive process, but paper mills typically gen-erate about one-half of the energy they use throughcogeneration with biomass from wood waste. In somecases, paper mills generate more electricity than theyneed and are able to sell their excess power back to thegrid [16]. Because of the widespread use of biomass andthe high efficiency of the cogeneration process, a dra-matic reduction in the energy intensity of paper outputis unlikely in the near future. In addition, total output ofthe paper industry has declined in recent years as tech-nological substitutes for paper—notably, electronicrecord keeping and the dissemination of information viathe Internet. Although the world’s total paper output isunlikely to grow over the projection period, increases innon-OECD demand should slow the decline in the
Energy Information Administration / International Energy Outlook 2009 89
31
19
9
11
2
73
28
22
8
14
4
77
Liquids
Natural Gas
Coal
Electricity
Renewables
Total
0 20 40 60 80 100
Quadrillion Btu
2006
2030
Figure 67. OECD Industrial Sector EnergyConsumption by Fuel, 2006 and 2030
Sources: 2006: Derived from Energy Information Adminis-tration (EIA), International Energy Annual 2006 (June-December 2008), web site www.eia.doe.gov/iea. 2030: EIA,World Energy Projections Plus (2009).
OECD
Japan
United States
South Korea
Germany
Non-OECD
China
Russia
India
Ukraine
Brazil
0 100 200 300 400 500
Million Metric Tons
Figure 66. OECD and Non-OECD Major SteelProducers, 2007
Source: World Steel Association, “World Steel in Figures2008” (October 2008), web site www.worldsteel.org/pictures/publicationfiles/WSIF%202008%202nd%20edition.pdf.

global paper industry. For example, China recentlymade the transition from a net exporter to a net importerof paper [17].
Production of nonferrous metals, which include alumi-num, copper, lead, and zinc, consumed 3 percent ofindustrial delivered energy in 2006, mostly for alumi-num production. Although aluminum is one of the mostwidely recycled materials on the planet, 70 percent ofaluminum still comes from primary production [18].Energy accounts for about 30 percent of the total produc-tion cost of primary aluminum manufacturing and is thesecond most expensive input after alumina ore [19].Lower electricity costs and increased demand have ledto substantial growth in aluminum production innon-OECD countries. To guard against electricity out-ages and fluctuations in electric power prices, many alu-minum producers have turned to hydropower, going sofar as to locate plants in areas where they can operatecaptive hydroelectric facilities. For example, Norway,which possesses considerable hydroelectric resources,hosts seven aluminum smelters. Today, more than halfof the electricity used to make primary aluminum comesfrom hydropower [20].
Aluminum production from recycled materials usesonly one-twentieth of the energy of primary production[21]. Although both the aluminum industry and manygovernments encourage aluminum recycling, it isunlikely that the share of aluminum made from recycledproduct will increase much in the future, because mostaluminum (which is consumed in the construction andmanufacturing sectors) is used for long periods of time.Indeed, with three-fourths of the aluminum ever pro-duced still in use [22], it is likely that the aluminumindustry will continue to consume large amounts ofelectricity.
Regional OutlookOECD Countries
In recent decades, OECD countries have been in transi-tion from manufacturing economies to service econo-mies. As a result, in the IEO2009 reference case,industrial energy use in the OECD countries grow at anaverage annual rate of only 0.2 percent from 2006 to2030, as compared with a rate of 1.0 percent per year inthe commercial sector, reflecting the shift from indus-trial interests to service economies. In addition to theshift away from industry, slow growth in OECD indus-trial energy consumption can be attributed to slowgrowth in economic output. OECD economies are
projected to grow by 2.2 percent per year in the IEO2009reference case, compared with 2.8 percent per year pro-jected in the IEO2008 reference case. Although OECDeconomies currently account for 59 percent of globaleconomic output (as measured in purchasing powerparity terms), their share falls to about 43 percent in2030.
Higher oil prices in the IEO2009 reference case lead tochanges in the industrial fuel mix of OECD nations(Figure 67). OECD liquids use in the industrial sector isprojected to contract by 0.4 percent per year, reducingthe share of liquids in industrial energy use from 43 per-cent in 2006 to 37 percent in 2030. Coal use in the indus-trial sector also declines, and coal’s share of OECDdelivered industrial energy use falls from 13 percent to11 percent, as industrial uses of natural gas, electricity,and renewables expand. Industrial consumption ofrenewables in the OECD countries grows faster than theuse of any other fuel, nearly doubling from 2006 to 2030,but still represents just 5 percent of total OECD indus-trial energy use in 2030. In the coming decades, indus-trial fuel use patterns and energy intensity trends in theOECD countries are expected to be determined as muchby policies regulating energy use as by economic andtechnological fundamentals.
Currently, more energy is consumed in the industrialsector in the United States than in any other OECD coun-try, and that continues to be true throughout theIEO2009 reference case projection. Minimal growth inU.S. industrial energy use is projected, however, averag-ing 0.2 percent per year and rising from 25.3 quadrillionBtu in 2006 to 26.3 quadrillion Btu in 2030,34 with theindustrial share of total U.S. energy consumptionremaining at approximately one-third in 2030. In con-trast, U.S. commercial energy use increases at more thanfive times that rate, reflecting the continued U.S. transi-tion to a service economy. With oil prices rising steadilyin the reference case, liquids consumption in the U.S.industrial sector contracts on average by 0.8 percentper year,35 which is the steepest decline in the OECD.Increasing use of natural-gas-based feedstocks in theU.S. petrochemical sector causes demand for liquids inthe industrial sector to be more elastic than it is in OECDAsia or OECD Europe.
The use of renewable fuels in the U.S. industrial sectorgrows faster than the use of any other energy source inthe reference case, increasing its share of the fuel mixfrom 8 percent in 2006 to 14 percent in 2030.36 Most of thegrowth can be attributed to an increase in recycling of
90 Energy Information Administration / International Energy Outlook 2009
34 In the updated AEO2009 reference case (April 2009), the total contracts to 24.9 quadrillion Btu in 2030, largely as a result of slower mac-roeconomic growth than projected in the published AEO2009 reference case (March 2009).
35 In the updated AEO2009 reference case (April 2009), the rate of contraction is 1.0 percent per year, largely as a result of slower macroeco-nomic growth than projected in the published AEO2009 reference case.
36 In the updated AEO2009 reference case (April 2009), the share grows to 16 percent in 2030, based on renewable energy measures in-cluded in ARRA2009.

waste energy and waste products and to legislationleading to further reductions in the energy intensity ofindustrial processes. For example, the U.S. Departmentof Energy supports reductions in energy use through itsIndustrial Technologies Program, guided by the EnergyPolicy Act of 2005, which is working toward a 25-percentreduction in the energy intensity of U.S. industrial pro-duction by 2017 [23]. The Energy Independence andSecurity Act of 2007 (EISA2007) also addresses energy-intensive industries, providing incentive programs forindustries to recover additional waste heat and support-ing research, development, and demonstration for effi-ciency-increasing technologies [24].
Industrial energy use in Canada grows at an averagerate of 1.1 percent per year in the IEO2009 reference case,continuing to constitute just under one-half of Canada’stotal delivered energy use. With world oil prices pro-jected to return to and remain at sustained high levels,liquids use in the industrial sector does not increasefrom current levels, while natural gas use increases by1.8 percent per year. As a result, the share of liquids inthe industrial fuel mix falls from 37 percent in 2006 to 28percent in 2030, while the natural gas share increasesfrom 41 percent to 48 percent. As in the United States,Canada’s petrochemical sector uses a substantialamount of natural-gas-based feedstocks. In addition,increased production of unconventional liquids (oilsands) in western Canada, which requires a largeamount of natural gas, contributes to the projectedincrease in industrial natural gas use.
Industrial energy efficiency in Canada has been increas-ing at an average rate of about 1.5 percent per year inrecent decades, largely reflecting provisions in Canada’sEnergy Efficiency Act of 1992 [25]. The governmentrecently increased those efforts, releasing the Regula-tory Framework for Industrial Greenhouse Gas Emis-sions in 2007, which calls for a 20-percent reduction ingreenhouse gas emissions by 2020. The plan stipulatesthat industrial enterprises must reduce the emissionsintensity of production by 18 percent between 2006 and2010 and by 2 percent per year thereafter. The proposalexempts “fixed process emissions,” from industrial pro-cesses in which carbon dioxide is a basic chemicalbyproduct of production. Therefore, most of the abate-ment will have to come from increased energy efficiencyand fuel switching [26].
Mexico’s GDP grows by 3.4 percent year from 2006 to2030 in the reference case, which is the highest economicgrowth rate among all the OECD nations. Mexico also isprojected to have the highest average annual rate ofgrowth in industrial energy use, at 1.8 percent per year,with industrial energy use growing to 4.1 quadrillionBtu in 2030 from 2.7 quadrillion Btu in 2006. The coun-try’s industrial sector continues to use oil and naturalgas for most of its energy needs, and the combined share
of liquids and natural gas in the industrial fuel mixremains above 80 percent throughout the projection.
In OECD Europe, GDP grows by 2.0 percent per yearand population by 0.2 percent per year from 2006 to 2030in the IEO2009 reference case, while industrial energyuse increases by 0.1 percent per year. The continuingtransition of Europe to a service economy is reflected inthe projection for growth in commercial sector energyuse, which is nine times the projected growth in indus-trial energy use.
Energy and environmental policies are a significant fac-tor behind the trends in industrial energy use in OECDEurope. In December 2008, the European Parliamentpassed the “20-20-20” plan, which stipulated a 20-percent reduction in greenhouse gas emissions, a 20-percent improvement in energy efficiency, and a 20-percent share for renewables in the fuel mix of EuropeanUnion member countries by 2020 [27]. In debates on theplan, representatives of energy-intensive industriesvoiced concern about the price of carbon allocations.They argued that fully auctioning carbon dioxide per-mits to heavy industrial enterprises exposed to globalcompetition would simply drive industrial productionfrom Europe and slow carbon abatement efforts at theglobal level [28]. The resulting compromise was anagreement that 100 percent of carbon allowances wouldbe given to heavy industry free of charge, provided thatthey adhered to efficiency benchmarks [29].
The 20-20-20 policy also is expected to affect the mix offuels consumed in OECD Europe’s industrial sector.Industrial coal use contracts at a rate of 1.1 percent peryear over the projection period, while both natural gasuse and renewables use increase. Industrial sector use of
Energy Information Administration / International Energy Outlook 2009 91
29
23
34
15
0
102
42
40
51
35
0
168
Liquids
Natural Gas
Coal
Electricity
Renewables
Total
0 50 100 150 200
Quadrillion Btu
2006
2030
Figure 68. Non-OECD Industrial Sector EnergyConsumption by Fuel, 2006 and 2030
Sources: 2006: Derived from Energy Information Adminis-tration (EIA), International Energy Annual 2006 (June-December 2008), web site www.eia.doe.gov/iea. 2030: EIA,World Energy Projections Plus (2009).

electric power, increasingly generated from low-carbonsources in OECD Europe, also rises. Liquids use in theindustrial sector decreases only slightly, by 0.2 percentper year, because the vast majority of feedstocks inOECD Europe’s petrochemical sector are oil-based.
Japan has the slowest projected GDP growth among theOECD regions, at 0.8 percent per year in the IEO2009 ref-erence case. Consequently, industrial consumption ofdelivered energy falls by 0.4 percent per year—the onlyprojected decline among the OECD nations. Along withslow economic growth, a major factor behind Japan’sslowing industrial energy use is efficiency. BecauseJapan possesses virtually no domestic energy supplies, itmaintained a strategic focus on reducing energy uselong before high prices brought energy security to theforefront of global issues. As a result, the energy inten-sity of Japan’s industrial production is among the lowestin the world. Since 1970, Japan has reduced the energyintensity of its manufacturing sector by 50 percent,mostly through efficiency improvements, along with astructural shift toward lighter manufacturing. In 2006,Japan approved a “frontrunner” plan, aimed at improv-ing its national energy efficiency by another 30 percentby 2030 [30].
South Korea, which experienced rapid industrial devel-opment during the later years of the 20th century, isbeginning to make a transition to a service-orientedeconomy. In the IEO2009 reference case, South Korea’sGDP grows at an average annual rate of 3.3 percent from2006 to 2030, much faster than the OECD average of 2.2percent per year. Its industrial energy use grows by just0.2 percent per year, however, while its commercialenergy use grows by nearly 2 percent per year. Accord-ingly, the industrial share of delivered energy use inSouth Korea falls from 58 percent in 2006 to 53 percent in2030.
South Korea currently is the sixth-largest steel producerin the world. A large portion of its steel productionalready is from electric arc furnaces [31], and that por-tion is projected to grow as inventories of discarded steelbuild up. As a result, coal consumption in South Korea’sindustrial sector decreases in the reference case, andelectricity is the fastest-growing source of energy forindustrial uses.
In Australia and New Zealand, industrial deliveredenergy consumption grows by 0.8 percent per year in thereference case, from 1.9 quadrillion Btu in 2006 to 2.4quadrillion Btu in 2030. Industry’s share of deliveredenergy consumption in the region remains steady atslightly less than 50 percent. The implementation of anAustralian emissions trading scheme in 2009 is expectedto reduce the region’s energy use somewhat in the com-ing decades [32]. Liquids consumption in the industrialsector remains flat in the projection as a result of high
world oil prices, while the share of coal in the industrialfuel mix increases from 11 percent of delivered energyuse in 2006 to 17 percent in 2030, exploiting Australia’sabundant coal reserves.
Non-OECD Countries
Non-OECD industrial energy consumption grow at anaverage annual rate of 2.1 percent in the IEO2009 refer-ence case—10 times the average for the OECD countriesas a whole (Figure 68). The industrial sector accountedfor about 60 percent of total non-OECD delivered energyuse in 2006 and is expected to continue consumingapproximately that share of the total through 2030. Withthe non-OECD economies projected to expand at anaverage annual rate of 4.9 percent, their share of globaloutput increases from 41 percent in 2006 to 57 percent in2030.
The key engines of non-OECD growth in the IEO2009projections are the BRIC countries (Brazil, Russia, India,and China), which are expected to account for more thantwo-thirds of the growth in non-OECD industrialenergy use through 2030. China’s growth rate in indus-trial energy consumption, averaging 2.7 percent per yearover the period, is higher than projected for any othermajor economy, and its industrial energy use nearlydoubles from 2006 to 2030.
The industrial sector accounted for 76 percent of China’stotal delivered energy consumption in 2006 and is pro-jected to remain above 70 percent through 2030. Sincethe beginning of economic reform in 1979, China’s GDPhas grown by 9.8 percent per year through 2007 [33]. TheIEO2009 reference case projects a slower but substantialaverage growth rate of 6.4 percent per year for China’sGDP through 2030, despite a reduction in the 2006-2010growth projection relative to the IEO2008 reference casebecause of the global economic slowdown. With a returnto strong growth between 2011 and 2015, China still isexpected to account for more than one-fourth of totalglobal GDP growth from 2006 to 2030.
In addition to the impact of strong economic growth onindustrial energy demand in China, continued rapidincreases in industrial demand can be explained in partby the structure of the Chinese economy. Although theenergy intensity of production in individual industrieshas improved over time, heavy industry accounts formore than 70 percent of China’s total output [34].Energy-intensive industries, including steel, cement,and chemicals, provide inputs to China’s massive exportand construction sectors, which continue to flourish inthe IEO2009 projection. China is expected to constructan additional 65 billion square feet of building space by2020—equal to Europe’s current total building stock[35]—contributing to demand for basic materials andincreased energy use in the industrial sector.
92 Energy Information Administration / International Energy Outlook 2009

Government policy contributes as much as to theenergy-intensive structure of the Chinese economy asdoes demand growth. A considerable share of heavyindustrial production in China is carried out by largeState-Owned Enterprises (SOEs), which are favored byChinese economic policy. SOEs enjoy relatively easyaccess to capital through state-owned banks and otherforms of government support, such as subsidizedenergy supplies [36]. In some of the first policy initia-tives to address the recent economic downturn, China’sgovernment extended export tax support, financing,and some direct funding to the steel industry [37]. Takentogether, those measures and existing government poli-cies support continued expansion of China’s industrialenergy use in the reference case.
China’s industrial fuel mix is projected to change some-what over the projection period. Despite its abundantcoal reserves, direct use of coal in China’s industrial sec-tor is grows by an average of only 1.9 percent per yearin the reference case, while industrial use of electricity(most of which is coal-fired) grows by 4.6 percentper year. As a result, coal’s share in the industrial fuelmix falls from 61 percent in 2006 to 51 percent in 2030,while electricity’s share increases from 18 percent to28 percent.
The vast majority of steel production in China, whichaccounts for one-third of the country’s industrial energyuse, employs the coal-intensive blast furnace process. AsChina’s economy matures, however, and a more reliableinventory of scrap steel is developed, much of the steelmanufacturing capacity added over the projectionperiod uses the electricity-intensive electric arc furnaceprocess. Additionally, as China continues to expandmanufacturing in areas with higher added value, suchas consumer electronics and computer components, theshare of industries that use electricity instead of primaryfuels increases.
Despite focusing primarily on economic development,the Chinese government also has introduced policy ini-tiatives focused on improving industrial energy effi-ciency. In 2005, China released its 11th Five YearEconomic Plan, which included the goal of reducingenergy intensity by 20 percent between 2005 and 2010. Insupport of that goal, China introduced a “Top-1000Energy-Consuming Enterprises” program, designed toimprove the efficiency of the country’s 1,000 largestenergy consumers, which account one-third of China’stotal energy use. The program focuses on assisting majorenergy consumers through benchmarking, energyaudits, technological assistance, and stricter reporting[38]. In the IEO2009 reference case, China is projected toachieve a 16-percent reduction in the energy intensity ofits GDP between 2005 and 2010, which falls short of thegovernment’s goal but still constitutes a substantialimprovement. From 2006 to 2030, China’s total energy
intensity is projected to decline at a rate of 3 percent peryear.
In the IEO2009 reference case, India is projected to sus-tain the world’s second-highest rate of GDP growth,averaging 5.6 percent per year from 2006 to 2030. Thistranslates into a 2.3-percent average annual increase indelivered energy to the industrial sector. Although Indiais likely to achieve an economic growth rate similar toChina’s between 2006 and 2030, its levels of GDP andenergy consumption continue to be dwarfed by those inChina throughout the projection period. India’s eco-nomic growth over the next 25 years is expected toderive more from light manufacturing and services thanfrom heavy industry, so that the industrial share of totalenergy consumption falls from 72 percent in 2006 to 64percent in 2030, and its commercial energy use growsnearly twice as fast as its industrial energy use. Thechanges are accompanied by shifts in India’s industrialfuel mix, with electricity use growing more rapidly thancoal use in the industrial sector.
India has been successful in reducing the energy inten-sity of its industrial production over the past 20 years. Amajority of its steel production is from electric arc fur-naces, and most of its cement production uses dry kilntechnology [39]. A major reason is the Indian govern-ment’s public policy, which provides subsidized fuel tocitizens and farmers but requires industry to pay higherprices for fuel. Because the market interventions havespurred industry to reduce energy costs, India is nowone of the world’s lowest cost producers of both alumi-num and steel [40]. The quality of India’s indigenouscoal supplies also has contributed to the steel industry’sefforts to reduce its energy use. India’s metallurgicalcoal (which is needed for steel production in blast fur-naces) is low in quality, forcing steel producers to importmore expensive metallurgical coal from abroad [41]. Asa result, producers have invested heavily in improvingthe efficiency of their capital stock to lower the amountof relatively expensive imported coal used in the pro-duction process.
The Indian government has facilitated further reduc-tions in industrial energy use over the past decade bymandating industrial energy audits in the Energy Con-servation Act of 2001 and mandating specific consump-tion decreases for heavy industry as part of the 2008National Action Plan on Climate Change. The new planalso calls for fiscal and tax incentives for efficiency, anenergy-efficiency financing platform, and a trading mar-ket for energy savings certificates, wherein firms thatexceed their required savings level will be able to sell thecertificates to firms that have not [42]. Those measurescontribute to a reduction in the energy intensity ofIndia’s GDP, which declines by an average of 2.9 percentper year from 2006 to 2030 in the IEO2009 reference case.
Energy Information Administration / International Energy Outlook 2009 93

In Russia, industrial energy consumption patterns areshaped largely by its role as a major energy producer.Russia’s economy is projected to grow at a rate of 3.6percent per year, with industrial energy demand grow-ing by 0.9 percent per year and accounting for about 54percent of the nation’s total energy use throughout thereference case projection. The energy intensity of Rus-sia’s GDP is the highest in the world, and although itsenergy intensity declines in the reference case projec-tion, Russia remains among the least energy-efficienteconomies in the world through 2030. The relative ineffi-ciency of Russian industry can be attributed toSoviet-era capital stock and abundant and inexpensivedomestic energy supplies. In the reference case, theshare of natural gas, Russia’s most abundant domesticfuel, in the country’s industrial fuel mix increases, asdoes the share of electricity, most of which is providedby natural-gas-fired generation.
Brazil’s industrial energy use grow at an average rate of2.1 percent per year in the IEO2009 reference case, as itsGDP expands by 3.8 percent per year. Although contin-ued growth in industrial output is expected through2030, the Brazilian economy begins to move toward aservice-based economy. The share of industry in totaldelivered energy use is projected to fall from 49 percentin 2006 to 45 percent in 2030, while the rate of growth forenergy use in the commercial sector is projected doublethe rate in the industrial sector. Unlike most countriesand regions, coal use in Brazil’s industrial sector is pro-jected to expand more rapidly than the use of any otherfuel, primarily because of its burgeoning steel industry,which has become a significant global producer in recentyears, based on plentiful domestic supplies of iron oreand increasing global demand for steel [43].
Industrial energy use in the Middle East grows on aver-age by 2.1 percent per year from 2006 to 2030 in theIEO2009 reference case. In terms of energy consumption,the largest industry in the Middle East is the chemicalsector. Higher world prices for oil and natural gas havespurred new investment in the petrochemical sector,where companies can rely on low-cost feedstocks.Numerous “mega” petrochemical projects currently areunder construction in Saudi Arabia, Qatar, Kuwait, theUAE, and Iran [44]. The Middle East is becoming a majormanufacturer of the olefin building blocks that consti-tute a large share of global petrochemical output, andthe region’s ethylene production capacity is expected todouble between 2008 and 2012 [45]. Liquids and naturalgas are projected to maintain a combined 95-percentshare of the Middle East’s industrial fuel mix through2030 in the reference case.
References
94 Energy Information Administration / International Energy Outlook 2009
1. International Energy Agency, Energy TechnologyPerspectives: Scenarios and Strategies to 2050 (Paris,France, June 2008), pp. 471-473.
2. International Energy Agency, World Energy Outlook2008 (Paris, France, November 2008), p. 429.
3. International Energy Agency Data Services, EnergyBalances of Non-OECD Countries (2007), web sitehttp://data.iea.org (subscription site).
4. International Energy Agency, Tracking IndustrialEnergy Efficiency and CO2 Emissions (Paris, France,June 2007), pp. 59-75.
5. Global Insight, Inc., “IHS Global Insight Report:Chemicals (World Industry)” (December 12, 2008),web site www.globalinsight.com (subscriptionsite).
6. “Better Living Through Chemurgy,” The Economist(June 26, 2008), web site www.economist.com (sub-scription site).
7. Global Insight, Inc., “IHS Global Insight Report:Steel (World Industry)” (March 13, 2008), web sitewww.globalinsight.com (subscription site).
8. American Iron and Steel Institute, “How a BlastFurnace Works,” web site www.steel.org/AM/Template.cfm?Section=Articles3&TEMPLATE=/CM/ContentDisplay.cfm&CONTENTID=25317.
9. World Steel Association, “World Steel in Figures2008” (October 2008), web site www.worldsteel.org/pictures/publicationfiles/WSIF%202008%202nd%20edition.pdf.
10. World Steel Association, “World Steel in Figures2008” (October 2008), web site www.worldsteel.org/pictures/publicationfiles/WSIF%202008%202nd%20edition.pdf.
11. International Energy Agency, Energy TechnologyPerspectives: Scenarios and Strategies to 2050 (Paris,France, June 2008), p. 490.
12. Portland Cement Association, “Economics of theU.S. Cement Industry” (May 2008), web site www.cement.org/econ/industry.asp.
13. Cembureau (The European Cement Association),“Key Facts: Energy Is a Sensitive Factor in CementManufacturing” (2000-2009), web site www.cembureau.be.
14. Global Insight, Inc., “IHS Global Insight Report:Cement (U.S.) (World Industry)” (September 15,2008), web site www.globalinsight.com (subscrip-tion site).

Energy Information Administration / International Energy Outlook 2009 95
15. “Concrete Proposals Needed,” The Economist(December 19, 2007), web site www.economist.com(subscription site).
16. American Forest and Paper Association, “PolicyIssues: Energy” (2008), web site www.afandpa.org/Template.cfm?Section=Energy1&Template=/TaggedPage/TaggedPageDisplay.cfm&TPLID=6&ContentID=3687.
17. “Flat Prospects,” The Economist (March 15, 2007),web site www.economist.com (subscription site).
18. International Aluminum Institute, “Aluminum forFuture Generations/2007 Update” (2007), web sitewww.world-aluminium.org/UserFiles/File/fl0000189.pdf.
19. Global Insight, Inc., “IHS Global Insight Report:Nonferrous Metals (World Industry)” (September26, 2008), web site www.globalinsight.com (sub-scription site).
20. A. Simon, “Aluminum East of Suez: The Search forCheap Electricity Supplies,” Power in Asia, No. 516(November 20, 2008), pp. 4-8.
21. The Aluminum Association, “Industry Overview”(2008), web site www.aluminum.org/AM/ Tem-plate.cfm?Section=Overview&Template=/CM/HTMLDisplay.cfm&ContentID=27135.
22. International Aluminum Institute, “Aluminum forFuture Generations/2007 Update” (2007), web sitewww.world-aluminium.org/UserFiles/File/fl0000189.pdf.
23. U.S. Department of Energy, “Industrial Technol-ogies Program Fact Sheet,” web site http://www1.eere.energy.gov/industry/about/pdfs/itp_program_fact_sheet.pdf.
24. 110th Congress, “Energy Independence and Secu-rity Act of 2007,” Public Law 110-140, web sitehttp://frwebgate.access.gpo.gov/cgi-bin/getdoc.cgi?dbname=110_cong_public_laws&docid=f:publ140.110.
25. National Energy Board of Canada, “Energy BriefingNote: Codes, Standards, and Regulations Influ-encing Energy Demand” (Calgary, Alberta,November 2008), p. 13, web site www.neb.gc.ca/clf-nsi/rnrgynfmtn/nrgyrprt/nrgdmnd/cdstndrdrgltn2008/cdstndrdrgltn-eng.pdf.
26. Government of Canada, Turning the Corner: Regula-tory Framework for Industrial Greenhouse Gas Emis-sions (Ottawa, Ontario, March 2008), pp. 7-9, website www.ec.gc.ca/doc/virage-corner/2008-03/pdf/COM-541_Framework.pdf.
27. European Commission, “Climate Change: Com-mission Welcomes Final Adoption of Europe’s Cli-mate and Energy Package” (Press Release,December 17, 2008), web site http://europa.eu/rapid/pressReleasesAction.do?reference=IP/08/
1998&format=HTML&aged=0&language=EN&guiLanguage=en.
28. International Federation of Industrial Energy Con-sumers, “IFIEC Europe’s Initial Response to the EUClimate Package: Challenging Climate Change Tar-gets Require Cost Efficient Solutions” (PressRelease, January 29, 2008), web site www.ifieceurope.org/docs/climate%20package%20resp%20press%20rel%2029%2001%2008.pdf.
29. “Keeping It Clean,” The Economist (December 12,2008), web site www.economist.com (subscriptionsite).
30. Kensuke Kanekiyo, “Japanese Experience TowardEnergy Efficient Economy,” presentation at TheChina International Energy Forum (Beijing,November 1-2, 2007), web site http://eneken.ieej.or.jp/en/data/pdf/408.pdf.
31. World Steel Association, “World Steel in Figures2008” (October 2008), web site www.worldsteel.org/pictures/publicationfiles/WSIF%202008%202nd%20edition.pdf.
32. K. Rudd, “Large Issues and Medium Powers,” inThe World in 2009 (November 19, 2008), web sitewww.economist.com/theworldin (subscriptionsite).
33. W.M. Morrison, CRS Report for Congress: China’sEconomic Conditions (Washington, DC: Congressio-nal Research Service, November 20, 2009), p. 1, website http://opencrs.com/document/RL33534/2008-11-20.
34. M. Herberg, “China’s Energy and EnvironmentalCrisis,” presentation at The National Bureau ofAsian Research Energy Panel Meeting (Naperville,IL, July 23, 2008).
35. The Climate Group, China’s Clean Revolution (Lon-don, UK, 2008), pp. 15-17, web site www.theclimategroup.org/assets/resources/Chinas_Clean_Revolution.pdf.
36. J.L. Yifu, speech at “China and the Faltering GlobalEconomy: A Brookings-Caijing Symposium,”(Washington, DC, January 13, 2009), web site www.brookings.edu/~/media/Files/events/2009/0113_caijing/20090113_caijing.pdf.
37. Global Insight, Inc., “China To Accelerate CapacityExpansion of Steel, Petrochemical and Agrochemi-cals As Industrial Growth Slows” (November 20,2008), web site www.globalinsight.com (subscrip-tion site).
38. L. Price and W. Xuejun, Constraining Energy Con-sumption of China’s Largest Industrial EnterprisesThrough the Top-1000 Energy-Consuming EnterpriseProgram, LBNL-00000 (Berkeley, CA: LawrenceBerkeley National Laboratory, June 2007), p. 1, website http://ies.lbl.gov/iespubs/2007aceee.pdf.

96 Energy Information Administration / International Energy Outlook 2009
39. J.A. Sathaye, “India: Energy Demand and Supplyand Climate Opportunities,” presentation at theWorkshop on Asia-Pacific Partnership on CleanDevelopment and Climate Opportunities in Chinaand India (Washington, DC, March 22, 2006), website. http://ies.lbl.gov/ppt/indiasupplydemand.pdf.
40. “Melting Asia,” The Economist (June 5, 2008), website www.economist.com (subscription site).
41. Energy Information Administration, InternationalEnergy Outlook 2008, DOE/EIA-0484(2008) (Wash-ington, DC, September 2008), web site www.eia.doe.gov/oiaf/ieo/index.html.
42. Government of India—Prime Minister’s Council onClimate Change, National Action Plan on Climate
Change (June 2008), pp. 22-24, web site www.pmindia.nic.in/Pg01-52.pdf.
43. “ArcelorMittal Hopes Brazil Model Will Give IndiaPlans a Boost,” Hellenic Shipping News (February 9,2008), web site www.hellenicshippingnews.com/index.php?mod=article&cat=commoditynews&article=8720.
44. FACTS Global Energy, Energy Advisory: Middle EastOlefin Production Prospects: Oversupply in the Mar-ket?, No. 342 (December 2008), pp. 2-3.
45. “SPECIAL REPORT: CMAI: Wave of New MideastOlefins Capacity Coming On Line,” Oil and GasJournal, Vol. 106, No. 32 (August 25, 2008), web sitewww.ogj.com (subscription site).

Chapter 7
Transportation Sector Energy ConsumptionIn the IEO2009 reference case, transportation energy use in the non-OECD countries
increases by an average of 2.7 percent per year from 2006 to 2030, as compared with
an average of 0.3 percent per year for the OECD countries.
Over the next 25 years, world demand for liquids fuels isprojected to increase more rapidly in the transportationsector than in any other end-use sector. In the IEO2009reference case, the transportation share of total liquidsconsumption increases from 51 percent in 2006 to 56 per-cent in 2030. Over the 2006-2030 period, transportationaccounts for nearly 80 percent of the total increase inworld liquids consumption. Much of the growth intransportation energy use is projected for the non-OECDnations. Many rapidly expanding non-OECD economiesare expected to see strong growth in energy consump-tion as transportation systems are modernized andincome per capita increases the demand for personalmotor vehicle ownership. Non-OECD transportationenergy use increases by an average of 2.7 percent peryear from 2006 to 2030, as compared with an average of0.3 percent per year for transportation energy consump-tion in the OECD countries, where transportation sys-tems are generally well established (Figure 69 and Table13).
In the transportation sector, energy provides mobilityfor people and goods. For people, mobility providesaccess to employment opportunities, friends and family,grocery and clothing stores, entertainment and leisureactivities, and medical and financial services, to name a
few. For businesses, mobility provides access to themeans of production (raw materials, human resources,and the output of other businesses), as well as access tomarkets for their products. Understanding patterns in
Energy Information Administration / International Energy Outlook 2009 97
Table 13. World Energy Consumption for Transportation by Country Grouping, 2006-2030(Quadrillion Btu)
Region 2006 2010 2015 2020 2025 2030
Average AnnualPercent Change,
2006-2030
OECD . . . . . . . . . . . . . . . . . . . . . 57.8 55.4 57.0 58.8 60.4 62.5 0.3North America . . . . . . . . . . . . . . 32.6 31.8 32.8 33.6 35.0 36.9 0.5Europe . . . . . . . . . . . . . . . . . . . . 17.8 16.5 16.7 17.4 17.5 17.6 0.0Asia . . . . . . . . . . . . . . . . . . . . . . 7.4 7.1 7.5 7.8 7.9 8.0 0.3
Non-OECD . . . . . . . . . . . . . . . . . 34.2 40.6 45.8 52.2 58.5 65.2 2.7Europe and Eurasia . . . . . . . . . . 6.8 7.7 8.1 8.5 8.7 9.0 1.2Asia . . . . . . . . . . . . . . . . . . . . . . 13.0 15.8 19.6 24.4 28.8 33.2 4.0Middle East . . . . . . . . . . . . . . . . 5.0 6.0 6.6 7.2 7.9 8.9 2.4Africa . . . . . . . . . . . . . . . . . . . . . 3.3 3.8 4.0 4.2 4.5 4.7 1.5Central and South America . . . . 6.0 7.3 7.5 7.9 8.6 9.4 1.9
Total World . . . . . . . . . . . . . . . . . 91.9 96.0 102.8 111.0 118.9 127.7 1.4
Note: Totals may not equal sum of components due to independent rounding.Sources: 2006: Derived from Energy Information Administration (EIA), International Energy Annual 2006 (June-December 2008),
web site www.eia.doe.gov/iea. Projections: EIA, World Energy Projections Plus (2009).
2006 2010 2015 2020 2025 20300
20
40
60
80Quadrillion Btu
OECD Non-OECD
Figure 69. OECD and Non-OECD TransportationSector Liquids Consumption, 2006-2030
Sources: 2006: Derived from Energy Information Adminis-tration (EIA), International Energy Annual 2006 (June-December 2008), web site www.eia.doe.gov/iea. Projections:EIA, World Energy Projections Plus (2009).

transportation energy demand is important, becausedistances traveled and modes used to attain access in thefuture may differ from historical trends.
Because access to people, goods, and services (ratherthan mobility per se) is the prime consideration forassessing demand growth in the transportation sector,factors that have nothing to do with transportationequipment can have profound effects on the amount ofenergy consumed. For example, advances in communi-cation technologies have made it possible for consumersto have a high degree of access to financial services with-out traveling to a financial institution. Similarly,high-speed Internet communication has increased theproductivity of telecommuters, reducing traffic conges-tion, air pollution, and transportation energy demand.37
The difference between mobility and access is particu-larly important for the analysis of transportation sys-tems in today’s rapidly developing and urbanizingeconomies. Transportation equipment provides no ser-vices without roads, rail lines, ports, and airports. Suchinfrastructure is expensive to build and maintain, andinfrastructure decisions made in the near term affectenergy use (and greenhouse gas emissions) in the future.Where urban rail systems are built, they affect modes oftravel to and from workplaces for many years to come.
Development that proceeds without a plan may result inthe need to construct infrastructure in “catch-up mode,”with developers continually addressing existing conges-tion problems rather than shaping transportationdemand patterns. Suburban sprawl in one generationlimits economical transportation choices in the future. Inparticular, in the developing non-OECD regions whereurbanization is still in early stages and much of theurban transportation infrastructure has not yet beenbuilt, transportation energy needs over the long-termfuture will be affected substantially by policy decisionsmade in the coming decades.
In many non-OECD countries, walking and bicyclingplay important roles in personal transport, and hand-carts and draft animals are widely used in commerce.Given its large base level in those countries, smalldeclines in the nonmotorized share of the transportationactivity translate into very large growth rates for motor-ized travel. Uncertainty about the future role ofnonmotorized transport in the world’s emerging econo-mies introduces additional uncertainty to the IEO2009projections, as does uncertainty about the form and paceof urbanization. For example, will rapid urbanization indeveloping Asia follow the U.S. pattern of ring roadssurrounding central cities, or will mixed land-use
patterns and more compact cities be emphasized as amatter of policy?
Another uncertainty in non-OECD nations, where busesnow account for a major share of motorized passengertransport, is whether attractive and affordable bus sys-tems will be developed to maintain heavy ridership orpersonal automobiles will replace buses for most trips.The answers to such questions will shape future trans-portation energy consumption, and the answers arehighly uncertain. Further, the outlook does not incorpo-rate any changes in transportation energy use that mightoccur as a result of future legislation or policies aimed atreducing greenhouse gas emissions, which could alsosubstantially alter the projections.
The IEO2009 reference case assumes that, as personalincome grows in the developing non-OECD nations,demand for personal motor vehicles will grow, andmajor urban areas will address the accompanying con-gestion and strains on infrastructure with a variety ofsolutions, including development of mass transit (busand/or rail) and urban design that reduces vehicle milestraveled, among other improvements to transportationnetworks. In non-OECD Asia, for example, the referencecase projects that energy use for personal motor vehicles(light-duty cars and trucks, as well as two- and three-wheel vehicles) will increase by 3.6 percent per yearfrom 2006 to 2030, while energy use for public passengertravel (rail and bus) also increases by a robust 2.8 percentper year.
Projected world oil prices in the IEO2009 reference caseare significantly higher than projected in last year’s out-look. In IEO2009, oil prices are 80 percent higher in 2030than projected in IEO2008. As a result, consumers inend-use sectors other than transportation (notably, theelectric power and industrial sectors) are expected toswitch to other fuels where possible. In the transporta-tion sector, however, liquid fuels remain the mostwidely used energy source, and the impact of highprices on demand for liquid fuels is comparatively mod-est. World demand for liquid fuels in the transportationsector increases by 1.4 percent per year on average from2006 to 2030—only 0.2 percentage points below the aver-age increase in the IEO2008 reference case.
In the IEO2009 projections, the transportation sectorcontinues to rely heavily on liquid fuels to meet demandfor travel. Total world liquids consumption increases by25 percent from 2006 to 2030 (Figure 70). Given theworld oil price environment projected in the referencecase, economic incentives will prompt consumers to findsubstitutes for liquid fuels. In the OECD nations, liquids
98 Energy Information Administration / International Energy Outlook 2009
37 Commerce conducted via the Internet (“e-commerce”) may also reduce the number of consumer shopping trips; however, becausegetting the product to individual consumers’ residences quickly via delivery vans is a fuel-intensive process, it is unclear whether consump-tion of transportation fuels would decline as a result.

consumption outside the transportation sector is pro-jected to decline (Figure 71), especially in the electricpower sector, where the use of petroleum productsdeclines by 1.3 percent per year from 2006 to 2030. In thenon-OECD nations, the transportation sector accountsfor 69 percent of the projected increase in liquids con-sumption, with liquids used for feedstock in the chemi-cal industry accounting for most of the rest. Worldwide,the non-OECD nations are expected to account for 87percent of the total increase in transportation energyuse.
Growing demand for transportation services in thenon-OECD countries is the most important factor affect-ing the projections for world liquids consumption. In2006, the OECD nations consumed 81 percent more liq-uid fuels for transportation than the non-OECD nations.In 2030, however, the totals for OECD and non-OECDliquids consumption for transportation are approxi-mately equal at 61 quadrillion Btu. For the OECD coun-tries, the transportation share of total liquidsconsumption increases from 57 percent in 2006 to 61 per-cent in 2030. For the non-OECD countries, the transpor-tation share of total liquids consumption increases from42 percent in 2006 to 52 percent in 2030.
Growth in fuel consumption to move both freight andpeople is correlated with economic growth (as measuredby GDP) in both the OECD and non-OECD countries. Inthe more service-oriented OECD economies, the linkbetween economic growth and transportation energyuse is weaker than in the developing non-OECD econo-mies. From 2006 to 2030, the rate of increase in totaltransportation energy consumption is 15 percent of theprojected GDP growth rate in the OECD countries, com-pared with 55 percent in the non-OECD countries(Figure 72).
In the non-OECD nations, transportation energy ser-vices need to be considered within the broader contextof economic and social development. Sustained highrates of economic growth probably would be impossiblewithout rapid modernization of national transportationsystems to move raw materials and finished products.For much of the developing world, animal power still is
Energy Information Administration / International Energy Outlook 2009 99
2006 2010 2015 2020 2025 20300
50
100
150
200
250Quadrillion Btu
Transportation Other Total
Figure 70. World Liquids Consumption by End-UseSector, 2006-2030
Sources: 2006: Derived from Energy Information Adminis-tration (EIA), International Energy Annual 2006 (June-December 2008), web site www.eia.doe.gov/iea. Projections:EIA, World Energy Projections Plus (2009).
2006OECD
2030 2006Non-OECD
20300
25
50
75
100
125Quadrillion Btu
Transportation Other Total
Figure 71. OECD and Non-OECD LiquidsConsumption by End-Use Sector,2006 and 2030
Sources: 2006: Derived from Energy Information Adminis-tration (EIA), International Energy Annual 2006 (June-December 2008), web site www.eia.doe.gov/iea. 2030: EIA,World Energy Projections Plus (2009).
Gross DomesticProduct
AllTransportation
FreightTransportation
PassengerTransportation
0 1 2 3 4 5 6-1
Percent per Year
OECD
Non-OECD
Figure 72. Average Annual Growth in OECD andNon-OECD Gross Domestic Product andTransportation Sector Delivered EnergyUse, 2006-2030
Sources: 2006: Derived from Energy Information Adminis-tration (EIA), International Energy Annual 2006 (June-December 2008), web site www.eia.doe.gov/iea. Projections:EIA, World Energy Projections Plus (2009).

a prime means of freight transport, and walking is aprime means of personal transport. As a result, particu-larly in rural developing regions, growth in transporta-tion services and energy use does not follow economicgrowth but, rather, enables it. Products and services arenot produced if they cannot reach consumers, and with-out modern transportation systems economic growthmay be severely limited.
Freight transportation energy use includes fuels used bylarge trucks, freight trains, and both domestic and inter-national marine vessels.38 Passenger transportationenergy use includes fuels used in light-duty vehicles,buses, aircraft, and passenger trains. In 2006, abouttwo-thirds of transportation energy use in the OECDcountries was for passenger travel; that share declinesslightly from 2006 to 2030. For the non-OECD nations,passenger travel accounted for 56 percent of total trans-portation energy use in 2006, and the share falls to 51percent in 2030. Although energy consumption for pas-senger transportation grows by 2.4 percent per year inthe non-OECD countries and declines by 0.1 percent peryear in the OECD countries, passenger-related energyuse in the developing world remains far below levels inthe OECD on a per capita basis.
OECD CountriesTransportation infrastructure in the OECD countriesgenerally is well established. Roads and highways con-nect most population centers, and motorization levels(vehicles per 1,000 people), which already are high,probably will reach saturation over the course of theprojection period. As the OECD economies have becomemore service-oriented, the link between income and thetransportation of goods has weakened. The establishedtransportation sectors and relatively slow rates of GDPgrowth and population growth among the OECD econo-mies lead to the expectation that transportation energydemand will increase only modestly from 2006 to 2030.It is projected to grow at an average annual rate of 0.3percent in the IEO2009 reference case, from 57.8 quadril-lion Btu in 2006 to 62.5 quadrillion Btu in 2030 (seeFigure 71). The projection assumes that infrastructuredevelopments in the OECD nations represent incremen-tal changes to existing transport systems.
North America accounts for 92 percent of the increase inOECD liquids consumption for transportation in the
reference case (Figure 73), and the United Statesaccounts for 79 percent of that increase (even though therate of increase in U.S. transportation liquids use is lessthan one-half the corresponding rate for Mexico). U.S.delivered energy consumption in the transportation sec-tor grows from 28.6 quadrillion Btu in 2006 to 31.9 qua-drillion Btu in 2030. In 2030, U.S. transportation energydemand is about 1.1 quadrillion Btu lower than theamount projected in last year’s outlook,39 largelybecause of higher energy prices and a revision in theway the Energy Independence and Security Act 2007(EISA2007) corporate average fuel economy (CAFE)standards are handled. EISA2007 includes provisionsfor improving the CAFE standards applicable to newlight-duty vehicles (both cars and light trucks). To meetthe mandated fuel economy levels, sales of unconven-tional vehicle technologies40—such as flex-fuel, hybrid,and diesel vehicles—increase over the projection period,and the growth of new light truck sales slows.
In 2008, U.S. Public Law 110-343, the Energy Improve-ment and Extension Act of 2008 (EIEA2008) wasenacted. EIEA2008 Title II, Section 205, provides a taxcredit for the purchase of new, qualified plug-in electricdrive motor vehicles.41 According to the legislation,
100 Energy Information Administration / International Energy Outlook 2009
North America Europe Asia
0
1
2
3
4
5
-1
Quadrillion Btu
3.9
-0.2
9.6
Figure 73. Change in OECD Transportation SectorLiquids Consumption by Region,2006-2030
Sources: 2006: Derived from Energy Information Adminis-tration (EIA), International Energy Annual 2006 (June-December 2008), web site www.eia.doe.gov/iea. Projections:EIA, World Energy Projections Plus (2009).
38 In the IEO2009 projections, fuel use in dedicated freight aircraft is included with fuel use in passenger aircraft.39 Primarily as a result of lower projected industrial output, U.S. energy demand for freight transportation is 0.8 quadrillion Btu lower in
the updated AEO2009 reference case (April 2009) than in the published AEO2009 reference case projection (March 2009) discussed in thisreport.
40 Vehicles that use alternative fuels, electric motors and advanced electricity storage, advanced engine controls, or other newtechnologies.
41 The updated AEO2009 reference case (April 2009) incorporates ARRA2009 modifications to the plug-in hybrid electric vehicle taxcredits that increase the number of vehicles covered to 200,000 per manufacturer and also eliminate the tax credit’s expiration on December31, 2014. In addition, the updated reference case includes the ARRA tax credit of 10 percent against the cost of a qualified plug-in all-electricvehicle.

beginning two calendar quarters after the first quarter inwhich the cumulative number of qualified plug-in elec-tric vehicles sold reaches 250,000, the credit will bereduced by 50 percent in the first two calendar quartersof the phaseout period and by another 25 percent in thethird and fourth calendar quarters. The credit is sched-uled to be eliminated after December 31, 2014, regard-less of how many qualifying vehicles have been sold. Inthe IEO2009 reference case, plug-in hybrid electric vehi-cle sales grow quickly as a result of the tax credits, risingto 90,000 annually in 2014. In 2030, plug-in hybrid elec-tric vehicles account for 2 percent of all sales of newlight-duty vehicles in the United States [1]. Overall,hybrid vehicle sales increase from 2 percent of newlight-duty vehicles in 2007 to 38 percent in 2030.
The updated AEO2009 reference case (April 2009), incor-porates ARRA2009 modifications to the U.S. tax creditsfor plug-in hybrid electric vehicles, which increase thenumber of vehicles covered to 200,000 per manufacturerand eliminate the tax credit's expiration on December 31,2014. In addition, the updated reference case includes theARRA2009 tax credit of 10 percent against the cost of aqualified plug-in all-electric vehicle. ARRA2009 alsocontains several changes to the plug-in hybrid electricvehicle tax credit originally included in EIEA2008, andthose changes also are included in the updated AEO2009reference case.
For plug-in hybrid electric vehicles, ARRA2009 allows a$2,500 tax credit for the purchase of qualified vehicleswith a battery capacity of at least 4 kilowatthours.Starting at a battery capacity of 5 kilowatthours, plug-inhybrids earn an additional battery credit of $417 perkilowatthour, up to a maximum of $5,000. The maxi-mum total hybrid vehicle credit that can be earned iscapped at $7,500 per vehicle. Tax credit eligibility andphaseout are specific to the individual vehicle manufac-turers. The credits are phased out when cumulative salesof qualified vehicles reach 200,000 vehicles. The phase-out period begins two calendar quarters after the firstdate later than December 31, 2009, on which a manufac-turer's sales reach the cumulative sales maximum. Thecredit is reduced to 50 percent of the total value for thefirst two calendar quarters of the phaseout period andthen to 25 percent for the third and forth calendar quar-ters, before being eliminated entirely thereafter. Thecredit applies to plug-in hybrid vehicles with gross vehi-cle weight rating less than 14,000 pounds. The ARRA-2009 tax credit for qualified plug-in all-electric vehicleswith a battery capacity of at least 4 kilowatthours is sub-ject to the same phaseout schedule as the credits forplug-in hybrid electric vehicles.
Canada’s current mix of transportation energy use issimilar to that in the United States (personal motor vehi-cles are fueled largely by motor gasoline rather than die-sel or alternative fuels), and it is projected to remain so in
the IEO2009 reference case. The markets of the twocountries are largely interconnected, not only because oftheir proximity but also because of similar geographyand demographics. As in the United States, the fastestgrowth in Canada’s transportation fuel use is expectedto be in the form of jet fuel and distillate fuel. For bothcountries, growth in total demand for transportationfuels averages less than 1.0 percent per year in the refer-ence case from 2006 to 2030 [2].
In Mexico, relatively strong GDP growth (3.4 percent peryear) is projected to increase energy consumption in thetransportation sector at an average rate of 1.0 percent peryear, from 1.5 quadrillion Btu in 2006 to 2.0 quadrillionBtu in 2030. The projected increase in transportation fueluse is based on expected growth in trade with the UnitedStates and overall improvement in the country’s stan-dard of living.
In OECD Europe, slow population growth, high trans-portation fuel costs, and environmental policies contrib-ute to slow growth in transportation energy use in theIEO2009 reference case. OECD Europe’s populationincreases by 0.2 percent per year; the countries of theregion already have mature transportation systems; andimprovements in energy efficiency over the course of theprojection result in passenger transportation energy usethat declines by an average of 0.6 percent per year from2006 to 2030 (Figure 74). Despite the slow growth pro-jected for OECD Europe’s population, economic growthcontinues at an average rate of 2.0 percent per year, andenergy use for freight transportation grows by anaverage of 0.8 percent per year. The growth in fuel use
Energy Information Administration / International Energy Outlook 2009 101
North America Europe Asia
0
1
2
3
-1
Percent per Year
GDP Population Passenger Freight
Transportation Energy Use:
Figure 74. Average Annual Change in GrossDomestic Product, Population, andEnergy Consumption for Transportationby OECD Region, 2006 to 2030
Sources: 2006: Derived from Energy Information Adminis-tration (EIA), International Energy Annual 2006 (June-December 2008), web site www.eia.doe.gov/iea. Projections:EIA, World Energy Projections Plus (2009).

to move freight outweighs the decline in fuel use forpassenger transport over the projection period.
OECD Europe’s transportation energy consumptioncontracts strongly in the short term, as a result of therunup in world oil prices from 2004 to mid-2008 and thepresent global recession. In the reference case, OECDEurope’s transportation energy use falls from 17.8 qua-drillion Btu in 2006 to 16.5 quadrillion Btu in 2010, thenrises slowly to 17.6 quadrillion Btu in 2030, as theregion’s economies recover in the long term (Figure 75).The transportation share of total delivered energy use inOECD Europe falls slightly, from 29 percent in 2006 to 28percent in 2010, and remains at that level for the rest ofthe projection.
With increasing concerns about the impacts of freightroad transport on pollution and congestion, the Euro-pean Union (EU) has introduced a program to shift themodal shares of freight transport. The EU’s Marco Poloprogram provides funding to commercial projects thatresult in a reduction in freight road transport by shiftingit to “rail, sea, and inland waterways.”42 As part of theprogram, a subsidy of 2 euros per metric ton-kilometer isoffered for freight shifted from road to one of the alter-native transportation modes. The stated goal of the pro-gram is to reduce congestion and pollution and to allowfor the “more reliable and efficient transport of goods.”Marco Polo began in 2007, and 450 million Euros havebeen committed for the period through 2013 to fundmode-switching projects.
OECD Asia, like OECD Europe, generally has well-established transportation infrastructures; however,with population in the region as a whole projected tocontract (averaging -0.1 percent per year from 2006 to2030), a decline in passenger transport demand isexpected. The region’s passenger transportation energyuse declines by about 0.3 percent per year from 2006 to2030 in the IEO2009 reference case (see Figure 74). In thenear term, the global economic recession has a strongdampening affect on transportation sector energy use, asmanufacturing and consumer demand for goods andservices slows substantially. Total demand for transpor-tation fuels in OECD Asia declines from 7.4 quadrillionBtu in 2006 to 7.1 quadrillion Btu in 2010, then increasesslowly to 8.0 quadrillion Btu in 2030. The largestincreases are expected in South Korea, Australia, andNew Zealand.
In Japan, transportation energy use declines by 0.3 per-cent per year on average, as the population declines by atotal of 7.5 percent (10 million people) from 2006 to 2030.As a result, energy use in the country’s passenger trans-portation sector in 2030 is projected to be 9 percentbelow the 2006 level. Although Japan’s GDP growthaverages 0.8 percent per year, its energy use for freighttransportation increases on average by only 0.4 percentper year.
In South Korea, transportation energy use is projected togrow by 0.7 percent per year in the IEO2009 referencecase. The country has the region’s strongest projectedGDP growth, averaging 3.3 percent per year from 2006to 2030, and its transportation infrastructure is still rela-tively young compared with those in Japan and Austra-lia/New Zealand. South Korea accounts for aboutone-fourth of OECD Asia’s total population, and itsshare of OECD Asia’s transportation energy use is pro-jected to increase from 26 percent in 2006 to 29 percent in2030. Energy use for freight transportation in SouthKorea is projected to increase by an average of 1.7 per-cent per year, and its share of OECD Asia’s total energyuse for freight movement increases from 29 percent in2006 to 34 percent in 2030, reflecting an increase in itsshare of OECD Asia’s total GDP from 16 percent to 23percent.
In Australia/New Zealand, transportation energy use isprojected to grow by average of 1.2 percent per year,based on modest population growth and average annualGDP growth of 3.0 percent. As in South Korea, freighttransportation is the key factor behind the projectedincrease in transportation fuel demand for Austra-lia/New Zealand in the IEO2009 reference case, risingfrom 0.5 quadrillion Btu in 2006 to 0.8 quadrillion Btu in2030, at an average annual rate of 2.3 percent. Air travel
102 Energy Information Administration / International Energy Outlook 2009
2006 2010 2015 2020 2025 20300
5
10
15
20Quadrillion Btu
17.816.5 16.7 17.4 17.5 17.6
Figure 75. Energy Consumption for Transportationin OECD Europe, 2006-2030
Sources: 2006: Derived from Energy Information Adminis-tration (EIA), International Energy Annual 2006 (June-December 2008), web site www.eia.doe.gov/iea. 2030: EIA,World Energy Projections Plus (2009).
42 Under the Director General for Energy and Transport of the European Commission, 450 million euros has been committed to theMarco Polo project for 2007-2013.

also is expected to count for a substantial part of thegrowth in Australia/New Zealand’s transportation fueldemand, as income growth raises standards of livingand demand for business and vacation travel. Passengerair travel in Australia/New Zealand increases by 3.5percent per year over the projection period, from 79 bil-lion passenger miles traveled in 2006 to 181 billion pas-senger miles traveled in 2030.
Non-OECD CountriesThe projected average growth rate for transportationenergy use in the non-OECD countries from 2006 to2030, at 2.7 percent per year, is 8 times higher than theprojected rate for OECD countries, and the use of liquidsin the non-OECD transportation sector as a whole nearlydoubles over the period. In non-OECD Asia, transporta-tion energy consumption for both passenger and freighttransportation increases more rapidly than in the othernon-OECD countries (Figure 76). In total, China, India,and the other developing countries of non-OECD Asiaare expected to sustain high rates of economic growthover the forecast, accounting for almost one-half of theincrease in world GDP from 2006 to 2030. In 2030 theyrepresent 37 percent of the world economy, up from 22percent in 2006. Over the same period, non-OECD Asia’sshare of world transportation liquids consumptionincreases from 14 percent to 27 percent (Figure 77).
China has been, and is projected to continue to be, thefastest-growing economy among non-OECD countries.From 2006 to 2030, China’s GDP increases by an averageof 6.4 percent per year in the reference case projection,and its use of transportation fuels increases by 4.8
percent per year for passenger and 5.2 percent per yearfor freight transportation. From 1996 to 2006, growth inthe combined length of China’s highways averaged 11.3percent per year, and GDP expanded by an annual aver-age of 9.3 percent [3]. Over the same period, passengermiles traveled and ton-miles of highway freight travelincreased at annual rates of 7.5 and 6.9 percent, respec-tively. India, similarly, has been expanding its roadinfrastructure to keep pace with economic growth.
China’s passenger transportation energy use per capitais projected to triple over the projection period, andIndia’s is projected to double. Nevertheless, China’senergy consumption per capita for passenger transpor-tation in 2030 still is only about one-fourth of SouthKorea’s, and India’s is less than one-tenth of SouthKorea’s (Figure 78). In part, this is because of the impor-tance of nonmotorized transport—including handcartsand bicycles—in China and India. It is also explained inpart by the differences between rural and urban popula-tion shares in China and India and in South Korea.
In 2007, according to the United Nations, 42 percent ofChina’s population and only 29 percent of India’s popu-lation were considered urban [4]. In contrast, 81 percentof South Korea’s total population is urban. The urbanshare of total population is expected to increase in bothChina and India, but even in 2025 the United Nationsexpects China’s urban share of population to be only 57percent and India’s only 37 percent. As a result, evenwith the fast-paced economic growth projected forChina and India in the IEO2009 reference case, their lev-els of transportation energy use per capita in 2030 do notreach the corresponding level in substantially moreurban South Korea.
Energy Information Administration / International Energy Outlook 2009 103
Europe/Eurasia
Asia MiddleEast
Africa Central/South America
0
2
4
6
-2
Percent per Year
Transportation Energy Use:
GDP Population Passenger Freight
Figure 76. Average Annual Change in GrossDomestic Product, Population, andEnergy Consumption for Transportationby Non-OECD Region, 2006 to 2030
Sources: 2006: Derived from Energy Information Adminis-tration (EIA), International Energy Annual 2006 (June-December 2008), web site www.eia.doe.gov/iea. Projections:EIA, World Energy Projections Plus (2009).
2006 2010 2015 2020 2025 20300
25
50
75
100
125Quadrillion Btu
Non-OECD Asia World
Figure 77. Non-OECD Asia and WorldTransportation Sector LiquidsConsumption, 2006-2030
Sources: 2006: Derived from Energy Information Adminis-tration (EIA), International Energy Annual 2006 (June-December 2008), web site www.eia.doe.gov/iea. Projections:EIA, World Energy Projections Plus (2009).

Both China and India have become major vehicle mar-kets. In fact, China became the world’s second-largestvehicle market after the United States in 2006, whensales exceeded those in Japan [5]. In 2007, China pro-duced nearly 8.9 million motor vehicles, an increase of22 percent over production in 2006. The country becamethe third-largest vehicle producer in the world afterJapan and the United States and accounted for morethan one-tenth of the world’s total motor vehicle pro-duction [6]. The recent economic downturn reduced thegrowth in China’s vehicle sales to less than 7 percent in2008, the first time since 1999 that annual growth in saleshad fallen below 10 percent [7].
A further reduction in vehicle sales growth is expectedfor China in 2009. The Chinese government is trying toshore up sales, however, with a 50-percent cut, as of Jan-uary 20, 2009, in the car purchase tax on low-emissionvehicles with engines under 1.6 liters—from 10 percentto 5 percent of the vehicle purchase price [8]. Severaldomestic manufacturers of eligible cars, includingChery, Geely, and BYD, posted record high sales in themonth after the incentive was announced; however, it isunclear how long the trend will last, given the country’sslowing economic growth. The sales incentive is sched-uled to end on December 31, 2009.
In addition, China’s government announced plans foran economic stimulus package valued at 4 trillion Yuan(about $585 billion U.S. dollars), as the global economicsituation worsened. Of the total package, 1.8 trillionYuan is expected to be used for infrastructure improve-ments in the electric power and transportation sectors,including construction of new railways, subways, and
airports in the southwestern part of the country, wherean earthquake caused extensive damage in May 2008 [9].
India’s motor vehicle sales also have been affected by theglobal economic difficulties. In 2008, car sales throughOctober were only 5.6 percent higher than in 2007—theslowest monthly growth since July 2005 [10]. Difficultiesfor consumers trying to obtain financing—because ofboth high borrowing costs and more difficult loan condi-tions stemming from the global economic crisis—makethe growth in India’s car sales will remain relativelyweak in the near term. As in China, concerns about thedrop in Indian car sales have prompted the national gov-ernment to offer incentives to support sales by reducingthe value-added tax on vehicle purchases and reducingmotor fuel costs by 10 percent in December [11].
India’s automobile producers manufactured 2.3 millionvehicles in 2007, making it the world’s tenth-largestmotor vehicle producer [12]. The Indian automotiveindustry is a fairly important component of the coun-try’s economy, accounting for about 5 percent of its totalGDP. India’s motor vehicle manufacturers aspire toimprove their penetration of the world’s automotivesector. India’s government has estimated that the coun-try’s production of passenger cars—largely supportedby anticipated robust economic growth—will increasefrom 1.7 million vehicles in 2007 to 3.0 million vehicles in2015, although clearly the worsening economic climatemay delay the achievement of such a target [13].
The IEO2009 reference case projection assumes robustgrowth in travel for both personal (cars and 2- and3-wheel vehicles) and public (bus and rail) land trans-port modes in non-OECD Asia. In China, for instance,while passenger travel (annual passenger miles) in per-sonal vehicles grows at an average of 5.0 percent from2006 to 2030, public vehicle travel also increases by 3.3percent per year. Total passenger travel using publicvehicles more than doubles over the projection period.The personal transportation service provided by motorvehicles, along with an expanding road infrastructure,greatly increases the mobility of the labor force andhelps support continued high rates of economic growth.Although new vehicles are expected to achieve highlevels of fuel efficiency per mile, the growing fleet ofautomobiles will replace even more fuel-efficient motor-cycles, and motorcycles will continue to replace bicycles.
Figure 79 compares travel shares of personal and publicvehicles for passenger land travel in non-OECD Asia(China, India, and other non-OECD Asia) and OECDAsia (Japan, South Korea, and Australia/New Zealand).The public vehicle share of passenger land travel de-clines modestly in both OECD Asia and non-OECD Asiain the IEO2009 reference case. In OECD Asia, the declineis from 32 percent to 28 percent and in non-OECD Asiathe decline is from 66 percent to 59 percent between 2006
104 Energy Information Administration / International Energy Outlook 2009
2006 2010 2015 2020 2025 20300
5
10
15
20
25Million Btu per Person
China India South Korea
Figure 78. Energy Consumption for PassengerTransportation per Capita in China,India, and South Korea, 2006-2030
Sources: 2006: Derived from Energy Information Adminis-tration (EIA), International Energy Annual 2006 (June-December 2008), web site www.eia.doe.gov/iea. Projections:EIA, World Energy Projections Plus (2009).

and 2030. Thus, reliance on public transport in 2030 innon-OECD Asia is still twice the level in OECD Asia.
Differences in the way in which passenger services areprovided help explain the large disparity in passengertransportation energy use per capita shown in Figure 78.The reference case projects substantial increases in travelby both public and personal modes over the next twodecades; however, small differences from the projectedmodal shares in 2030 would have large impacts on theprojected levels of energy use. If China’s transportationsystem developed in a manner similar to South Korea’s,significantly more energy would be required for passen-ger travel in China in 2030.
Russia is another non-OECD country in which the trans-portation sector has been growing rapidly over the pastseveral years, as higher energy prices (Russia is a netexporter of oil and natural gas) have bolstered the econ-omy and spurred robust growth in car sales. Motor vehi-cle sales in Russia increased by 29 percent from 2006 to2007, and total sales reached 3.2 billion in 2008 [14]. Notsurprisingly, because of the collapse of commodityprices in late 2008 and the global economic downturn,the outlook for Russia’s personal automobile sales in2009 is fairly pessimistic. Some analysts are projecting adecline in sales by as much as 25 to 50 percent this year.
In the IEO2009 reference case, Russia’s energy consump-tion for passenger transportation declines at an averagerate of 0.8 percent per year from 2006 to 2030, while theRussian population declines by an average of 0.6 percentper year (for a total population reduction of 19 million).
Thus, passenger energy use per capita is projected todecrease by an average of 0.2 percent per year.
The population in the rest of non-OECD Europe andEurasia is expected to be virtually unchanged between2006 and 2030, while energy consumption for passengertransportation per capita is projected to increase at ayearly rate of 1.1 percent, compared with 3.7-percentannual growth in income per capita. Based on economicgrowth averaging 3.7 percent per year in non-OECDEurope and Eurasia (excluding Russia), energy use forfreight transportation is projected to grow by an averageof 2.8 percent per year, reflecting improvements in stan-dards of living among countries that have continued toprosper since the fall of the Soviet Union. Rising stan-dards of living fuel the demand for merchandise andappliances and the need to ship those goods to market.
Energy consumption for transportation in the MiddleEast grows by an average of 2.4 percent per year from2006 to 2030 in the reference case, to a total of 8.9 quadril-lion Btu in 2030. The Middle East has a relatively smallpopulation and is not a major energy-consuming regionbut rather an exporter; however, rapid populationgrowth in the region is expected to result in increaseddemand for transportation. Transportation energy usehas been expanding quickly in the Middle East, at a rategreatly exceeding the world average. From 2000 to 2006,the Middle East’s total transportation energy useincreased by an annual average of 5.5 percent, comparedwith the worldwide increase of 2.4 percent per year [15].The region’s oil and natural gas producers had some ofthe fastest growth in transportation energy demandfrom 2000 to 2006: 4.7 percent per year in Saudi Arabia;6.9 percent per year in Iran; 7.7 percent per year inKuwait; and an impressive 16.4 percent per year inQatar.
Saudi Arabia, Kuwait, and Iran, among other MiddleEastern nations, have maintained transport subsidies fortheir citizens despite the persistent high world oil pricesof the past few years, which has discouraged conserva-tion or efficiency of use [16]. On the other hand, highworld oil prices have increased revenues from oilexports in many of the exporting nations, and as a resultseveral transportation infrastructure projects, includingthose for mass transit, are underway. For instance, thegovernment in Saudi Arabia has launched a $624 billioninvestment program that will run through 2020, includ-ing $140 billion for transportation infrastructure.
There are plans to expand the Saudi rail system byadding 2,400 miles of new rail lines. Similar in geo-graphic size to OECD Europe, Saudi Arabia currentlyhas a rail network consisting of only one 283-mile pas-senger line between Riyadh and the port of Dammamand one 350-mile freight line between the two cities. Oneof the three new major railway projects is the East-West
Energy Information Administration / International Energy Outlook 2009 105
2006OECD Asia
2030 2006Non-OECD Asia
20300
25
50
75
100Percent of Total
Personal Public
Figure 79. Personal and Public TransportationShares of Total Passenger MilesTraveled in OECD Asia andNon-OECD Asia, 2006 and 2030
Sources: 2006: Derived from Energy Information Adminis-tration (EIA), International Energy Annual 2006 (June-December 2008), web site www.eia.doe.gov/iea. 2030: EIA,World Energy Projections Plus (2009).

railway project (also known as the “Saudi LandBridge”), a 600-mile line that will link the capital Riyadhto the Red Sea port of Jeddah, and a 75-mile line fromDammam north along the Gulf coast to Jubail. The sec-ond project is the Mecca-Medina Rail Link, which will bea 315-mile high-speed passenger railway connectingJeddah with the two holy cities [17]. A third rail project,the North-South Railway (NSR) already is under con-struction and should be completed by 2010 [18]. TheNSR freight project consists of 1,400 miles of rail that willlink northern Saudi Arabia with the Gulf coast andRiyadh.
Air travel infrastructure is also being expanded in sev-eral Middle Eastern countries. As countries in the regionbecome increasingly prosperous, the demand for busi-ness and leisure air travel is expected to rise. In theUnited Arab Emirates, construction of the Dubai WorldCentral International Airport is currently underway. It isset to become the world’s largest airport and should beable to handle between 120 and 150 million passengersand 12 million metric tons of cargo annually. Construc-tion of the first of six runways was completed in 2007,and the entire project is expected to be operational by2015 [19]. In Qatar, the new Doha International Airporthas been under construction since 2004, with the firstphase scheduled for completion by the end of 2009,when it will be able to accommodate 24 million passen-gers annually [20]. Upon completion of the final phase in2015, its capacity will have been expanded to 50 millionpassengers per year.
Transportation energy use in Central and South Amer-ica is projected to increase by 1.9 percent per year from2006 to 2030. Brazil, the region’s largest economy, isexperiencing particularly strong growth in its transpor-tation sector following its success in achieving economicstability, which has bolstered consumer confidence andimproved consumer access to credit, allowing vehiclesales to increase strongly [21]. Total vehicle sales inBrazil (including light-duty vehicles, heavy-duty trucks,and buses) rose by 28 percent in 2007, following a12-percent increase in 2006. Indications are that robustdomestic sales will continue [22]. In the IEO2009 refer-ence case, energy use by light-duty vehicles in Brazilincreases by an average of 3.8 percent per year from 2006to 2015, before slowing to 2.9 percent per year from 2015to 2030.
In 1975, the Brazilian government launched its NationalAlcohol Program to increase the use of ethanol in thetransportation fuel mix [23]. Subsequently, ethanol con-sumption in Brazil rose from 0.1 billion gallons in 1975 to4.4 billion gallons in 2007 [24]. Its reliance on biofuels(and ethanol in particular) to fuel its transportation sec-tor has focused attention on Brazil, as other nations of
the world have begun to increase alternative fuel use inthe face of sustained high world oil prices over recentyears. Although the global economic downturn mayaffect the short-term growth potential of Brazilianbiofuels, it is expected that, as world economies recoverand oil prices again begin to rise, ethanol productionwill continue to expand, along with the country’sbiofuels-consuming automobile fleet, which mayaccount for as much as one-half of the total fleet by 2013[25].
Flexible-fuel vehicles (FFVs)43 have become increasinglypopular in Brazil. According to Brazil’s vehicle manu-facturers’ association, Associação Nacional dos Fabri-cantes de Veículos Automotores (Anfavea), the numberof FFVs sold each year in Brazil has increased stronglysince their introduction in March 2003, from 49,000 in2003 to 3 million in 2008 [26]. FFVs now account fornearly 86 percent of new automobile sales in Brazil.
References
106 Energy Information Administration / International Energy Outlook 2009
1. Energy Information Administration, Annual EnergyOutlook 2009 (Early Release Overview), DOE/EIA-0383(2009) (December 17, 2008), p. 6.
2. National Energy Board of Canada, Canada’s EnergyFuture: Reference Case and Scenarios to 2030 (Calgary,Alberta, November 2007), pp. 20-21.
3. National Bureau of Statistics of China, China Statis-tical Yearbook 2007, “Transport, Postal and Telecom-munication Services,” web site www.stats.gov.cn/tjsj/ndsj/2007/indexee.htm.
4. United Nations, Department of Economic andSocial Affairs, Population Division, “Urban andRural Areas 2007,” web site www.un.org/esa/population/publications/wup2007/2007_urban_rural_chart.xls.
5. “Auto Sales ‘Surpassed US’ in Jan,” The China Daily(February 6, 2009), web site www.chinadaily.com.cn/bizchina/2009-02/06/content_7450489.htm.
6. International Organization of Motor Vehicle Manu-facturers, “2007 Production Statistics,” web sitehttp://oica.net/2007-production-statistics (2007).
7. P. Jiayi Ho, “China 08 Auto Sales Up 6.7 Percent to9.38 Million Units—Xinhua,” Dow Jones News-wires (January 12, 2009).
8. “Autos: Small Car Sales Boom in Jan on Tax Cut,”The China Daily (February 6, 2009), web sitewww.chinadaily.com.cn/bizchina/2009-02/06/content_7452135.htm.
9. Z. Hong, “A 4-trillion Yuan Question,” CaijingOnline Magazine (December 1, 2008), web sitehttp://english.caijing.com.cn/ajax/ensprint.html;and D. Barboza, “China Unveils Sweeping Plan for
43 Flexible-fuel vehicles can operate using 100 percent ethanol, 100 percent motor gasoline, or any combination of the two fuels.

Energy Information Administration / International Energy Outlook 2009 107
Economy,” The New York Times (November 10,2008), web site www.nytimes.com.
10. “India Car Sales Tumble in October,” AgenceFrance-Presse (November 11, 2008), web site www.industryweek.com.
11. V.V. Nair and K. Goyal, “India’s Car Sales PlungeMost in Five Years on Loans (Update1),” Bloom-berg News Agency (December 10, 2008) web sitewww.bloomberg.com.
12. International Organization of Motor VehicleManufacturers, “Production Statistics” (1998-2007),web site http://oica.net/category/production-statistics.
13. S. Chatterjee, “Honda Bullish on Indian Market,Ramps Up Production, Dealer Network,” Interna-tional Business Times (February 26, 2008), web sitehttp://in.ibtimes.com/articles/20080226/honda-motor-jazz-civic-hybrid-accord_2.htm.
14. P. Negyesi, “Moscow Auto Show Raises Its CurtainAgainst Tense Backdrop,” Auto Observer (August22, 2008), web site www.autoobserver.com; and T.Vorobyova, “Russia Jan Car Sales at 100,000—Avtovaz Head,” Thomson Reuters News Release(February 4, 2009) web site www.reuters.com.
15. International Energy Agency Data Services, EnergyBalances of Non-OECD Countries (2008), web sitehttp://data.iea.org (subscription site).
16. M. Markey, “Topic Report: Oil ConsumptionGrowth in the Middle East” (December 17, 2007),Apache Corporation, web site www.apachecorp.com/explore/explore_features/browse_archives/View_Article/?docdoc=662.
17. R. High, “Getting Connected: Investing in the Mid-dle East’s Infrastructure,” International Construc-tion, KHL Group (December 1, 2007), web sitewww.khl.com.
18. “MEED Middle East Rail Projects, 2007 Conferencesin Dubai, Ameinfo” (November 7, 2007), web sitewww.ameinfo.com/137462.html.
19. “Dubai World Central Awards Air Traffic Manage-ment System” (July 30, 2007), web site www.asiatraveltips.com.
20. B. Bibbo, “Qatar Targets 24m Annual Passengers inNew Airport” (February 11, 2008), web site www.gulfnews.com.
21. T. Rideg, “Brazil Auto Boom: Can Supply KeepPace?” Latin Business Chronicle (August 13, 2007),web site www.latinbusinesschronicle.com/app/article.aspx?id=1537.
22. “GM and Renault Doing Well in Brazil: Car Indus-try Hits Record Sales,” Brazzil Magazine (February 8,2008), web site www.brazzilmag.com/content/view/9114/54; and “Brazil’s 2006 Vehicle Sales Top1.9 Million in 2006,” Global Refining & Fuels Report,Vol. 11, No. 1 (January 3, 2007), web site www.worldfuels.com (subscription site).
23. P. Nastari, “The Brazilian Fuel Ethanol Experience,”in Ethanol in the 21st Century: New Sources, New Uses(Sacramento, CA, April 1998).
24. I. Riveras, “Brazil Local Demand To Drive EthanolProduction,” Reuters News Release (January 14,2008), web site www.reuters.com.
25. AFX News Limited, “Brazil Registers Over 2 mlnBiofuel Cars in 2007, 86.5 pct of Cars Sold” (January8, 2008), web site www.forbes.com.
26. W. Lemos, “Flex-Fuels Pump Up Ethanol,” ICISNews (November 12, 2007); and “Brazil Flexi-ble-Fuel Vehicles Surpass 5m Units,” ICIS News(April 8, 2008), web site www.icis.com (subscrip-tion site).


Chapter 8
Energy-Related Carbon Dioxide EmissionsIn 2006, non-OECD energy-related emissions of carbon dioxide exceeded OECD emissions
by 14 percent. In 2030, energy-related carbon dioxide emissions from the non-OECD
countries are projected to exceed those from the OECD countries by 77 percent.
Because anthropogenic emissions of carbon dioxideresult primarily from the combustion of fossil fuels,world energy use continues to be at the center of the cli-mate change debate. In the IEO2009 reference case,world energy-related carbon dioxide emissions growfrom 29.0 billion metric tons in 2006 to 33.1 billion metrictons in 2015 and 40.4 billion metric tons in 2030.44
From 2005 to 2006, total energy-related carbon dioxideemissions from the non-OECD countries grew by 5.2percent, while emissions from the OECD countriesdeclined by 0.3 percent. The decline in OECD countries’carbon dioxide emissions is projected to continuethrough 2010, as fossil fuel demand contracts, in partbecause of the current global recession. Consequently,annual emissions from the non-OECD countries exceedthose from the OECD countries by more than 30 percentin 2010 (Figure 80). Over the 24-year projection period,the average annual increase in non-OECD emissionsfrom 2006 to 2030 (2.2 percent) is seven times the rateprojected for the OECD countries (0.3 percent). In 2030,non-OECD emissions (25.8 billion metric tons) exceedOECD emissions (14.6 billion metric tons) by 77 percent.
The IEO2009 reference case projections are, to the extentpossible, based on existing laws and policies. Projectionsfor carbon dioxide emissions may change significantly ifexisting laws and policies aimed at reducing greenhousegas emissions are changed or new ones are introduced.In addition, beyond carbon dioxide there are other gasesand sources that contribute to greenhouse gas emis-sions. The other gases and sources may be addressed inexisting legislation and international treaties, but theirreductions would not be reflected either in EIA’s histori-cal data or in the projections in this report.
The relative contributions of different fossil fuels to totalenergy-related carbon dioxide emissions have changedover time. In 1990, emissions from the combustion ofliquid fuels made up an estimated 42 percent of theworld total; in 2006 their share was 39 percent; and in2030 it is projected to be 35 percent (Figure 81). Carbondioxide emissions from natural gas combustion, whichaccounted for 19 percent of the total in 1990, increased to20 percent of the 2006 total, and their share is projectedto stabilize at between 20 and 21 percent from 2006 to2030.
Energy Information Administration / International Energy Outlook 2009 109
14 13 14 14 14 151518
1922
2426
2006 2010 2015 2020 2025 20300
10
20
30Billion Metric Tons
OECD Non-OECD
Figure 80. World Energy-Related Carbon DioxideEmissions, 2006-2030
Sources: 2006: Energy Information Administration (EIA),International Energy Annual 2006 (June-December 2008),web site www.eia.doe.gov/iea. Projections: EIA, WorldEnergy Projections Plus (2009).
1990 1995 2000 2006 2015 2020 2025 20300
10
20
30
40
50Billion Metric Tons
History Projections
Liquids
Natural Gas
Coal
Total
Figure 81. World Energy-Related Carbon DioxideEmissions by Fuel Type, 1990-2030
Sources: History: Energy Information Administration (EIA),International Energy Annual 2006 (June-December 2008),web site www.eia.doe.gov/iea. Projections: EIA, WorldEnergy Projections Plus (2009).
44 In keeping with current international practice, IEO2009 presents data on greenhouse gas emissions in billion metric tons carbon diox-ide equivalent. The figures can be converted to carbon equivalent units by multiplying by 12/44.

Coal’s share of world carbon dioxide emissions grewfrom 39 percent in 1990 to 42 percent in 2006 and is pro-jected to increase to 45 percent in 2030. Coal is the mostcarbon-intensive of the fossil fuels, and it is the fastest-growing carbon-emitting energy source in the IEO2009reference case projection, reflecting its important role inthe energy mix of non-OECD countries—especially,China and India. In 1990, China and India togetheraccounted for 13 percent of world carbon dioxide emis-sions; in 2006 their combined share had risen to 25 per-cent, largely because of strong economic growth andincreasing use of coal to provide energy for that growth.In 2030, carbon dioxide emissions from China and Indiacombined are projected to account for 34 percent of totalworld emissions, with China alone responsible for 29percent of the world total.
The Kyoto Protocol, which requires participating“Annex I” countries to reduce their greenhouse gasemissions collectively to an annual average of about 5percent below their 1990 level over the 2008-2012 period,entered into force on February 16, 2005. Annex I coun-tries include the 24 original OECD countries, the Euro-pean Union, and 14 countries that are considered“economies in transition.”45 Although 174 countries andthe European Commission have ratified the Kyoto Pro-tocol, only the Annex I countries that have ratified theProtocol are obligated to reduce or limit their carbondioxide emissions. The United States has not ratified theProtocol, and although both China and India have rati-fied it, neither of those countries is subject to emissionslimits under the terms of the treaty. Table 14 comparescarbon dioxide emissions in selected Annex I countriesor regions in 1990 and 2006 and their projected referencecase values in 2010, 2020, and 2030.
Many of the Kyoto goals are being addressed by “Kyotomechanisms,” such as reforestation, which are notreflected in EIA’s projections of energy-related carbon
dioxide emissions. Additionally, some greenhousegases other than carbon dioxide often are the leastexpensive to reduce (for example, by capturing fugitiveemissions of methane). Those reductions may accountfor a larger proportion of some countries’ Kyoto goalsthan would their carbon dioxide emissions reductions.
There are signs that concerns about global climatechange are beginning to affect the world fuel mix. Inrecent years, many countries have begun to demonstratean interest in expanding their use of non-carbon-emitting renewable energy and nuclear power, in part tostem the growth of greenhouse gas emissions. TheIEO2009 reference case projection for energy fromhydropower and other renewable energy sources in2030 is 26 percent higher than the projection in IEO2008,which in turn was 10 percent higher than the IEO2007projection. Similarly, the IEO2009 projection for worldelectricity generation from nuclear power is up by 2 per-cent from the IEO2008 projection, which was 4 percenthigher than the corresponding projection in IEO2007.
Reference CaseCarbon Dioxide Emissions
In the IEO2009 reference case, world energy-related car-bon dioxide emissions increase by an average of 1.4 per-cent per year from 2006 to 2030 (Table 15). For theOECD, annual increases in carbon dioxide emissions areprojected to average 0.3 percent over the 24-year period.The annual increases are not uniform, however. OECDcarbon dioxide emissions in the reference case declinefrom 13.6 billion metric tons in 2006 to 13.4 billion metrictons in 2010 and return to 13.6 billion metric tons in 2015(essentially no increase in OECD emissions over thedecade), then increase to 14.6 billion metric tons in 2030.
Projected emissions growth for the OECD countries overthe 2006-2030 period is much lower than was the case for
110 Energy Information Administration / International Energy Outlook 2009
Table 14. World Energy-Related Carbon Dioxide Emissions in Selected Annex I Areas, 1990, 2006, and 2010(Billion Metric Tons)
Australia/New Zealand Canada United States Japan OECD Europe Total
History1990 . . . . . 0.3 0.5 5.0 1.1 4.1 11.02006 . . . . . 0.5 0.6 5.9 1.2 4.4 12.6
Projections2010 . . . . . 0.5 0.6 5.8 1.2 4.3 12.42020 . . . . . 0.5 0.7 6.0 1.2 4.4 12.82030 . . . . . 0.5 0.7 6.4 1.2 4.5 13.4
Sources: History: Energy Information Administration (EIA), International Energy Annual 2006 (June-December 2008), web sitewww.eia.doe.gov/iea. Projections: EIA, World Energy Projections Plus (2009).
45 Turkey is an Annex I country that has not ratified the Framework Convention on Climate Change and did not commit to quantifiableemissions targets under the Kyoto Protocol.

the 1990-2006 historical period. In addition, although theUnited States has not yet accepted internationally bind-ing emissions constraints, recent changes in U.S. lawsand regulations (as well as broader price and economicdevelopments and observed behavior) have lowered theprojections for U.S. carbon dioxide emissions relative toearlier estimates.46
In the IEO2008 reference case, the projection for U.S.emissions growth was 0.5 percent per year from 2005 to2030. In the IEO2009 reference case, U.S. energy-relatedcarbon dioxide emissions are projected to grow at anaverage annual rate of 0.3 percent from 2006 to 2030.47
As a result, the projection for U.S. emissions in 2030 is 20percent lower in IEO2009 than it was in IEO2007 (Figure82). Moreover, a recent Presidential Memorandum thatdirects the U.S. Environmental Protection Agency toreassess California’s request for a waiver under theClean Air Act that would allowing the State to placestricter standards on greenhouse gas emissions fromvehicles could have an additional impact on U.S. emis-sions growth.48
Energy Information Administration / International Energy Outlook 2009 111
Table 15. World Energy-Related Carbon Dioxide Emissions by Region, 1990-2030(Billion Metric Tons)
Region
History Projections Average Annual Percent Change
1990 2006 2010 2015 2020 2025 2030 1990-2006 2006-2030
OECD . . . . . . . . . . . . . . . . . . . 11.5 13.6 13.4 13.6 13.9 14.2 14.6 1.0% 0.3%North America . . . . . . . . . . . . 5.8 6.9 6.8 7.0 7.1 7.3 7.7 1.2% 0.4%Europe . . . . . . . . . . . . . . . . . 4.1 4.4 4.3 4.4 4.5 4.5 4.5 0.4% 0.1%Asia . . . . . . . . . . . . . . . . . . . . 1.6 2.2 2.2 2.3 2.3 2.3 2.4 2.1% 0.3%
Non-OECD . . . . . . . . . . . . . . . 10.0 15.4 17.6 19.5 21.5 23.7 25.8 2.8% 2.2%Europe and Eurasia . . . . . . . 4.2 2.9 3.1 3.2 3.3 3.4 3.4 -2.4% 0.7%Asia . . . . . . . . . . . . . . . . . . . . 3.7 9.0 10.5 11.9 13.6 15.4 17.0 5.7% 2.7%Middle East . . . . . . . . . . . . . . 0.7 1.5 1.7 1.8 1.9 2.1 2.3 4.6% 1.9%Africa. . . . . . . . . . . . . . . . . . . 0.7 1.0 1.1 1.2 1.2 1.3 1.4 2.5% 1.5%Central and South America. . 0.7 1.1 1.3 1.4 1.4 1.5 1.7 3.0% 1.6%
Total World . . . . . . . . . . . . . . 21.5 29.0 31.0 33.1 35.4 37.9 40.4 1.9% 1.4%
Sources: 1990 and 2006: Energy Information Administration (EIA), International Energy Annual 2006 (June-December 2008),web site www.eia.doe.gov/iea. 2010-2030: EIA, World Energy Projections Plus (2009).
2006IEO2008 IEO2009 IEO2008 IEO2009
0
2
4
6
8
10Billion Metric Tons
Oil
Natural Gas
Coal
5.9 6.25.9
2015 2030
6.96.4
Figure 82. U.S. Energy-Related Carbon DioxideEmissions by Fuel in IEO2008 andIEO2009, 2006, 2015, and 2030
Sources: Energy Information Administration, Annual EnergyOutlook 2007, DOE/EIA-0383(2007) (Washington, DC, Febru-ary 2007), Annual Energy Outlook 2008, DOE/EIA-0383(2008) (Washington, DC, January 2008), and Annual EnergyOutlook 2009, DOE/EIA-0383(2009) (Washington, DC, March2009).
46 For example, the Energy Independence and Security Act of 2007, which was signed into law in December 2007 (Public Law 110-140),includes a number of provisions aimed at reducing greenhouse gas emissions. Other factors that contribute to the lower projections for car-bon dioxide emissions include lower projected economic growth rates in comparison with previous outlooks. In addition, ARRA2009 in-cludes a number of provisions designed to increase energy efficiency and renewable electricity generation, which will also reducegreenhouse gas emissions in the United States, and the impact of these provisions can be seen in the updated AEO2009 reference case (April2009).
47 In the the updated AEO2009 reference case (April 2009), U.S. carbon dioxide emissions increase by 0.2 percent per year from 2006 to2030, and the projection for U.S. energy-related carbon dioxide emissions in 2030 is 3.0 percent lower than in the published AEO2009 refer-ence case (March 2009). The lower projections result largely from the impacts of ARRA2009 on renewable electricity generation and overallenergy consumption, including energy efficiency gains and renewable incentives that lead to reduced use of fossil fuels.
48 The Presidential Memorandum of January 26, 2009, on the State of California Request for Waiver Under 42 U.S.C. 7543(b), the CleanAir Act, and addressed to the Administrator of the U.S. Environmental Protection Agency (EPA) states: “In order to ensure that the EPA car-ries out its responsibilities for improving air quality, you are hereby requested to assess whether the EPA’s decision to deny a waiver basedon California’s application was appropriate in light of the Clean Air Act. I further request that, based on that assessment, the EPA initiateany appropriate action.”

The highest rate of increase in annual emissions of car-bon dioxide among the OECD countries is projected forSouth Korea, at 1.2 percent per year (Figure 83). Mexico(1.1 percent per year), which is also still industrializing,is the only OECD country other than South Korea forwhich the average growth is projected to exceed 1 per-cent per year. The GDP growth rates projected for SouthKorea and Mexico in IEO2009 are about the same, at 3.3percent and 3.4 percent, respectively. Japan’s emissions
are projected to decrease by an average of 0.3 percent peryear from 2006 to 2030, and OECD Europe’s energy-related carbon emissions are projected to grow onlyslightly (by 0.1 percent per year).
For the non-OECD countries, total energy-related car-bon dioxide emissions are projected to average 2.2-percent annual growth (Figure 84). The highest growthrate among the non-OECD countries is projected forChina, at 2.8 percent annually from 2006 to 2030, reflect-ing the country’s continued heavy reliance on fossilfuels, especially coal, in the projection. The lowestgrowth rate among the non-OECD countries is projectedfor Russia, at 0.6 percent per year. Over the projectionperiod, Russia is expected to expand its reliance onindigenous natural gas resources and nuclear power tofuel electricity generation, and a decline in its popula-tion is expected to slow its overall rate of increase inenergy demand.
By fuel, world carbon dioxide emissions from the con-sumption of liquid fuels are projected to grow at an aver-age annual rate of 0.9 percent from 2006 to 2030. All thegrowth in carbon dioxide emissions is projected to comefrom non-OECD countries, as total emissions from theOECD countries decline in the early years of the projec-tion period and return only to 2006 levels in 2030 (Figure85). The highest rate of growth in petroleum-related car-bon dioxide emissions is projected for China, at 3.2 per-cent per year, as its demand for liquid fuels increases tomeet growing demand in its transportation and indus-trial sectors. The United States is expected to remain thelargest source of petroleum-related carbon dioxideemissions throughout the period, with projected emis-sions of 2.6 billion metric tons in 2030.
112 Energy Information Administration / International Energy Outlook 2009
1.2
1.1
0.8
0.6
0.3
0.1
-0.3
0.3
South Korea
Mexico
Canada
Australia/
United States
OECD Europe
Japan
Total OECD
0.0 1.0 2.0 3.0 4.0
Percent per Year
New Zealand
Figure 83. Average Annual Growth in Energy-Related Carbon Dioxide Emissions inthe OECD Economies, 2006-2030
Sources: 2006: Energy Information Administration (EIA),International Energy Annual 2006 (June-December 2008),web site www.eia.doe.gov/iea. 2030: EIA, World Energy Pro-jections Plus (2009).
2.8
2.7
2.5
2.1
1.9
1.5
1.1
0.8
0.6
2.2
China
Other Asia
Brazil
India
Middle East
AfricaOther Central and
Other Europe
Russia
Total Non-OECD
0.0 0.5 1.0 1.5 2.0 2.5 3.0 3.5
Percent per Year
South America
and Eurasia
Figure 84. Average Annual Growth in Energy-Related Carbon Dioxide Emissions inthe Non-OECD Economies, 2006-2030
Sources: 2006: Energy Information Administration (EIA),International Energy Annual 2006 (June-December 2008),web site www.eia.doe.gov/iea. 2030: EIA, World Energy Pro-jections Plus (2009).
1990 1995 2000 2006 2015 2020 2025 20300
2
4
6
8
10Billion Metric Tons
History Projections
OECD
Non-OECD
Figure 85. World Carbon Dioxide Emissionsfrom Liquids Combustion, 1990-2030
Sources: History: Energy Information Administration (EIA),International Energy Annual 2006 (June-December 2008),web site www.eia.doe.gov/iea. Projections: EIA, WorldEnergy Projections Plus (2009).

Carbon dioxide emissions from natural gas combustionworldwide are projected to increase on average by1.6 percent per year, to 8.4 billion metric tons in 2030,with the OECD countries averaging 0.9 percent per yearand the non-OECD countries 2.2 percent per year(Figure 86). Again, China is projected to have the mostrapid growth in emissions, averaging 5.2 percent annu-ally; however, China’s emissions from natural gas com-bustion amounted to only 0.1 billion metric tons in 2006,and in 2030 they are projected to total only 0.4 billionmetric tons—equivalent to 3 percent of China’s totalenergy-related emissions and less than 5 percent of theworld’s total emissions from natural gas combustion.The much lower projected growth in U.S. emissionsfrom natural gas use, averaging 0.5 percent per year, stillresults in 1.3 billion metric tons of emissions in 2030,which is more than triple the projection for China.
Total carbon dioxide emissions from the combustion ofcoal throughout the world are projected to increase by1.7 percent per year on average, from 12.1 billion metrictons in 2006 to 18.0 billion metric tons in 2030. Totalcoal-related emissions from the non-OECD countrieswere already greater than those from the OECD coun-tries in 1990, and in 2030 they are projected to be morethan 2.5 times the OECD total (Figure 87), in large partbecause of the increase in coal use projected for Chinaand India.
China accounts for 74 percent of the total increase in theworld’s coal-related carbon dioxide emissions from 2006to 2030, and India accounts for 8 percent. For China
alone, coal-related emissions are projected to grow by anaverage of 2.7 percent annually, from 4.9 billion metrictons in 2006 to 9.3 billion metric tons (or 52 percent of theworld total) in 2030. India’s carbon dioxide emissionsfrom coal combustion are projected to total 1.3 billionmetric tons in 2030, accounting for more than 7 percentof the world total. In the United States—the world’sother major coal consumer—coal-related carbon dioxideemissions rise more slowly, by 0.7 percent per year, to2.5 billion metric tons (14 percent of the world’s totalcoal-related carbon emissions) in 2030.
Carbon Dioxide Intensity Measures
Emissions per Dollar of GDP
In all countries and regions, energy-related carbon diox-ide intensities—expressed in emissions per unit of eco-nomic output—are projected to improve (decline) overthe projection period, as all world economies continue touse energy more efficiently. In 2006, estimated carbondioxide intensities were 386 metric tons per million dol-lars of GDP in the OECD countries and 624 metric tonsper million dollars of GDP in the non-OECD countries(Table 16).49
Fossil fuel use in the non-OECD countries increasesstrongly in the reference case projection, but their eco-nomic growth is even stronger. As a result, non-OECDcarbon dioxide intensity declines by an average of 2.6percent per year, from 624 metric tons per million dol-lars of GDP in 2006 to 330 metric tons per million dollarsin 2030. In particular, China, with a relatively high rateof growth in emissions (2.8 percent per year), has an
Energy Information Administration / International Energy Outlook 2009 113
1990 1995 2000 2006 2015 2020 2025 20300
2
4
6Billion Metric Tons
History Projections
OECD
Non-OECD
Figure 86. World Carbon Dioxide Emissionsfrom Natural Gas Combustion,1990-2030
Sources: History: Energy Information Administration (EIA),International Energy Annual 2006 (June-December 2008),web site www.eia.doe.gov/iea. Projections: EIA, WorldEnergy Projections Plus (2009).
1990 1995 2000 2006 2015 2020 2025 20300
5
10
15Billion Metric Tons
History Projections
OECD
Non-OECD
Figure 87. World Carbon Dioxide Emissionsfrom Coal Combustion, 1990-2030
Sources: History: Energy Information Administration (EIA),International Energy Annual 2006 (June-December 2008),web site www.eia.doe.gov/iea. Projections: EIA, WorldEnergy Projections Plus (2009).
49 GDP is measured in chain-weighted 2005 dollars, converted to the currency of the relevant country or region, based on purchasingpower parity.
even higher GDP growth rate (6.4 percent per year). As aresult, its emissions intensity falls from 1,001 metric tonsper million dollars in 2006 to 443 metric tons per dollarsin 2030.
For all the OECD countries combined, average carbondioxide intensity in 2030 is projected to be 246 metrictons per million dollars of GDP. Mexico has the lowestcarbon dioxide intensity among the OECD economies in2030 in the reference case, at 184 metric tons per milliondollars, followed by OECD Europe at 196 metric tonsand Japan at 242 metric tons. (Mexico’s relatively lowcarbon dioxide intensity results in large part from itsprojected 3.4-percent annual GDP growth rate, the high-est among the OECD countries.) Canada has the highestcarbon dioxide intensity among the OECD countries in2030, at 359 metric tons per million dollars of GDP, fol-lowed by South Korea at 351 metric tons and Austra-lia/New Zealand at 322 metric tons. U.S. carbon dioxideintensity in 2030 is 282 metric tons per million dollars ofGDP. For the entire world, average carbon dioxide
intensity falls from 484 metric tons per million dollars ofGDP in 2006 to 294 metric tons in 2030.
Emissions per Capita
Another measure of carbon dioxide intensity is emis-sions per person. Carbon dioxide emissions per capita inthe OECD economies are significantly higher (aboutfourfold higher in 2006) than in the non-OECD econo-mies (Figure 88). Among the non-OECD countries,China has the highest percentage increase in carbondioxide emissions per capita in the IEO2009 referencecase, from 4.6 metric tons per person in 2006 to 8.0 metrictons per person in 2030 (Table 17 and Figure 89). Russiahas the highest absolute increase, from 11.9 metric tonsper person in 2006 to 16.0 metric tons per person in 2030.Among the IEO2009 country groupings, the lowest lev-els of emissions per capita in the world are in India andAfrica. India’s emissions per capita increase from 1.1metric tons per person in 2006 to 1.4 metric tons per per-son in 2030, and Africa’s emissions per capita remain atabout 1.0 metric ton per person from 2006 to 2030.
114 Energy Information Administration / International Energy Outlook 2009
Table 16. Carbon Dioxide Intensity by Region and Country, 1980-2030(Metric Tons per Million 2005 U.S. Dollars of Gross Domestic Product)
Region
History ProjectionsAverage AnnualPercent Change
1990 2006 2010 2015 2020 2025 20301990-2006
2006-2030
OECD . . . . . . . . . . . . . . . . . . . . . 491 386 360 321 293 267 246 -1.5% -1.9%North America . . . . . . . . . . . . . . 597 453 423 371 334 302 277 -1.7% -2.0%United States . . . . . . . . . . . . . . 620 463 436 380 341 308 282 -1.8% -2.0%Canada . . . . . . . . . . . . . . . . . . 609 507 488 444 414 387 359 -1.1% -1.4%Mexico . . . . . . . . . . . . . . . . . . . 361 317 250 230 215 198 184 -0.8% -2.2%
Europe . . . . . . . . . . . . . . . . . . . . 428 311 289 259 237 215 196 -2.0% -1.9%Asia . . . . . . . . . . . . . . . . . . . . . . 391 391 367 338 318 300 283 0.0% -1.3%Japan . . . . . . . . . . . . . . . . . . . . 327 314 285 271 265 254 242 -0.2% -1.1%South Korea. . . . . . . . . . . . . . . 651 581 575 480 414 380 351 -0.7% -2.1%Australia/New Zealand. . . . . . . 615 558 505 444 402 357 322 -0.6% -2.3%
Non-OECD . . . . . . . . . . . . . . . . . 816 624 555 469 407 364 330 -1.7% -2.6%Europe/Eurasia . . . . . . . . . . . . . 1,397 913 779 665 580 514 464 -2.6% -2.8%
Russia . . . . . . . . . . . . . . . . . . . 1,272 932 774 664 584 517 468 -1.9% -2.8%Other . . . . . . . . . . . . . . . . . . . . 1,599 888 785 666 576 510 458 -3.6% -2.7%
Asia . . . . . . . . . . . . . . . . . . . . . . 825 670 584 484 415 371 335 -1.3% -2.8%China . . . . . . . . . . . . . . . . . . . . 1,812 1,001 832 669 558 494 443 -3.6% -3.3%India . . . . . . . . . . . . . . . . . . . . . 563 483 391 323 277 240 214 -0.9% -3.3%Other . . . . . . . . . . . . . . . . . . . . 373 355 326 284 254 234 221 -0.3% -2.0%
Middle East . . . . . . . . . . . . . . . . 657 709 679 604 535 485 447 0.5% -1.9%Africa . . . . . . . . . . . . . . . . . . . . . 475 420 378 322 283 256 236 -0.8% -2.4%Central and South America . . . . 306 299 292 253 223 203 185 -0.1% -2.0%Brazil . . . . . . . . . . . . . . . . . . . . 225 235 231 212 197 186 174 0.3% -1.2%Other . . . . . . . . . . . . . . . . . . . . 375 346 336 282 242 216 194 -0.5% -2.4%
Total World . . . . . . . . . . . . . . . . . 603 484 450 394 353 321 294 -1.4% -2.1%
Note: GDP is expressed in terms of purchasing power parity.Sources: 1980-2006: Derived from Energy Information Administration (EIA), International Energy Annual 2006 (June-December
2008), web site www.eia.doe.gov/iea. 2010-2030: IHS Global Insight, World Economic Outlook 4th Quarter 2008, and EIA, WorldEnergy Projections Plus (2009).

Energy Information Administration / International Energy Outlook 2009 115
1990 2995 2000 2006 2015 2020 2025 20300
5
10
15Metric Tons per Person
History Projections
OECD
Non-OECD
Figure 88. World Carbon Dioxide Emissionsper Capita, 1990-2030
Sources: History: Energy Information Administration (EIA),International Energy Annual 2006 (June-December 2008),web site www.eia.doe.gov/iea. Projections: EIA, WorldEnergy Projections Plus (2009).
Table 17. Energy-Related Carbon Dioxide Emissions per Capita by Region and Country, 1990-2030(Metric Tons per Person)
Region
History ProjectionsAverage AnnualPercent Change
1990 2006 2010 2015 2020 2025 20301990-2006
2006-2030
OECD . . . . . . . . . . . . . . . . . . . . . 11.0 11.6 11.1 11.0 11.0 11.0 11.2 0.3% -0.1%North America . . . . . . . . . . . . . . 15.7 15.9 14.9 14.6 14.3 14.1 14.2 0.1% -0.5%United States . . . . . . . . . . . . . . 19.6 19.7 18.6 18.1 17.5 17.1 17.1 0.0% -0.6%Canada . . . . . . . . . . . . . . . . . . 17.0 18.7 18.4 18.3 18.4 18.6 18.7 0.6% 0.0%Mexico . . . . . . . . . . . . . . . . . . . 3.6 4.1 3.4 3.6 3.9 4.1 4.3 0.8% 0.3%
Europe . . . . . . . . . . . . . . . . . . . . 8.3 8.2 7.9 7.9 7.9 7.9 8.0 -0.1% -0.1%Asia . . . . . . . . . . . . . . . . . . . . . . 8.5 11.1 11.0 11.3 11.5 11.7 12.0 1.6% 0.4%Japan . . . . . . . . . . . . . . . . . . . . 8.5 9.8 9.2 9.5 9.8 9.8 9.8 0.8% 0.0%South Korea. . . . . . . . . . . . . . . 5.7 10.7 12.3 12.5 12.5 13.3 14.0 4.0% 1.1%Australia/New Zealand. . . . . . . 14.7 18.5 17.7 17.4 17.5 17.4 17.6 1.4% -0.2%
Non-OECD . . . . . . . . . . . . . . . . . 2.4 2.9 3.1 3.2 3.4 3.5 3.7 1.2% 1.1%Europe/Eurasia . . . . . . . . . . . . . 12.2 8.4 9.0 9.6 10.0 10.2 10.6 -2.3% 1.0%
Russia . . . . . . . . . . . . . . . . . . . 16.1 11.9 12.8 13.9 14.7 15.2 16.0 -1.9% 1.2%Other . . . . . . . . . . . . . . . . . . . . 9.3 6.0 6.4 6.7 6.9 7.1 7.3 -2.7% 0.8%
Asia . . . . . . . . . . . . . . . . . . . . . . 1.3 2.6 2.9 3.1 3.4 3.7 4.0 4.2% 1.8%China . . . . . . . . . . . . . . . . . . . . 2.0 4.6 5.3 5.9 6.6 7.4 8.0 5.3% 2.4%India . . . . . . . . . . . . . . . . . . . . . 0.7 1.1 1.1 1.2 1.3 1.3 1.4 3.3% 0.9%Other . . . . . . . . . . . . . . . . . . . . 1.1 1.7 1.8 1.9 2.0 2.2 2.4 2.8% 1.5%
Middle East . . . . . . . . . . . . . . . . 5.1 7.4 7.9 7.8 7.6 7.6 7.8 2.3% 0.2%Africa . . . . . . . . . . . . . . . . . . . . . 1.0 1.0 1.1 1.0 1.0 1.0 0.9 0.0% -0.5%Central and South America . . . . 1.9 2.4 2.7 2.7 2.7 2.7 2.8 1.5% 0.6%Brazil . . . . . . . . . . . . . . . . . . . . 1.6 2.0 2.2 2.3 2.5 2.7 2.9 1.4% 1.6%Other . . . . . . . . . . . . . . . . . . . . 2.2 2.8 3.1 2.9 2.8 2.8 2.8 1.5% 0.0%
Total World . . . . . . . . . . . . . . . . . 4.1 4.4 4.5 4.5 4.6 4.7 4.9 0.5% 0.4%
Sources: 1980-2006: Derived from Energy Information Administration (EIA), International Energy Annual 2006 (June-December2008), web site www.eia.doe.gov/iea. 2010-2030: UN Population Statistics (2006 Revision), and EIA, World Energy Projections Plus(2009).
1990 1995 2000 2006 2015 2020 2025 20300
5
10
15
20Metric Tons per Person
History Projections
Middle East
BrazilAfrica
Russia
ChinaIndia
Figure 89. Non-OECD Carbon Dioxide Emissionsper Capita by Country and Region,1990-2030
Sources: History: Energy Information Administration (EIA),International Energy Annual 2006 (June-December 2008),web site www.eia.doe.gov/iea. Projections: EIA, WorldEnergy Projections Plus (2009).

The OECD countries have higher levels of carbon diox-ide emissions per capita, in part because of their higherper-capita levels of income and fossil fuel use. In the ref-erence case U.S. emissions per capita fall from 19.7 met-ric tons per person in 2006 to 17.1 metric tons per personin 2030 (Figure 90). Canada’s emissions remain stable ataround 19 metric tons per person over the period. InMexico, with the lowest level of emissions per capitaamong the OECD countries in 2006 (approximately 4metric tons per person) there is essentially no changeover the projection period.
Per-capita income is the most important determinant ofcarbon dioxide emissions per capita, but other factorsalso affect the calculation. For example, climate is impor-tant, because in general more energy is used per capitafor heating in colder climates than in warmer climates.Similarly, population density is important, becausedensely populated countries use less energy for trans-portation per capita than do more sparsely populatedcountries. For example, Canada has both a relativelycold climate and low population density, and its carbondioxide emissions in 2006 are estimated at 18.7 metrictons per capita, whereas Japan has a more temperate cli-mate and a much higher population density, and itsemissions in 2006 are estimated at 9.8 metric tons percapita. Income per capita in Japan, by comparison, wasonly 16 percent lower than Canada’s in 2006.
Alternative Macroeconomic GrowthCasesEconomic growth is the most significant factor underly-ing the projections for growth in energy-related carbon
dioxide emissions in the mid-term, as the world contin-ues to rely on fossil fuels for most of its energy use.Accordingly, projections of world carbon dioxide emis-sions are lower in the IEO2009 low economic growthcase and higher in the high economic growth case.
In the high growth case, world carbon dioxide emissionsincrease at an average rate of 1.8 percent annually from2006 to 2030, as compared with 1.4 percent in the refer-ence case. For the OECD countries, the projected aver-age increase in the high growth case is 0.6 percent peryear; for the non-OECD countries, the average is 2.6 per-cent per year.
In the low growth case, world carbon dioxide emissionsincrease by 1.0 percent per year from 2006 to 2030, withaverages of -0.1 percent per year for the OECD countriesand 1.8 percent per year for the non-OECD countries(compared with 0.3 percent and 2.2 percent, respec-tively, in the reference case). In 2030, total energy-relatedcarbon dioxide emissions worldwide (Figure 91) rangefrom a projected 37.0 billion metric tons in the lowgrowth case to 44.1 billion metric tons in the high growthcase—19 percent higher than projected in the lowgrowth case. The projections for emissions by fuel showsimilar variations across the cases.
Alternative Oil Price CasesThe projections for carbon dioxide emissions in theIEO2009 low and high oil price cases (Figure 92) showsmaller variations from the reference case than do thosein the alternative macroeconomic growth cases. In 2030,as compared with the reference case projection (40.4 bil-lion metric tons), total carbon dioxide emissions arehigher in the low price case (42.2 billion metric tons) and
116 Energy Information Administration / International Energy Outlook 2009
1990 1995 2000 2006 2015 2020 2025 20300
5
10
15
20
25Metric Tons per Person
History Projections
Japan
South Korea
OECD Europe
United States Canada
Mexico
Australia/New Zealand
Figure 90. OECD Carbon Dioxide Emissionsper Capita by Country and Region,1990-2030
Sources: History: Energy Information Administration (EIA),International Energy Annual 2006 (June-December 2008),web site www.eia.doe.gov/iea. Projections: EIA, WorldEnergy Projections Plus (2009).
2006Low Growth
2030Reference High Growth
0
10
20
30
40
50Billion Metric Tons
OECD
Non-OECD
Figure 91. Carbon Dioxide Emissions in ThreeEconomic Growth Cases, 2006 and 2030
Sources: 2006: Energy Information Administration, Interna-tional Energy Annual 2006 (June-December 2008), web sitewww.eia.doe.gov/iea. 2030: Energy Information Administra-tion, World Energy Projections Plus (2009).

lower in the high price case (38.7 billion metric tons),largely as a result of greater demand for liquids in thelow price case and lower demand in the high price case.Thus, there is a 9-percent difference between the projec-tions in the two alternative oil price cases, as comparedwith a 19-percent difference between the alternative eco-nomic growth cases.
In the alternative oil price cases, world carbon dioxideemissions from liquids consumption are affected morestrongly than emissions from either coal or natural gas,both of which are higher in the high price case and lowerin the low price case. Coal-related emissions in 2030increase by 1 percent in the high price case relative to thereference case and decline by 0.4 percent relative to thereference case in the low price case.
In the high price case, where world oil prices reach $200per barrel in real 2007 dollars in 2030 (as compared with$130 per barrel in the reference case), nations choosealternative fuels over liquids wherever possible. Conse-quently, liquids-related emissions total 11.7 billion met-ric tons in 2030 in the high price case, down by 16 percentfrom the total of 14.0 billion metric tons in 2030 in the ref-erence case. In the low price case, where world oil pricesdecline to $50 per barrel in 2030, there is little economicincentive for nations to turn to other forms of energy.Consequently, liquids-related emissions in 2030 in thelow oil price case, at 16.0 billion metric tons, are 2.0 bil-lion metric tons (14 percent) higher than projected in thereference case.
World carbon dioxide emissions from natural gas com-bustion in 2030 total 8.8 billion metric tons in the high oilprice case, 5 percent above the projection of 8.4 billionmetric tons in the reference case. In the low price case,with higher levels of liquids consumption, natural-gas-related emissions in 2030 total 8.3 billion metric tons, or 1percent lower than projected in the reference case.
Energy Information Administration / International Energy Outlook 2009 117
2006Low Price
2030Reference High Price
0
10
20
30
40
50Billion Metric Tons
OECD
Non-OECD
Figure 92. Carbon Dioxide Emissions in ThreeOil Price Cases, 2006 and 2030
Sources: 2006: Energy Information Administration, Interna-tional Energy Annual 2006 (June-December 2008), web sitewww.eia.doe.gov/iea. 2030: Energy Information Administra-tion, World Energy Projections Plus (2009).


Appendix A
Reference Case Projections:• World Energy Consumption• Gross Domestic Product• Carbon Dioxide Emissions• World Population


Table A1. World Total Primary Energy Consumption by Region, Reference Case, 1990-2030(Quadrillion Btu)
Reference Case Projections
Energy Information Administration / International Energy Outlook 2009 121
Region/Country
History Projections Average AnnualPercent Change,
2006-20301990 2005 2006 2010 2015 2020 2025 2030
OECDOECD North America . . . . . . . . . . . 100.7 121.6 121.3 121.1 125.9 130.3 135.6 141.7 0.6United Statesa. . . . . . . . . . . . . . . . . 84.7 100.5 100.0 99.9 102.9 105.4 109.1 113.6 0.5Canada . . . . . . . . . . . . . . . . . . . . . . 11.0 14.2 14.0 14.6 15.6 16.5 17.4 18.3 1.1Mexico. . . . . . . . . . . . . . . . . . . . . . . 5.0 6.9 7.4 6.6 7.4 8.3 9.1 9.9 1.2
OECD Europe . . . . . . . . . . . . . . . . . 70.0 81.4 81.6 82.2 84.8 87.9 90.0 91.8 0.5OECD Asia . . . . . . . . . . . . . . . . . . . . 27.0 38.4 38.7 39.5 41.8 43.1 43.9 44.6 0.6Japan . . . . . . . . . . . . . . . . . . . . . . . 18.7 22.7 22.8 21.9 22.9 23.4 23.2 23.0 0.0South Korea . . . . . . . . . . . . . . . . . . 3.8 9.2 9.4 11.0 11.6 12.0 12.7 13.2 1.4Australia/New Zealand . . . . . . . . . . 4.5 6.4 6.5 6.7 7.3 7.7 8.0 8.4 1.1Total OECD . . . . . . . . . . . . . . . . . 197.7 241.3 241.7 242.8 252.4 261.3 269.5 278.2 0.6
Non-OECDNon-OECD Europe and Eurasia. . . 67.3 50.6 50.7 54.0 57.6 60.3 62.0 63.3 0.9Russia . . . . . . . . . . . . . . . . . . . . . . . 39.4 30.1 30.4 32.2 34.3 36.0 36.9 37.7 0.9Other . . . . . . . . . . . . . . . . . . . . . . . . 28.0 20.6 20.3 21.7 23.3 24.3 25.0 25.6 1.0
Non-OECD Asia. . . . . . . . . . . . . . . . 47.4 109.4 117.6 139.2 163.2 190.3 215.4 239.6 3.0China. . . . . . . . . . . . . . . . . . . . . . . . 27.0 66.8 73.8 90.5 105.9 124.0 140.7 155.8 3.2India . . . . . . . . . . . . . . . . . . . . . . . . 7.9 16.3 17.7 19.1 22.9 26.8 29.6 32.3 2.5Other Non-OECD Asia . . . . . . . . . . 12.5 26.3 26.1 29.6 34.4 39.5 45.1 51.5 2.9
Middle East . . . . . . . . . . . . . . . . . . . 11.2 22.7 23.8 27.7 30.3 32.2 34.6 37.7 1.9Africa . . . . . . . . . . . . . . . . . . . . . . . . 9.5 14.5 14.5 16.2 17.7 19.1 20.6 21.8 1.7Central and South America . . . . . . 14.5 23.4 24.2 28.3 30.3 32.5 35.2 37.7 1.9Brazil . . . . . . . . . . . . . . . . . . . . . . . . 5.8 9.4 9.6 11.4 12.9 14.5 16.3 18.0 2.6Other Central and South America. . 8.8 14.0 14.6 17.0 17.5 18.0 18.9 19.7 1.3Total Non-OECD . . . . . . . . . . . . . 149.9 220.7 230.8 265.4 299.1 334.4 367.8 400.1 2.3
Total World . . . . . . . . . . . . . . . . . . . . 347.7 462.1 472.4 508.3 551.5 595.7 637.3 678.3 1.5aIncludes the 50 States and the District of Columbia.Notes: Energy totals include net imports of coal coke and electricity generated from biomass in the United States. Totals may not
equal sum of components due to independent rounding. The electricity portion of the national fuel consumption values consists ofgeneration for domestic use plus an adjustment for electricity trade based on a fuel’s share of total generation in the exporting coun-try.
Sources: History: Energy Information Administration (EIA), International Energy Annual 2006 (June-December 2008), web sitewww.eia.doe.gov/iea. Projections: EIA, Annual Energy Outlook 2009, DOE/EIA-0383(2009) (Washington, DC, March 2009),AEO2009 National Energy Modeling System, run AEO2009.D120908A, web site www.eia.doe.gov/oiaf/aeo; and World Energy Pro-jections Plus (2009).

Table A2. World Total Energy Consumption by Region and Fuel, Reference Case, 1990-2030(Quadrillion Btu)
Appendix A
122 Energy Information Administration / International Energy Outlook 2009
Region/Country
History Projections Average AnnualPercent Change,
2006-20301990 2005 2006 2010 2015 2020 2025 2030
OECDOECD North AmericaLiquids . . . . . . . . . . . . . . . . . . . . . 40.5 49.6 49.2 45.4 46.7 47.2 48.4 50.5 0.1Natural Gas . . . . . . . . . . . . . . . . . 23.0 28.0 28.0 29.3 30.3 31.9 33.9 34.4 0.9Coal . . . . . . . . . . . . . . . . . . . . . . . 20.6 24.7 24.3 24.8 25.5 26.0 26.5 28.8 0.7Nuclear. . . . . . . . . . . . . . . . . . . . . 6.9 9.2 9.4 9.8 10.0 10.4 10.6 11.1 0.7Other . . . . . . . . . . . . . . . . . . . . . . 9.7 10.3 10.5 11.8 13.3 14.8 16.1 17.0 2.0Total. . . . . . . . . . . . . . . . . . . . . . 100.7 121.6 121.3 121.1 125.9 130.3 135.6 141.7 0.6
OECD EuropeLiquids . . . . . . . . . . . . . . . . . . . . . 28.4 32.3 32.4 30.0 29.9 30.8 31.0 31.1 -0.2Natural Gas . . . . . . . . . . . . . . . . . 11.2 19.8 19.7 21.0 22.1 23.3 24.2 24.8 1.0Coal . . . . . . . . . . . . . . . . . . . . . . . 17.7 12.9 13.2 13.0 12.8 12.4 12.2 12.0 -0.4Nuclear. . . . . . . . . . . . . . . . . . . . . 7.9 9.7 9.6 9.7 9.7 9.6 9.5 9.5 -0.1Other . . . . . . . . . . . . . . . . . . . . . . 4.8 6.5 6.6 8.5 10.3 11.9 13.3 14.4 3.3Total. . . . . . . . . . . . . . . . . . . . . . 70.0 81.4 81.6 82.2 84.8 87.9 90.0 91.8 0.5
OECD AsiaLiquids . . . . . . . . . . . . . . . . . . . . . 14.7 17.5 17.2 17.0 17.4 17.8 17.8 17.7 0.1Natural Gas . . . . . . . . . . . . . . . . . 3.1 5.8 6.1 6.5 7.1 7.5 7.6 7.7 1.0Coal . . . . . . . . . . . . . . . . . . . . . . . 5.2 9.3 9.4 9.5 9.5 9.5 9.6 9.8 0.2Nuclear. . . . . . . . . . . . . . . . . . . . . 2.5 4.3 4.3 4.5 5.0 5.6 6.0 6.4 1.6Other . . . . . . . . . . . . . . . . . . . . . . 1.6 1.6 1.7 2.1 2.6 2.8 2.9 3.0 2.4Total. . . . . . . . . . . . . . . . . . . . . . 27.0 38.4 38.7 39.5 41.8 43.1 43.9 44.6 0.6
Total OECDLiquids . . . . . . . . . . . . . . . . . . . . . 83.6 99.4 98.8 92.4 94.0 95.8 97.2 99.4 0.0Natural Gas . . . . . . . . . . . . . . . . . 37.3 53.6 53.9 56.7 59.6 62.6 65.7 66.8 0.9Coal . . . . . . . . . . . . . . . . . . . . . . . 43.5 46.9 46.9 47.3 47.8 47.9 48.3 50.7 0.3Nuclear. . . . . . . . . . . . . . . . . . . . . 17.3 23.2 23.3 24.0 24.7 25.6 26.0 27.0 0.6Other . . . . . . . . . . . . . . . . . . . . . . 16.0 18.3 18.8 22.4 26.3 29.5 32.3 34.3 2.5Total. . . . . . . . . . . . . . . . . . . . . . 197.7 241.3 241.7 242.8 252.4 261.3 269.5 278.2 0.6
Non-OECDNon-OECD Europe and EurasiaLiquids . . . . . . . . . . . . . . . . . . . . . 19.6 10.1 10.2 10.5 10.7 11.1 11.2 11.2 0.4Natural Gas . . . . . . . . . . . . . . . . . 27.5 25.8 25.8 28.0 30.4 31.9 32.7 33.4 1.1Coal . . . . . . . . . . . . . . . . . . . . . . . 15.1 8.9 8.7 9.2 9.5 9.3 9.2 9.4 0.3Nuclear. . . . . . . . . . . . . . . . . . . . . 2.5 2.9 2.9 3.0 3.6 4.5 5.2 5.5 2.6Other . . . . . . . . . . . . . . . . . . . . . . 2.8 3.1 3.0 3.2 3.4 3.5 3.7 3.8 0.9Total. . . . . . . . . . . . . . . . . . . . . . 67.3 50.6 50.7 54.0 57.6 60.3 62.0 63.3 0.9
Non-OECD AsiaLiquids . . . . . . . . . . . . . . . . . . . . . 14.0 31.6 33.1 36.8 42.4 49.8 56.2 62.2 2.7Natural Gas . . . . . . . . . . . . . . . . . 3.0 9.6 9.6 11.7 15.6 19.2 22.3 25.1 4.1Coal . . . . . . . . . . . . . . . . . . . . . . . 27.0 60.4 66.5 78.5 87.6 98.4 111.1 122.8 2.6Nuclear. . . . . . . . . . . . . . . . . . . . . 0.4 1.1 1.1 1.6 3.0 4.7 6.2 7.0 7.9Other . . . . . . . . . . . . . . . . . . . . . . 3.0 6.6 7.2 10.7 14.6 18.2 19.5 22.4 4.9Total. . . . . . . . . . . . . . . . . . . . . . 47.4 109.4 117.6 139.2 163.2 190.3 215.4 239.6 3.0
See notes at end of table.

Table A2. World Total Energy Consumption by Region and Fuel, Reference Case, 1990-2030 (Continued)(Quadrillion Btu)
Reference Case Projections
Energy Information Administration / International Energy Outlook 2009 123
Region/Country
History Projections Average AnnualPercent Change,
2006-20301990 2005 2006 2010 2015 2020 2025 2030
Non-OECD (Continued)Middle EastLiquids . . . . . . . . . . . . . . . . . . . . . 7.2 11.9 12.4 14.4 15.3 16.1 17.5 19.2 1.8Natural Gas . . . . . . . . . . . . . . . . . 3.8 10.2 10.8 12.5 14.2 15.0 16.1 17.4 2.0Coal . . . . . . . . . . . . . . . . . . . . . . . 0.1 0.4 0.4 0.4 0.4 0.4 0.4 0.5 1.1Nuclear. . . . . . . . . . . . . . . . . . . . . 0.0 0.0 0.0 0.0 0.1 0.1 0.1 0.1 —Other . . . . . . . . . . . . . . . . . . . . . . 0.1 0.2 0.2 0.3 0.4 0.5 0.5 0.5 3.4Total. . . . . . . . . . . . . . . . . . . . . . 11.2 22.7 23.8 27.7 30.3 32.2 34.6 37.7 1.9
AfricaLiquids . . . . . . . . . . . . . . . . . . . . . 4.3 6.1 6.1 7.1 7.3 7.5 7.8 8.1 1.2Natural Gas . . . . . . . . . . . . . . . . . 1.5 3.2 3.2 3.7 4.6 5.5 6.2 6.7 3.2Coal . . . . . . . . . . . . . . . . . . . . . . . 3.0 4.2 4.2 4.2 4.4 4.6 4.8 5.3 1.0Nuclear. . . . . . . . . . . . . . . . . . . . . 0.1 0.1 0.1 0.1 0.2 0.2 0.2 0.2 3.3Other . . . . . . . . . . . . . . . . . . . . . . 0.6 0.9 0.9 1.0 1.3 1.4 1.5 1.5 2.1Total. . . . . . . . . . . . . . . . . . . . . . 9.5 14.5 14.5 16.2 17.7 19.1 20.6 21.8 1.7
Central and South AmericaLiquids . . . . . . . . . . . . . . . . . . . . . 7.8 11.3 11.7 13.5 13.6 13.9 14.7 15.7 1.2Natural Gas . . . . . . . . . . . . . . . . . 2.2 4.7 4.8 5.8 6.7 7.4 8.2 8.6 2.4Coal . . . . . . . . . . . . . . . . . . . . . . . 0.6 0.9 0.8 0.9 1.0 1.2 1.3 1.6 2.8Nuclear. . . . . . . . . . . . . . . . . . . . . 0.1 0.2 0.2 0.2 0.3 0.4 0.4 0.4 2.0Other . . . . . . . . . . . . . . . . . . . . . . 3.9 6.4 6.6 7.8 8.7 9.7 10.6 11.5 2.3Total. . . . . . . . . . . . . . . . . . . . . . 14.5 23.4 24.2 28.3 30.3 32.5 35.2 37.7 1.9
Total Non-OECDLiquids . . . . . . . . . . . . . . . . . . . . . 52.9 71.0 73.6 82.3 89.3 98.4 107.4 116.4 1.9Natural Gas . . . . . . . . . . . . . . . . . 38.0 53.5 54.2 61.7 71.4 79.1 85.5 91.2 2.2Coal . . . . . . . . . . . . . . . . . . . . . . . 45.7 74.8 80.6 93.3 102.9 113.8 126.9 139.6 2.3Nuclear. . . . . . . . . . . . . . . . . . . . . 3.1 4.3 4.4 5.0 7.2 9.9 12.2 13.2 4.7Other . . . . . . . . . . . . . . . . . . . . . . 10.3 17.2 18.0 23.1 28.4 33.2 35.8 39.8 3.4Total. . . . . . . . . . . . . . . . . . . . . . 149.9 220.7 230.8 265.4 299.1 334.4 367.8 400.1 2.3
Total WorldLiquids . . . . . . . . . . . . . . . . . . . . . 136.4 170.4 172.4 174.7 183.3 194.2 204.6 215.7 0.9Natural Gas . . . . . . . . . . . . . . . . . 75.3 107.1 108.1 118.5 131.0 141.7 151.3 158.0 1.6Coal . . . . . . . . . . . . . . . . . . . . . . . 89.2 121.7 127.5 140.6 150.7 161.7 175.2 190.2 1.7Nuclear. . . . . . . . . . . . . . . . . . . . . 20.4 27.5 27.8 29.0 31.9 35.4 38.1 40.2 1.6Other . . . . . . . . . . . . . . . . . . . . . . 26.3 35.5 36.8 45.6 54.6 62.8 68.1 74.1 3.0Total. . . . . . . . . . . . . . . . . . . . . . 347.7 462.1 472.4 508.3 551.5 595.7 637.3 678.3 1.5
Notes: Energy totals include net imports of coal coke and electricity generated from biomass in the United States. Totals may notequal sum of components due to independent rounding. The electricity portion of the national fuel consumption values consists ofgeneration for domestic use plus an adjustment for electricity trade based on a fuel’s share of total generation in the exporting coun-try.
Sources: History: Energy Information Administration (EIA), International Energy Annual 2006 (June-December 2008), web sitewww.eia.doe.gov/iea. Projections: EIA, Annual Energy Outlook 2009, DOE/EIA-0383(2009) (Washington, DC, March 2009),AEO2009 National Energy Modeling System, run AEO2009.D120908A, web site www.eia.doe.gov/oiaf/aeo; and World Energy Pro-jections Plus (2009).

Table A3. World Gross Domestic Product (GDP) by Region Expressed in Purchasing Power Parity,Reference Case, 1990-2030(Billion 2005 Dollars)
Appendix A
124 Energy Information Administration / International Energy Outlook 2009
Region/Country
History Projections Average AnnualPercent Change,
2006-20301990 2005 2006 2010 2015 2020 2025 2030
OECDOECD North America . . . . . . . . . . . 9,651 14,885 15,331 16,073 18,789 21,341 24,283 27,802 2.5United Statesa. . . . . . . . . . . . . . . . . 8,040 12,422 12,768 13,315 15,538 17,548 19,885 22,737 2.4Canada . . . . . . . . . . . . . . . . . . . . . . 773 1,167 1,204 1,275 1,453 1,629 1,822 2,035 2.2Mexico. . . . . . . . . . . . . . . . . . . . . . . 838 1,296 1,359 1,483 1,798 2,164 2,575 3,030 3.4
OECD Europe . . . . . . . . . . . . . . . . . 9,703 13,756 14,224 15,015 16,839 18,811 20,894 23,105 2.0OECD Asia . . . . . . . . . . . . . . . . . . . . 4,080 5,509 5,667 6,045 6,775 7,314 7,819 8,357 1.6
Japan . . . . . . . . . . . . . . . . . . . . . . . 3,222 3,873 3,966 4,105 4,438 4,601 4,688 4,773 0.8South Korea . . . . . . . . . . . . . . . . . . 374 843 886 1,040 1,281 1,492 1,713 1,939 3.3Australia/New Zealand . . . . . . . . . . 485 794 815 899 1,056 1,222 1,418 1,645 3.0Total OECD . . . . . . . . . . . . . . . . . 23,434 34,150 35,221 37,133 42,403 47,466 52,996 59,264 2.2
Non-OECDNon-OECD Europe and Eurasia. . . 3,039 2,932 3,159 3,940 4,865 5,725 6,536 7,381 3.6Russia . . . . . . . . . . . . . . . . . . . . . . . 1,880 1,703 1,829 2,328 2,854 3,331 3,770 4,230 3.6Other . . . . . . . . . . . . . . . . . . . . . . . . 1,159 1,229 1,330 1,612 2,011 2,393 2,766 3,151 3.7
Non-OECD Asia. . . . . . . . . . . . . . . . 4,457 12,272 13,408 17,934 24,606 32,726 41,428 50,834 5.7China. . . . . . . . . . . . . . . . . . . . . . . . 1,265 5,389 6,014 8,686 12,263 16,888 21,664 26,501 6.4India . . . . . . . . . . . . . . . . . . . . . . . . 1,019 2,436 2,672 3,497 4,871 6,428 8,039 9,877 5.6Other Non-OECD Asia . . . . . . . . . . 2,173 4,448 4,723 5,751 7,472 9,410 11,725 14,456 4.8
Middle East . . . . . . . . . . . . . . . . . . . 1,072 1,919 2,053 2,484 3,030 3,621 4,300 5,102 3.9Africa . . . . . . . . . . . . . . . . . . . . . . . . 1,387 2,211 2,341 2,870 3,612 4,384 5,182 5,958 4.0Central and South America . . . . . . 2,270 3,555 3,757 4,495 5,415 6,450 7,615 8,945 3.7Brazil . . . . . . . . . . . . . . . . . . . . . . . . 1,045 1,534 1,591 1,895 2,296 2,753 3,292 3,922 3.8Other Central and South America. . 1,224 2,021 2,165 2,600 3,119 3,697 4,324 5,023 3.6Total Non-OECD . . . . . . . . . . . . . 12,225 22,888 24,717 31,723 41,529 52,907 65,062 78,220 4.9
Total World . . . . . . . . . . . . . . . . . . . . 35,659 57,038 59,939 68,856 83,932 100,373 118,058 137,484 3.5aIncludes the 50 States and the District of Columbia.Notes: Totals may not equal sum of components due to independent rounding. GDP growth rates for Russia and other non-OECD
Europe and Eurasia, China, India, Africa, and Central and South America (excluding Brazil) were adjusted, based on the analyst’sjudgment.
Sources: History: IHS Global Insight, World Overview (Lexington, MA, various issues). Projections: IHS Global Insight, WorldOverview, Fourth Quarter 2008 (Lexington, MA, January 2009); and EIA, Annual Energy Outlook 2009, DOE/EIA-0383(2009)(Washington, DC, March 2009), AEO2009 National Energy Modeling System, run AEO2009.D120908A, web site www.eia.doe.gov/oiaf/aeo.

Table A4. World Gross Domestic Product (GDP) by Region Expressed in Market Exchange Rates,Reference Case, 1990-2030(Billion 2005 Dollars)
Reference Case Projections
Energy Information Administration / International Energy Outlook 2009 125
Region/Country
History Projections Average AnnualPercent Change,
2006-20301990 2005 2006 2010 2015 2020 2025 2030
OECDOECD North America . . . . . . . . . . . 9,338 14,403 14,825 15,523 18,124 20,544 23,338 26,693 2.5United Statesa. . . . . . . . . . . . . . . . . 8,040 12,422 12,768 13,315 15,538 17,548 19,885 22,737 2.4Canada . . . . . . . . . . . . . . . . . . . . . . 750 1,133 1,168 1,238 1,410 1,582 1,769 1,975 2.2Mexico. . . . . . . . . . . . . . . . . . . . . . . 548 847 889 969 1,176 1,415 1,684 1,981 3.5
OECD Europe . . . . . . . . . . . . . . . . . 10,349 14,560 15,031 15,762 17,555 19,480 21,495 23,628 2.0OECD Asia . . . . . . . . . . . . . . . . . . . . 4,644 6,170 6,342 6,738 7,518 8,079 8,592 9,139 1.6Japan . . . . . . . . . . . . . . . . . . . . . . . 3,791 4,558 4,668 4,831 5,223 5,415 5,517 5,617 0.8South Korea . . . . . . . . . . . . . . . . . . 351 791 832 977 1,203 1,401 1,609 1,821 3.4Australia/New Zealand . . . . . . . . . . 502 821 843 930 1,092 1,263 1,467 1,701 3.0
Total OECD . . . . . . . . . . . . . . . . . 24,332 35,133 36,198 38,023 43,197 48,103 53,425 59,460 2.1
Non-OECDNon-OECD Europe and Eurasia. . . 1,342 1,320 1,426 1,785 2,208 2,616 3,022 3,457 3.9Russia . . . . . . . . . . . . . . . . . . . . . . . 843 764 820 1,044 1,283 1,508 1,728 1,965 3.9Other . . . . . . . . . . . . . . . . . . . . . . . . 498 556 606 741 925 1,109 1,294 1,492 4.0
Non-OECD Asia. . . . . . . . . . . . . . . . 1,704 4,738 5,177 6,929 9,518 12,738 16,305 20,245 6.0China. . . . . . . . . . . . . . . . . . . . . . . . 525 2,236 2,496 3,604 5,106 7,118 9,324 11,675 6.8India . . . . . . . . . . . . . . . . . . . . . . . . 340 812 891 1,166 1,626 2,157 2,722 3,378 5.9Other Non-OECD Asia . . . . . . . . . . 840 1,690 1,791 2,159 2,785 3,463 4,259 5,192 4.6
Middle East . . . . . . . . . . . . . . . . . . . 581 1,071 1,150 1,400 1,701 2,035 2,422 2,876 4.0Africa . . . . . . . . . . . . . . . . . . . . . . . . 615 965 1,021 1,244 1,576 1,962 2,416 2,908 4.5Central and South America . . . . . . 1,250 1,934 2,041 2,432 2,940 3,523 4,196 4,977 3.9Brazil . . . . . . . . . . . . . . . . . . . . . . . . 601 882 915 1,089 1,320 1,583 1,892 2,255 3.8Other Central and South America. . 649 1,052 1,127 1,343 1,620 1,940 2,304 2,722 3.9Total Non-OECD . . . . . . . . . . . . . 5,492 10,028 10,816 13,789 17,943 22,874 28,362 34,461 5.1
Total World . . . . . . . . . . . . . . . . . . . . 29,823 45,161 47,014 51,812 61,140 70,977 81,787 93,922 3.0aIncludes the 50 States and the District of Columbia.Notes: Totals may not equal sum of components due to independent rounding. GDP growth rates for Russia and other non-OECD
Europe and Eurasia, China, India, Africa, and Central and South America (excluding Brazil) were adjusted, based on the analyst’sjudgment.
Sources: History: IHS Global Insight, World Overview (Lexington, MA, various issues). Projections: IHS Global Insight, WorldOverview, Fourth Quarter 2008 (Lexington, MA, January 2009); and EIA, Annual Energy Outlook 2009, DOE/EIA-0383(2009)(Washington, DC, March 2009), Table A19.

Table A5. World Liquids Consumption by Region, Reference Case, 1990-2030(Million Barrels per Day)
Appendix A
126 Energy Information Administration / International Energy Outlook 2009
Region/Country
History Projections Average AnnualPercent Change,
2006-20301990 2005 2006 2010 2015 2020 2025 2030
OECDOECD North America . . . . . . . . . . . 20.5 25.2 25.1 23.5 24.1 24.4 25.2 26.2 0.2United Statesa. . . . . . . . . . . . . . . . . 17.0 20.8 20.7 19.6 20.2 20.2 20.8 21.7 0.2Canada . . . . . . . . . . . . . . . . . . . . . . 1.7 2.3 2.3 2.3 2.3 2.3 2.4 2.5 0.3Mexico. . . . . . . . . . . . . . . . . . . . . . . 1.8 2.1 2.1 1.5 1.7 1.9 2.0 2.1 0.0
OECD Europe . . . . . . . . . . . . . . . . . 13.7 15.7 15.7 14.5 14.5 14.9 15.0 15.0 -0.2OECD Asia . . . . . . . . . . . . . . . . . . . . 7.2 8.6 8.5 8.4 8.6 8.8 8.8 8.7 0.1Japan . . . . . . . . . . . . . . . . . . . . . . . 5.3 5.3 5.2 4.6 4.8 5.0 4.8 4.7 -0.4South Korea . . . . . . . . . . . . . . . . . . 1.0 2.2 2.2 2.8 2.7 2.6 2.7 2.8 1.0Australia/New Zealand . . . . . . . . . . 0.8 1.1 1.1 1.0 1.1 1.2 1.2 1.3 0.6Total OECD . . . . . . . . . . . . . . . . . 41.4 49.5 49.2 46.3 47.2 48.1 48.9 50.0 0.1
Non-OECDNon-OECD Europe and Eurasia. . . 9.4 4.9 5.0 5.1 5.2 5.4 5.4 5.5 0.4Russia . . . . . . . . . . . . . . . . . . . . . . . 5.4 2.8 2.8 2.7 2.8 2.9 2.8 2.7 -0.1Other . . . . . . . . . . . . . . . . . . . . . . . . 3.9 2.1 2.1 2.4 2.4 2.5 2.6 2.7 1.0
Non-OECD Asia. . . . . . . . . . . . . . . . 6.6 15.3 16.0 17.8 20.6 24.2 27.3 30.2 2.7China. . . . . . . . . . . . . . . . . . . . . . . . 2.3 6.7 7.2 8.5 10.0 12.1 13.8 15.3 3.2India . . . . . . . . . . . . . . . . . . . . . . . . 1.2 2.5 2.7 2.4 3.1 3.9 4.3 4.7 2.4Other Non-OECD Asia . . . . . . . . . . 3.1 6.1 6.1 6.9 7.5 8.2 9.1 10.2 2.1
Middle East . . . . . . . . . . . . . . . . . . . 3.5 5.8 6.1 7.0 7.4 7.9 8.5 9.4 1.8Africa . . . . . . . . . . . . . . . . . . . . . . . . 2.1 3.0 3.0 3.5 3.6 3.7 3.8 3.9 1.2Central and South America . . . . . . 3.8 5.5 5.7 6.6 6.6 6.8 7.1 7.6 1.2Brazil . . . . . . . . . . . . . . . . . . . . . . . . 1.5 2.2 2.3 2.5 2.8 3.0 3.4 3.7 2.1Other Central and South America. . 2.3 3.3 3.4 4.0 3.8 3.7 3.8 3.9 0.5Total Non-OECD . . . . . . . . . . . . . 25.3 34.5 35.8 40.0 43.4 47.8 52.2 56.6 1.9
Total World . . . . . . . . . . . . . . . . . . . . 66.7 84.0 85.0 86.3 90.6 95.9 101.1 106.6 0.9aIncludes the 50 States and the District of Columbia.Note: Totals may not equal sum of components due to independent rounding.Sources: History: Energy Information Administration (EIA), International Energy Annual 2006 (June-December 2008), web site
www.eia.doe.gov/iea. Projections: EIA, Annual Energy Outlook 2009, DOE/EIA-0383(2009) (Washington, DC, March 2009),AEO2009 National Energy Modeling System, run AEO2009.D120908A, web site www.eia.doe.gov/oiaf/aeo; and World Energy Pro-jections Plus (2009).
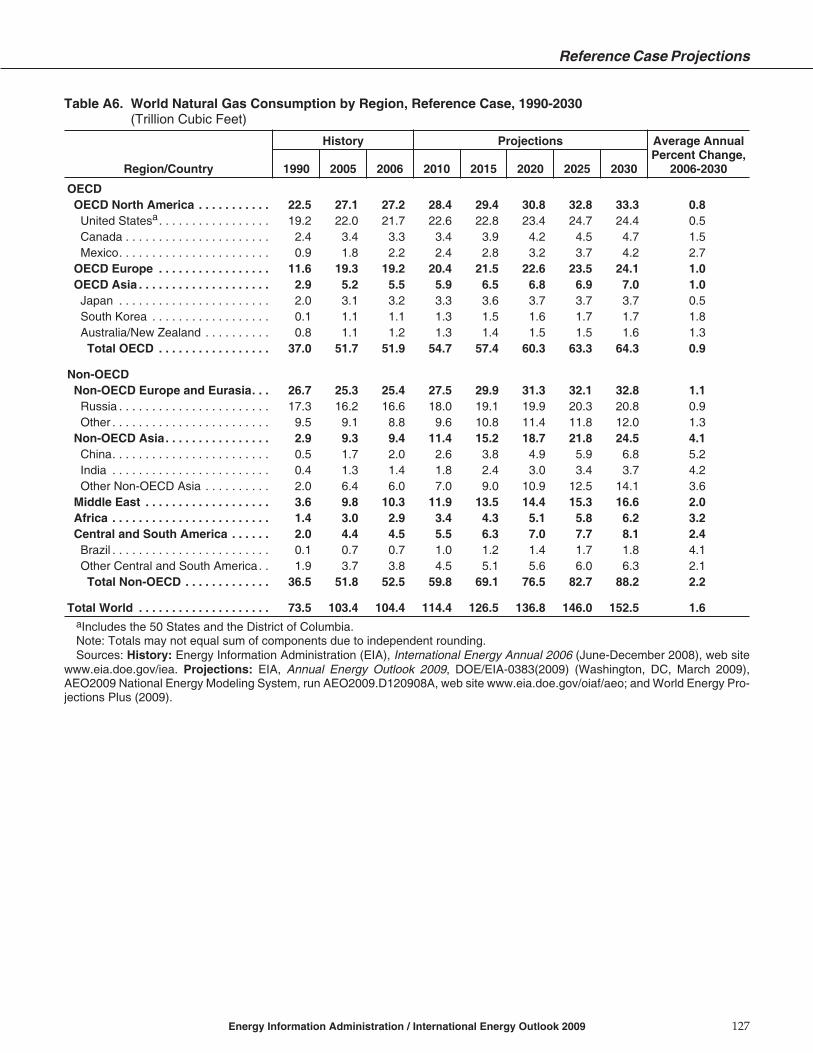
Table A6. World Natural Gas Consumption by Region, Reference Case, 1990-2030(Trillion Cubic Feet)
Reference Case Projections
Energy Information Administration / International Energy Outlook 2009 127
Region/Country
History Projections Average AnnualPercent Change,
2006-20301990 2005 2006 2010 2015 2020 2025 2030
OECDOECD North America . . . . . . . . . . . 22.5 27.1 27.2 28.4 29.4 30.8 32.8 33.3 0.8United Statesa. . . . . . . . . . . . . . . . . 19.2 22.0 21.7 22.6 22.8 23.4 24.7 24.4 0.5Canada . . . . . . . . . . . . . . . . . . . . . . 2.4 3.4 3.3 3.4 3.9 4.2 4.5 4.7 1.5Mexico. . . . . . . . . . . . . . . . . . . . . . . 0.9 1.8 2.2 2.4 2.8 3.2 3.7 4.2 2.7
OECD Europe . . . . . . . . . . . . . . . . . 11.6 19.3 19.2 20.4 21.5 22.6 23.5 24.1 1.0OECD Asia . . . . . . . . . . . . . . . . . . . . 2.9 5.2 5.5 5.9 6.5 6.8 6.9 7.0 1.0Japan . . . . . . . . . . . . . . . . . . . . . . . 2.0 3.1 3.2 3.3 3.6 3.7 3.7 3.7 0.5South Korea . . . . . . . . . . . . . . . . . . 0.1 1.1 1.1 1.3 1.5 1.6 1.7 1.7 1.8Australia/New Zealand . . . . . . . . . . 0.8 1.1 1.2 1.3 1.4 1.5 1.5 1.6 1.3Total OECD . . . . . . . . . . . . . . . . . 37.0 51.7 51.9 54.7 57.4 60.3 63.3 64.3 0.9
Non-OECDNon-OECD Europe and Eurasia. . . 26.7 25.3 25.4 27.5 29.9 31.3 32.1 32.8 1.1Russia . . . . . . . . . . . . . . . . . . . . . . . 17.3 16.2 16.6 18.0 19.1 19.9 20.3 20.8 0.9Other . . . . . . . . . . . . . . . . . . . . . . . . 9.5 9.1 8.8 9.6 10.8 11.4 11.8 12.0 1.3
Non-OECD Asia. . . . . . . . . . . . . . . . 2.9 9.3 9.4 11.4 15.2 18.7 21.8 24.5 4.1China. . . . . . . . . . . . . . . . . . . . . . . . 0.5 1.7 2.0 2.6 3.8 4.9 5.9 6.8 5.2India . . . . . . . . . . . . . . . . . . . . . . . . 0.4 1.3 1.4 1.8 2.4 3.0 3.4 3.7 4.2Other Non-OECD Asia . . . . . . . . . . 2.0 6.4 6.0 7.0 9.0 10.9 12.5 14.1 3.6
Middle East . . . . . . . . . . . . . . . . . . . 3.6 9.8 10.3 11.9 13.5 14.4 15.3 16.6 2.0Africa . . . . . . . . . . . . . . . . . . . . . . . . 1.4 3.0 2.9 3.4 4.3 5.1 5.8 6.2 3.2Central and South America . . . . . . 2.0 4.4 4.5 5.5 6.3 7.0 7.7 8.1 2.4Brazil . . . . . . . . . . . . . . . . . . . . . . . . 0.1 0.7 0.7 1.0 1.2 1.4 1.7 1.8 4.1Other Central and South America. . 1.9 3.7 3.8 4.5 5.1 5.6 6.0 6.3 2.1Total Non-OECD . . . . . . . . . . . . . 36.5 51.8 52.5 59.8 69.1 76.5 82.7 88.2 2.2
Total World . . . . . . . . . . . . . . . . . . . . 73.5 103.4 104.4 114.4 126.5 136.8 146.0 152.5 1.6aIncludes the 50 States and the District of Columbia.Note: Totals may not equal sum of components due to independent rounding.Sources: History: Energy Information Administration (EIA), International Energy Annual 2006 (June-December 2008), web site
www.eia.doe.gov/iea. Projections: EIA, Annual Energy Outlook 2009, DOE/EIA-0383(2009) (Washington, DC, March 2009),AEO2009 National Energy Modeling System, run AEO2009.D120908A, web site www.eia.doe.gov/oiaf/aeo; and World Energy Pro-jections Plus (2009).

Table A7. World Coal Consumption by Region, Reference Case, 1990-2030(Quadrillion Btu)
Appendix A
128 Energy Information Administration / International Energy Outlook 2009
Region/Country
History Projections Average AnnualPercent Change,
2006-20301990 2005 2006 2010 2015 2020 2025 2030
OECDOECD North America . . . . . . . . . . . 20.6 24.7 24.3 24.8 25.5 26.0 26.5 28.8 0.7United Statesa. . . . . . . . . . . . . . . . . 19.2 22.8 22.5 22.9 23.6 24.0 24.4 26.6 0.7Canada . . . . . . . . . . . . . . . . . . . . . . 1.2 1.5 1.4 1.5 1.5 1.5 1.6 1.6 0.5Mexico. . . . . . . . . . . . . . . . . . . . . . . 0.2 0.4 0.4 0.4 0.4 0.4 0.5 0.6 1.5
OECD Europe . . . . . . . . . . . . . . . . . 17.7 12.9 13.2 13.0 12.8 12.4 12.2 12.0 -0.4OECD Asia . . . . . . . . . . . . . . . . . . . . 5.2 9.3 9.4 9.5 9.5 9.5 9.6 9.8 0.2Japan . . . . . . . . . . . . . . . . . . . . . . . 2.7 4.6 4.6 4.5 4.5 4.3 4.2 4.0 -0.6South Korea . . . . . . . . . . . . . . . . . . 1.0 2.1 2.2 2.4 2.4 2.5 2.7 2.9 1.2Australia/New Zealand . . . . . . . . . . 1.5 2.6 2.6 2.6 2.6 2.7 2.7 2.9 0.5Total OECD . . . . . . . . . . . . . . . . . 43.5 46.9 46.9 47.3 47.8 47.9 48.3 50.7 0.3
Non-OECDNon-OECD Europe and Eurasia. . . 15.1 8.9 8.7 9.2 9.5 9.3 9.2 9.4 0.3Russia . . . . . . . . . . . . . . . . . . . . . . . 7.2 4.8 4.6 5.0 5.2 5.1 5.1 5.2 0.5Other . . . . . . . . . . . . . . . . . . . . . . . . 7.9 4.1 4.2 4.2 4.3 4.2 4.1 4.2 0.0
Non-OECD Asia. . . . . . . . . . . . . . . . 27.0 60.4 66.5 78.5 87.6 98.4 111.1 122.8 2.6China. . . . . . . . . . . . . . . . . . . . . . . . 20.3 46.9 52.0 62.7 70.3 79.5 90.1 98.3 2.7India . . . . . . . . . . . . . . . . . . . . . . . . 4.2 8.6 9.4 10.3 11.2 12.1 12.9 14.2 1.7Other Non-OECD Asia . . . . . . . . . . 2.6 4.9 5.1 5.5 6.1 6.7 8.1 10.4 3.0
Middle East . . . . . . . . . . . . . . . . . . . 0.1 0.4 0.4 0.4 0.4 0.4 0.4 0.5 1.1Africa . . . . . . . . . . . . . . . . . . . . . . . . 3.0 4.2 4.2 4.2 4.4 4.6 4.8 5.3 1.0Central and South America . . . . . . 0.6 0.9 0.8 0.9 1.0 1.2 1.3 1.6 2.8Brazil . . . . . . . . . . . . . . . . . . . . . . . . 0.3 0.4 0.4 0.5 0.6 0.7 0.9 1.0 3.5Other Central and South America. . 0.2 0.4 0.4 0.4 0.4 0.4 0.5 0.6 1.7Total Non-OECD . . . . . . . . . . . . . 45.7 74.8 80.6 93.3 102.9 113.8 126.9 139.6 2.3
Total World . . . . . . . . . . . . . . . . . . . . 89.2 121.7 127.5 140.6 150.7 161.7 175.2 190.2 1.7aIncludes the 50 States and the District of Columbia.Notes: Totals may not equal sum of components due to independent rounding.Sources: History: Energy Information Administration (EIA), International Energy Annual 2006 (June-December 2008), web site
www.eia.doe.gov/iea. Projections: EIA, Annual Energy Outlook 2009, DOE/EIA-0383(2009) (Washington, DC, March 2009),AEO2009 National Energy Modeling System, run AEO2009.D120908A, web site www.eia.doe.gov/oiaf/aeo; and World Energy Pro-jections Plus (2009).

Table A8. World Nuclear Energy Consumption by Region, Reference Case, 1990-2030(Billion Kilowatthours)
Reference Case Projections
Energy Information Administration / International Energy Outlook 2009 129
Region/Country
History Projections Average AnnualPercent Change,
2006-20301990 2005 2006 2010 2015 2020 2025 2030
OECDOECD North America . . . . . . . . . . . 649 880 891 928 955 992 1,004 1,053 0.7United Statesa. . . . . . . . . . . . . . . . . 577 782 787 809 831 862 867 907 0.6Canada . . . . . . . . . . . . . . . . . . . . . . 69 87 93 108 113 120 127 135 1.5Mexico. . . . . . . . . . . . . . . . . . . . . . . 3 10 10 11 11 11 11 11 0.1
OECD Europe . . . . . . . . . . . . . . . . . 743 932 929 922 915 905 896 902 -0.1OECD Asia . . . . . . . . . . . . . . . . . . . . 242 429 430 441 494 546 583 624 1.6Japan . . . . . . . . . . . . . . . . . . . . . . . 192 290 288 299 319 336 358 381 1.2South Korea . . . . . . . . . . . . . . . . . . 50 139 141 142 175 210 225 243 2.3Australia/New Zealand . . . . . . . . . . 0 0 0 0 0 0 0 0 —Total OECD . . . . . . . . . . . . . . . . . 1,635 2,240 2,250 2,291 2,364 2,443 2,484 2,579 0.6
Non-OECDNon-OECD Europe and Eurasia. . . 219 264 269 283 342 424 494 519 2.8Russia . . . . . . . . . . . . . . . . . . . . . . . 115 140 144 155 197 251 307 328 3.5Other . . . . . . . . . . . . . . . . . . . . . . . . 104 124 124 128 145 173 187 191 1.8
Non-OECD Asia. . . . . . . . . . . . . . . . 38 106 111 151 290 455 600 678 7.8China. . . . . . . . . . . . . . . . . . . . . . . . 0 50 55 65 164 274 366 425 8.9India . . . . . . . . . . . . . . . . . . . . . . . . 6 16 16 37 66 104 134 149 9.9Other Non-OECD Asia . . . . . . . . . . 32 40 40 48 61 77 100 104 4.0
Middle East . . . . . . . . . . . . . . . . . . . 0 0 0 0 6 13 13 13 —Africa . . . . . . . . . . . . . . . . . . . . . . . . 8 12 10 14 15 15 21 21 3.2Central and South America . . . . . . 9 16 21 23 28 34 34 34 2.1Brazil . . . . . . . . . . . . . . . . . . . . . . . . 2 10 14 15 18 22 22 22 2.0Other Central and South America. . 7 6 7 8 10 12 12 12 2.2Total Non-OECD . . . . . . . . . . . . . 274 399 411 471 681 941 1,162 1,266 4.8
Total World . . . . . . . . . . . . . . . . . . . . 1,909 2,639 2,660 2,761 3,045 3,385 3,646 3,844 1.5aIncludes the 50 States and the District of Columbia.Note: Totals may not equal sum of components due to independent rounding.Sources: History: Energy Information Administration (EIA), International Energy Annual 2006 (June-December 2008), web site
www.eia.doe.gov/iea. Projections: EIA, Annual Energy Outlook 2009, DOE/EIA-0383(2009) (Washington, DC, March 2009),AEO2009 National Energy Modeling System, run AEO2009.D120908A, web site www.eia.doe.gov/oiaf/aeo; and World Energy Pro-jections Plus (2009).

Table A9. World Consumption of Hydroelectricity and Other Renewable Energy by Region, Reference Case,1990-2030(Quadrillion Btu)
Appendix A
130 Energy Information Administration / International Energy Outlook 2009
Region/Country
History Projections Average AnnualPercent Change,
2006-20301990 2005 2006 2010 2015 2020 2025 2030
OECDOECD North America . . . . . . . . . . . 9.7 10.3 10.5 11.8 13.3 14.8 16.1 17.0 2.0
United Statesa. . . . . . . . . . . . . . . . . 6.2 6.1 6.5 7.4 8.3 9.5 10.4 10.9 2.2Canada . . . . . . . . . . . . . . . . . . . . . . 3.1 3.7 3.6 3.9 4.4 4.7 5.1 5.4 1.7Mexico. . . . . . . . . . . . . . . . . . . . . . . 0.3 0.4 0.5 0.5 0.6 0.7 0.7 0.7 1.9
OECD Europe . . . . . . . . . . . . . . . . . 4.8 6.5 6.6 8.5 10.3 11.9 13.3 14.4 3.3OECD Asia . . . . . . . . . . . . . . . . . . . . 1.6 1.6 1.7 2.1 2.6 2.8 2.9 3.0 2.4Japan . . . . . . . . . . . . . . . . . . . . . . . 1.1 1.0 1.1 1.3 1.4 1.5 1.5 1.5 1.2South Korea . . . . . . . . . . . . . . . . . . 0.0 0.0 0.0 0.1 0.1 0.1 0.1 0.1 5.3Australia/New Zealand . . . . . . . . . . 0.4 0.5 0.5 0.7 1.1 1.2 1.3 1.3 4.2Total OECD . . . . . . . . . . . . . . . . . 16.0 18.3 18.8 22.4 26.3 29.5 32.3 34.3 2.5
Non-OECDNon-OECD Europe and Eurasia. . . 2.8 3.1 3.0 3.2 3.4 3.5 3.7 3.8 0.9Russia . . . . . . . . . . . . . . . . . . . . . . . 1.8 1.8 1.8 1.9 2.0 2.2 2.3 2.4 1.3Other . . . . . . . . . . . . . . . . . . . . . . . . 1.0 1.3 1.3 1.3 1.4 1.4 1.4 1.4 0.3
Non-OECD Asia. . . . . . . . . . . . . . . . 3.0 6.6 7.2 10.7 14.6 18.2 19.5 22.4 4.9China. . . . . . . . . . . . . . . . . . . . . . . . 1.3 4.0 4.3 7.0 9.5 11.8 12.4 14.7 5.2India . . . . . . . . . . . . . . . . . . . . . . . . 0.7 1.1 1.2 1.6 2.1 2.6 3.0 3.2 4.2Other Non-OECD Asia . . . . . . . . . . 0.9 1.6 1.6 2.1 2.9 3.7 4.2 4.5 4.3
Middle East . . . . . . . . . . . . . . . . . . . 0.1 0.2 0.2 0.3 0.4 0.5 0.5 0.5 3.4Africa . . . . . . . . . . . . . . . . . . . . . . . . 0.6 0.9 0.9 1.0 1.3 1.4 1.5 1.5 2.1Central and South America . . . . . . 3.9 6.4 6.6 7.8 8.7 9.7 10.6 11.5 2.3
Brazil . . . . . . . . . . . . . . . . . . . . . . . . 2.2 3.5 3.6 4.5 5.2 5.9 6.6 7.3 3.0Other Central and South America. . 1.7 2.9 3.0 3.4 3.6 3.8 4.0 4.2 1.4Total Non-OECD . . . . . . . . . . . . . 10.3 17.2 18.0 23.1 28.4 33.2 35.8 39.8 3.4
Total World . . . . . . . . . . . . . . . . . . . . 26.3 35.5 36.8 45.6 54.6 62.8 68.1 74.1 3.0aIncludes the 50 States and the District of Columbia.Notes: Totals may not equal sum of components due to independent rounding. U.S. totals include net electricity imports, methanol,
and liquid hydrogen. Numbers for the United States in this table are based on the published AEO2009 reference case (March 2009).In the updated AEO2009 reference case (April 2009), which incorporates provisions from the American Recovery and ReinvestmentAct of 2009 (ARRA2009) that stimulate increased renewable generation, greater use of renewable fuels is projected. U.S. consump-tion of hydroelectricity and other renewable energy is projected to be 9.4 quadrillion Btu in 2015 and 11.8 quadrillion Btu in 2030 in theupdated AEO2009 reference case—13 percent higher in 2015 and 8 percent higher in 2030 than in the earlier projections reported inthis table.
Sources: History: Energy Information Administration (EIA), International Energy Annual 2006 (June-December 2008), web sitewww.eia.doe.gov/iea. Projections: EIA, Annual Energy Outlook 2009, DOE/EIA-0383(2009) (Washington, DC, March 2009),AEO2009 National Energy Modeling System, run AEO2009.D120908A, web site www.eia.doe.gov/oiaf/aeo; and World Energy Pro-jections Plus (2009).

Table A10. World Carbon Dioxide Emissions by Region, Reference Case, 1990-2030(Million Metric Tons Carbon Dioxide)
Reference Case Projections
Energy Information Administration / International Energy Outlook 2009 131
Region/Country
History Projections Average AnnualPercent Change,
2006-20301990 2005 2006 2010 2015 2020 2025 2030
OECDOECD North America . . . . . . . . . . . 5,762 7,007 6,948 6,794 6,963 7,123 7,341 7,703 0.4United Statesa. . . . . . . . . . . . . . . . . 4,989 5,975 5,907 5,801 5,904 5,982 6,125 6,414 0.3Canada . . . . . . . . . . . . . . . . . . . . . . 471 629 611 622 645 675 705 731 0.8Mexico. . . . . . . . . . . . . . . . . . . . . . . 302 403 431 371 414 466 510 557 1.1
OECD Europe . . . . . . . . . . . . . . . . . 4,149 4,424 4,429 4,335 4,368 4,450 4,489 4,519 0.1OECD Asia . . . . . . . . . . . . . . . . . . . . 1,595 2,200 2,216 2,221 2,287 2,327 2,346 2,367 0.3
Japan . . . . . . . . . . . . . . . . . . . . . . . 1,054 1,250 1,247 1,169 1,204 1,219 1,188 1,157 -0.3South Korea . . . . . . . . . . . . . . . . . . 243 497 515 598 614 617 651 680 1.2Australia/New Zealand . . . . . . . . . . 298 454 455 454 469 491 507 530 0.6Total OECD . . . . . . . . . . . . . . . . . 11,506 13,632 13,594 13,351 13,617 13,900 14,176 14,588 0.3
Non-OECDNon-OECD Europe and Eurasia. . . 4,246 2,889 2,886 3,069 3,234 3,323 3,362 3,422 0.7Russia . . . . . . . . . . . . . . . . . . . . . . . 2,393 1,699 1,704 1,803 1,894 1,945 1,950 1,978 0.6Other . . . . . . . . . . . . . . . . . . . . . . . . 1,853 1,190 1,182 1,266 1,339 1,378 1,412 1,443 0.8
Non-OECD Asia. . . . . . . . . . . . . . . . 3,678 8,305 8,987 10,465 11,900 13,590 15,382 17,033 2.7China. . . . . . . . . . . . . . . . . . . . . . . . 2,293 5,429 6,018 7,222 8,204 9,417 10,707 11,730 2.8India . . . . . . . . . . . . . . . . . . . . . . . . 573 1,192 1,292 1,366 1,572 1,783 1,931 2,115 2.1Other Non-OECD Asia . . . . . . . . . . 811 1,684 1,678 1,877 2,124 2,390 2,744 3,188 2.7
Middle East . . . . . . . . . . . . . . . . . . . 704 1,393 1,456 1,686 1,830 1,939 2,088 2,279 1.9Africa . . . . . . . . . . . . . . . . . . . . . . . . 659 985 982 1,086 1,161 1,239 1,325 1,409 1.5Central and South America . . . . . . 695 1,093 1,123 1,311 1,368 1,437 1,547 1,654 1.6Brazil . . . . . . . . . . . . . . . . . . . . . . . . 235 366 374 437 488 543 612 682 2.5Other Central and South America. . 460 727 749 874 881 894 935 972 1.1Total Non-OECD . . . . . . . . . . . . . 9,982 14,664 15,434 17,616 19,494 21,528 23,703 25,797 2.2
Total World . . . . . . . . . . . . . . . . . . . . 21,488 28,296 29,028 30,967 33,111 35,428 37,879 40,385 1.4aIncludes the 50 States and the District of Columbia.Note: The U.S. numbers include carbon dioxide emissions attributable to renewable energy sources.Sources: History: Energy Information Administration (EIA), International Energy Annual 2006 (June-December 2008), web site
www.eia.doe.gov/iea. Projections: EIA, Annual Energy Outlook 2009, DOE/EIA-0383(2009) (Washington, DC, March 2009),AEO2009 National Energy Modeling System, run AEO2009.D120908A, web site www.eia.doe.gov/oiaf/aeo; and World Energy Pro-jections Plus (2009).

Table A11. World Carbon Dioxide Emissions from Liquids Use by Region, Reference Case, 1990-2030(Million Metric Tons Carbon Dioxide)
Appendix A
132 Energy Information Administration / International Energy Outlook 2009
Region/Country
History Projections Average AnnualPercent Change,
2006-20301990 2005 2006 2010 2015 2020 2025 2030
OECDOECD North America . . . . . . . . . . . 2,637 3,188 3,159 2,889 2,933 2,969 3,022 3,149 0.0United Statesa. . . . . . . . . . . . . . . . . 2,178 2,620 2,596 2,396 2,421 2,427 2,458 2,564 -0.1Canada . . . . . . . . . . . . . . . . . . . . . . 227 301 295 295 294 300 310 320 0.3Mexico. . . . . . . . . . . . . . . . . . . . . . . 233 267 268 198 217 242 255 265 0.0
OECD Europe . . . . . . . . . . . . . . . . . 1,884 2,134 2,135 1,978 1,974 2,031 2,044 2,052 -0.2OECD Asia . . . . . . . . . . . . . . . . . . . . 945 1,028 1,014 990 1,018 1,043 1,042 1,040 0.1
Japan . . . . . . . . . . . . . . . . . . . . . . . 687 641 626 554 578 598 582 567 -0.4South Korea . . . . . . . . . . . . . . . . . . 144 239 237 299 295 287 295 299 1.0Australia/New Zealand . . . . . . . . . . 114 148 151 137 145 158 165 174 0.6Total OECD . . . . . . . . . . . . . . . . . 5,466 6,350 6,308 5,856 5,925 6,043 6,108 6,241 0.0
Non-OECDNon-OECD Europe and Eurasia. . . 1,368 686 692 713 730 752 759 765 0.4Russia . . . . . . . . . . . . . . . . . . . . . . . 782 383 389 374 386 399 388 377 -0.1Other . . . . . . . . . . . . . . . . . . . . . . . . 586 303 303 339 344 353 370 388 1.0
Non-OECD Asia. . . . . . . . . . . . . . . . 960 2,077 2,170 2,414 2,780 3,260 3,679 4,071 2.7China. . . . . . . . . . . . . . . . . . . . . . . . 335 889 960 1,129 1,326 1,604 1,838 2,032 3.2India . . . . . . . . . . . . . . . . . . . . . . . . 160 314 332 305 388 488 537 587 2.4Other Non-OECD Asia . . . . . . . . . . 466 874 878 980 1,066 1,169 1,304 1,452 2.1
Middle East . . . . . . . . . . . . . . . . . . . 491 814 849 986 1,043 1,103 1,195 1,313 1.8Africa . . . . . . . . . . . . . . . . . . . . . . . . 302 423 424 495 507 522 544 560 1.2Central and South America . . . . . . 525 761 790 913 916 932 984 1,049 1.2Brazil . . . . . . . . . . . . . . . . . . . . . . . . 197 288 294 332 364 397 438 487 2.1Other Central and South America. . 328 473 496 581 553 536 547 563 0.5Total Non-OECD . . . . . . . . . . . . . 3,646 4,760 4,926 5,522 5,977 6,570 7,161 7,758 1.9
Total World . . . . . . . . . . . . . . . . . . . . 9,112 11,110 11,234 11,378 11,901 12,613 13,269 13,998 0.9aIncludes the 50 States and the District of Columbia.Sources: History: Energy Information Administration (EIA), International Energy Annual 2006 (June-December 2008), web site
www.eia.doe.gov/iea. Projections: EIA, Annual Energy Outlook 2009, DOE/EIA-0383(2009) (Washington, DC, March 2009),AEO2009 National Energy Modeling System, run AEO2009.D120908A, web site www.eia.doe.gov/oiaf/aeo; and World Energy Pro-jections Plus (2009).

Table A12. World Carbon Dioxide Emissions from Natural Gas Use by Region, Reference Case, 1990-2030(Million Metric Tons Carbon Dioxide)
Reference Case Projections
Energy Information Administration / International Energy Outlook 2009 133
Region/Country
History Projections Average AnnualPercent Change,
2006-20301990 2005 2006 2010 2015 2020 2025 2030
OECDOECD North America . . . . . . . . . . . 1,208 1,468 1,465 1,541 1,597 1,678 1,789 1,814 0.9United Statesa. . . . . . . . . . . . . . . . . 1,026 1,183 1,159 1,218 1,228 1,265 1,333 1,318 0.5Canada . . . . . . . . . . . . . . . . . . . . . . 128 185 181 189 211 230 246 259 1.5Mexico. . . . . . . . . . . . . . . . . . . . . . . 54 100 125 134 157 182 209 237 2.7
OECD Europe . . . . . . . . . . . . . . . . . 593 1,053 1,047 1,113 1,173 1,234 1,283 1,315 1.0OECD Asia . . . . . . . . . . . . . . . . . . . . 165 306 323 344 377 397 403 407 1.0
Japan . . . . . . . . . . . . . . . . . . . . . . . 115 181 191 197 213 219 218 215 0.5South Korea . . . . . . . . . . . . . . . . . . 6 64 68 77 90 96 102 105 1.8Australia/New Zealand . . . . . . . . . . 44 61 64 70 75 82 83 87 1.3Total OECD . . . . . . . . . . . . . . . . . 1,966 2,827 2,835 2,997 3,147 3,308 3,475 3,536 0.9
Non-OECDNon-OECD Europe and Eurasia. . . 1,457 1,367 1,371 1,487 1,614 1,692 1,735 1,772 1.1Russia . . . . . . . . . . . . . . . . . . . . . . . 933 865 889 962 1,022 1,064 1,087 1,115 0.9Other . . . . . . . . . . . . . . . . . . . . . . . . 524 502 482 525 591 628 648 658 1.3
Non-OECD Asia. . . . . . . . . . . . . . . . 161 508 510 621 826 1,018 1,183 1,334 4.1China. . . . . . . . . . . . . . . . . . . . . . . . 30 92 111 146 210 269 325 375 5.2India . . . . . . . . . . . . . . . . . . . . . . . . 24 70 76 98 131 164 187 201 4.2Other Non-OECD Asia . . . . . . . . . . 106 347 324 377 485 585 672 758 3.6
Middle East . . . . . . . . . . . . . . . . . . . 200 543 571 665 751 798 853 921 2.0Africa . . . . . . . . . . . . . . . . . . . . . . . . 80 168 168 194 243 291 330 355 3.2Central and South America . . . . . . 117 250 255 309 353 395 437 455 2.4Brazil . . . . . . . . . . . . . . . . . . . . . . . . 6 36 38 54 64 78 93 99 4.1Other Central and South America. . 111 214 218 255 289 318 344 356 2.1Total Non-OECD . . . . . . . . . . . . . 2,015 2,837 2,876 3,275 3,788 4,195 4,538 4,838 2.2
Total World . . . . . . . . . . . . . . . . . . . . 3,981 5,664 5,712 6,273 6,936 7,504 8,013 8,373 1.6aIncludes the 50 States and the District of Columbia.Sources: History: Energy Information Administration (EIA), International Energy Annual 2006 (June-December 2008), web site
www.eia.doe.gov/iea. Projections: EIA, Annual Energy Outlook 2009, DOE/EIA-0383(2009) (Washington, DC, March 2009),AEO2009 National Energy Modeling System, run AEO2009.D120908A, web site www.eia.doe.gov/oiaf/aeo; and World Energy Pro-jections Plus (2009).

Table A13. World Carbon Dioxide Emissions from Coal Use by Region, Reference Case, 1990-2030(Million Metric Tons Carbon Dioxide)
Appendix A
134 Energy Information Administration / International Energy Outlook 2009
Region/Country
History Projections Average AnnualPercent Change,
2006-20301990 2005 2006 2010 2015 2020 2025 2030
OECDOECD North America . . . . . . . . . . . 1,916 2,339 2,312 2,353 2,421 2,464 2,518 2,728 0.7United Statesa. . . . . . . . . . . . . . . . . 1,784 2,161 2,140 2,176 2,242 2,278 2,322 2,521 0.7Canada . . . . . . . . . . . . . . . . . . . . . . 116 142 134 138 140 144 150 152 0.5Mexico. . . . . . . . . . . . . . . . . . . . . . . 16 36 38 38 39 42 46 55 1.5
OECD Europe . . . . . . . . . . . . . . . . . 1,672 1,237 1,247 1,245 1,220 1,184 1,162 1,152 -0.3OECD Asia . . . . . . . . . . . . . . . . . . . . 485 866 879 888 892 888 901 920 0.2
Japan . . . . . . . . . . . . . . . . . . . . . . . 252 427 430 419 414 403 388 375 -0.6South Korea . . . . . . . . . . . . . . . . . . 93 194 209 222 229 235 254 276 1.2Australia/New Zealand . . . . . . . . . . 140 244 240 247 248 251 258 269 0.5Total OECD . . . . . . . . . . . . . . . . . 4,073 4,443 4,438 4,486 4,534 4,537 4,581 4,800 0.3
Non-OECDNon-OECD Europe and Eurasia. . . 1,421 836 823 869 890 879 868 885 0.3Russia . . . . . . . . . . . . . . . . . . . . . . . 678 451 427 466 486 482 475 487 0.5Other . . . . . . . . . . . . . . . . . . . . . . . . 743 385 396 403 404 397 393 398 0.0
Non-OECD Asia. . . . . . . . . . . . . . . . 2,557 5,720 6,307 7,430 8,294 9,312 10,519 11,628 2.6China. . . . . . . . . . . . . . . . . . . . . . . . 1,929 4,449 4,947 5,948 6,667 7,544 8,544 9,323 2.7India . . . . . . . . . . . . . . . . . . . . . . . . 389 808 883 962 1,053 1,131 1,207 1,327 1.7Other Non-OECD Asia . . . . . . . . . . 239 463 476 520 573 636 768 978 3.0
Middle East . . . . . . . . . . . . . . . . . . . 14 36 36 35 36 37 40 45 0.9Africa . . . . . . . . . . . . . . . . . . . . . . . . 277 394 389 397 411 426 451 494 1.0Central and South America . . . . . . 53 81 77 89 98 110 126 150 2.8Brazil . . . . . . . . . . . . . . . . . . . . . . . . 32 42 42 51 60 69 82 96 3.5Other Central and South America. . 21 40 36 38 39 41 44 53 1.7Total Non-OECD . . . . . . . . . . . . . 4,321 7,067 7,632 8,819 9,729 10,763 12,005 13,201 2.3
Total World . . . . . . . . . . . . . . . . . . . . 8,394 11,510 12,070 13,304 14,262 15,300 16,585 18,001 1.7aIncludes the 50 States and the District of Columbia.Sources: History: Energy Information Administration (EIA), International Energy Annual 2006 (June-December 2008), web site
www.eia.doe.gov/iea. Projections: EIA, Annual Energy Outlook 2009, DOE/EIA-0383(2009) (Washington, DC, March 2009),AEO2009 National Energy Modeling System, run AEO2009.D120908A, web site www.eia.doe.gov/oiaf/aeo; and World Energy Pro-jections Plus (2009).

Table A14. World Population by Region, Reference Case, 1990-2030(Millions)
Reference Case Projections
Energy Information Administration / International Energy Outlook 2009 135
Region/Country
History Projections Average AnnualPercent Change,
2006-20301990 2005 2006 2010 2015 2020 2025 2030
OECDOECD North America . . . . . . . . . . . 366 433 438 455 478 500 521 542 0.9United Statesa. . . . . . . . . . . . . . . . . 254 297 300 311 327 343 359 375 0.9Canada . . . . . . . . . . . . . . . . . . . . . . 28 32 33 34 35 37 38 39 0.8Mexico. . . . . . . . . . . . . . . . . . . . . . . 84 104 105 110 116 121 125 128 0.8
OECD Europe . . . . . . . . . . . . . . . . . 497 536 538 547 555 561 565 568 0.2OECD Asia . . . . . . . . . . . . . . . . . . . . 187 200 201 202 203 202 200 197 -0.1Japan . . . . . . . . . . . . . . . . . . . . . . . 124 128 128 128 127 124 122 118 -0.3South Korea . . . . . . . . . . . . . . . . . . 43 48 48 49 49 49 49 48 0.0Australia/New Zealand . . . . . . . . . . 20 24 25 26 27 28 29 30 0.8Total OECD . . . . . . . . . . . . . . . . . 1,050 1,169 1,176 1,204 1,235 1,262 1,286 1,307 0.4
Non-OECDNon-OECD Europe and Eurasia. . . 348 342 342 340 337 333 328 322 -0.2Russia . . . . . . . . . . . . . . . . . . . . . . . 149 144 143 140 136 132 128 124 -0.6Other . . . . . . . . . . . . . . . . . . . . . . . . 200 198 198 199 200 201 200 198 0.0
Non-OECD Asia. . . . . . . . . . . . . . . . 2,760 3,431 3,471 3,631 3,826 4,007 4,167 4,300 0.9China. . . . . . . . . . . . . . . . . . . . . . . . 1,149 1,313 1,321 1,352 1,389 1,421 1,446 1,458 0.4India . . . . . . . . . . . . . . . . . . . . . . . . 860 1,134 1,152 1,220 1,303 1,379 1,447 1,506 1.1Other Non-OECD Asia . . . . . . . . . . 751 984 999 1,060 1,135 1,206 1,274 1,336 1.2
Middle East . . . . . . . . . . . . . . . . . . . 137 193 197 213 234 255 275 294 1.7Africa . . . . . . . . . . . . . . . . . . . . . . . . 637 922 944 1,032 1,149 1,271 1,394 1,518 2.0Central and South America . . . . . . 360 454 460 483 512 539 563 585 1.0Brazil . . . . . . . . . . . . . . . . . . . . . . . . 150 187 189 199 210 220 229 236 0.9Other Central and South America. . 211 267 270 284 302 319 335 348 1.1Total Non-OECD . . . . . . . . . . . . . 4,243 5,342 5,413 5,699 6,058 6,405 6,728 7,020 1.1
Total World . . . . . . . . . . . . . . . . . . . . 5,293 6,512 6,590 6,903 7,293 7,667 8,014 8,327 1.0aIncludes the 50 States and the District of Columbia.Sources: United States: EIA, Annual Energy Outlook 2009, DOE/EIA-0383(2009) (Washington, DC, March 2009), AEO2009
National Energy Modeling System, run AEO2009.D120908A, web site www.eia.doe.gov/oiaf/aeo. Other Countries: United Nations,Population Division of the Department of Economic and Social Affairs of the United Nations Secretariat, World Population Prospects:The 2006 Revision and World Urbanization Prospects (February 25, 2006), web site http://esa.un.org/unpp.


Appendix B
High Economic Growth Case Projections:• World Energy Consumption• Gross Domestic Product• Carbon Dioxide Emissions


Table B1. World Total Primary Energy Consumption by Region, High Economic Growth Case, 1990-2030(Quadrillion Btu)
High Economic Growth Case Projections
Energy Information Administration / International Energy Outlook 2009 139
Region/Country
History Projections Average AnnualPercent Change,
2006-20301990 2005 2006 2010 2015 2020 2025 2030
OECDOECD North America . . . . . . . . . . . 100.7 121.6 121.3 122.0 129.3 135.9 143.7 153.8 1.0United Statesa. . . . . . . . . . . . . . . . . 84.7 100.5 100.0 100.7 105.8 110.1 115.6 123.4 0.9Canada . . . . . . . . . . . . . . . . . . . . . . 11.0 14.2 14.0 14.7 15.9 17.2 18.4 19.6 1.4Mexico. . . . . . . . . . . . . . . . . . . . . . . 5.0 6.9 7.4 6.6 7.6 8.7 9.7 10.8 1.6
OECD Europe . . . . . . . . . . . . . . . . . 70.0 81.4 81.6 82.4 86.3 90.9 94.5 97.9 0.8OECD Asia . . . . . . . . . . . . . . . . . . . . 27.0 38.4 38.7 39.6 42.6 44.7 46.3 47.9 0.9Japan . . . . . . . . . . . . . . . . . . . . . . . 18.7 22.7 22.8 22.0 23.3 24.2 24.4 24.6 0.3South Korea . . . . . . . . . . . . . . . . . . 3.8 9.2 9.4 11.0 11.9 12.5 13.4 14.3 1.7Australia/New Zealand . . . . . . . . . . 4.5 6.4 6.5 6.7 7.4 8.0 8.5 9.0 1.4Total OECD . . . . . . . . . . . . . . . . . 197.7 241.3 241.7 244.1 258.2 271.5 284.6 299.6 0.9
Non-OECDNon-OECD Europe and Eurasia. . . 67.3 50.6 50.7 54.2 58.7 62.5 65.3 67.8 1.2Russia . . . . . . . . . . . . . . . . . . . . . . . 39.4 30.1 30.4 32.3 35.0 37.2 38.8 40.3 1.2Other . . . . . . . . . . . . . . . . . . . . . . . . 28.0 20.6 20.3 21.8 23.7 25.2 26.5 27.5 1.3
Non-OECD Asia. . . . . . . . . . . . . . . . 47.4 109.4 117.6 139.8 167.1 198.7 229.4 260.5 3.4China. . . . . . . . . . . . . . . . . . . . . . . . 27.0 66.8 73.8 90.9 108.5 129.5 149.9 169.4 3.5India . . . . . . . . . . . . . . . . . . . . . . . . 7.9 16.3 17.7 19.2 23.4 28.0 31.4 35.0 2.9Other Non-OECD Asia . . . . . . . . . . 12.5 26.3 26.1 29.7 35.2 41.2 48.1 56.0 3.2
Middle East . . . . . . . . . . . . . . . . . . . 11.2 22.7 23.8 27.8 31.0 33.6 36.9 41.1 2.3Africa . . . . . . . . . . . . . . . . . . . . . . . . 9.5 14.5 14.5 16.3 18.1 20.0 21.9 23.6 2.1Central and South America . . . . . . 14.5 23.4 24.2 28.4 31.0 33.9 37.4 40.9 2.2Brazil . . . . . . . . . . . . . . . . . . . . . . . . 5.8 9.4 9.6 11.4 13.2 15.1 17.3 19.5 3.0Other Central and South America. . 8.8 14.0 14.6 17.0 17.9 18.8 20.1 21.4 1.6Total Non-OECD . . . . . . . . . . . . . 149.9 220.7 230.8 266.4 305.9 348.7 390.9 433.8 2.7
Total World . . . . . . . . . . . . . . . . . . . . 347.7 462.1 472.4 510.5 564.1 620.2 675.5 733.4 1.8aIncludes the 50 States and the District of Columbia.Notes: Energy totals include net imports of coal coke and electricity generated from biomass in the United States. Totals may not
equal sum of components due to independent rounding. The electricity portion of the national fuel consumption values consists ofgeneration for domestic use plus an adjustment for electricity trade based on a fuel’s share of total generation in the exporting coun-try.
Sources: History: Energy Information Administration (EIA), International Energy Annual 2006 (June-December 2008), web sitewww.eia.doe.gov/iea. Projections: EIA, Annual Energy Outlook 2009, DOE/EIA-0383(2009) (Washington, DC, March 2009),AEO2009 National Energy Modeling System, run HM2009.D120908A, web site www.eia.doe.gov/oiaf/aeo; and World Energy Pro-jections Plus (2009).

Table B2. World Total Energy Consumption by Region and Fuel, High Economic Growth Case, 1990-2030(Quadrillion Btu)
Appendix B
140 Energy Information Administration / International Energy Outlook 2009
Region/Country
History Projections Average AnnualPercent Change,
2006-20301990 2005 2006 2010 2015 2020 2025 2030
OECDOECD North AmericaLiquids . . . . . . . . . . . . . . . . . . . . . 40.5 49.6 49.2 45.9 48.5 49.9 52.0 55.3 0.5Natural Gas . . . . . . . . . . . . . . . . . 23.0 28.0 28.0 29.4 31.3 33.4 36.2 37.1 1.2Coal . . . . . . . . . . . . . . . . . . . . . . . 20.6 24.7 24.3 24.8 25.7 26.5 27.6 30.8 1.0Nuclear. . . . . . . . . . . . . . . . . . . . . 6.9 9.2 9.4 9.8 10.0 10.7 11.1 12.3 1.1Other . . . . . . . . . . . . . . . . . . . . . . 9.7 10.3 10.5 12.1 13.8 15.4 16.9 18.2 2.3Total. . . . . . . . . . . . . . . . . . . . . . 100.7 121.6 121.3 122.0 129.3 135.9 143.7 153.8 1.0
OECD EuropeLiquids . . . . . . . . . . . . . . . . . . . . . 28.4 32.3 32.4 30.0 30.4 31.9 32.7 33.3 0.1Natural Gas . . . . . . . . . . . . . . . . . 11.2 19.8 19.7 21.1 22.9 24.8 26.5 27.7 1.4Coal . . . . . . . . . . . . . . . . . . . . . . . 17.7 12.9 13.2 13.1 12.9 12.7 12.6 12.9 -0.1Nuclear. . . . . . . . . . . . . . . . . . . . . 7.9 9.7 9.6 9.7 9.7 9.6 9.5 9.5 0.0Other . . . . . . . . . . . . . . . . . . . . . . 4.8 6.5 6.6 8.5 10.3 11.9 13.3 14.4 3.3Total. . . . . . . . . . . . . . . . . . . . . . 70.0 81.4 81.6 82.4 86.3 90.9 94.5 97.9 0.8
OECD AsiaLiquids . . . . . . . . . . . . . . . . . . . . . 14.7 17.5 17.2 17.0 17.8 18.6 18.9 19.3 0.5Natural Gas . . . . . . . . . . . . . . . . . 3.1 5.8 6.1 6.5 7.4 8.0 8.3 8.6 1.4Coal . . . . . . . . . . . . . . . . . . . . . . . 5.2 9.3 9.4 9.5 9.7 9.8 10.1 10.6 0.5Nuclear. . . . . . . . . . . . . . . . . . . . . 2.5 4.3 4.3 4.5 5.0 5.6 6.0 6.4 1.7Other . . . . . . . . . . . . . . . . . . . . . . 1.6 1.6 1.7 2.1 2.7 2.8 2.9 3.0 2.4Total. . . . . . . . . . . . . . . . . . . . . . 27.0 38.4 38.7 39.6 42.6 44.7 46.3 47.9 0.9
Total OECDLiquids . . . . . . . . . . . . . . . . . . . . . 83.6 99.4 98.8 92.8 96.7 100.4 103.6 108.0 0.4Natural Gas . . . . . . . . . . . . . . . . . 37.3 53.6 53.9 57.1 61.6 66.2 71.0 73.4 1.3Coal . . . . . . . . . . . . . . . . . . . . . . . 43.5 46.9 46.9 47.4 48.3 48.9 50.3 54.3 0.6Nuclear. . . . . . . . . . . . . . . . . . . . . 17.3 23.2 23.3 24.0 24.7 25.9 26.5 28.2 0.8Other . . . . . . . . . . . . . . . . . . . . . . 16.0 18.3 18.8 22.8 26.7 30.1 33.1 35.7 2.7Total. . . . . . . . . . . . . . . . . . . . . . 197.7 241.3 241.7 244.1 258.2 271.5 284.6 299.6 0.9
Non-OECDNon-OECD Europe and EurasiaLiquids . . . . . . . . . . . . . . . . . . . . . 19.6 10.1 10.2 10.5 11.0 11.5 11.8 12.2 0.7Natural Gas . . . . . . . . . . . . . . . . . 27.5 25.8 25.8 28.2 31.1 33.3 34.8 36.3 1.4Coal . . . . . . . . . . . . . . . . . . . . . . . 15.1 8.9 8.7 9.3 9.6 9.6 9.6 10.1 0.6Nuclear. . . . . . . . . . . . . . . . . . . . . 2.5 2.9 2.9 3.0 3.6 4.5 5.2 5.5 2.6Other . . . . . . . . . . . . . . . . . . . . . . 2.8 3.1 3.0 3.2 3.4 3.5 3.7 3.8 0.9Total. . . . . . . . . . . . . . . . . . . . . . 67.3 50.6 50.7 54.2 58.7 62.5 65.3 67.8 1.2
Non-OECD AsiaLiquids . . . . . . . . . . . . . . . . . . . . . 14.0 31.6 33.1 36.8 43.4 52.3 60.3 68.3 3.1Natural Gas . . . . . . . . . . . . . . . . . 3.0 9.6 9.6 11.8 16.1 20.3 24.0 27.5 4.5Coal . . . . . . . . . . . . . . . . . . . . . . . 27.0 60.4 66.5 79.0 89.6 103.1 119.3 135.2 3.0Nuclear. . . . . . . . . . . . . . . . . . . . . 0.4 1.1 1.1 1.6 3.0 4.7 6.2 7.1 7.9Other . . . . . . . . . . . . . . . . . . . . . . 3.0 6.6 7.2 10.7 14.9 18.2 19.5 22.4 4.9Total. . . . . . . . . . . . . . . . . . . . . . 47.4 109.4 117.6 139.8 167.1 198.7 229.4 260.5 3.4
See notes at end of table.

Table B2. World Total Energy Consumption by Region and Fuel, High Economic Growth Case, 1990-2030(Continued)(Quadrillion Btu)
High Economic Growth Case Projections
Energy Information Administration / International Energy Outlook 2009 141
Region/Country
History Projections Average AnnualPercent Change,
2006-20301990 2005 2006 2010 2015 2020 2025 2030
Non-OECD (Continued)Middle EastLiquids . . . . . . . . . . . . . . . . . . . . . 7.2 11.9 12.4 14.4 15.6 16.9 18.7 21.1 2.2Natural Gas . . . . . . . . . . . . . . . . . 3.8 10.2 10.8 12.6 14.5 15.7 17.1 18.9 2.4Coal . . . . . . . . . . . . . . . . . . . . . . . 0.1 0.4 0.4 0.4 0.4 0.4 0.4 0.5 1.4Nuclear. . . . . . . . . . . . . . . . . . . . . 0.0 0.0 0.0 0.0 0.1 0.1 0.1 0.1 —Other . . . . . . . . . . . . . . . . . . . . . . 0.1 0.2 0.2 0.3 0.4 0.4 0.5 0.5 3.4Total. . . . . . . . . . . . . . . . . . . . . . 11.2 22.7 23.8 27.8 30.9 33.6 36.9 41.1 2.3
AfricaLiquids . . . . . . . . . . . . . . . . . . . . . 4.3 6.1 6.1 7.1 7.5 7.9 8.4 8.8 1.5Natural Gas . . . . . . . . . . . . . . . . . 1.5 3.2 3.2 3.7 4.8 5.8 6.7 7.4 3.6Coal . . . . . . . . . . . . . . . . . . . . . . . 3.0 4.2 4.2 4.3 4.5 4.7 5.1 5.7 1.3Nuclear. . . . . . . . . . . . . . . . . . . . . 0.1 0.1 0.1 0.1 0.2 0.2 0.2 0.2 3.3Other . . . . . . . . . . . . . . . . . . . . . . 0.6 0.9 0.9 1.0 1.3 1.4 1.5 1.5 2.1Total. . . . . . . . . . . . . . . . . . . . . . 9.5 14.5 14.5 16.3 18.1 20.0 21.9 23.6 2.1
Central and South AmericaLiquids . . . . . . . . . . . . . . . . . . . . . 7.8 11.3 11.7 13.5 13.9 14.6 15.7 17.2 1.6Natural Gas . . . . . . . . . . . . . . . . . 2.2 4.7 4.8 5.9 7.0 8.1 9.2 9.9 3.0Coal . . . . . . . . . . . . . . . . . . . . . . . 0.6 0.9 0.8 0.9 1.1 1.2 1.5 1.9 3.6Nuclear. . . . . . . . . . . . . . . . . . . . . 0.1 0.2 0.2 0.2 0.3 0.4 0.4 0.4 2.0Other . . . . . . . . . . . . . . . . . . . . . . 3.9 6.4 6.6 7.8 8.7 9.7 10.6 11.5 2.3Total. . . . . . . . . . . . . . . . . . . . . . 14.5 23.4 24.2 28.4 31.0 33.9 37.4 40.9 2.2
Total Non-OECDLiquids . . . . . . . . . . . . . . . . . . . . . 52.9 71.0 73.6 82.3 91.4 103.1 115.0 127.5 2.3Natural Gas . . . . . . . . . . . . . . . . . 38.0 53.5 54.2 62.1 73.5 83.3 92.0 99.8 2.6Coal . . . . . . . . . . . . . . . . . . . . . . . 45.7 74.8 80.6 93.8 105.2 119.1 135.9 153.5 2.7Nuclear. . . . . . . . . . . . . . . . . . . . . 3.1 4.3 4.4 5.0 7.2 9.9 12.2 13.3 4.7Other . . . . . . . . . . . . . . . . . . . . . . 10.3 17.2 18.0 23.1 28.7 33.2 35.8 39.8 3.4Total. . . . . . . . . . . . . . . . . . . . . . 149.9 220.7 230.8 266.4 305.9 348.7 390.9 433.8 2.7
Total WorldLiquids . . . . . . . . . . . . . . . . . . . . . 136.4 170.4 172.4 175.2 188.1 203.5 218.6 235.5 1.3Natural Gas . . . . . . . . . . . . . . . . . 75.3 107.1 108.1 119.2 135.1 149.6 163.0 173.2 2.0Coal . . . . . . . . . . . . . . . . . . . . . . . 89.2 121.7 127.5 141.2 153.5 168.0 186.3 207.8 2.1Nuclear. . . . . . . . . . . . . . . . . . . . . 20.4 27.5 27.8 29.0 31.9 35.7 38.7 41.5 1.7Other . . . . . . . . . . . . . . . . . . . . . . 26.3 35.5 36.8 45.9 55.4 63.3 68.9 75.4 3.0Total. . . . . . . . . . . . . . . . . . . . . . 347.7 462.1 472.4 510.5 564.1 620.2 675.5 733.4 1.8
Notes: Energy totals include net imports of coal coke and electricity generated from biomass in the United States. Totals may notequal sum of components due to independent rounding. The electricity portion of the national fuel consumption values consists ofgeneration for domestic use plus an adjustment for electricity trade based on a fuel’s share of total generation in the exporting coun-try.
Sources: History: Energy Information Administration (EIA), International Energy Annual 2006 (June-December 2008), web sitewww.eia.doe.gov/iea. Projections: EIA, Annual Energy Outlook 2009, DOE/EIA-0383(2009) (Washington, DC, March 2009),AEO2009 National Energy Modeling System, run HM2009.D120908A, web site www.eia.doe.gov/oiaf/aeo; and World Energy Pro-jections Plus (2009).

Table B3. World Gross Domestic Product (GDP) by Region Expressed in Purchasing Power Parity,High Economic Growth Case, 1990-2030(Billion 2005 Dollars)
Appendix B
142 Energy Information Administration / International Energy Outlook 2009
Region/Country
History Projections Average AnnualPercent Change,
2006-20301990 2005 2006 2010 2015 2020 2025 2030
OECDOECD North America . . . . . . . . . . . 9,651 14,885 15,331 16,478 19,810 22,927 26,767 31,492 3.0United Statesa. . . . . . . . . . . . . . . . . 8,040 12,422 12,768 13,693 16,446 18,907 21,992 25,858 3.0Canada . . . . . . . . . . . . . . . . . . . . . . 773 1,167 1,204 1,288 1,504 1,728 1,980 2,265 2.7Mexico. . . . . . . . . . . . . . . . . . . . . . . 838 1,296 1,359 1,497 1,860 2,292 2,795 3,369 3.9
OECD Europe . . . . . . . . . . . . . . . . . 9,703 13,756 14,224 15,165 17,427 19,948 22,705 25,728 2.5OECD Asia . . . . . . . . . . . . . . . . . . . . 4,080 5,509 5,667 6,105 7,011 7,757 8,499 9,309 2.1
Japan . . . . . . . . . . . . . . . . . . . . . . . 3,222 3,873 3,966 4,146 4,594 4,882 5,099 5,322 1.2South Korea . . . . . . . . . . . . . . . . . . 374 843 886 1,050 1,325 1,580 1,860 2,157 3.8Australia/New Zealand . . . . . . . . . . 485 794 815 908 1,092 1,295 1,540 1,830 3.4Total OECD . . . . . . . . . . . . . . . . . 23,434 34,150 35,221 37,748 44,247 50,632 57,971 66,530 2.7
Non-OECDNon-OECD Europe and Eurasia. . . 3,039 2,932 3,159 3,978 5,031 6,064 7,094 8,209 4.1Russia . . . . . . . . . . . . . . . . . . . . . . . 1,880 1,703 1,829 2,350 2,951 3,529 4,092 4,705 4.0Other . . . . . . . . . . . . . . . . . . . . . . . . 1,159 1,229 1,330 1,628 2,080 2,535 3,002 3,504 4.1
Non-OECD Asia. . . . . . . . . . . . . . . . 4,457 12,272 13,408 18,102 25,426 34,622 44,882 53,516 5.9China. . . . . . . . . . . . . . . . . . . . . . . . 1,265 5,389 6,014 8,766 12,668 17,859 23,459 26,501 6.4India . . . . . . . . . . . . . . . . . . . . . . . . 1,019 2,436 2,672 3,530 5,033 6,800 8,710 10,961 6.1Other Non-OECD Asia . . . . . . . . . . 2,173 4,448 4,723 5,807 7,725 9,963 12,713 16,053 5.2
Middle East . . . . . . . . . . . . . . . . . . . 1,072 1,919 2,053 2,508 3,134 3,836 4,666 5,672 4.3Africa . . . . . . . . . . . . . . . . . . . . . . . . 1,387 2,211 2,341 2,898 3,735 4,643 5,622 6,622 4.4Central and South America . . . . . . 2,270 3,555 3,757 4,538 5,601 6,834 8,265 9,945 4.1Brazil . . . . . . . . . . . . . . . . . . . . . . . . 1,045 1,534 1,591 1,913 2,374 2,917 3,572 4,360 4.3Other Central and South America. . 1,224 2,021 2,165 2,625 3,226 3,917 4,693 5,585 4.0Total Non-OECD . . . . . . . . . . . . . 12,225 22,888 24,717 32,024 42,926 55,999 70,530 83,963 5.2
Total World . . . . . . . . . . . . . . . . . . . . 35,659 57,038 59,939 69,772 87,173 106,632 128,500 150,493 3.9aIncludes the 50 States and the District of Columbia.Note: Totals may not equal sum of components due to independent rounding.Sources: History: IHS Global Insight, World Overview (Lexington, MA, various issues). Projections: Derived from IHS Global
Insight, World Overview, Fourth Quarter 2008 (Lexington, MA, January 2009); and Energy Information Administration, AnnualEnergy Outlook 2009, DOE/EIA-0383(2009) (Washington, DC, March 2009), Table B4.

Table B4. World Liquids Consumption by Region, High Economic Growth Case, 1990-2030(Million Barrels per Day)
High Economic Growth Case Projections
Energy Information Administration / International Energy Outlook 2009 143
Region/Country
History Projections Average AnnualPercent Change,
2006-20301990 2005 2006 2010 2015 2020 2025 2030
OECDOECD North America . . . . . . . . . . . 20.5 25.2 25.1 23.8 25.1 25.8 27.0 28.8 0.6United Statesa. . . . . . . . . . . . . . . . . 17.0 20.8 20.7 19.9 21.0 21.4 22.3 23.8 0.6Canada . . . . . . . . . . . . . . . . . . . . . . 1.7 2.3 2.3 2.3 2.3 2.4 2.6 2.7 0.7Mexico. . . . . . . . . . . . . . . . . . . . . . . 1.8 2.1 2.1 1.5 1.7 2.0 2.1 2.2 0.3
OECD Europe . . . . . . . . . . . . . . . . . 13.7 15.7 15.7 14.5 14.7 15.4 15.8 16.1 0.1OECD Asia . . . . . . . . . . . . . . . . . . . . 7.2 8.6 8.5 8.4 8.8 9.1 9.3 9.5 0.5Japan . . . . . . . . . . . . . . . . . . . . . . . 5.3 5.3 5.2 4.6 4.9 5.2 5.1 5.1 -0.1South Korea . . . . . . . . . . . . . . . . . . 1.0 2.2 2.2 2.8 2.8 2.8 2.9 3.0 1.3Australia/New Zealand . . . . . . . . . . 0.8 1.1 1.1 1.0 1.1 1.2 1.3 1.4 1.0Total OECD . . . . . . . . . . . . . . . . . 41.4 49.5 49.2 46.7 48.6 50.4 52.1 54.4 0.4
Non-OECDNon-OECD Europe and Eurasia. . . 9.4 4.9 5.0 5.1 5.3 5.6 5.8 5.9 0.7Russia . . . . . . . . . . . . . . . . . . . . . . . 5.4 2.8 2.8 2.7 2.9 3.0 3.0 2.9 0.2Other . . . . . . . . . . . . . . . . . . . . . . . . 3.9 2.1 2.1 2.4 2.5 2.6 2.8 3.0 1.4
Non-OECD Asia. . . . . . . . . . . . . . . . 6.6 15.3 16.0 17.8 21.0 25.4 29.3 33.1 3.1China. . . . . . . . . . . . . . . . . . . . . . . . 2.3 6.7 7.2 8.5 10.2 12.7 14.8 16.8 3.6India . . . . . . . . . . . . . . . . . . . . . . . . 1.2 2.5 2.7 2.4 3.2 4.1 4.6 5.1 2.8Other Non-OECD Asia . . . . . . . . . . 3.1 6.1 6.1 6.9 7.6 8.6 9.8 11.2 2.5
Middle East . . . . . . . . . . . . . . . . . . . 3.5 5.8 6.1 7.0 7.6 8.2 9.1 10.3 2.2Africa . . . . . . . . . . . . . . . . . . . . . . . . 2.1 3.0 3.0 3.5 3.6 3.8 4.1 4.3 1.5Central and South America . . . . . . 3.8 5.5 5.7 6.6 6.8 7.1 7.7 8.4 1.6Brazil . . . . . . . . . . . . . . . . . . . . . . . . 1.5 2.2 2.3 2.5 2.9 3.2 3.6 4.1 2.5Other Central and South America. . 2.3 3.3 3.4 4.0 3.9 3.9 4.1 4.3 0.9Total Non-OECD . . . . . . . . . . . . . 25.3 34.5 35.8 40.0 44.4 50.1 55.9 62.0 2.3
Total World . . . . . . . . . . . . . . . . . . . . 66.7 84.0 85.0 86.7 93.0 100.5 108.0 116.3 1.3aIncludes the 50 States and the District of Columbia.Note: Totals may not equal sum of components due to independent rounding.Sources: History: Energy Information Administration (EIA), International Energy Annual 2006 (June-December 2008), web site
www.eia.doe.gov/iea. Projections: EIA, Annual Energy Outlook 2009, DOE/EIA-0383(2009) (Washington, DC, March 2009),AEO2009 National Energy Modeling System, run HM2009.D120908A, web site www.eia.doe.gov/oiaf/aeo; and World Energy Pro-jections Plus (2009).

Table B5. World Natural Gas Consumption by Region, High Economic Growth Case, 1990-2030(Trillion Cubic Feet)
Appendix B
144 Energy Information Administration / International Energy Outlook 2009
Region/Country
History Projections Average AnnualPercent Change,
2006-20301990 2005 2006 2010 2015 2020 2025 2030
OECDOECD North America . . . . . . . . . . . 22.5 27.1 27.2 28.5 30.3 32.4 35.0 35.9 1.2United Statesa. . . . . . . . . . . . . . . . . 19.2 22.0 21.7 22.6 23.5 24.5 26.1 26.0 0.8Canada . . . . . . . . . . . . . . . . . . . . . . 2.4 3.4 3.3 3.5 4.0 4.5 4.9 5.3 2.0Mexico. . . . . . . . . . . . . . . . . . . . . . . 0.9 1.8 2.2 2.4 2.9 3.4 4.0 4.6 3.2
OECD Europe . . . . . . . . . . . . . . . . . 11.6 19.3 19.2 20.6 22.3 24.1 25.7 26.9 1.4OECD Asia . . . . . . . . . . . . . . . . . . . . 2.9 5.2 5.5 5.9 6.7 7.3 7.6 7.8 1.4Japan . . . . . . . . . . . . . . . . . . . . . . . 2.0 3.1 3.2 3.4 3.8 4.0 4.1 4.1 1.0South Korea . . . . . . . . . . . . . . . . . . 0.1 1.1 1.1 1.3 1.5 1.7 1.8 1.9 2.2Australia/New Zealand . . . . . . . . . . 0.8 1.1 1.2 1.3 1.4 1.6 1.6 1.7 1.7Total OECD . . . . . . . . . . . . . . . . . 37.0 51.7 51.9 55.0 59.3 63.7 68.3 70.6 1.3
Non-OECDNon-OECD Europe and Eurasia. . . 26.7 25.3 25.4 27.7 30.6 32.7 34.2 35.6 1.4Russia . . . . . . . . . . . . . . . . . . . . . . . 17.3 16.2 16.6 18.1 19.5 20.7 21.6 22.6 1.3Other . . . . . . . . . . . . . . . . . . . . . . . . 9.5 9.1 8.8 9.6 11.1 12.0 12.6 13.1 1.7
Non-OECD Asia. . . . . . . . . . . . . . . . 2.9 9.3 9.4 11.5 15.7 19.8 23.5 26.8 4.5China. . . . . . . . . . . . . . . . . . . . . . . . 0.5 1.7 2.0 2.6 3.9 5.1 6.3 7.3 5.6India . . . . . . . . . . . . . . . . . . . . . . . . 0.4 1.3 1.4 1.8 2.5 3.2 3.7 4.1 4.6Other Non-OECD Asia . . . . . . . . . . 2.0 6.4 6.0 7.1 9.3 11.5 13.5 15.4 4.0
Middle East . . . . . . . . . . . . . . . . . . . 3.6 9.8 10.3 12.0 13.8 15.0 16.4 18.0 2.4Africa . . . . . . . . . . . . . . . . . . . . . . . . 1.4 3.0 2.9 3.4 4.4 5.4 6.3 6.9 3.6Central and South America . . . . . . 2.0 4.4 4.5 5.5 6.6 7.6 8.7 9.3 3.0Brazil . . . . . . . . . . . . . . . . . . . . . . . . 0.1 0.7 0.7 1.0 1.3 1.6 2.1 2.3 5.1Other Central and South America. . 1.9 3.7 3.8 4.5 5.3 6.0 6.6 7.0 2.5Total Non-OECD . . . . . . . . . . . . . 36.5 51.8 52.5 60.2 71.1 80.6 89.0 96.6 2.6
Total World . . . . . . . . . . . . . . . . . . . . 73.5 103.4 104.4 115.2 130.5 144.4 157.3 167.2 2.0aIncludes the 50 States and the District of Columbia.Note: Totals may not equal sum of components due to independent rounding.Sources: History: Energy Information Administration (EIA), International Energy Annual 2006 (June-December 2008), web site
www.eia.doe.gov/iea. Projections: EIA, Annual Energy Outlook 2009, DOE/EIA-0383(2009) (Washington, DC, March 2009),AEO2009 National Energy Modeling System, run HM2009.D120908A, web site www.eia.doe.gov/oiaf/aeo; and World Energy Pro-jections Plus (2009).

Table B6. World Coal Consumption by Region, High Economic Growth Case, 1990-2030(Quadrillion Btu)
High Economic Growth Case Projections
Energy Information Administration / International Energy Outlook 2009 145
Region/Country
History Projections Average AnnualPercent Change,
2006-20301990 2005 2006 2010 2015 2020 2025 2030
OECDOECD North America . . . . . . . . . . . 20.6 24.7 24.3 24.8 25.7 26.5 27.6 30.8 1.0United Statesa. . . . . . . . . . . . . . . . . 19.2 22.8 22.5 22.9 23.8 24.4 25.2 28.2 1.0Canada . . . . . . . . . . . . . . . . . . . . . . 1.2 1.5 1.4 1.5 1.5 1.7 1.8 2.0 1.3Mexico. . . . . . . . . . . . . . . . . . . . . . . 0.2 0.4 0.4 0.4 0.4 0.5 0.5 0.6 1.9
OECD Europe . . . . . . . . . . . . . . . . . 17.7 12.9 13.2 13.1 12.9 12.7 12.6 12.9 -0.1OECD Asia . . . . . . . . . . . . . . . . . . . . 5.2 9.3 9.4 9.5 9.7 9.8 10.1 10.6 0.5
Japan . . . . . . . . . . . . . . . . . . . . . . . 2.7 4.6 4.6 4.5 4.5 4.4 4.3 4.3 -0.3South Korea . . . . . . . . . . . . . . . . . . 1.0 2.1 2.2 2.4 2.5 2.6 2.9 3.3 1.7Australia/New Zealand . . . . . . . . . . 1.5 2.6 2.6 2.6 2.7 2.7 2.9 3.1 0.7Total OECD . . . . . . . . . . . . . . . . . 43.5 46.9 46.9 47.4 48.3 48.9 50.3 54.3 0.6
Non-OECDNon-OECD Europe and Eurasia. . . 15.1 8.9 8.7 9.3 9.6 9.6 9.6 10.1 0.6Russia . . . . . . . . . . . . . . . . . . . . . . . 7.2 4.8 4.6 5.0 5.3 5.3 5.3 5.6 0.8Other . . . . . . . . . . . . . . . . . . . . . . . . 7.9 4.1 4.2 4.3 4.3 4.3 4.4 4.5 0.3
Non-OECD Asia. . . . . . . . . . . . . . . . 27.0 60.4 66.5 79.0 89.6 103.1 119.3 135.2 3.0China. . . . . . . . . . . . . . . . . . . . . . . . 20.3 46.9 52.0 63.1 72.0 83.5 96.8 108.3 3.1India . . . . . . . . . . . . . . . . . . . . . . . . 4.2 8.6 9.4 10.3 11.5 12.6 13.7 15.5 2.1Other Non-OECD Asia . . . . . . . . . . 2.6 4.9 5.1 5.5 6.2 7.0 8.7 11.5 3.5
Middle East . . . . . . . . . . . . . . . . . . . 0.1 0.4 0.4 0.4 0.4 0.4 0.4 0.5 1.4Africa . . . . . . . . . . . . . . . . . . . . . . . . 3.0 4.2 4.2 4.3 4.5 4.7 5.1 5.7 1.3Central and South America . . . . . . 0.6 0.9 0.8 0.9 1.1 1.2 1.5 1.9 3.6Brazil . . . . . . . . . . . . . . . . . . . . . . . . 0.3 0.4 0.4 0.5 0.7 0.8 1.0 1.2 4.3Other Central and South America. . 0.2 0.4 0.4 0.4 0.4 0.5 0.5 0.7 2.6Total Non-OECD . . . . . . . . . . . . . 45.7 74.8 80.6 93.8 105.2 119.1 135.9 153.5 2.7
Total World . . . . . . . . . . . . . . . . . . . . 89.2 121.7 127.5 141.2 153.5 168.0 186.3 207.8 2.1aIncludes the 50 States and the District of Columbia.Notes: Totals may not equal sum of components due to independent rounding.Sources: History: Energy Information Administration (EIA), International Energy Annual 2006 (June-December 2008), web site
www.eia.doe.gov/iea. Projections: EIA, Annual Energy Outlook 2009, DOE/EIA-0383(2009) (Washington, DC, March 2009),AEO2009 National Energy Modeling System, run HM2009.D120908A, web site www.eia.doe.gov/oiaf/aeo; and World Energy Pro-jections Plus (2009).

Table B7. World Nuclear Energy Consumption by Region, High Economic Growth Case, 1990-2030(Billion Kilowatthours)
Appendix B
146 Energy Information Administration / International Energy Outlook 2009
Region/Country
History Projections Average AnnualPercent Change,
2006-20301990 2005 2006 2010 2015 2020 2025 2030
OECDOECD North America . . . . . . . . . . . 649 880 891 930 955 1,019 1,056 1,168 1.1
United Statesa. . . . . . . . . . . . . . . . . 577 782 787 809 831 888 918 1,023 1.1Canada . . . . . . . . . . . . . . . . . . . . . . 69 87 93 110 113 120 128 135 1.6Mexico. . . . . . . . . . . . . . . . . . . . . . . 3 10 10 11 11 11 11 11 0.1
OECD Europe . . . . . . . . . . . . . . . . . 743 932 929 922 915 906 897 905 -0.1OECD Asia . . . . . . . . . . . . . . . . . . . . 242 429 430 441 494 547 585 626 1.6Japan . . . . . . . . . . . . . . . . . . . . . . . 192 290 288 299 319 337 360 383 1.2South Korea . . . . . . . . . . . . . . . . . . 50 139 141 142 175 210 225 243 2.3Australia/New Zealand . . . . . . . . . . 0 0 0 0 0 0 0 0 —Total OECD . . . . . . . . . . . . . . . . . 1,635 2,240 2,250 2,292 2,365 2,472 2,538 2,699 0.8
Non-OECDNon-OECD Europe and Eurasia. . . 219 264 269 283 342 424 494 520 2.8Russia . . . . . . . . . . . . . . . . . . . . . . . 115 140 144 155 197 251 308 328 3.5Other . . . . . . . . . . . . . . . . . . . . . . . . 104 124 124 128 145 173 187 192 1.8
Non-OECD Asia. . . . . . . . . . . . . . . . 38 106 111 151 290 456 601 679 7.8China. . . . . . . . . . . . . . . . . . . . . . . . 0 50 55 65 164 274 366 426 8.9India . . . . . . . . . . . . . . . . . . . . . . . . 6 16 16 37 66 104 134 149 9.9Other Non-OECD Asia . . . . . . . . . . 32 40 40 48 61 77 100 104 4.0
Middle East . . . . . . . . . . . . . . . . . . . 0 0 0 0 6 13 13 13 —Africa . . . . . . . . . . . . . . . . . . . . . . . . 8 12 10 14 15 15 21 21 3.2Central and South America . . . . . . 9 16 21 23 28 34 34 34 2.1Brazil . . . . . . . . . . . . . . . . . . . . . . . . 2 10 14 15 18 22 22 22 2.0Other Central and South America. . 7 6 7 8 10 12 12 12 2.2Total Non-OECD . . . . . . . . . . . . . 274 399 411 471 681 942 1,163 1,267 4.8
Total World . . . . . . . . . . . . . . . . . . . . 1,909 2,639 2,660 2,763 3,046 3,414 3,701 3,966 1.7aIncludes the 50 States and the District of Columbia.Note: Totals may not equal sum of components due to independent rounding.Sources: History: Energy Information Administration (EIA), International Energy Annual 2006 (June-December 2008), web site
www.eia.doe.gov/iea. Projections: EIA, Annual Energy Outlook 2009, DOE/EIA-0383(2009) (Washington, DC, March 2009),AEO2009 National Energy Modeling System, run HM2009.D120908A, web site www.eia.doe.gov/oiaf/aeo; and World Energy Pro-jections Plus (2009).

Table B8. World Consumption of Hydroelectricity and Other Renewable Energy by Region,High Economic Growth Case, 1990-2030(Quadrillion Btu)
High Economic Growth Case Projections
Energy Information Administration / International Energy Outlook 2009 147
Region/Country
History Projections Average AnnualPercent Change,
2006-20301990 2005 2006 2010 2015 2020 2025 2030
OECDOECD North America . . . . . . . . . . . 9.7 10.3 10.5 12.1 13.8 15.4 16.9 18.2 2.3
United Statesa. . . . . . . . . . . . . . . . . 6.2 6.1 6.5 7.7 8.7 10.0 11.1 12.1 2.7Canada . . . . . . . . . . . . . . . . . . . . . . 3.1 3.7 3.6 3.9 4.4 4.7 5.1 5.4 1.7Mexico. . . . . . . . . . . . . . . . . . . . . . . 0.3 0.4 0.5 0.5 0.6 0.7 0.7 0.7 1.9
OECD Europe . . . . . . . . . . . . . . . . . 4.8 6.5 6.6 8.5 10.3 11.9 13.3 14.4 3.3OECD Asia . . . . . . . . . . . . . . . . . . . . 1.6 1.6 1.7 2.1 2.7 2.8 2.9 3.0 2.4Japan . . . . . . . . . . . . . . . . . . . . . . . 1.1 1.0 1.1 1.3 1.4 1.5 1.5 1.5 1.2South Korea . . . . . . . . . . . . . . . . . . 0.0 0.0 0.0 0.1 0.1 0.1 0.1 0.1 5.3Australia/New Zealand . . . . . . . . . . 0.4 0.5 0.5 0.7 1.1 1.2 1.3 1.4 4.2Total OECD . . . . . . . . . . . . . . . . . 16.0 18.3 18.8 22.8 26.7 30.1 33.1 35.7 2.7
Non-OECDNon-OECD Europe and Eurasia. . . 2.8 3.1 3.0 3.2 3.4 3.5 3.7 3.8 0.9Russia . . . . . . . . . . . . . . . . . . . . . . . 1.8 1.8 1.8 1.9 2.0 2.2 2.3 2.4 1.3Other . . . . . . . . . . . . . . . . . . . . . . . . 1.0 1.3 1.3 1.3 1.4 1.4 1.4 1.4 0.3
Non-OECD Asia. . . . . . . . . . . . . . . . 3.0 6.6 7.2 10.7 14.9 18.2 19.5 22.4 4.9China. . . . . . . . . . . . . . . . . . . . . . . . 1.3 4.0 4.3 7.0 9.8 11.8 12.4 14.7 5.2India . . . . . . . . . . . . . . . . . . . . . . . . 0.7 1.1 1.2 1.6 2.1 2.6 3.0 3.2 4.2Other Non-OECD Asia . . . . . . . . . . 0.9 1.6 1.6 2.1 2.9 3.8 4.2 4.5 4.3
Middle East . . . . . . . . . . . . . . . . . . . 0.1 0.2 0.2 0.3 0.4 0.5 0.5 0.5 3.4Africa . . . . . . . . . . . . . . . . . . . . . . . . 0.6 0.9 0.9 1.0 1.3 1.4 1.5 1.5 2.1Central and South America . . . . . . 3.9 6.4 6.6 7.8 8.7 9.7 10.6 11.5 2.3
Brazil . . . . . . . . . . . . . . . . . . . . . . . . 2.2 3.5 3.6 4.5 5.2 5.9 6.6 7.3 3.0Other Central and South America. . 1.7 2.9 3.0 3.4 3.6 3.8 4.0 4.2 1.4Total Non-OECD . . . . . . . . . . . . . 10.3 17.2 18.0 23.1 28.7 33.2 35.8 39.8 3.4
Total World . . . . . . . . . . . . . . . . . . . . 26.3 35.5 36.8 45.9 55.4 63.3 68.9 75.4 3.0aIncludes the 50 States and the District of Columbia.Notes: Totals may not equal sum of components due to independent rounding. U.S. totals include net electricity imports, methanol,
and liquid hydrogen. Numbers for the United States in this table are based on the published AEO2009 reference case (March 2009).In the updated AEO2009 reference case (April 2009), which incorporates provisions from the American Recovery and ReinvestmentAct of 2009 (ARRA2009) that stimulate increased renewable generation, greater use of renewable fuels is projected. U.S. consump-tion of hydroelectricity and other renewable energy is projected to be 9.4 quadrillion Btu in 2015 in the updated AEO2009 referencecase—7 percent higher than in the earlier projections reported in this table.
Sources: History: Energy Information Administration (EIA), International Energy Annual 2006 (June-December 2008), web sitewww.eia.doe.gov/iea. Projections: EIA, Annual Energy Outlook 2009, DOE/EIA-0383(2009) (Washington, DC, March 2009),AEO2009 National Energy Modeling System, run HM2009.D120908A, web site www.eia.doe.gov/oiaf/aeo; and World Energy Pro-jections Plus (2009).

Table B9. World Carbon Dioxide Emissions by Region, High Economic Growth Case, 1990-2030(Million Metric Tons Carbon Dioxide)
Appendix B
148 Energy Information Administration / International Energy Outlook 2009
Region/Country
History Projections Average AnnualPercent Change,
2006-20301990 2005 2006 2010 2015 2020 2025 2030
OECDOECD North America . . . . . . . . . . . 5,762 7,007 6,948 6,826 7,139 7,412 7,765 8,316 0.8United Statesa. . . . . . . . . . . . . . . . . 4,989 5,975 5,907 5,831 6,052 6,210 6,451 6,886 0.6Canada . . . . . . . . . . . . . . . . . . . . . . 471 629 611 623 662 714 767 819 1.2Mexico. . . . . . . . . . . . . . . . . . . . . . . 302 403 431 372 424 489 547 611 1.5
OECD Europe . . . . . . . . . . . . . . . . . 4,149 4,424 4,429 4,349 4,460 4,633 4,767 4,902 0.4OECD Asia . . . . . . . . . . . . . . . . . . . . 1,595 2,200 2,216 2,228 2,337 2,428 2,500 2,579 0.6
Japan . . . . . . . . . . . . . . . . . . . . . . . 1,054 1,250 1,247 1,173 1,229 1,269 1,260 1,252 0.0South Korea . . . . . . . . . . . . . . . . . . 243 497 515 600 630 649 701 753 1.6Australia/New Zealand . . . . . . . . . . 298 454 455 455 478 510 538 574 1.0Total OECD . . . . . . . . . . . . . . . . . 11,506 13,632 13,594 13,403 13,936 14,473 15,031 15,797 0.6
Non-OECDNon-OECD Europe and Eurasia. . . 4,246 2,889 2,886 3,080 3,301 3,455 3,563 3,703 1.0Russia . . . . . . . . . . . . . . . . . . . . . . . 2,393 1,699 1,704 1,809 1,932 2,019 2,061 2,134 0.9Other . . . . . . . . . . . . . . . . . . . . . . . . 1,853 1,190 1,182 1,271 1,369 1,437 1,502 1,569 1.2
Non-OECD Asia. . . . . . . . . . . . . . . . 3,678 8,305 8,987 10,516 12,188 14,265 16,519 18,729 3.1China. . . . . . . . . . . . . . . . . . . . . . . . 2,293 5,429 6,018 7,262 8,399 9,887 11,501 12,904 3.2India . . . . . . . . . . . . . . . . . . . . . . . . 573 1,192 1,292 1,372 1,611 1,867 2,067 2,316 2.5Other Non-OECD Asia . . . . . . . . . . 811 1,684 1,678 1,882 2,178 2,511 2,950 3,509 3.1
Middle East . . . . . . . . . . . . . . . . . . . 704 1,393 1,456 1,690 1,872 2,027 2,230 2,489 2.3Africa . . . . . . . . . . . . . . . . . . . . . . . . 659 985 982 1,089 1,187 1,293 1,411 1,532 1.9Central and South America . . . . . . 695 1,093 1,123 1,315 1,412 1,527 1,688 1,857 2.1Brazil . . . . . . . . . . . . . . . . . . . . . . . . 235 366 374 439 506 583 676 778 3.1Other Central and South America. . 460 727 749 876 906 944 1,012 1,079 1.5Total Non-OECD . . . . . . . . . . . . . 9,982 14,664 15,434 17,691 19,960 22,567 25,411 28,311 2.6
Total World . . . . . . . . . . . . . . . . . . . . 21,488 28,296 29,028 31,094 33,896 37,041 40,442 44,108 1.8aIncludes the 50 States and the District of Columbia.Note: The U.S. numbers include carbon dioxide emissions attributable to renewable energy sources.Sources: History: Energy Information Administration (EIA), International Energy Annual 2006 (June-December 2008), web site
www.eia.doe.gov/iea. Projections: EIA, Annual Energy Outlook 2009, DOE/EIA-0383(2009) (Washington, DC, March 2009),AEO2009 National Energy Modeling System, run HM2009.D120908A, web site www.eia.doe.gov/oiaf/aeo; and World Energy Pro-jections Plus (2009).

Table B10. World Carbon Dioxide Emissions from Liquids Use by Region, High Economic Growth Case,1990-2030(Million Metric Tons Carbon Dioxide)
High Economic Growth Case Projections
Energy Information Administration / International Energy Outlook 2009 149
Region/Country
History Projections Average AnnualPercent Change,
2006-20301990 2005 2006 2010 2015 2020 2025 2030
OECDOECD North America . . . . . . . . . . . 2,637 3,188 3,159 2,914 3,038 3,130 3,232 3,429 0.3United Statesa. . . . . . . . . . . . . . . . . 2,178 2,620 2,596 2,420 2,515 2,563 2,630 2,792 0.3Canada . . . . . . . . . . . . . . . . . . . . . . 227 301 295 295 301 314 330 349 0.7Mexico. . . . . . . . . . . . . . . . . . . . . . . 233 267 268 198 222 253 271 288 0.3
OECD Europe . . . . . . . . . . . . . . . . . 1,884 2,134 2,135 1,978 2,009 2,106 2,154 2,201 0.1OECD Asia . . . . . . . . . . . . . . . . . . . . 945 1,028 1,014 990 1,039 1,088 1,108 1,128 0.4
Japan . . . . . . . . . . . . . . . . . . . . . . . 687 641 626 554 589 622 616 611 -0.1South Korea . . . . . . . . . . . . . . . . . . 144 239 237 299 302 300 314 326 1.3Australia/New Zealand . . . . . . . . . . 114 148 151 137 149 166 178 191 1.0Total OECD . . . . . . . . . . . . . . . . . 5,466 6,350 6,308 5,881 6,086 6,323 6,495 6,758 0.3
Non-OECDNon-OECD Europe and Eurasia. . . 1,368 686 692 713 745 783 806 828 0.7Russia . . . . . . . . . . . . . . . . . . . . . . . 782 383 389 374 393 414 410 405 0.2Other . . . . . . . . . . . . . . . . . . . . . . . . 586 303 303 339 352 369 396 423 1.4
Non-OECD Asia. . . . . . . . . . . . . . . . 960 2,077 2,170 2,414 2,847 3,421 3,948 4,468 3.1China. . . . . . . . . . . . . . . . . . . . . . . . 335 889 960 1,129 1,357 1,682 1,971 2,229 3.6India . . . . . . . . . . . . . . . . . . . . . . . . 160 314 332 305 397 511 575 643 2.8Other Non-OECD Asia . . . . . . . . . . 466 874 878 980 1,092 1,228 1,402 1,597 2.5
Middle East . . . . . . . . . . . . . . . . . . . 491 814 849 987 1,066 1,155 1,280 1,441 2.2Africa . . . . . . . . . . . . . . . . . . . . . . . . 302 423 424 495 518 546 580 609 1.5Central and South America . . . . . . 525 761 790 913 939 979 1,057 1,153 1.6Brazil . . . . . . . . . . . . . . . . . . . . . . . . 197 288 294 332 373 418 472 538 2.5Other Central and South America. . 328 473 496 581 566 561 585 615 0.9Total Non-OECD . . . . . . . . . . . . . 3,646 4,760 4,926 5,523 6,115 6,885 7,670 8,499 2.3
Total World . . . . . . . . . . . . . . . . . . . . 9,112 11,110 11,234 11,404 12,201 13,208 14,165 15,257 1.3aIncludes the 50 States and the District of Columbia.Sources: History: Energy Information Administration (EIA), International Energy Annual 2006 (June-December 2008), web site
www.eia.doe.gov/iea. Projections: EIA, Annual Energy Outlook 2009, DOE/EIA-0383(2009) (Washington, DC, March 2009),AEO2009 National Energy Modeling System, run HM2009.D120908A, web site www.eia.doe.gov/oiaf/aeo; and World Energy Pro-jections Plus (2009).

Table B11. World Carbon Dioxide Emissions from Natural Gas Use by Region, High Economic Growth Case,1990-2030(Million Metric Tons Carbon Dioxide)
Appendix B
150 Energy Information Administration / International Energy Outlook 2009
Region/Country
History Projections Average AnnualPercent Change,
2006-20301990 2005 2006 2010 2015 2020 2025 2030
OECDOECD North America . . . . . . . . . . . 1,208 1,468 1,465 1,547 1,648 1,759 1,906 1,955 1.2United Statesa. . . . . . . . . . . . . . . . . 1,026 1,183 1,159 1,222 1,267 1,321 1,411 1,404 0.8Canada . . . . . . . . . . . . . . . . . . . . . . 128 185 181 190 218 245 268 288 2.0Mexico. . . . . . . . . . . . . . . . . . . . . . . 54 100 125 135 163 193 227 263 3.2
OECD Europe . . . . . . . . . . . . . . . . . 593 1,053 1,047 1,122 1,216 1,316 1,405 1,470 1.4OECD Asia . . . . . . . . . . . . . . . . . . . . 165 306 323 347 392 424 442 455 1.4
Japan . . . . . . . . . . . . . . . . . . . . . . . 115 181 191 198 221 235 241 243 1.0South Korea . . . . . . . . . . . . . . . . . . 6 64 68 77 93 102 111 115 2.2Australia/New Zealand . . . . . . . . . . 44 61 64 71 78 87 91 97 1.7Total OECD . . . . . . . . . . . . . . . . . 1,966 2,827 2,835 3,015 3,256 3,500 3,753 3,880 1.3
Non-OECDNon-OECD Europe and Eurasia. . . 1,457 1,367 1,371 1,494 1,651 1,768 1,849 1,924 1.4Russia . . . . . . . . . . . . . . . . . . . . . . . 933 865 889 967 1,045 1,110 1,156 1,207 1.3Other . . . . . . . . . . . . . . . . . . . . . . . . 524 502 482 528 606 657 693 716 1.7
Non-OECD Asia. . . . . . . . . . . . . . . . 161 508 510 626 854 1,079 1,276 1,459 4.5China. . . . . . . . . . . . . . . . . . . . . . . . 30 92 111 147 217 284 348 407 5.6India . . . . . . . . . . . . . . . . . . . . . . . . 24 70 76 99 137 177 205 224 4.6Other Non-OECD Asia . . . . . . . . . . 106 347 324 379 500 618 723 828 4.0
Middle East . . . . . . . . . . . . . . . . . . . 200 543 571 668 770 835 910 1,000 2.4Africa . . . . . . . . . . . . . . . . . . . . . . . . 80 168 168 196 253 310 358 391 3.6Central and South America . . . . . . 117 250 255 313 371 430 491 524 3.0Brazil . . . . . . . . . . . . . . . . . . . . . . . . 6 36 38 55 70 91 113 126 5.1Other Central and South America. . 111 214 218 258 301 340 377 398 2.5Total Non-OECD . . . . . . . . . . . . . 2,015 2,837 2,876 3,297 3,900 4,421 4,882 5,298 2.6
Total World . . . . . . . . . . . . . . . . . . . . 3,981 5,664 5,712 6,312 7,156 7,921 8,635 9,178 2.0aIncludes the 50 States and the District of Columbia.Sources: History: Energy Information Administration (EIA), International Energy Annual 2006 (June-December 2008), web site
www.eia.doe.gov/iea. Projections: EIA, Annual Energy Outlook 2009, DOE/EIA-0383(2009) (Washington, DC, March 2009),AEO2009 National Energy Modeling System, run HM2009.D120908A, web site www.eia.doe.gov/oiaf/aeo; and World Energy Pro-jections Plus (2009).

Table B12. World Carbon Dioxide Emissions from Coal Use by Region, High Economic Growth Case,1990-2030(Million Metric Tons Carbon Dioxide)
High Economic Growth Case Projections
Energy Information Administration / International Energy Outlook 2009 151
Region/Country
History Projections Average AnnualPercent Change,
2006-20301990 2005 2006 2010 2015 2020 2025 2030
OECDOECD North America . . . . . . . . . . . 1,916 2,339 2,312 2,354 2,441 2,511 2,615 2,921 1.0United Statesa. . . . . . . . . . . . . . . . . 1,784 2,161 2,140 2,177 2,258 2,314 2,398 2,679 0.9Canada . . . . . . . . . . . . . . . . . . . . . . 116 142 134 138 143 155 169 183 1.3Mexico. . . . . . . . . . . . . . . . . . . . . . . 16 36 38 38 40 43 48 60 1.9
OECD Europe . . . . . . . . . . . . . . . . . 1,672 1,237 1,247 1,250 1,235 1,211 1,208 1,231 -0.1OECD Asia . . . . . . . . . . . . . . . . . . . . 485 866 879 891 906 916 949 995 0.5
Japan . . . . . . . . . . . . . . . . . . . . . . . 252 427 430 420 420 412 403 397 -0.3South Korea . . . . . . . . . . . . . . . . . . 93 194 209 223 235 247 276 311 1.7Australia/New Zealand . . . . . . . . . . 140 244 240 248 251 257 269 287 0.7Total OECD . . . . . . . . . . . . . . . . . 4,073 4,443 4,438 4,495 4,582 4,639 4,772 5,148 0.6
Non-OECDNon-OECD Europe and Eurasia. . . 1,421 836 823 873 905 904 909 952 0.6Russia . . . . . . . . . . . . . . . . . . . . . . . 678 451 427 468 493 494 495 522 0.8Other . . . . . . . . . . . . . . . . . . . . . . . . 743 385 396 405 412 410 414 430 0.3
Non-OECD Asia. . . . . . . . . . . . . . . . 2,557 5,720 6,307 7,476 8,487 9,765 11,295 12,802 3.0China. . . . . . . . . . . . . . . . . . . . . . . . 1,929 4,449 4,947 5,986 6,825 7,921 9,182 10,269 3.1India . . . . . . . . . . . . . . . . . . . . . . . . 389 808 883 967 1,076 1,180 1,288 1,449 2.1Other Non-OECD Asia . . . . . . . . . . 239 463 476 523 586 664 826 1,084 3.5
Middle East . . . . . . . . . . . . . . . . . . . 14 36 36 35 36 37 41 48 1.2Africa . . . . . . . . . . . . . . . . . . . . . . . . 277 394 389 398 416 437 473 531 1.3Central and South America . . . . . . 53 81 77 89 102 117 140 181 3.6Brazil . . . . . . . . . . . . . . . . . . . . . . . . 32 42 42 52 62 74 90 115 4.3Other Central and South America. . 21 40 36 38 40 43 50 66 2.6Total Non-OECD . . . . . . . . . . . . . 4,321 7,067 7,632 8,871 9,946 11,261 12,858 14,514 2.7
Total World . . . . . . . . . . . . . . . . . . . . 8,394 11,510 12,070 13,366 14,528 15,900 17,630 19,661 2.1aIncludes the 50 States and the District of Columbia.Sources: History: Energy Information Administration (EIA), International Energy Annual 2006 (June-December 2008), web site
www.eia.doe.gov/iea. Projections: EIA, Annual Energy Outlook 2009, DOE/EIA-0383(2009) (Washington, DC, March 2009),AEO2009 National Energy Modeling System, run HM2009.D120908A, web site www.eia.doe.gov/oiaf/aeo; and World Energy Pro-jections Plus (2009).


Appendix C
Low Economic Growth Case Projections:• World Energy Consumption• Gross Domestic Product• Carbon Dioxide Emissions


Table C1. World Total Energy Consumption by Region, Low Economic Growth Case, 1990-2030(Quadrillion Btu)
Low Economic Growth Case Projections
Energy Information Administration / International Energy Outlook 2009 155
Region/Country
History Projections Average AnnualPercent Change,
2006-20301990 2005 2006 2010 2015 2020 2025 2030
OECDOECD North America . . . . . . . . . . . 100.7 121.6 121.3 120.3 122.5 124.9 127.7 130.3 0.3United Statesa. . . . . . . . . . . . . . . . . 84.7 100.5 100.0 99.2 100.0 101.1 102.6 104.2 0.2Canada . . . . . . . . . . . . . . . . . . . . . . 11.0 14.2 14.0 14.6 15.3 15.9 16.5 17.0 0.8Mexico. . . . . . . . . . . . . . . . . . . . . . . 5.0 6.9 7.4 6.6 7.2 7.9 8.5 9.1 0.9
OECD Europe . . . . . . . . . . . . . . . . . 70.0 81.4 81.6 82.0 83.3 85.0 85.8 86.2 0.2OECD Asia . . . . . . . . . . . . . . . . . . . . 27.0 38.4 38.7 39.4 40.9 41.6 41.7 41.6 0.3Japan . . . . . . . . . . . . . . . . . . . . . . . 18.7 22.7 22.8 21.9 22.5 22.6 22.1 21.6 -0.2South Korea . . . . . . . . . . . . . . . . . . 3.8 9.2 9.4 11.0 11.4 11.5 11.9 12.2 1.1Australia/New Zealand . . . . . . . . . . 4.5 6.4 6.5 6.6 7.1 7.4 7.6 7.8 0.8Total OECD . . . . . . . . . . . . . . . . . 197.7 241.3 241.7 241.7 246.7 251.5 255.2 258.1 0.3
Non-OECDNon-OECD Europe and Eurasia. . . 67.3 50.6 50.7 53.8 56.5 58.3 59.0 59.3 0.7Russia . . . . . . . . . . . . . . . . . . . . . . . 39.4 30.1 30.4 32.1 33.7 34.9 35.3 35.5 0.7Other . . . . . . . . . . . . . . . . . . . . . . . . 28.0 20.6 20.3 21.7 22.8 23.4 23.7 23.8 0.7
Non-OECD Asia. . . . . . . . . . . . . . . . 47.4 109.4 117.6 138.6 159.4 182.3 202.2 220.6 2.7China. . . . . . . . . . . . . . . . . . . . . . . . 27.0 66.8 73.8 90.1 103.4 118.8 132.1 143.4 2.8India . . . . . . . . . . . . . . . . . . . . . . . . 7.9 16.3 17.7 19.0 22.4 25.8 27.8 29.9 2.2Other Non-OECD Asia . . . . . . . . . . 12.5 26.3 26.1 29.5 33.6 37.7 42.3 47.3 2.5
Middle East . . . . . . . . . . . . . . . . . . . 11.2 22.7 23.8 27.6 29.6 30.8 32.5 34.6 1.6Africa . . . . . . . . . . . . . . . . . . . . . . . . 9.5 14.5 14.5 16.2 17.3 18.4 19.4 20.2 1.4Central and South America . . . . . . 14.5 23.4 24.2 28.2 29.7 31.2 33.1 34.8 1.5Brazil . . . . . . . . . . . . . . . . . . . . . . . . 5.8 9.4 9.6 11.3 12.6 13.9 15.3 16.7 2.3Other Central and South America. . 8.8 14.0 14.6 16.9 17.1 17.2 17.8 18.2 0.9Total Non-OECD . . . . . . . . . . . . . 149.9 220.7 230.8 264.4 292.5 320.8 346.2 369.5 2.0
Total World . . . . . . . . . . . . . . . . . . . . 347.7 462.1 472.4 506.2 539.2 572.4 601.4 627.6 1.2aIncludes the 50 States and the District of Columbia.Notes: Energy totals include net imports of coal coke and electricity generated from biomass in the United States. Totals may not
equal sum of components due to independent rounding. The electricity portion of the national fuel consumption values consists ofgeneration for domestic use plus an adjustment for electricity trade based on a fuel’s share of total generation in the exporting coun-try.
Sources: History: Energy Information Administration (EIA), International Energy Annual 2006 (June-December 2008), web sitewww.eia.doe.gov/iea. Projections: EIA, Annual Energy Outlook 2009, DOE/EIA-0383(2009) (Washington, DC, March 2009),AEO2009 National Energy Modeling System, run LM2009.D120908A, web site www.eia.doe.gov/oiaf/aeo; and World Energy Pro-jections Plus (2009).

Table C2. World Total Energy Consumption by Region and Fuel, Low Economic Growth Case, 1990-2030(Quadrillion Btu)
Appendix C
156 Energy Information Administration / International Energy Outlook 2009
Region/Country
History Projections Average AnnualPercent Change,
2006-20301990 2005 2006 2010 2015 2020 2025 2030
OECDOECD North AmericaLiquids . . . . . . . . . . . . . . . . . . . . . 40.5 49.6 49.2 45.1 45.0 44.9 44.9 45.6 -0.3Natural Gas . . . . . . . . . . . . . . . . . 23.0 28.0 28.0 29.0 29.3 30.2 31.5 31.8 0.5Coal . . . . . . . . . . . . . . . . . . . . . . . 20.6 24.7 24.3 24.8 25.1 25.2 25.3 26.5 0.4Nuclear. . . . . . . . . . . . . . . . . . . . . 6.9 9.2 9.4 9.7 10.0 10.2 10.3 10.1 0.3Other . . . . . . . . . . . . . . . . . . . . . . 9.7 10.3 10.5 11.8 13.0 14.4 15.6 16.2 1.8Total. . . . . . . . . . . . . . . . . . . . . . 100.7 121.6 121.3 120.3 122.5 124.9 127.7 130.3 0.3
OECD EuropeLiquids . . . . . . . . . . . . . . . . . . . . . 28.4 32.3 32.4 30.0 29.4 29.7 29.4 29.0 -0.5Natural Gas . . . . . . . . . . . . . . . . . 11.2 19.8 19.7 20.8 21.3 21.8 22.0 22.1 0.5Coal . . . . . . . . . . . . . . . . . . . . . . . 17.7 12.9 13.2 13.0 12.6 12.1 11.7 11.4 -0.6Nuclear. . . . . . . . . . . . . . . . . . . . . 7.9 9.7 9.6 9.7 9.6 9.6 9.5 9.5 -0.1Other . . . . . . . . . . . . . . . . . . . . . . 4.8 6.5 6.6 8.5 10.3 11.8 13.2 14.2 3.2Total. . . . . . . . . . . . . . . . . . . . . . 70.0 81.4 81.6 82.0 83.3 85.0 85.8 86.2 0.2
OECD AsiaLiquids . . . . . . . . . . . . . . . . . . . . . 14.7 17.5 17.2 17.0 17.1 17.1 16.7 16.4 -0.2Natural Gas . . . . . . . . . . . . . . . . . 3.1 5.8 6.1 6.4 6.9 7.0 6.9 6.8 0.5Coal . . . . . . . . . . . . . . . . . . . . . . . 5.2 9.3 9.4 9.5 9.4 9.2 9.2 9.1 -0.1Nuclear. . . . . . . . . . . . . . . . . . . . . 2.5 4.3 4.3 4.5 5.0 5.6 5.9 6.4 1.6Other . . . . . . . . . . . . . . . . . . . . . . 1.6 1.6 1.7 2.1 2.6 2.8 2.9 3.0 2.4Total. . . . . . . . . . . . . . . . . . . . . . 27.0 38.4 38.7 39.4 40.9 41.6 41.7 41.6 0.3
Total OECDLiquids . . . . . . . . . . . . . . . . . . . . . 83.6 99.4 98.8 92.0 91.5 91.6 91.0 91.0 -0.3Natural Gas . . . . . . . . . . . . . . . . . 37.3 53.6 53.9 56.2 57.4 59.0 60.5 60.7 0.5Coal . . . . . . . . . . . . . . . . . . . . . . . 43.5 46.9 46.9 47.2 47.2 46.6 46.2 47.1 0.0Nuclear. . . . . . . . . . . . . . . . . . . . . 17.3 23.2 23.3 23.9 24.7 25.3 25.7 26.0 0.4Other . . . . . . . . . . . . . . . . . . . . . . 16.0 18.3 18.8 22.4 25.9 29.0 31.8 33.4 2.4Total. . . . . . . . . . . . . . . . . . . . . . 197.7 241.3 241.7 241.7 246.7 251.5 255.2 258.1 0.3
Non-OECDNon-OECD Europe and EurasiaLiquids . . . . . . . . . . . . . . . . . . . . . 19.6 10.1 10.2 10.5 10.5 10.6 10.5 10.4 0.1Natural Gas . . . . . . . . . . . . . . . . . 27.5 25.8 25.8 27.9 29.7 30.6 30.8 30.9 0.7Coal . . . . . . . . . . . . . . . . . . . . . . . 15.1 8.9 8.7 9.2 9.3 9.1 8.8 8.8 0.0Nuclear. . . . . . . . . . . . . . . . . . . . . 2.5 2.9 2.9 3.0 3.6 4.5 5.2 5.5 2.6Other . . . . . . . . . . . . . . . . . . . . . . 2.8 3.1 3.0 3.2 3.4 3.5 3.7 3.8 0.9Total. . . . . . . . . . . . . . . . . . . . . . 67.3 50.6 50.7 53.8 56.5 58.3 59.0 59.3 0.7
Non-OECD AsiaLiquids . . . . . . . . . . . . . . . . . . . . . 14.0 31.6 33.1 36.8 41.4 47.5 52.4 56.7 2.3Natural Gas . . . . . . . . . . . . . . . . . 3.0 9.6 9.6 11.6 15.1 18.1 20.6 22.9 3.7Coal . . . . . . . . . . . . . . . . . . . . . . . 27.0 60.4 66.5 78.0 85.6 93.8 103.5 111.6 2.2Nuclear. . . . . . . . . . . . . . . . . . . . . 0.4 1.1 1.1 1.6 3.0 4.7 6.2 7.0 7.9Other . . . . . . . . . . . . . . . . . . . . . . 3.0 6.6 7.2 10.7 14.3 18.2 19.5 22.4 4.9Total. . . . . . . . . . . . . . . . . . . . . . 47.4 109.4 117.6 138.6 159.4 182.3 202.2 220.6 2.7
See notes at end of table.

Table C2. World Total Energy Consumption by Region and Fuel, Low Economic Growth Case, 1990-2030(Continued)(Quadrillion Btu)
Low Economic Growth Case Projections
Energy Information Administration / International Energy Outlook 2009 157
Region/Country
History Projections Average AnnualPercent Change,
2006-20301990 2005 2006 2010 2015 2020 2025 2030
Non-OECD (Continued)Middle EastLiquids . . . . . . . . . . . . . . . . . . . . . 7.2 11.9 12.4 14.4 14.9 15.4 16.3 17.5 1.4Natural Gas . . . . . . . . . . . . . . . . . 3.8 10.2 10.8 12.5 13.8 14.4 15.1 16.0 1.7Coal . . . . . . . . . . . . . . . . . . . . . . . 0.1 0.4 0.4 0.4 0.4 0.4 0.4 0.5 0.9Nuclear. . . . . . . . . . . . . . . . . . . . . 0.0 0.0 0.0 0.0 0.1 0.1 0.1 0.1 —Other . . . . . . . . . . . . . . . . . . . . . . 0.1 0.2 0.2 0.3 0.4 0.4 0.5 0.5 3.4Total. . . . . . . . . . . . . . . . . . . . . . 11.2 22.7 23.8 27.6 29.6 30.8 32.5 34.6 1.6
AfricaLiquids . . . . . . . . . . . . . . . . . . . . . 4.3 6.1 6.1 7.1 7.2 7.2 7.4 7.4 0.8Natural Gas . . . . . . . . . . . . . . . . . 1.5 3.2 3.2 3.6 4.4 5.2 5.7 6.1 2.7Coal . . . . . . . . . . . . . . . . . . . . . . . 3.0 4.2 4.2 4.2 4.3 4.4 4.6 4.9 0.7Nuclear. . . . . . . . . . . . . . . . . . . . . 0.1 0.1 0.1 0.1 0.2 0.2 0.2 0.2 3.3Other . . . . . . . . . . . . . . . . . . . . . . 0.6 0.9 0.9 1.0 1.3 1.4 1.5 1.5 2.1Total. . . . . . . . . . . . . . . . . . . . . . 9.5 14.5 14.5 16.2 17.3 18.4 19.4 20.2 1.4
Central and South AmericaLiquids . . . . . . . . . . . . . . . . . . . . . 7.8 11.3 11.7 13.5 13.3 13.2 13.7 14.3 0.8Natural Gas . . . . . . . . . . . . . . . . . 2.2 4.7 4.8 5.8 6.3 6.8 7.3 7.4 1.8Coal . . . . . . . . . . . . . . . . . . . . . . . 0.6 0.9 0.8 0.9 1.0 1.1 1.2 1.3 2.0Nuclear. . . . . . . . . . . . . . . . . . . . . 0.1 0.2 0.2 0.2 0.3 0.4 0.4 0.4 2.0Other . . . . . . . . . . . . . . . . . . . . . . 3.9 6.4 6.6 7.8 8.7 9.7 10.6 11.5 2.3Total. . . . . . . . . . . . . . . . . . . . . . 14.5 23.4 24.2 28.2 29.7 31.2 33.1 34.8 1.5
Total Non-OECDLiquids . . . . . . . . . . . . . . . . . . . . . 52.9 71.0 73.6 82.3 87.3 93.9 100.3 106.3 1.5Natural Gas . . . . . . . . . . . . . . . . . 38.0 53.5 54.2 61.3 69.3 75.0 79.5 83.2 1.8Coal . . . . . . . . . . . . . . . . . . . . . . . 45.7 74.8 80.6 92.7 100.6 108.8 118.6 127.1 1.9Nuclear. . . . . . . . . . . . . . . . . . . . . 3.1 4.3 4.4 5.0 7.2 9.9 12.2 13.2 4.7Other . . . . . . . . . . . . . . . . . . . . . . 10.3 17.2 18.0 23.1 28.1 33.3 35.8 39.7 3.4Total. . . . . . . . . . . . . . . . . . . . . . 149.9 220.7 230.8 264.4 292.5 320.8 346.2 369.5 2.0
Total WorldLiquids . . . . . . . . . . . . . . . . . . . . . 136.4 170.4 172.4 174.3 178.8 185.6 191.3 197.3 0.6Natural Gas . . . . . . . . . . . . . . . . . 75.3 107.1 108.1 117.5 126.8 134.0 140.0 143.9 1.2Coal . . . . . . . . . . . . . . . . . . . . . . . 89.2 121.7 127.5 139.9 147.8 155.4 164.8 174.1 1.3Nuclear. . . . . . . . . . . . . . . . . . . . . 20.4 27.5 27.8 28.9 31.9 35.2 37.8 39.2 1.4Other . . . . . . . . . . . . . . . . . . . . . . 26.3 35.5 36.8 45.5 54.0 62.2 67.5 73.1 2.9Total. . . . . . . . . . . . . . . . . . . . . . 347.7 462.1 472.4 506.2 539.2 572.4 601.4 627.6 1.2
Notes: Energy totals include net imports of coal coke and electricity generated from biomass in the United States. Totals may notequal sum of components due to independent rounding. The electricity portion of the national fuel consumption values consists ofgeneration for domestic use plus an adjustment for electricity trade based on a fuel’s share of total generation in the exporting coun-try.
Sources: History: Energy Information Administration (EIA), International Energy Annual 2006 (June-December 2008), web sitewww.eia.doe.gov/iea. Projections: EIA, Annual Energy Outlook 2009, DOE/EIA-0383(2009) (Washington, DC, March 2009),AEO2009 National Energy Modeling System, run LM2009.D120908A, web site www.eia.doe.gov/oiaf/aeo; and World Energy Pro-jections Plus (2009).

Table C3. World Gross Domestic Product (GDP) by Region Expressed in Purchasing Power Parity,Low Economic Growth Case, 1990-2030(Billion 2005 Dollars)
Appendix C
158 Energy Information Administration / International Energy Outlook 2009
Region/Country
History Projections Average AnnualPercent Change,
2006-20301990 2005 2006 2010 2015 2020 2025 2030
OECDOECD North America . . . . . . . . . . . 9,651 14,885 15,331 15,677 17,752 19,774 21,830 24,164 1.9United Statesa. . . . . . . . . . . . . . . . . 8,040 12,422 12,768 12,946 14,610 16,196 17,782 19,614 1.8Canada . . . . . . . . . . . . . . . . . . . . . . 773 1,167 1,204 1,263 1,404 1,536 1,677 1,827 1.8Mexico. . . . . . . . . . . . . . . . . . . . . . . 838 1,296 1,359 1,468 1,738 2,041 2,372 2,724 2.9
OECD Europe . . . . . . . . . . . . . . . . . 9,703 13,756 14,224 14,866 16,268 17,734 19,220 20,738 1.6OECD Asia . . . . . . . . . . . . . . . . . . . . 4,080 5,509 5,667 5,985 6,546 6,895 7,191 7,499 1.2
Japan . . . . . . . . . . . . . . . . . . . . . . . 3,222 3,873 3,966 4,065 4,287 4,335 4,308 4,278 0.3South Korea . . . . . . . . . . . . . . . . . . 374 843 886 1,030 1,238 1,408 1,578 1,743 2.9Australia/New Zealand . . . . . . . . . . 485 794 815 890 1,020 1,152 1,306 1,478 2.5Total OECD . . . . . . . . . . . . . . . . . 23,434 34,150 35,221 36,528 40,566 44,402 48,241 52,401 1.7
Non-OECDNon-OECD Europe and Eurasia. . . 3,039 2,932 3,159 3,902 4,704 5,403 6,020 6,634 3.1Russia . . . . . . . . . . . . . . . . . . . . . . . 1,880 1,703 1,829 2,305 2,760 3,144 3,472 3,801 3.1Other . . . . . . . . . . . . . . . . . . . . . . . . 1,159 1,229 1,330 1,597 1,945 2,259 2,548 2,832 3.2
Non-OECD Asia. . . . . . . . . . . . . . . . 4,457 12,272 13,408 17,766 23,810 30,927 38,225 48,408 5.5China. . . . . . . . . . . . . . . . . . . . . . . . 1,265 5,389 6,014 8,606 11,869 15,966 19,999 26,501 6.4India . . . . . . . . . . . . . . . . . . . . . . . . 1,019 2,436 2,672 3,464 4,713 6,074 7,417 8,896 5.1Other Non-OECD Asia . . . . . . . . . . 2,173 4,448 4,723 5,696 7,227 8,886 10,809 13,011 4.3
Middle East . . . . . . . . . . . . . . . . . . . 1,072 1,919 2,053 2,460 2,930 3,418 3,961 4,587 3.4Africa . . . . . . . . . . . . . . . . . . . . . . . . 1,387 2,211 2,341 2,843 3,493 4,139 4,775 5,357 3.5Central and South America . . . . . . 2,270 3,555 3,757 4,451 5,235 6,087 7,014 8,041 3.2Brazil . . . . . . . . . . . . . . . . . . . . . . . . 1,045 1,534 1,591 1,877 2,220 2,598 3,032 3,526 3.4Other Central and South America. . 1,224 2,021 2,165 2,575 3,016 3,488 3,982 4,515 3.1Total Non-OECD . . . . . . . . . . . . . 12,225 22,888 24,717 31,423 40,172 49,972 59,995 73,027 4.6
Total World . . . . . . . . . . . . . . . . . . . . 35,659 57,038 59,939 67,951 80,738 94,375 108,236 125,428 3.1aIncludes the 50 States and the District of Columbia.Note: Totals may not equal sum of components due to independent rounding.Sources: History: IHS Global Insight, World Overview (Lexington, MA, various issues). Projections: Derived from IHS Global
Insight, World Overview, Fourth Quarter 2008 (Lexington, MA, January 2009); and Energy Information Administration, AnnualEnergy Outlook 2009, DOE/EIA-0383(2009) (Washington, DC, March 2009), Table B4.

Table C4. World Liquids Consumption by Region, Low Economic Growth Case, 1990-2030(Million Barrels per Day)
Low Economic Growth Case Projections
Energy Information Administration / International Energy Outlook 2009 159
Region/Country
History Projections Average AnnualPercent Change,
2006-20301990 2005 2006 2010 2015 2020 2025 2030
OECDOECD North America . . . . . . . . . . . 20.5 25.2 25.1 23.3 23.3 23.2 23.3 23.7 -0.2United Statesa. . . . . . . . . . . . . . . . . 17.0 20.8 20.7 19.5 19.4 19.2 19.2 19.5 -0.2Canada . . . . . . . . . . . . . . . . . . . . . . 1.7 2.3 2.3 2.3 2.2 2.2 2.3 2.3 0.0Mexico. . . . . . . . . . . . . . . . . . . . . . . 1.8 2.1 2.1 1.5 1.7 1.8 1.9 1.9 -0.4
OECD Europe . . . . . . . . . . . . . . . . . 13.7 15.7 15.7 14.5 14.2 14.4 14.2 14.0 -0.5OECD Asia . . . . . . . . . . . . . . . . . . . . 7.2 8.6 8.5 8.4 8.4 8.4 8.2 8.1 -0.2Japan . . . . . . . . . . . . . . . . . . . . . . . 5.3 5.3 5.2 4.6 4.7 4.8 4.6 4.4 -0.7South Korea . . . . . . . . . . . . . . . . . . 1.0 2.2 2.2 2.8 2.7 2.5 2.5 2.5 0.6Australia/New Zealand . . . . . . . . . . 0.8 1.1 1.1 1.0 1.0 1.1 1.1 1.2 0.2Total OECD . . . . . . . . . . . . . . . . . 41.4 49.5 49.2 46.2 45.9 46.0 45.8 45.8 -0.3
Non-OECDNon-OECD Europe and Eurasia. . . 9.4 4.9 5.0 5.1 5.1 5.2 5.1 5.1 0.1Russia . . . . . . . . . . . . . . . . . . . . . . . 5.4 2.8 2.8 2.7 2.8 2.8 2.7 2.6 -0.4Other . . . . . . . . . . . . . . . . . . . . . . . . 3.9 2.1 2.1 2.4 2.4 2.4 2.4 2.5 0.7
Non-OECD Asia. . . . . . . . . . . . . . . . 6.6 15.3 16.0 17.8 20.1 23.0 25.4 27.5 2.3China. . . . . . . . . . . . . . . . . . . . . . . . 2.3 6.7 7.2 8.5 9.8 11.5 12.9 13.9 2.8India . . . . . . . . . . . . . . . . . . . . . . . . 1.2 2.5 2.7 2.4 3.0 3.7 4.0 4.3 2.0Other Non-OECD Asia . . . . . . . . . . 3.1 6.1 6.1 6.9 7.3 7.8 8.5 9.2 1.7
Middle East . . . . . . . . . . . . . . . . . . . 3.5 5.8 6.1 7.0 7.3 7.5 8.0 8.5 1.4Africa . . . . . . . . . . . . . . . . . . . . . . . . 2.1 3.0 3.0 3.5 3.5 3.5 3.6 3.6 0.8Central and South America . . . . . . 3.8 5.5 5.7 6.6 6.5 6.4 6.7 7.0 0.8Brazil . . . . . . . . . . . . . . . . . . . . . . . . 1.5 2.2 2.3 2.5 2.7 2.9 3.1 3.4 1.7Other Central and South America. . 2.3 3.3 3.4 4.0 3.8 3.5 3.6 3.6 0.2Total Non-OECD . . . . . . . . . . . . . 25.3 34.5 35.8 40.0 42.4 45.6 48.7 51.6 1.5
Total World . . . . . . . . . . . . . . . . . . . . 66.7 84.0 85.0 86.2 88.3 91.6 94.5 97.4 0.6aIncludes the 50 States and the District of Columbia.Note: Totals may not equal sum of components due to independent rounding.Sources: History: Energy Information Administration (EIA), International Energy Annual 2006 (June-December 2008), web site
www.eia.doe.gov/iea. Projections: EIA, Annual Energy Outlook 2009, DOE/EIA-0383(2009) (Washington, DC, March 2009),AEO2009 National Energy Modeling System, run LM2009.D120908A, web site www.eia.doe.gov/oiaf/aeo; and World Energy Pro-jections Plus (2009).

Table C5. World Natural Gas Consumption by Region, Low Economic Growth Case, 1990-2030(Trillion Cubic Feet)
Appendix C
160 Energy Information Administration / International Energy Outlook 2009
Region/Country
History Projections Average AnnualPercent Change,
2006-20301990 2005 2006 2010 2015 2020 2025 2030
OECDOECD North America . . . . . . . . . . . 22.5 27.1 27.2 28.1 28.3 29.3 30.5 30.7 0.5United Statesa. . . . . . . . . . . . . . . . . 19.2 22.0 21.7 22.3 21.9 22.3 23.0 22.7 0.2Canada . . . . . . . . . . . . . . . . . . . . . . 2.4 3.4 3.3 3.4 3.8 4.0 4.1 4.3 1.1Mexico. . . . . . . . . . . . . . . . . . . . . . . 0.9 1.8 2.2 2.3 2.7 3.0 3.4 3.8 2.3
OECD Europe . . . . . . . . . . . . . . . . . 11.6 19.3 19.2 20.2 20.7 21.2 21.4 21.5 0.5OECD Asia . . . . . . . . . . . . . . . . . . . . 2.9 5.2 5.5 5.8 6.2 6.3 6.3 6.2 0.5Japan . . . . . . . . . . . . . . . . . . . . . . . 2.0 3.1 3.2 3.3 3.5 3.5 3.3 3.2 0.0South Korea . . . . . . . . . . . . . . . . . . 0.1 1.1 1.1 1.3 1.4 1.5 1.6 1.6 1.4Australia/New Zealand . . . . . . . . . . 0.8 1.1 1.2 1.3 1.3 1.4 1.4 1.4 0.8Total OECD . . . . . . . . . . . . . . . . . 37.0 51.7 51.9 54.1 55.3 56.8 58.2 58.4 0.5
Non-OECDNon-OECD Europe and Eurasia. . . 26.7 25.3 25.4 27.4 29.2 30.0 30.2 30.3 0.7Russia . . . . . . . . . . . . . . . . . . . . . . . 17.3 16.2 16.6 17.9 18.7 19.1 19.2 19.3 0.6Other . . . . . . . . . . . . . . . . . . . . . . . . 9.5 9.1 8.8 9.5 10.5 10.9 11.0 11.0 0.9
Non-OECD Asia. . . . . . . . . . . . . . . . 2.9 9.3 9.4 11.3 14.7 17.7 20.2 22.4 3.7China. . . . . . . . . . . . . . . . . . . . . . . . 0.5 1.7 2.0 2.6 3.7 4.6 5.5 6.2 4.9India . . . . . . . . . . . . . . . . . . . . . . . . 0.4 1.3 1.4 1.8 2.3 2.8 3.1 3.3 3.7Other Non-OECD Asia . . . . . . . . . . 2.0 6.4 6.0 7.0 8.7 10.3 11.6 12.9 3.2
Middle East . . . . . . . . . . . . . . . . . . . 3.6 9.8 10.3 11.9 13.2 13.7 14.4 15.2 1.7Africa . . . . . . . . . . . . . . . . . . . . . . . . 1.4 3.0 2.9 3.4 4.1 4.8 5.3 5.6 2.7Central and South America . . . . . . 2.0 4.4 4.5 5.4 5.9 6.4 6.8 6.9 1.8Brazil . . . . . . . . . . . . . . . . . . . . . . . . 0.1 0.7 0.7 1.0 1.1 1.2 1.3 1.4 2.9Other Central and South America. . 1.9 3.7 3.8 4.4 4.9 5.2 5.5 5.6 1.6Total Non-OECD . . . . . . . . . . . . . 36.5 51.8 52.5 59.4 67.1 72.6 76.9 80.5 1.8
Total World . . . . . . . . . . . . . . . . . . . . 73.5 103.4 104.4 113.5 122.4 129.4 135.1 139.0 1.2aIncludes the 50 States and the District of Columbia.Note: Totals may not equal sum of components due to independent rounding.Sources: History: Energy Information Administration (EIA), International Energy Annual 2006 (June-December 2008), web site
www.eia.doe.gov/iea. Projections: EIA, Annual Energy Outlook 2009, DOE/EIA-0383(2009) (Washington, DC, March 2009),AEO2009 National Energy Modeling System, run LM2009.D120908A, web site www.eia.doe.gov/oiaf/aeo; and World Energy Pro-jections Plus (2009).

Table C6. World Coal Consumption by Region, Low Economic Growth Case, 1990-2030(Quadrillion Btu)
Low Economic Growth Case Projections
Energy Information Administration / International Energy Outlook 2009 161
Region/Country
History Projections Average AnnualPercent Change,
2006-20301990 2005 2006 2010 2015 2020 2025 2030
OECDOECD North America . . . . . . . . . . . 20.6 24.7 24.3 24.8 25.1 25.2 25.3 26.5 0.4United Statesa. . . . . . . . . . . . . . . . . 19.2 22.8 22.5 22.9 23.2 23.4 23.5 24.6 0.4Canada . . . . . . . . . . . . . . . . . . . . . . 1.2 1.5 1.4 1.5 1.5 1.5 1.4 1.4 -0.1Mexico. . . . . . . . . . . . . . . . . . . . . . . 0.2 0.4 0.4 0.4 0.4 0.4 0.5 0.5 1.2
OECD Europe . . . . . . . . . . . . . . . . . 17.7 12.9 13.2 13.0 12.6 12.1 11.7 11.4 -0.6OECD Asia . . . . . . . . . . . . . . . . . . . . 5.2 9.3 9.4 9.5 9.4 9.2 9.2 9.1 -0.1Japan . . . . . . . . . . . . . . . . . . . . . . . 2.7 4.6 4.6 4.5 4.4 4.2 4.0 3.8 -0.8South Korea . . . . . . . . . . . . . . . . . . 1.0 2.1 2.2 2.3 2.4 2.4 2.5 2.6 0.7Australia/New Zealand . . . . . . . . . . 1.5 2.6 2.6 2.6 2.6 2.6 2.6 2.7 0.2Total OECD . . . . . . . . . . . . . . . . . 43.5 46.9 46.9 47.2 47.2 46.6 46.2 47.1 0.0
Non-OECDNon-OECD Europe and Eurasia. . . 15.1 8.9 8.7 9.2 9.3 9.1 8.8 8.8 0.0Russia . . . . . . . . . . . . . . . . . . . . . . . 7.2 4.8 4.6 5.0 5.1 5.0 4.9 4.9 0.3Other . . . . . . . . . . . . . . . . . . . . . . . . 7.9 4.1 4.2 4.2 4.2 4.1 3.9 3.9 -0.3
Non-OECD Asia. . . . . . . . . . . . . . . . 27.0 60.4 66.5 78.0 85.6 93.8 103.5 111.6 2.2China. . . . . . . . . . . . . . . . . . . . . . . . 20.3 46.9 52.0 62.3 68.6 75.7 83.8 89.2 2.3India . . . . . . . . . . . . . . . . . . . . . . . . 4.2 8.6 9.4 10.2 11.0 11.6 12.1 13.0 1.3Other Non-OECD Asia . . . . . . . . . . 2.6 4.9 5.1 5.5 5.9 6.5 7.6 9.4 2.6
Middle East . . . . . . . . . . . . . . . . . . . 0.1 0.4 0.4 0.4 0.4 0.4 0.4 0.5 0.9Africa . . . . . . . . . . . . . . . . . . . . . . . . 3.0 4.2 4.2 4.2 4.3 4.4 4.6 4.9 0.7Central and South America . . . . . . 0.6 0.9 0.8 0.9 1.0 1.1 1.2 1.3 2.0Brazil . . . . . . . . . . . . . . . . . . . . . . . . 0.3 0.4 0.4 0.5 0.6 0.7 0.8 0.9 2.9Other Central and South America. . 0.2 0.4 0.4 0.4 0.4 0.4 0.4 0.4 0.7Total Non-OECD . . . . . . . . . . . . . 45.7 74.8 80.6 92.7 100.6 108.8 118.6 127.1 1.9
Total World . . . . . . . . . . . . . . . . . . . . 89.2 121.7 127.5 139.9 147.8 155.4 164.8 174.1 1.3aIncludes the 50 States and the District of Columbia.Notes: Totals may not equal sum of components due to independent rounding.Sources: History: Energy Information Administration (EIA), International Energy Annual 2006 (June-December 2008), web site
www.eia.doe.gov/iea. Projections: EIA, Annual Energy Outlook 2009, DOE/EIA-0383(2009) (Washington, DC, March 2009),AEO2009 National Energy Modeling System, run LM2009.D120908A, web site www.eia.doe.gov/oiaf/aeo; and World Energy Pro-jections Plus (2009).

Table C7. World Nuclear Energy Consumption by Region, Low Economic Growth Case, 1990-2030(Billion Kilowatthours)
Appendix C
162 Energy Information Administration / International Energy Outlook 2009
Region/Country
History Projections Average AnnualPercent Change,
2006-20301990 2005 2006 2010 2015 2020 2025 2030
OECDOECD North America . . . . . . . . . . . 649 880 891 925 955 970 977 962 0.3United Statesa. . . . . . . . . . . . . . . . . 577 782 787 809 831 840 840 817 0.2Canada . . . . . . . . . . . . . . . . . . . . . . 69 87 93 105 113 119 127 134 1.5Mexico. . . . . . . . . . . . . . . . . . . . . . . 3 10 10 11 11 11 11 11 0.1
OECD Europe . . . . . . . . . . . . . . . . . 743 932 929 922 914 905 896 899 -0.1OECD Asia . . . . . . . . . . . . . . . . . . . . 242 429 430 440 493 545 581 622 1.6Japan . . . . . . . . . . . . . . . . . . . . . . . 192 290 288 299 318 335 357 379 1.1South Korea . . . . . . . . . . . . . . . . . . 50 139 141 142 175 210 225 243 2.3Australia/New Zealand . . . . . . . . . . 0 0 0 0 0 0 0 0 —Total OECD . . . . . . . . . . . . . . . . . 1,635 2,240 2,250 2,287 2,363 2,420 2,455 2,482 0.4
Non-OECDNon-OECD Europe and Eurasia. . . 219 264 269 283 342 424 493 518 2.8Russia . . . . . . . . . . . . . . . . . . . . . . . 115 140 144 155 197 250 307 327 3.5Other . . . . . . . . . . . . . . . . . . . . . . . . 104 124 124 128 145 173 186 191 1.8
Non-OECD Asia. . . . . . . . . . . . . . . . 38 106 111 151 290 455 599 677 7.8China. . . . . . . . . . . . . . . . . . . . . . . . 0 50 55 65 164 274 366 425 8.9India . . . . . . . . . . . . . . . . . . . . . . . . 6 16 16 37 66 104 134 149 9.9Other Non-OECD Asia . . . . . . . . . . 32 40 40 48 60 77 100 104 4.0
Middle East . . . . . . . . . . . . . . . . . . . 0 0 0 0 6 13 13 13 —Africa . . . . . . . . . . . . . . . . . . . . . . . . 8 12 10 14 15 15 21 21 3.2Central and South America . . . . . . 9 16 21 23 28 34 34 34 2.1Brazil . . . . . . . . . . . . . . . . . . . . . . . . 2 10 14 15 18 22 22 22 2.0Other Central and South America. . 7 6 7 8 10 12 12 12 2.2Total Non-OECD . . . . . . . . . . . . . 274 399 411 471 681 941 1,161 1,264 4.8
Total World . . . . . . . . . . . . . . . . . . . . 1,909 2,639 2,660 2,758 3,044 3,360 3,615 3,746 1.4aIncludes the 50 States and the District of Columbia.Note: Totals may not equal sum of components due to independent rounding.Sources: History: Energy Information Administration (EIA), International Energy Annual 2006 (June-December 2008), web site
www.eia.doe.gov/iea. Projections: EIA, Annual Energy Outlook 2009, DOE/EIA-0383(2009) (Washington, DC, March 2009),AEO2009 National Energy Modeling System, run LM2009.D120908A, web site www.eia.doe.gov/oiaf/aeo; and World Energy Pro-jections Plus (2009).

Table C8. World Consumption of Hydroelectricity and Other Renewable Energy by Region,Low Economic Growth Case, 1990-2030(Quadrillion Btu)
Low Economic Growth Case Projections
Energy Information Administration / International Energy Outlook 2009 163
Region/Country
History Projections Average AnnualPercent Change,
2006-20301990 2005 2006 2010 2015 2020 2025 2030
OECDOECD North America . . . . . . . . . . . 9.7 10.3 10.5 11.8 13.0 14.4 15.6 16.2 1.8
United Statesa. . . . . . . . . . . . . . . . . 6.2 6.1 6.5 7.3 8.2 9.1 9.9 10.3 2.0Canada . . . . . . . . . . . . . . . . . . . . . . 3.1 3.7 3.6 3.9 4.2 4.7 5.0 5.3 1.6Mexico. . . . . . . . . . . . . . . . . . . . . . . 0.3 0.4 0.5 0.5 0.6 0.7 0.7 0.7 1.8
OECD Europe . . . . . . . . . . . . . . . . . 4.8 6.5 6.6 8.5 10.3 11.8 13.2 14.2 3.2OECD Asia . . . . . . . . . . . . . . . . . . . . 1.6 1.6 1.7 2.1 2.6 2.8 2.9 3.0 2.4Japan . . . . . . . . . . . . . . . . . . . . . . . 1.1 1.0 1.1 1.3 1.4 1.5 1.5 1.5 1.1South Korea . . . . . . . . . . . . . . . . . . 0.0 0.0 0.0 0.1 0.1 0.1 0.1 0.1 5.3Australia/New Zealand . . . . . . . . . . 0.4 0.5 0.5 0.7 1.0 1.2 1.3 1.3 4.2Total OECD . . . . . . . . . . . . . . . . . 16.0 18.3 18.8 22.4 25.9 29.0 31.8 33.4 2.4
Non-OECDNon-OECD Europe and Eurasia. . . 2.8 3.1 3.0 3.2 3.4 3.5 3.7 3.8 0.9Russia . . . . . . . . . . . . . . . . . . . . . . . 1.8 1.8 1.8 1.9 2.0 2.2 2.3 2.4 1.3Other . . . . . . . . . . . . . . . . . . . . . . . . 1.0 1.3 1.3 1.3 1.4 1.4 1.4 1.4 0.3
Non-OECD Asia. . . . . . . . . . . . . . . . 3.0 6.6 7.2 10.7 14.3 18.2 19.5 22.4 4.9China. . . . . . . . . . . . . . . . . . . . . . . . 1.3 4.0 4.3 7.0 9.2 11.8 12.3 14.7 5.2India . . . . . . . . . . . . . . . . . . . . . . . . 0.7 1.1 1.2 1.6 2.1 2.6 3.0 3.2 4.2Other Non-OECD Asia . . . . . . . . . . 0.9 1.6 1.6 2.1 2.9 3.7 4.2 4.5 4.3
Middle East . . . . . . . . . . . . . . . . . . . 0.1 0.2 0.2 0.3 0.4 0.5 0.5 0.5 3.4Africa . . . . . . . . . . . . . . . . . . . . . . . . 0.6 0.9 0.9 1.0 1.3 1.4 1.5 1.5 2.1Central and South America . . . . . . 3.9 6.4 6.6 7.8 8.7 9.7 10.6 11.5 2.3
Brazil . . . . . . . . . . . . . . . . . . . . . . . . 2.2 3.5 3.6 4.5 5.2 5.9 6.6 7.3 3.0Other Central and South America. . 1.7 2.9 3.0 3.4 3.6 3.8 4.0 4.2 1.4Total Non-OECD . . . . . . . . . . . . . 10.3 17.2 18.0 23.1 28.1 33.3 35.8 39.7 3.4
Total World . . . . . . . . . . . . . . . . . . . . 26.3 35.5 36.8 45.5 54.0 62.2 67.5 73.1 2.9aIncludes the 50 States and the District of Columbia.Notes: Totals may not equal sum of components due to independent rounding. U.S. totals include net electricity imports, methanol,
and liquid hydrogen. Numbers for the United States in this table are based on the published AEO2009 reference case (March 2009).In the updated AEO2009 reference case (April 2009), which incorporates provisions from the American Recovery and ReinvestmentAct of 2009 (ARRA2009) that stimulate increased renewable generation, greater use of renewable fuels is projected. U.S. consump-tion of hydroelectricity and other renewable energy is projected to be 9.4 quadrillion Btu in 2015 in the updated AEO2009 referencecase—15 percent higher than in the earlier projections reported in this table.
Sources: History: Energy Information Administration (EIA), International Energy Annual 2006 (June-December 2008), web sitewww.eia.doe.gov/iea. Projections: EIA, Annual Energy Outlook 2009, DOE/EIA-0383(2009) (Washington, DC, March 2009),AEO2009 National Energy Modeling System, run LM2009.D120908A, web site www.eia.doe.gov/oiaf/aeo; and World Energy Pro-jections Plus (2009).

Table C9. World Carbon Dioxide Emissions by Region, Low Economic Growth Case, 1990-2030(Million Metric Tons Carbon Dioxide)
Appendix C
164 Energy Information Administration / International Energy Outlook 2009
Region/Country
History Projections Average AnnualPercent Change,
2006-20301990 2005 2006 2010 2015 2020 2025 2030
OECDOECD North America . . . . . . . . . . . 5,762 7,007 6,948 6,760 6,777 6,831 6,885 7,063 0.1United Statesa. . . . . . . . . . . . . . . . . 4,989 5,975 5,907 5,770 5,739 5,746 5,761 5,898 0.0Canada . . . . . . . . . . . . . . . . . . . . . . 471 629 611 621 634 641 649 657 0.3Mexico. . . . . . . . . . . . . . . . . . . . . . . 302 403 431 369 403 444 476 508 0.7
OECD Europe . . . . . . . . . . . . . . . . . 4,149 4,424 4,429 4,321 4,276 4,278 4,228 4,176 -0.2OECD Asia . . . . . . . . . . . . . . . . . . . . 1,595 2,200 2,216 2,214 2,240 2,231 2,203 2,174 -0.1
Japan . . . . . . . . . . . . . . . . . . . . . . . 1,054 1,250 1,247 1,166 1,180 1,172 1,122 1,071 -0.6South Korea . . . . . . . . . . . . . . . . . . 243 497 515 596 599 587 604 614 0.7Australia/New Zealand . . . . . . . . . . 298 454 455 452 461 472 478 489 0.3Total OECD . . . . . . . . . . . . . . . . . 11,506 13,632 13,594 13,296 13,292 13,341 13,317 13,413 -0.1
Non-OECDNon-OECD Europe and Eurasia. . . 4,246 2,889 2,886 3,057 3,167 3,199 3,181 3,173 0.4Russia . . . . . . . . . . . . . . . . . . . . . . . 2,393 1,699 1,704 1,796 1,858 1,878 1,854 1,844 0.3Other . . . . . . . . . . . . . . . . . . . . . . . . 1,853 1,190 1,182 1,261 1,310 1,321 1,327 1,329 0.5
Non-OECD Asia. . . . . . . . . . . . . . . . 3,678 8,305 8,987 10,412 11,616 12,944 14,321 15,488 2.3China. . . . . . . . . . . . . . . . . . . . . . . . 2,293 5,429 6,018 7,182 8,011 8,966 9,965 10,660 2.4India . . . . . . . . . . . . . . . . . . . . . . . . 573 1,192 1,292 1,359 1,535 1,703 1,804 1,932 1.7Other Non-OECD Asia . . . . . . . . . . 811 1,684 1,678 1,871 2,071 2,275 2,551 2,896 2.3
Middle East . . . . . . . . . . . . . . . . . . . 704 1,393 1,456 1,682 1,788 1,854 1,955 2,088 1.5Africa . . . . . . . . . . . . . . . . . . . . . . . . 659 985 982 1,083 1,136 1,187 1,245 1,297 1.2Central and South America . . . . . . 695 1,093 1,123 1,306 1,325 1,351 1,415 1,471 1.1Brazil . . . . . . . . . . . . . . . . . . . . . . . . 235 366 374 435 470 505 552 597 2.0Other Central and South America. . 460 727 749 871 856 846 863 874 0.6Total Non-OECD . . . . . . . . . . . . . 9,982 14,664 15,434 17,539 19,032 20,536 22,117 23,517 1.8
Total World . . . . . . . . . . . . . . . . . . . . 21,488 28,296 29,028 30,835 32,325 33,877 35,434 36,930 1.0aIncludes the 50 States and the District of Columbia.Note: The U.S. numbers include carbon dioxide emissions attributable to renewable energy sources.Sources: History: Energy Information Administration (EIA), International Energy Annual 2006 (June-December 2008), web site
www.eia.doe.gov/iea. Projections: EIA, Annual Energy Outlook 2009, DOE/EIA-0383(2009) (Washington, DC, March 2009),AEO2009 National Energy Modeling System, run LM2009.D120908A, web site www.eia.doe.gov/oiaf/aeo; and World Energy Pro-jections Plus (2009).

Table C10. World Carbon Dioxide Emissions from Liquids Use by Region, Low Economic Growth Case,1990-2030(Million Metric Tons Carbon Dioxide)
Low Economic Growth Case Projections
Energy Information Administration / International Energy Outlook 2009 165
Region/Country
History Projections Average AnnualPercent Change,
2006-20301990 2005 2006 2010 2015 2020 2025 2030
OECDOECD North America . . . . . . . . . . . 2,637 3,188 3,159 2,873 2,838 2,831 2,805 2,855 -0.4United Statesa. . . . . . . . . . . . . . . . . 2,178 2,620 2,596 2,380 2,337 2,312 2,276 2,318 -0.5Canada . . . . . . . . . . . . . . . . . . . . . . 227 301 295 295 288 287 290 294 0.0Mexico. . . . . . . . . . . . . . . . . . . . . . . 233 267 268 198 213 232 239 243 -0.4
OECD Europe . . . . . . . . . . . . . . . . . 1,884 2,134 2,135 1,978 1,939 1,960 1,940 1,915 -0.5OECD Asia . . . . . . . . . . . . . . . . . . . . 945 1,028 1,014 990 997 1,000 981 959 -0.2
Japan . . . . . . . . . . . . . . . . . . . . . . . 687 641 626 554 566 575 550 526 -0.7South Korea . . . . . . . . . . . . . . . . . . 144 239 237 299 289 275 276 275 0.6Australia/New Zealand . . . . . . . . . . 114 148 151 137 142 150 154 158 0.2Total OECD . . . . . . . . . . . . . . . . . 5,466 6,350 6,308 5,840 5,774 5,791 5,726 5,730 -0.4
Non-OECDNon-OECD Europe and Eurasia. . . 1,368 686 692 713 715 722 715 707 0.1Russia . . . . . . . . . . . . . . . . . . . . . . . 782 383 389 374 379 384 368 352 -0.4Other . . . . . . . . . . . . . . . . . . . . . . . . 586 303 303 339 336 338 347 356 0.7
Non-OECD Asia. . . . . . . . . . . . . . . . 960 2,077 2,170 2,414 2,715 3,106 3,428 3,709 2.3China. . . . . . . . . . . . . . . . . . . . . . . . 335 889 960 1,129 1,296 1,529 1,713 1,852 2.8India . . . . . . . . . . . . . . . . . . . . . . . . 160 314 332 305 380 466 502 537 2.0Other Non-OECD Asia . . . . . . . . . . 466 874 878 980 1,040 1,111 1,213 1,321 1.7
Middle East . . . . . . . . . . . . . . . . . . . 491 814 849 986 1,020 1,054 1,116 1,197 1.4Africa . . . . . . . . . . . . . . . . . . . . . . . . 302 423 424 495 496 499 510 515 0.8Central and South America . . . . . . 525 761 790 913 894 888 917 956 0.8Brazil . . . . . . . . . . . . . . . . . . . . . . . . 197 288 294 332 354 376 405 440 1.7Other Central and South America. . 328 473 496 581 540 511 511 515 0.2Total Non-OECD . . . . . . . . . . . . . 3,646 4,760 4,926 5,521 5,840 6,269 6,686 7,084 1.5
Total World . . . . . . . . . . . . . . . . . . . . 9,112 11,110 11,234 11,361 11,614 12,060 12,412 12,814 0.5aIncludes the 50 States and the District of Columbia.Sources: History: Energy Information Administration (EIA), International Energy Annual 2006 (June-December 2008), web site
www.eia.doe.gov/iea. Projections: EIA, Annual Energy Outlook 2009, DOE/EIA-0383(2009) (Washington, DC, March 2009),AEO2009 National Energy Modeling System, run LM2009.D120908A, web site www.eia.doe.gov/oiaf/aeo; and World Energy Pro-jections Plus (2009).

Table C11. World Carbon Dioxide Emissions from Natural Gas Use by Region, Low Economic Growth Case,1990-2030(Million Metric Tons Carbon Dioxide)
Appendix C
166 Energy Information Administration / International Energy Outlook 2009
Region/Country
History Projections Average AnnualPercent Change,
2006-20301990 2005 2006 2010 2015 2020 2025 2030
OECDOECD North America . . . . . . . . . . . 1,208 1,468 1,465 1,524 1,540 1,592 1,663 1,677 0.6United Statesa. . . . . . . . . . . . . . . . . 1,026 1,183 1,159 1,203 1,182 1,203 1,245 1,230 0.2Canada . . . . . . . . . . . . . . . . . . . . . . 128 185 181 188 207 218 226 233 1.1Mexico. . . . . . . . . . . . . . . . . . . . . . . 54 100 125 133 151 171 192 214 2.3
OECD Europe . . . . . . . . . . . . . . . . . 593 1,053 1,047 1,103 1,131 1,158 1,169 1,174 0.5OECD Asia . . . . . . . . . . . . . . . . . . . . 165 306 323 341 363 370 366 361 0.5
Japan . . . . . . . . . . . . . . . . . . . . . . . 115 181 191 195 204 204 197 188 0.0South Korea . . . . . . . . . . . . . . . . . . 6 64 68 76 86 90 93 94 1.4Australia/New Zealand . . . . . . . . . . 44 61 64 70 73 76 76 78 0.8Total OECD . . . . . . . . . . . . . . . . . 1,966 2,827 2,835 2,968 3,035 3,120 3,199 3,212 0.5
Non-OECDNon-OECD Europe and Eurasia. . . 1,457 1,367 1,371 1,479 1,577 1,622 1,633 1,639 0.7Russia . . . . . . . . . . . . . . . . . . . . . . . 933 865 889 957 1,000 1,023 1,027 1,035 0.6Other . . . . . . . . . . . . . . . . . . . . . . . . 524 502 482 522 577 599 606 603 0.9
Non-OECD Asia. . . . . . . . . . . . . . . . 161 508 510 616 799 960 1,095 1,217 3.7China. . . . . . . . . . . . . . . . . . . . . . . . 30 92 111 145 204 255 303 345 4.9India . . . . . . . . . . . . . . . . . . . . . . . . 24 70 76 97 125 152 169 179 3.7Other Non-OECD Asia . . . . . . . . . . 106 347 324 374 470 554 624 693 3.2
Middle East . . . . . . . . . . . . . . . . . . . 200 543 571 661 733 764 800 848 1.7Africa . . . . . . . . . . . . . . . . . . . . . . . . 80 168 168 192 234 274 303 322 2.7Central and South America . . . . . . 117 250 255 305 336 361 386 391 1.8Brazil . . . . . . . . . . . . . . . . . . . . . . . . 6 36 38 52 59 65 73 75 2.9Other Central and South America. . 111 214 218 253 278 296 312 317 1.6Total Non-OECD . . . . . . . . . . . . . 2,015 2,837 2,876 3,253 3,679 3,980 4,218 4,417 1.8
Total World . . . . . . . . . . . . . . . . . . . . 3,981 5,664 5,712 6,221 6,713 7,100 7,417 7,628 1.2aIncludes the 50 States and the District of Columbia.Sources: History: Energy Information Administration (EIA), International Energy Annual 2006 (June-December 2008), web site
www.eia.doe.gov/iea. Projections: EIA, Annual Energy Outlook 2009, DOE/EIA-0383(2009) (Washington, DC, March 2009),AEO2009 National Energy Modeling System, run LM2009.D120908A, web site www.eia.doe.gov/oiaf/aeo; and World Energy Pro-jections Plus (2009).

Table C12. World Carbon Dioxide Emissions from Coal Use by Region, Low Economic Growth Case,1990-2030(Million Metric Tons Carbon Dioxide)
Low Economic Growth Case Projections
Energy Information Administration / International Energy Outlook 2009 167
Region/Country
History Projections Average AnnualPercent Change,
2006-20301990 2005 2006 2010 2015 2020 2025 2030
OECDOECD North America . . . . . . . . . . . 1,916 2,339 2,312 2,352 2,387 2,397 2,405 2,519 0.4United Statesa. . . . . . . . . . . . . . . . . 1,784 2,161 2,140 2,176 2,209 2,220 2,228 2,339 0.4Canada . . . . . . . . . . . . . . . . . . . . . . 116 142 134 138 139 136 133 129 -0.1Mexico. . . . . . . . . . . . . . . . . . . . . . . 16 36 38 38 39 41 44 51 1.2
OECD Europe . . . . . . . . . . . . . . . . . 1,672 1,237 1,247 1,241 1,206 1,160 1,120 1,087 -0.6OECD Asia . . . . . . . . . . . . . . . . . . . . 485 866 879 884 879 861 856 854 -0.1
Japan . . . . . . . . . . . . . . . . . . . . . . . 252 427 430 418 409 393 375 356 -0.8South Korea . . . . . . . . . . . . . . . . . . 93 194 209 220 224 223 234 245 0.7Australia/New Zealand . . . . . . . . . . 140 244 240 246 246 245 248 253 0.2Total OECD . . . . . . . . . . . . . . . . . 4,073 4,443 4,438 4,477 4,472 4,418 4,381 4,460 0.0
Non-OECDNon-OECD Europe and Eurasia. . . 1,421 836 823 864 876 856 833 827 0.0Russia . . . . . . . . . . . . . . . . . . . . . . . 678 451 427 464 479 471 459 457 0.3Other . . . . . . . . . . . . . . . . . . . . . . . . 743 385 396 400 397 385 374 369 -0.3
Non-OECD Asia. . . . . . . . . . . . . . . . 2,557 5,720 6,307 7,382 8,102 8,878 9,797 10,562 2.2China. . . . . . . . . . . . . . . . . . . . . . . . 1,929 4,449 4,947 5,908 6,511 7,182 7,949 8,463 2.3India . . . . . . . . . . . . . . . . . . . . . . . . 389 808 883 957 1,030 1,086 1,133 1,216 1.3Other Non-OECD Asia . . . . . . . . . . 239 463 476 517 561 610 714 883 2.6
Middle East . . . . . . . . . . . . . . . . . . . 14 36 36 35 36 36 38 43 0.7Africa . . . . . . . . . . . . . . . . . . . . . . . . 277 394 389 395 405 414 431 460 0.7Central and South America . . . . . . 53 81 77 88 95 103 113 124 2.0Brazil . . . . . . . . . . . . . . . . . . . . . . . . 32 42 42 50 57 64 74 82 2.9Other Central and South America. . 21 40 36 37 38 38 40 42 0.7Total Non-OECD . . . . . . . . . . . . . 4,321 7,067 7,632 8,765 9,514 10,287 11,213 12,016 1.9
Total World . . . . . . . . . . . . . . . . . . . . 8,394 11,510 12,070 13,241 13,985 14,705 15,594 16,476 1.3aIncludes the 50 States and the District of Columbia.Sources: History: Energy Information Administration (EIA), International Energy Annual 2006 (June-December 2008), web site
www.eia.doe.gov/iea. Projections: EIA, Annual Energy Outlook 2009, DOE/EIA-0383(2009) (Washington, DC, March 2009),AEO2009 National Energy Modeling System, run LM2009.D120908A, web site www.eia.doe.gov/oiaf/aeo; and World Energy Pro-jections Plus (2009).


Appendix D
High Oil Price Case Projections:• World Energy Consumption• Gross Domestic Product• Carbon Dioxide Emissions


Table D1. World Total Primary Energy Consumption by Region, High Oil Price Case, 1990-2030(Quadrillion Btu)
High Oil Price Case Projections
Energy Information Administration / International Energy Outlook 2009 171
Region/Country
History Projections Average AnnualPercent Change,
2006-20301990 2005 2006 2010 2015 2020 2025 2030
OECDOECD North America . . . . . . . . . . . 100.7 121.6 121.3 120.8 124.3 128.2 133.2 139.0 0.6United Statesa. . . . . . . . . . . . . . . . . 84.7 100.5 100.0 99.6 101.9 104.0 107.5 111.8 0.5Canada . . . . . . . . . . . . . . . . . . . . . . 11.0 14.2 14.0 14.6 15.3 16.2 17.0 17.8 1.0Mexico. . . . . . . . . . . . . . . . . . . . . . . 5.0 6.9 7.4 6.6 7.2 8.0 8.7 9.4 1.0
OECD Europe . . . . . . . . . . . . . . . . . 70.0 81.4 81.6 82.2 82.0 84.3 86.2 88.0 0.3OECD Asia . . . . . . . . . . . . . . . . . . . . 27.0 38.4 38.7 39.5 40.3 41.4 42.0 42.7 0.4Japan . . . . . . . . . . . . . . . . . . . . . . . 18.7 22.7 22.8 21.9 22.1 22.4 22.2 22.0 -0.1South Korea . . . . . . . . . . . . . . . . . . 3.8 9.2 9.4 11.0 11.1 11.4 12.0 12.5 1.2Australia/New Zealand . . . . . . . . . . 4.5 6.4 6.5 6.7 7.1 7.5 7.8 8.1 0.9Total OECD . . . . . . . . . . . . . . . . . 197.7 241.3 241.7 242.5 246.6 253.9 261.5 269.6 0.5
Non-OECDNon-OECD Europe and Eurasia. . . 67.3 50.6 50.7 54.0 56.8 59.3 60.8 62.1 0.9Russia . . . . . . . . . . . . . . . . . . . . . . . 39.4 30.1 30.4 32.2 34.2 35.9 36.8 37.6 0.9Other . . . . . . . . . . . . . . . . . . . . . . . . 28.0 20.6 20.3 21.7 22.6 23.4 24.1 24.6 0.8
Non-OECD Asia. . . . . . . . . . . . . . . . 47.4 109.4 117.6 139.1 158.1 183.0 206.8 230.0 2.8China. . . . . . . . . . . . . . . . . . . . . . . . 27.0 66.8 73.8 90.4 102.8 119.6 135.5 150.2 3.0India . . . . . . . . . . . . . . . . . . . . . . . . 7.9 16.3 17.7 19.1 22.2 25.8 28.4 31.0 2.4Other Non-OECD Asia . . . . . . . . . . 12.5 26.3 26.1 29.6 33.1 37.6 42.9 48.9 2.6
Middle East . . . . . . . . . . . . . . . . . . . 11.2 22.7 23.8 27.7 30.5 32.5 34.7 37.4 1.9Africa . . . . . . . . . . . . . . . . . . . . . . . . 9.5 14.5 14.5 16.2 16.9 18.0 19.4 20.6 1.5Central and South America . . . . . . 14.5 23.4 24.2 28.3 29.3 31.2 33.6 36.0 1.7Brazil . . . . . . . . . . . . . . . . . . . . . . . . 5.8 9.4 9.6 11.4 12.6 14.1 15.8 17.5 2.5Other Central and South America. . 8.8 14.0 14.6 16.9 16.7 17.0 17.8 18.5 1.0Total Non-OECD . . . . . . . . . . . . . 149.9 220.7 230.8 265.3 291.6 324.0 355.4 386.2 2.2
Total World . . . . . . . . . . . . . . . . . . . . 347.7 462.1 472.4 507.8 538.1 577.9 616.8 655.8 1.4aIncludes the 50 States and the District of Columbia.Notes: Energy totals include net imports of coal coke and electricity generated from biomass in the United States. Totals may not
equal sum of components due to independent rounding. The electricity portion of the national fuel consumption values consists ofgeneration for domestic use plus an adjustment for electricity trade based on a fuel’s share of total generation in the exporting coun-try.
Sources: History: Energy Information Administration (EIA), International Energy Annual 2006 (June-December 2008), web sitewww.eia.doe.gov/iea. Projections: EIA, Annual Energy Outlook 2009, DOE/EIA-0383(2009) (Washington, DC, March 2009),AEO2009 National Energy Modeling System, run HP2009.D121108A, web site www.eia.doe.gov/oiaf/aeo; and World Energy Pro-jections Plus (2009).

Table D2. World Total Energy Consumption by Region and Fuel, High Oil Price Case, 1990-2030(Quadrillion Btu)
Appendix D
172 Energy Information Administration / International Energy Outlook 2009
Region/Country
History Projections Average AnnualPercent Change,
2006-20301990 2005 2006 2010 2015 2020 2025 2030
OECDOECD North AmericaLiquids . . . . . . . . . . . . . . . . . . . . . 40.5 49.6 49.2 45.2 44.8 43.9 44.5 46.0 -0.3Natural Gas . . . . . . . . . . . . . . . . . 23.0 28.0 28.0 29.2 30.4 32.4 35.0 35.7 1.0Coal . . . . . . . . . . . . . . . . . . . . . . . 20.6 24.7 24.3 24.8 25.4 25.9 26.7 28.9 0.7Nuclear. . . . . . . . . . . . . . . . . . . . . 6.9 9.2 9.4 9.8 10.1 10.5 10.7 11.2 0.7Other . . . . . . . . . . . . . . . . . . . . . . 9.7 10.3 10.5 11.9 13.6 15.4 16.4 17.3 2.1Total. . . . . . . . . . . . . . . . . . . . . . 100.7 121.6 121.3 120.8 124.3 128.2 133.2 139.0 0.6
OECD EuropeLiquids . . . . . . . . . . . . . . . . . . . . . 28.4 32.3 32.4 30.0 27.0 26.0 25.6 25.3 -1.0Natural Gas . . . . . . . . . . . . . . . . . 11.2 19.8 19.7 20.9 22.2 24.2 25.4 26.3 1.2Coal . . . . . . . . . . . . . . . . . . . . . . . 17.7 12.9 13.2 13.0 12.8 12.6 12.4 12.4 -0.3Nuclear. . . . . . . . . . . . . . . . . . . . . 7.9 9.7 9.6 9.7 9.7 9.6 9.5 9.5 0.0Other . . . . . . . . . . . . . . . . . . . . . . 4.8 6.5 6.6 8.5 10.3 12.0 13.3 14.4 3.3Total. . . . . . . . . . . . . . . . . . . . . . 70.0 81.4 81.6 82.2 82.0 84.3 86.2 88.0 0.3
OECD AsiaLiquids . . . . . . . . . . . . . . . . . . . . . 14.7 17.5 17.2 17.0 15.7 15.0 14.7 14.4 -0.7Natural Gas . . . . . . . . . . . . . . . . . 3.1 5.8 6.1 6.5 7.2 8.1 8.3 8.5 1.4Coal . . . . . . . . . . . . . . . . . . . . . . . 5.2 9.3 9.4 9.5 9.6 9.9 10.1 10.4 0.4Nuclear. . . . . . . . . . . . . . . . . . . . . 2.5 4.3 4.3 4.5 5.1 5.6 6.0 6.4 1.7Other . . . . . . . . . . . . . . . . . . . . . . 1.6 1.6 1.7 2.1 2.7 2.8 2.9 3.0 2.4Total. . . . . . . . . . . . . . . . . . . . . . 27.0 38.4 38.7 39.5 40.3 41.4 42.0 42.7 0.4
Total OECDLiquids . . . . . . . . . . . . . . . . . . . . . 83.6 99.4 98.8 92.2 87.5 84.9 84.8 85.7 -0.6Natural Gas . . . . . . . . . . . . . . . . . 37.3 53.6 53.9 56.6 59.9 64.7 68.7 70.5 1.1Coal . . . . . . . . . . . . . . . . . . . . . . . 43.5 46.9 46.9 47.3 47.8 48.4 49.1 51.6 0.4Nuclear. . . . . . . . . . . . . . . . . . . . . 17.3 23.2 23.3 24.0 24.8 25.8 26.2 27.1 0.6Other . . . . . . . . . . . . . . . . . . . . . . 16.0 18.3 18.8 22.5 26.6 30.1 32.6 34.7 2.6Total. . . . . . . . . . . . . . . . . . . . . . 197.7 241.3 241.7 242.5 246.6 253.9 261.5 269.6 0.5
Non-OECDNon-OECD Europe and EurasiaLiquids . . . . . . . . . . . . . . . . . . . . . 19.6 10.1 10.2 10.5 9.8 9.4 9.3 9.2 -0.4Natural Gas . . . . . . . . . . . . . . . . . 27.5 25.8 25.8 28.0 30.6 32.4 33.3 34.1 1.2Coal . . . . . . . . . . . . . . . . . . . . . . . 15.1 8.9 8.7 9.2 9.5 9.4 9.3 9.5 0.4Nuclear. . . . . . . . . . . . . . . . . . . . . 2.5 2.9 2.9 3.0 3.7 4.5 5.2 5.5 2.6Other . . . . . . . . . . . . . . . . . . . . . . 2.8 3.1 3.0 3.2 3.4 3.5 3.7 3.8 0.9Total. . . . . . . . . . . . . . . . . . . . . . 67.3 50.6 50.7 54.0 56.8 59.3 60.8 62.1 0.9
Non-OECD AsiaLiquids . . . . . . . . . . . . . . . . . . . . . 14.0 31.6 33.1 36.8 38.0 41.9 46.6 50.9 1.8Natural Gas . . . . . . . . . . . . . . . . . 3.0 9.6 9.6 11.7 15.7 19.9 23.3 26.5 4.3Coal . . . . . . . . . . . . . . . . . . . . . . . 27.0 60.4 66.5 78.3 86.8 98.2 111.1 123.2 2.6Nuclear. . . . . . . . . . . . . . . . . . . . . 0.4 1.1 1.1 1.6 3.0 4.7 6.3 7.1 7.9Other . . . . . . . . . . . . . . . . . . . . . . 3.0 6.6 7.2 10.7 14.5 18.2 19.5 22.4 4.9Total. . . . . . . . . . . . . . . . . . . . . . 47.4 109.4 117.6 139.1 158.1 183.0 206.8 230.0 2.8
See notes at end of table.

Table D2. World Total Energy Consumption by Region and Fuel, High Oil Price Case, 1990-2030 (Continued)(Quadrillion Btu)
High Oil Price Case Projections
Energy Information Administration / International Energy Outlook 2009 173
Region/Country
History Projections Average AnnualPercent Change,
2006-20301990 2005 2006 2010 2015 2020 2025 2030
Non-OECD (Continued)Middle EastLiquids . . . . . . . . . . . . . . . . . . . . . 7.2 11.9 12.4 14.4 14.8 15.0 15.6 16.6 1.2Natural Gas . . . . . . . . . . . . . . . . . 3.8 10.2 10.8 12.6 14.9 16.6 18.0 19.6 2.5Coal . . . . . . . . . . . . . . . . . . . . . . . 0.1 0.4 0.4 0.4 0.4 0.4 0.5 0.6 1.7Nuclear. . . . . . . . . . . . . . . . . . . . . 0.0 0.0 0.0 0.0 0.1 0.1 0.1 0.1 —Other . . . . . . . . . . . . . . . . . . . . . . 0.1 0.2 0.2 0.3 0.4 0.5 0.5 0.5 3.4Total. . . . . . . . . . . . . . . . . . . . . . 11.2 22.7 23.8 27.7 30.5 32.5 34.7 37.4 1.9
AfricaLiquids . . . . . . . . . . . . . . . . . . . . . 4.3 6.1 6.1 7.1 6.6 6.3 6.4 6.4 0.2Natural Gas . . . . . . . . . . . . . . . . . 1.5 3.2 3.2 3.6 4.5 5.6 6.4 6.9 3.3Coal . . . . . . . . . . . . . . . . . . . . . . . 3.0 4.2 4.2 4.2 4.4 4.6 4.9 5.4 1.1Nuclear. . . . . . . . . . . . . . . . . . . . . 0.1 0.1 0.1 0.1 0.2 0.2 0.2 0.2 3.3Other . . . . . . . . . . . . . . . . . . . . . . 0.6 0.9 0.9 1.0 1.3 1.4 1.5 1.5 2.1Total. . . . . . . . . . . . . . . . . . . . . . 9.5 14.5 14.5 16.2 16.9 18.0 19.4 20.6 1.5
Central and South AmericaLiquids . . . . . . . . . . . . . . . . . . . . . 7.8 11.3 11.7 13.5 12.4 11.9 12.3 12.9 0.4Natural Gas . . . . . . . . . . . . . . . . . 2.2 4.7 4.8 5.8 6.7 7.9 8.8 9.3 2.8Coal . . . . . . . . . . . . . . . . . . . . . . . 0.6 0.9 0.8 0.9 1.1 1.2 1.4 1.8 3.3Nuclear. . . . . . . . . . . . . . . . . . . . . 0.1 0.2 0.2 0.2 0.3 0.4 0.4 0.4 2.1Other . . . . . . . . . . . . . . . . . . . . . . 3.9 6.4 6.6 7.8 8.8 9.8 10.7 11.6 2.4Total. . . . . . . . . . . . . . . . . . . . . . 14.5 23.4 24.2 28.3 29.3 31.2 33.6 36.0 1.7
Total Non-OECDLiquids . . . . . . . . . . . . . . . . . . . . . 52.9 71.0 73.6 82.3 81.5 84.5 90.2 96.0 1.1Natural Gas . . . . . . . . . . . . . . . . . 38.0 53.5 54.2 61.7 72.3 82.4 89.8 96.5 2.4Coal . . . . . . . . . . . . . . . . . . . . . . . 45.7 74.8 80.6 93.1 102.1 113.8 127.2 140.5 2.3Nuclear. . . . . . . . . . . . . . . . . . . . . 3.1 4.3 4.4 5.0 7.2 9.9 12.2 13.3 4.7Other . . . . . . . . . . . . . . . . . . . . . . 10.3 17.2 18.0 23.2 28.4 33.4 35.9 39.8 3.4Total. . . . . . . . . . . . . . . . . . . . . . 149.9 220.7 230.8 265.3 291.6 324.0 355.4 386.2 2.2
Total WorldLiquids . . . . . . . . . . . . . . . . . . . . . 136.4 170.4 172.4 174.5 169.0 169.5 175.0 181.7 0.2Natural Gas . . . . . . . . . . . . . . . . . 75.3 107.1 108.1 118.3 132.2 147.0 158.5 167.0 1.8Coal . . . . . . . . . . . . . . . . . . . . . . . 89.2 121.7 127.5 140.4 149.9 162.2 176.4 192.2 1.7Nuclear. . . . . . . . . . . . . . . . . . . . . 20.4 27.5 27.8 29.0 32.0 35.7 38.4 40.4 1.6Other . . . . . . . . . . . . . . . . . . . . . . 26.3 35.5 36.8 45.7 55.0 63.5 68.5 74.5 3.0Total. . . . . . . . . . . . . . . . . . . . . . 347.7 462.1 472.4 507.8 538.1 577.9 616.8 655.8 1.4
Notes: Energy totals include net imports of coal coke and electricity generated from biomass in the United States. Totals may notequal sum of components due to independent rounding. The electricity portion of the national fuel consumption values consists ofgeneration for domestic use plus an adjustment for electricity trade based on a fuel’s share of total generation in the exporting coun-try.
Sources: History: Energy Information Administration (EIA), International Energy Annual 2006 (June-December 2008), web sitewww.eia.doe.gov/iea. Projections: EIA, Annual Energy Outlook 2009, DOE/EIA-0383(2009) (Washington, DC, March 2009),AEO2009 National Energy Modeling System, run HP2009.D121108A, web site www.eia.doe.gov/oiaf/aeo; and World Energy Pro-jections Plus (2009).

Table D3. World Gross Domestic Product (GDP) by Region Expressed in Purchasing Power Parity,High Oil Price Case, 1990-2030(Billion 2005 Dollars)
Appendix D
174 Energy Information Administration / International Energy Outlook 2009
Region/Country
History Projections Average AnnualPercent Change,
2006-20301990 2005 2006 2010 2015 2020 2025 2030
OECDOECD North America . . . . . . . . . . . 9,651 14,885 15,331 16,039 18,645 21,352 24,425 27,950 2.5United Statesa. . . . . . . . . . . . . . . . . 8,040 12,422 12,768 13,284 15,422 17,603 20,077 22,939 2.5Canada . . . . . . . . . . . . . . . . . . . . . . 773 1,167 1,204 1,275 1,453 1,629 1,822 2,035 2.2Mexico. . . . . . . . . . . . . . . . . . . . . . . 838 1,296 1,359 1,480 1,770 2,120 2,526 2,976 3.3
OECD Europe . . . . . . . . . . . . . . . . . 9,703 13,756 14,224 14,976 16,497 18,319 20,374 22,572 1.9OECD Asia . . . . . . . . . . . . . . . . . . . . 4,080 5,509 5,667 6,027 6,623 7,106 7,611 8,155 1.5
Japan . . . . . . . . . . . . . . . . . . . . . . . 3,222 3,873 3,966 4,092 4,320 4,444 4,535 4,629 0.6South Korea . . . . . . . . . . . . . . . . . . 374 843 886 1,037 1,247 1,441 1,658 1,881 3.2Australia/New Zealand . . . . . . . . . . 485 794 815 899 1,056 1,222 1,418 1,645 3.0Total OECD . . . . . . . . . . . . . . . . . 23,434 34,150 35,221 37,042 41,766 46,777 52,410 58,678 2.1
Non-OECDNon-OECD Europe and Eurasia. . . 3,039 2,932 3,159 3,940 4,869 5,729 6,540 7,384 3.6Russia . . . . . . . . . . . . . . . . . . . . . . . 1,880 1,703 1,829 2,332 2,899 3,398 3,842 4,305 3.6Other . . . . . . . . . . . . . . . . . . . . . . . . 1,159 1,229 1,330 1,608 1,970 2,331 2,697 3,078 3.6
Non-OECD Asia. . . . . . . . . . . . . . . . 4,457 12,272 13,408 17,885 24,074 31,807 40,320 50,280 5.7China. . . . . . . . . . . . . . . . . . . . . . . . 1,265 5,389 6,014 8,660 11,976 16,378 21,042 26,501 6.4India . . . . . . . . . . . . . . . . . . . . . . . . 1,019 2,436 2,672 3,485 4,742 6,208 7,778 9,579 5.5Other Non-OECD Asia . . . . . . . . . . 2,173 4,448 4,723 5,740 7,356 9,221 11,500 14,200 4.7
Middle East . . . . . . . . . . . . . . . . . . . 1,072 1,919 2,053 2,502 3,196 3,877 4,588 5,419 4.1Africa . . . . . . . . . . . . . . . . . . . . . . . . 1,387 2,211 2,341 2,862 3,528 4,252 5,033 5,799 3.9Central and South America . . . . . . 2,270 3,555 3,757 4,487 5,342 6,338 7,491 8,811 3.6Brazil . . . . . . . . . . . . . . . . . . . . . . . . 1,045 1,534 1,591 1,895 2,296 2,753 3,292 3,922 3.8Other Central and South America. . 1,224 2,021 2,165 2,592 3,046 3,585 4,200 4,889 3.5Total Non-OECD . . . . . . . . . . . . . 12,225 22,888 24,717 31,675 41,008 52,003 63,972 77,693 4.9
Total World . . . . . . . . . . . . . . . . . . . . 35,659 57,038 59,939 68,718 82,774 98,780 116,383 136,371 3.5aIncludes the 50 States and the District of Columbia.Note: Totals may not equal sum of components due to independent rounding.Sources: History: IHS Global Insight, World Overview (Lexington, MA, various issues). Projections: Derived from IHS Global
Insight, World Overview, Fourth Quarter 2008 (Lexington, MA, January 2009); and Energy Information Administration, AnnualEnergy Outlook 2009, DOE/EIA-0383(2009) (Washington, DC, March 2009), Table B4.

Table D4. World Liquids Consumption by Region, High Oil Price Case, 1990-2030(Million Barrels per Day)
High Oil Price Case Projections
Energy Information Administration / International Energy Outlook 2009 175
Region/Country
History Projections Average AnnualPercent Change,
2006-20301990 2005 2006 2010 2015 2020 2025 2030
OECDOECD North America . . . . . . . . . . . 20.5 25.2 25.1 23.4 23.3 22.9 23.3 24.0 -0.2United Statesa. . . . . . . . . . . . . . . . . 17.0 20.8 20.7 19.6 19.7 19.3 19.7 20.4 -0.1Canada . . . . . . . . . . . . . . . . . . . . . . 1.7 2.3 2.3 2.3 2.1 2.0 2.0 2.0 -0.5Mexico. . . . . . . . . . . . . . . . . . . . . . . 1.8 2.1 2.1 1.5 1.5 1.6 1.6 1.6 -1.0
OECD Europe . . . . . . . . . . . . . . . . . 13.7 15.7 15.7 14.5 13.1 12.6 12.4 12.2 -1.0OECD Asia . . . . . . . . . . . . . . . . . . . . 7.2 8.6 8.5 8.4 7.7 7.4 7.2 7.1 -0.7Japan . . . . . . . . . . . . . . . . . . . . . . . 5.3 5.3 5.2 4.6 4.3 4.2 4.0 3.8 -1.3South Korea . . . . . . . . . . . . . . . . . . 1.0 2.2 2.2 2.8 2.4 2.2 2.2 2.2 0.1Australia/New Zealand . . . . . . . . . . 0.8 1.1 1.1 1.0 1.0 1.0 1.0 1.1 -0.2Total OECD . . . . . . . . . . . . . . . . . 41.4 49.5 49.2 46.3 44.1 42.9 42.9 43.3 -0.5
Non-OECDNon-OECD Europe and Eurasia. . . 9.4 4.9 5.0 5.1 4.7 4.6 4.5 4.5 -0.4Russia . . . . . . . . . . . . . . . . . . . . . . . 5.4 2.8 2.8 2.7 2.6 2.5 2.4 2.3 -0.9Other . . . . . . . . . . . . . . . . . . . . . . . . 3.9 2.1 2.1 2.4 2.2 2.1 2.1 2.2 0.1
Non-OECD Asia. . . . . . . . . . . . . . . . 6.6 15.3 16.0 17.8 18.4 20.3 22.6 24.7 1.8China. . . . . . . . . . . . . . . . . . . . . . . . 2.3 6.7 7.2 8.5 8.9 10.1 11.5 12.6 2.3India . . . . . . . . . . . . . . . . . . . . . . . . 1.2 2.5 2.7 2.4 2.8 3.3 3.5 3.8 1.5Other Non-OECD Asia . . . . . . . . . . 3.1 6.1 6.1 6.9 6.7 6.9 7.6 8.3 1.3
Middle East . . . . . . . . . . . . . . . . . . . 3.5 5.8 6.1 7.0 7.2 7.3 7.6 8.1 1.2Africa . . . . . . . . . . . . . . . . . . . . . . . . 2.1 3.0 3.0 3.5 3.2 3.1 3.1 3.1 0.2Central and South America . . . . . . 3.8 5.5 5.7 6.6 6.1 5.8 6.0 6.3 0.4Brazil . . . . . . . . . . . . . . . . . . . . . . . . 1.5 2.2 2.3 2.5 2.6 2.7 2.9 3.2 1.4Other Central and South America. . 2.3 3.3 3.4 4.0 3.5 3.1 3.1 3.1 -0.4Total Non-OECD . . . . . . . . . . . . . 25.3 34.5 35.8 40.0 39.6 41.1 43.8 46.7 1.1
Total World . . . . . . . . . . . . . . . . . . . . 66.7 84.0 85.0 86.3 83.7 84.0 86.7 90.0 0.2aIncludes the 50 States and the District of Columbia.Note: Totals may not equal sum of components due to independent rounding.Sources: History: Energy Information Administration (EIA), International Energy Annual 2006 (June-December 2008), web site
www.eia.doe.gov/iea. Projections: EIA, Annual Energy Outlook 2009, DOE/EIA-0383(2009) (Washington, DC, March 2009),AEO2009 National Energy Modeling System, run HP2009.D121108A, web site www.eia.doe.gov/oiaf/aeo; and World Energy Pro-jections Plus (2009).

Table D5. World Natural Gas Consumption by Region, High Oil Price Case, 1990-2030(Trillion Cubic Feet)
Appendix D
176 Energy Information Administration / International Energy Outlook 2009
Region/Country
History Projections Average AnnualPercent Change,
2006-20301990 2005 2006 2010 2015 2020 2025 2030
OECDOECD North America . . . . . . . . . . . 22.5 27.1 27.2 28.3 29.5 31.5 34.2 35.3 1.1United Statesa. . . . . . . . . . . . . . . . . 19.2 22.0 21.7 22.5 22.8 23.7 25.5 25.7 0.7Canada . . . . . . . . . . . . . . . . . . . . . . 2.4 3.4 3.3 3.4 3.9 4.4 4.7 5.0 1.8Mexico. . . . . . . . . . . . . . . . . . . . . . . 0.9 1.8 2.2 2.4 2.8 3.4 4.0 4.5 3.0
OECD Europe . . . . . . . . . . . . . . . . . 11.6 19.3 19.2 20.4 21.6 23.5 24.7 25.6 1.2OECD Asia . . . . . . . . . . . . . . . . . . . . 2.9 5.2 5.5 5.9 6.6 7.3 7.5 7.7 1.4Japan . . . . . . . . . . . . . . . . . . . . . . . 2.0 3.1 3.2 3.3 3.7 4.1 4.2 4.2 1.1South Korea . . . . . . . . . . . . . . . . . . 0.1 1.1 1.1 1.3 1.5 1.7 1.8 1.9 2.1Australia/New Zealand . . . . . . . . . . 0.8 1.1 1.2 1.3 1.4 1.5 1.6 1.7 1.5Total OECD . . . . . . . . . . . . . . . . . 37.0 51.7 51.9 54.5 57.7 62.4 66.5 68.5 1.2
Non-OECDNon-OECD Europe and Eurasia. . . 26.7 25.3 25.4 27.5 30.0 31.8 32.7 33.5 1.2Russia . . . . . . . . . . . . . . . . . . . . . . . 17.3 16.2 16.6 18.0 19.4 20.5 20.9 21.5 1.1Other . . . . . . . . . . . . . . . . . . . . . . . . 9.5 9.1 8.8 9.6 10.7 11.4 11.8 12.1 1.3
Non-OECD Asia. . . . . . . . . . . . . . . . 2.9 9.3 9.4 11.4 15.3 19.5 22.8 25.8 4.3China. . . . . . . . . . . . . . . . . . . . . . . . 0.5 1.7 2.0 2.6 3.8 4.9 6.0 7.0 5.4India . . . . . . . . . . . . . . . . . . . . . . . . 0.4 1.3 1.4 1.8 2.4 3.1 3.5 3.8 4.3Other Non-OECD Asia . . . . . . . . . . 2.0 6.4 6.0 7.0 9.2 11.5 13.3 15.0 3.9
Middle East . . . . . . . . . . . . . . . . . . . 3.6 9.8 10.3 12.0 14.2 15.8 17.2 18.7 2.5Africa . . . . . . . . . . . . . . . . . . . . . . . . 1.4 3.0 2.9 3.4 4.2 5.2 5.9 6.4 3.3Central and South America . . . . . . 2.0 4.4 4.5 5.4 6.3 7.4 8.3 8.8 2.8Brazil . . . . . . . . . . . . . . . . . . . . . . . . 0.1 0.7 0.7 1.0 1.2 1.7 2.0 2.2 5.1Other Central and South America. . 1.9 3.7 3.8 4.5 5.0 5.7 6.3 6.6 2.3Total Non-OECD . . . . . . . . . . . . . 36.5 51.8 52.5 59.8 70.0 79.7 86.9 93.3 2.4
Total World . . . . . . . . . . . . . . . . . . . . 73.5 103.4 104.4 114.3 127.7 142.1 153.4 161.9 1.8aIncludes the 50 States and the District of Columbia.Note: Totals may not equal sum of components due to independent rounding.Sources: History: Energy Information Administration (EIA), International Energy Annual 2006 (June-December 2008), web site
www.eia.doe.gov/iea. Projections: EIA, Annual Energy Outlook 2009, DOE/EIA-0383(2009) (Washington, DC, March 2009),AEO2009 National Energy Modeling System, run HP2009.D121108A, web site www.eia.doe.gov/oiaf/aeo; and World Energy Pro-jections Plus (2009).

Table D6. World Coal Consumption by Region, High Oil Price Case, 1990-2030(Quadrillion Btu)
High Oil Price Case Projections
Energy Information Administration / International Energy Outlook 2009 177
Region/Country
History Projections Average AnnualPercent Change,
2006-20301990 2005 2006 2010 2015 2020 2025 2030
OECDOECD North America . . . . . . . . . . . 20.6 24.7 24.3 24.8 25.4 25.9 26.7 28.9 0.7United Statesa. . . . . . . . . . . . . . . . . 19.2 22.8 22.5 22.9 23.5 23.9 24.5 26.5 0.7Canada . . . . . . . . . . . . . . . . . . . . . . 1.2 1.5 1.4 1.5 1.5 1.6 1.7 1.8 0.9Mexico. . . . . . . . . . . . . . . . . . . . . . . 0.2 0.4 0.4 0.4 0.4 0.5 0.5 0.6 1.8
OECD Europe . . . . . . . . . . . . . . . . . 17.7 12.9 13.2 13.0 12.8 12.6 12.4 12.4 -0.3OECD Asia . . . . . . . . . . . . . . . . . . . . 5.2 9.3 9.4 9.5 9.6 9.9 10.1 10.4 0.4
Japan . . . . . . . . . . . . . . . . . . . . . . . 2.7 4.6 4.6 4.5 4.5 4.5 4.4 4.2 -0.4South Korea . . . . . . . . . . . . . . . . . . 1.0 2.1 2.2 2.4 2.5 2.7 2.9 3.2 1.5Australia/New Zealand . . . . . . . . . . 1.5 2.6 2.6 2.6 2.7 2.7 2.8 2.9 0.6Total OECD . . . . . . . . . . . . . . . . . 43.5 46.9 46.9 47.3 47.8 48.4 49.1 51.6 0.4
Non-OECDNon-OECD Europe and Eurasia. . . 15.1 8.9 8.7 9.2 9.5 9.4 9.3 9.5 0.4Russia . . . . . . . . . . . . . . . . . . . . . . . 7.2 4.8 4.6 5.0 5.2 5.2 5.2 5.3 0.6Other . . . . . . . . . . . . . . . . . . . . . . . . 7.9 4.1 4.2 4.2 4.2 4.2 4.1 4.2 0.1
Non-OECD Asia. . . . . . . . . . . . . . . . 27.0 60.4 66.5 78.3 86.8 98.2 111.1 123.2 2.6China. . . . . . . . . . . . . . . . . . . . . . . . 20.3 46.9 52.0 62.6 69.6 79.0 89.6 98.0 2.7India . . . . . . . . . . . . . . . . . . . . . . . . 4.2 8.6 9.4 10.3 11.2 12.2 13.1 14.4 1.8Other Non-OECD Asia . . . . . . . . . . 2.6 4.9 5.1 5.5 6.1 6.9 8.4 10.7 3.2
Middle East . . . . . . . . . . . . . . . . . . . 0.1 0.4 0.4 0.4 0.4 0.4 0.5 0.6 1.7Africa . . . . . . . . . . . . . . . . . . . . . . . . 3.0 4.2 4.2 4.2 4.4 4.6 4.9 5.4 1.1Central and South America . . . . . . 0.6 0.9 0.8 0.9 1.1 1.2 1.4 1.8 3.3Brazil . . . . . . . . . . . . . . . . . . . . . . . . 0.3 0.4 0.4 0.5 0.6 0.8 0.9 1.1 4.0Other Central and South America. . 0.2 0.4 0.4 0.4 0.4 0.4 0.5 0.7 2.4Total Non-OECD . . . . . . . . . . . . . 45.7 74.8 80.6 93.1 102.1 113.8 127.2 140.5 2.3
Total World . . . . . . . . . . . . . . . . . . . . 89.2 121.7 127.5 140.4 149.9 162.2 176.4 192.2 1.7aIncludes the 50 States and the District of Columbia.Notes: Totals may not equal sum of components due to independent rounding.Sources: History: Energy Information Administration (EIA), International Energy Annual 2006 (June-December 2008), web site
www.eia.doe.gov/iea. Projections: EIA, Annual Energy Outlook 2009, DOE/EIA-0383(2009) (Washington, DC, March 2009),AEO2009 National Energy Modeling System, run HP2009.D121108A, web site www.eia.doe.gov/oiaf/aeo; and World Energy Pro-jections Plus (2009).

Table D7. World Nuclear Energy Consumption by Region, High Oil Price Case, 1990-2030(Billion Kilowatthours)
Appendix D
178 Energy Information Administration / International Energy Outlook 2009
Region/Country
History Projections Average AnnualPercent Change,
2006-20301990 2005 2006 2010 2015 2020 2025 2030
OECDOECD North America . . . . . . . . . . . 649 880 891 928 956 1,004 1,021 1,063 0.7
United Statesa. . . . . . . . . . . . . . . . . 577 782 787 809 831 872 882 917 0.6Canada . . . . . . . . . . . . . . . . . . . . . . 69 87 93 108 114 121 128 135 1.6Mexico. . . . . . . . . . . . . . . . . . . . . . . 3 10 10 11 11 11 11 11 0.1
OECD Europe . . . . . . . . . . . . . . . . . 743 932 929 922 919 909 900 905 -0.1OECD Asia . . . . . . . . . . . . . . . . . . . . 242 429 430 441 496 549 587 627 1.6Japan . . . . . . . . . . . . . . . . . . . . . . . 192 290 288 299 319 338 360 384 1.2South Korea . . . . . . . . . . . . . . . . . . 50 139 141 142 176 211 226 244 2.3Australia/New Zealand . . . . . . . . . . 0 0 0 0 0 0 0 0 —Total OECD . . . . . . . . . . . . . . . . . 1,635 2,240 2,250 2,291 2,370 2,462 2,508 2,596 0.6
Non-OECDNon-OECD Europe and Eurasia. . . 219 264 269 284 343 426 496 520 2.8Russia . . . . . . . . . . . . . . . . . . . . . . . 115 140 144 155 198 252 308 328 3.5Other . . . . . . . . . . . . . . . . . . . . . . . . 104 124 124 128 146 174 187 192 1.8
Non-OECD Asia. . . . . . . . . . . . . . . . 38 106 111 151 291 457 602 679 7.8China. . . . . . . . . . . . . . . . . . . . . . . . 0 50 55 65 164 275 367 426 8.9India . . . . . . . . . . . . . . . . . . . . . . . . 6 16 16 37 66 105 135 149 9.9Other Non-OECD Asia . . . . . . . . . . 32 40 40 48 61 78 100 104 4.0
Middle East . . . . . . . . . . . . . . . . . . . 0 0 0 0 6 13 13 13 —Africa . . . . . . . . . . . . . . . . . . . . . . . . 8 12 10 14 15 16 22 22 3.2Central and South America . . . . . . 9 16 21 23 29 34 35 35 2.1Brazil . . . . . . . . . . . . . . . . . . . . . . . . 2 10 14 15 18 22 22 22 2.0Other Central and South America. . 7 6 7 8 10 12 12 12 2.3Total Non-OECD . . . . . . . . . . . . . 274 399 411 471 685 946 1,166 1,269 4.8
Total World . . . . . . . . . . . . . . . . . . . . 1,909 2,639 2,660 2,762 3,055 3,409 3,674 3,864 1.6aIncludes the 50 States and the District of Columbia.Note: Totals may not equal sum of components due to independent rounding.Sources: History: Energy Information Administration (EIA), International Energy Annual 2006 (June-December 2008), web site
www.eia.doe.gov/iea. Projections: EIA, Annual Energy Outlook 2009, DOE/EIA-0383(2009) (Washington, DC, March 2009),AEO2009 National Energy Modeling System, run HP2009.D121108A, web site www.eia.doe.gov/oiaf/aeo; and World Energy Pro-jections Plus (2009).

Table D8. World Consumption of Hydroelectricity and Other Renewable Energy by Region,High OIl Price Case, 1990-2030(Quadrillion Btu)
High Oil Price Case Projections
Energy Information Administration / International Energy Outlook 2009 179
Region/Country
History Projections Average AnnualPercent Change,
2006-20301990 2005 2006 2010 2015 2020 2025 2030
OECDOECD North America . . . . . . . . . . . 9.7 10.3 10.5 11.9 13.6 15.4 16.4 17.3 2.1
United Statesa. . . . . . . . . . . . . . . . . 6.2 6.1 6.5 7.5 8.6 10.0 10.6 11.2 2.3Canada . . . . . . . . . . . . . . . . . . . . . . 3.1 3.7 3.6 3.9 4.4 4.8 5.1 5.4 1.7Mexico. . . . . . . . . . . . . . . . . . . . . . . 0.3 0.4 0.5 0.5 0.6 0.7 0.7 0.7 1.9
OECD Europe . . . . . . . . . . . . . . . . . 4.8 6.5 6.6 8.5 10.3 12.0 13.3 14.4 3.3OECD Asia . . . . . . . . . . . . . . . . . . . . 1.6 1.6 1.7 2.1 2.7 2.8 2.9 3.0 2.4Japan . . . . . . . . . . . . . . . . . . . . . . . 1.1 1.0 1.1 1.3 1.4 1.5 1.5 1.5 1.2South Korea . . . . . . . . . . . . . . . . . . 0.0 0.0 0.0 0.1 0.1 0.1 0.1 0.1 5.3Australia/New Zealand . . . . . . . . . . 0.4 0.5 0.5 0.7 1.1 1.2 1.3 1.3 4.2Total OECD . . . . . . . . . . . . . . . . . 16.0 18.3 18.8 22.5 26.6 30.1 32.6 34.7 2.6
Non-OECDNon-OECD Europe and Eurasia. . . 2.8 3.1 3.0 3.2 3.4 3.5 3.7 3.8 0.9Russia . . . . . . . . . . . . . . . . . . . . . . . 1.8 1.8 1.8 1.9 2.0 2.2 2.3 2.4 1.3Other . . . . . . . . . . . . . . . . . . . . . . . . 1.0 1.3 1.3 1.3 1.4 1.4 1.4 1.4 0.3
Non-OECD Asia. . . . . . . . . . . . . . . . 3.0 6.6 7.2 10.7 14.5 18.2 19.5 22.4 4.9China. . . . . . . . . . . . . . . . . . . . . . . . 1.3 4.0 4.3 7.0 9.4 11.8 12.4 14.7 5.2India . . . . . . . . . . . . . . . . . . . . . . . . 0.7 1.1 1.2 1.6 2.2 2.6 3.0 3.2 4.2Other Non-OECD Asia . . . . . . . . . . 0.9 1.6 1.6 2.1 3.0 3.8 4.2 4.5 4.3
Middle East . . . . . . . . . . . . . . . . . . . 0.1 0.2 0.2 0.3 0.4 0.5 0.5 0.5 3.4Africa . . . . . . . . . . . . . . . . . . . . . . . . 0.6 0.9 0.9 1.0 1.3 1.4 1.5 1.5 2.1Central and South America . . . . . . 3.9 6.4 6.6 7.8 8.8 9.8 10.7 11.6 2.4
Brazil . . . . . . . . . . . . . . . . . . . . . . . . 2.2 3.5 3.6 4.5 5.2 5.9 6.6 7.3 3.0Other Central and South America. . 1.7 2.9 3.0 3.4 3.6 3.8 4.1 4.3 1.4Total Non-OECD . . . . . . . . . . . . . 10.3 17.2 18.0 23.2 28.4 33.4 35.9 39.8 3.4
Total World . . . . . . . . . . . . . . . . . . . . 26.3 35.5 36.8 45.7 55.0 63.5 68.5 74.5 3.0aIncludes the 50 States and the District of Columbia.Notes: Totals may not equal sum of components due to independent rounding. U.S. totals include net electricity imports, methanol,
and liquid hydrogen. Numbers for the United States in this table are based on the published AEO2009 reference case (March 2009).In the updated AEO2009 reference case (April 2009), which incorporates provisions from the American Recovery and ReinvestmentAct of 2009 (ARRA2009) that stimulate increased renewable generation, greater use of renewable fuels is projected. U.S. consump-tion of hydroelectricity and other renewable energy is projected to be 9.4 quadrillion Btu in 2015 in the updated AEO2009 referencecase—10 percent higher than in the earlier projections reported in this table.
Sources: History: Energy Information Administration (EIA), International Energy Annual 2006 (June-December 2008), web sitewww.eia.doe.gov/iea. Projections: EIA, Annual Energy Outlook 2009, DOE/EIA-0383(2009) (Washington, DC, March 2009),AEO2009 National Energy Modeling System, run HP2009.D121108A, web site www.eia.doe.gov/oiaf/aeo; and World Energy Pro-jections Plus (2009).

Table D9. World Carbon Dioxide Emissions by Region, High Oil Price Case, 1990-2030(Million Metric Tons Carbon Dioxide)
Appendix D
180 Energy Information Administration / International Energy Outlook 2009
Region/Country
History Projections Average AnnualPercent Change,
2006-20301990 2005 2006 2010 2015 2020 2025 2030
OECDOECD North America . . . . . . . . . . . 5,762 7,007 6,948 6,774 6,812 6,876 7,096 7,425 0.3United Statesa. . . . . . . . . . . . . . . . . 4,989 5,975 5,907 5,782 5,795 5,785 5,938 6,203 0.2Canada . . . . . . . . . . . . . . . . . . . . . . 471 629 611 622 620 649 677 701 0.6Mexico. . . . . . . . . . . . . . . . . . . . . . . 302 403 431 371 397 443 481 521 0.8
OECD Europe . . . . . . . . . . . . . . . . . 4,149 4,424 4,429 4,332 4,179 4,202 4,222 4,247 -0.2OECD Asia . . . . . . . . . . . . . . . . . . . . 1,595 2,200 2,216 2,219 2,201 2,232 2,244 2,264 0.1
Japan . . . . . . . . . . . . . . . . . . . . . . . 1,054 1,250 1,247 1,169 1,157 1,164 1,130 1,099 -0.5South Korea . . . . . . . . . . . . . . . . . . 243 497 515 597 586 593 624 654 1.0Australia/New Zealand . . . . . . . . . . 298 454 455 454 458 475 490 511 0.5Total OECD . . . . . . . . . . . . . . . . . 11,506 13,632 13,594 13,326 13,192 13,311 13,563 13,936 0.1
Non-OECDNon-OECD Europe and Eurasia. . . 4,246 2,889 2,886 3,068 3,177 3,247 3,276 3,333 0.6Russia . . . . . . . . . . . . . . . . . . . . . . . 2,393 1,699 1,704 1,803 1,882 1,932 1,933 1,961 0.6Other . . . . . . . . . . . . . . . . . . . . . . . . 1,853 1,190 1,182 1,265 1,295 1,315 1,342 1,371 0.6
Non-OECD Asia. . . . . . . . . . . . . . . . 3,678 8,305 8,987 10,451 11,544 13,091 14,803 16,399 2.5China. . . . . . . . . . . . . . . . . . . . . . . . 2,293 5,429 6,018 7,213 7,991 9,111 10,355 11,352 2.7India . . . . . . . . . . . . . . . . . . . . . . . . 573 1,192 1,292 1,364 1,525 1,722 1,862 2,041 1.9Other Non-OECD Asia . . . . . . . . . . 811 1,684 1,678 1,875 2,028 2,259 2,586 3,006 2.5
Middle East . . . . . . . . . . . . . . . . . . . 704 1,393 1,456 1,687 1,835 1,941 2,064 2,226 1.8Africa . . . . . . . . . . . . . . . . . . . . . . . . 659 985 982 1,085 1,104 1,161 1,241 1,323 1.2Central and South America . . . . . . 695 1,093 1,123 1,308 1,291 1,336 1,432 1,530 1.3Brazil . . . . . . . . . . . . . . . . . . . . . . . . 235 366 374 437 469 518 580 644 2.3Other Central and South America. . 460 727 749 872 823 818 852 886 0.7Total Non-OECD . . . . . . . . . . . . . 9,982 14,664 15,434 17,598 18,951 20,776 22,817 24,810 2.0
Total World . . . . . . . . . . . . . . . . . . . . 21,488 28,296 29,028 30,925 32,144 34,087 36,379 38,745 1.2aIncludes the 50 States and the District of Columbia.Note: The U.S. numbers include carbon dioxide emissions attributable to renewable energy sources.Sources: History: Energy Information Administration (EIA), International Energy Annual 2006 (June-December 2008), web site
www.eia.doe.gov/iea. Projections: EIA, Annual Energy Outlook 2009, DOE/EIA-0383(2009) (Washington, DC, March 2009),AEO2009 National Energy Modeling System, run HP2009.D121108A, web site www.eia.doe.gov/oiaf/aeo; and World Energy Pro-jections Plus (2009).

Table D10. World Carbon Dioxide Emissions from Liquids Use by Region, High Oil Price Case, 1990-2030(Million Metric Tons Carbon Dioxide)
High Oil Price Case Projections
Energy Information Administration / International Energy Outlook 2009 181
Region/Country
History Projections Average AnnualPercent Change,
2006-20301990 2005 2006 2010 2015 2020 2025 2030
OECDOECD North America . . . . . . . . . . . 2,637 3,188 3,159 2,877 2,787 2,703 2,723 2,814 -0.5United Statesa. . . . . . . . . . . . . . . . . 2,178 2,620 2,596 2,384 2,323 2,243 2,260 2,346 -0.4Canada . . . . . . . . . . . . . . . . . . . . . . 227 301 295 295 266 255 256 259 -0.5Mexico. . . . . . . . . . . . . . . . . . . . . . . 233 267 268 198 198 205 207 209 -1.0
OECD Europe . . . . . . . . . . . . . . . . . 1,884 2,134 2,135 1,978 1,780 1,718 1,690 1,667 -1.0OECD Asia . . . . . . . . . . . . . . . . . . . . 945 1,028 1,014 990 918 882 863 847 -0.7
Japan . . . . . . . . . . . . . . . . . . . . . . . 687 641 626 554 522 505 481 460 -1.3South Korea . . . . . . . . . . . . . . . . . . 144 239 237 299 263 239 242 242 0.1Australia/New Zealand . . . . . . . . . . 114 148 151 137 133 137 140 145 -0.2Total OECD . . . . . . . . . . . . . . . . . 5,466 6,350 6,308 5,844 5,486 5,302 5,277 5,328 -0.7
Non-OECDNon-OECD Europe and Eurasia. . . 1,368 686 692 713 663 642 632 625 -0.4Russia . . . . . . . . . . . . . . . . . . . . . . . 782 383 389 374 354 346 331 316 -0.9Other . . . . . . . . . . . . . . . . . . . . . . . . 586 303 303 339 309 296 302 308 0.1
Non-OECD Asia. . . . . . . . . . . . . . . . 960 2,077 2,170 2,414 2,491 2,742 3,046 3,332 1.8China. . . . . . . . . . . . . . . . . . . . . . . . 335 889 960 1,129 1,181 1,344 1,522 1,669 2.3India . . . . . . . . . . . . . . . . . . . . . . . . 160 314 332 305 349 410 444 478 1.5Other Non-OECD Asia . . . . . . . . . . 466 874 878 980 961 987 1,080 1,185 1.3
Middle East . . . . . . . . . . . . . . . . . . . 491 814 849 986 1,009 1,022 1,067 1,133 1.2Africa . . . . . . . . . . . . . . . . . . . . . . . . 302 423 424 495 455 436 443 447 0.2Central and South America . . . . . . 525 761 790 913 838 802 827 864 0.4Brazil . . . . . . . . . . . . . . . . . . . . . . . . 197 288 294 332 340 352 379 413 1.4Other Central and South America. . 328 473 496 581 499 450 448 451 -0.4Total Non-OECD . . . . . . . . . . . . . 3,646 4,760 4,926 5,521 5,456 5,644 6,015 6,401 1.1
Total World . . . . . . . . . . . . . . . . . . . . 9,112 11,110 11,234 11,365 10,942 10,946 11,292 11,729 0.2aIncludes the 50 States and the District of Columbia.Sources: History: Energy Information Administration (EIA), International Energy Annual 2006 (June-December 2008), web site
www.eia.doe.gov/iea. Projections: EIA, Annual Energy Outlook 2009, DOE/EIA-0383(2009) (Washington, DC, March 2009),AEO2009 National Energy Modeling System, run HP2009.D121108A, web site www.eia.doe.gov/oiaf/aeo; and World Energy Pro-jections Plus (2009).

Table D11. World Carbon Dioxide Emissions from Natural Gas Use by Region, High Oil Price Case,1990-2030(Million Metric Tons Carbon Dioxide)
Appendix D
182 Energy Information Administration / International Energy Outlook 2009
Region/Country
History Projections Average AnnualPercent Change,
2006-20301990 2005 2006 2010 2015 2020 2025 2030
OECDOECD North America . . . . . . . . . . . 1,208 1,468 1,465 1,535 1,602 1,701 1,829 1,857 1.0United Statesa. . . . . . . . . . . . . . . . . 1,026 1,183 1,159 1,213 1,228 1,264 1,343 1,327 0.6Canada . . . . . . . . . . . . . . . . . . . . . . 128 185 181 189 214 242 260 276 1.8Mexico. . . . . . . . . . . . . . . . . . . . . . . 54 100 125 134 160 195 226 254 3.0
OECD Europe . . . . . . . . . . . . . . . . . 593 1,053 1,047 1,111 1,178 1,284 1,348 1,397 1.2OECD Asia . . . . . . . . . . . . . . . . . . . . 165 306 323 343 384 428 440 449 1.4
Japan . . . . . . . . . . . . . . . . . . . . . . . 115 181 191 196 217 241 245 245 1.1South Korea . . . . . . . . . . . . . . . . . . 6 64 68 77 91 102 109 112 2.1Australia/New Zealand . . . . . . . . . . 44 61 64 70 76 85 87 92 1.5Total OECD . . . . . . . . . . . . . . . . . 1,966 2,827 2,835 2,989 3,164 3,412 3,618 3,703 1.1
Non-OECDNon-OECD Europe and Eurasia. . . 1,457 1,367 1,371 1,487 1,623 1,720 1,767 1,811 1.2Russia . . . . . . . . . . . . . . . . . . . . . . . 933 865 889 962 1,038 1,096 1,119 1,149 1.1Other . . . . . . . . . . . . . . . . . . . . . . . . 524 502 482 524 585 624 648 662 1.3
Non-OECD Asia. . . . . . . . . . . . . . . . 161 508 510 621 832 1,057 1,238 1,404 4.3China. . . . . . . . . . . . . . . . . . . . . . . . 30 92 111 146 209 271 331 387 5.4India . . . . . . . . . . . . . . . . . . . . . . . . 24 70 76 98 130 168 193 210 4.3Other Non-OECD Asia . . . . . . . . . . 106 347 324 377 494 618 714 807 3.9
Middle East . . . . . . . . . . . . . . . . . . . 200 543 571 666 790 880 954 1,042 2.5Africa . . . . . . . . . . . . . . . . . . . . . . . . 80 168 168 193 240 296 339 367 3.3Central and South America . . . . . . 117 250 255 307 354 417 469 496 2.8Brazil . . . . . . . . . . . . . . . . . . . . . . . . 6 36 38 53 68 92 112 123 5.1Other Central and South America. . 111 214 218 254 286 326 357 373 2.3Total Non-OECD . . . . . . . . . . . . . 2,015 2,837 2,876 3,273 3,838 4,370 4,766 5,120 2.4
Total World . . . . . . . . . . . . . . . . . . . . 3,981 5,664 5,712 6,262 7,002 7,782 8,384 8,822 1.8aIncludes the 50 States and the District of Columbia.Sources: History: Energy Information Administration (EIA), International Energy Annual 2006 (June-December 2008), web site
www.eia.doe.gov/iea. Projections: EIA, Annual Energy Outlook 2009, DOE/EIA-0383(2009) (Washington, DC, March 2009),AEO2009 National Energy Modeling System, run HP2009.D121108A, web site www.eia.doe.gov/oiaf/aeo; and World Energy Pro-jections Plus (2009).

Table D12. World Carbon Dioxide Emissions from Coal Use by Region, High Oil Price Case, 1990-2030(Million Metric Tons Carbon Dioxide)
High Oil Price Case Projections
Energy Information Administration / International Energy Outlook 2009 183
Region/Country
History Projections Average AnnualPercent Change,
2006-20301990 2005 2006 2010 2015 2020 2025 2030
OECDOECD North America . . . . . . . . . . . 1,916 2,339 2,312 2,350 2,411 2,461 2,532 2,742 0.7United Statesa. . . . . . . . . . . . . . . . . 1,784 2,161 2,140 2,174 2,231 2,266 2,323 2,517 0.7Canada . . . . . . . . . . . . . . . . . . . . . . 116 142 134 138 140 152 161 167 0.9Mexico. . . . . . . . . . . . . . . . . . . . . . . 16 36 38 38 40 43 48 58 1.8
OECD Europe . . . . . . . . . . . . . . . . . 1,672 1,237 1,247 1,244 1,222 1,201 1,183 1,183 -0.2OECD Asia . . . . . . . . . . . . . . . . . . . . 485 866 879 887 898 922 941 968 0.4
Japan . . . . . . . . . . . . . . . . . . . . . . . 252 427 430 419 418 417 405 394 -0.4South Korea . . . . . . . . . . . . . . . . . . 93 194 209 221 232 251 274 300 1.5Australia/New Zealand . . . . . . . . . . 140 244 240 247 249 254 262 274 0.6Total OECD . . . . . . . . . . . . . . . . . 4,073 4,443 4,438 4,481 4,531 4,585 4,657 4,893 0.4
Non-OECDNon-OECD Europe and Eurasia. . . 1,421 836 823 868 892 886 876 897 0.4Russia . . . . . . . . . . . . . . . . . . . . . . . 678 451 427 466 490 490 484 496 0.6Other . . . . . . . . . . . . . . . . . . . . . . . . 743 385 396 402 401 396 393 401 0.1
Non-OECD Asia. . . . . . . . . . . . . . . . 2,557 5,720 6,307 7,417 8,221 9,292 10,520 11,663 2.6China. . . . . . . . . . . . . . . . . . . . . . . . 1,929 4,449 4,947 5,938 6,601 7,496 8,502 9,296 2.7India . . . . . . . . . . . . . . . . . . . . . . . . 389 808 883 961 1,047 1,144 1,225 1,353 1.8Other Non-OECD Asia . . . . . . . . . . 239 463 476 518 573 653 792 1,014 3.2
Middle East . . . . . . . . . . . . . . . . . . . 14 36 36 35 36 39 43 51 1.5Africa . . . . . . . . . . . . . . . . . . . . . . . . 277 394 389 396 409 430 459 508 1.1Central and South America . . . . . . 53 81 77 88 99 116 137 170 3.3Brazil . . . . . . . . . . . . . . . . . . . . . . . . 32 42 42 51 61 74 89 108 4.0Other Central and South America. . 21 40 36 37 38 42 48 62 2.4Total Non-OECD . . . . . . . . . . . . . 4,321 7,067 7,632 8,804 9,658 10,762 12,035 13,289 2.3
Total World . . . . . . . . . . . . . . . . . . . . 8,394 11,510 12,070 13,285 14,189 15,347 16,691 18,182 1.7aIncludes the 50 States and the District of Columbia.Sources: History: Energy Information Administration (EIA), International Energy Annual 2006 (June-December 2008), web site
www.eia.doe.gov/iea. Projections: EIA, Annual Energy Outlook 2009, DOE/EIA-0383(2009) (Washington, DC, March 2009),AEO2009 National Energy Modeling System, run HP2009.D121108A, web site www.eia.doe.gov/oiaf/aeo; and World Energy Pro-jections Plus (2009).


Appendix E
Low Oil Price Case Projections:• World Energy Consumption• Gross Domestic Product• Carbon Dioxide Emissions


Table E1. World Total Energy Consumption by Region, Low Oil Price Case, 1990-2030(Quadrillion Btu)
Low Oil Price Case Projections
Energy Information Administration / International Energy Outlook 2009 187
Region/Country
History Projections Average AnnualPercent Change,
2006-20301990 2005 2006 2010 2015 2020 2025 2030
OECDOECD North America . . . . . . . . . . . 100.7 121.6 121.3 122.0 130.3 134.7 140.0 146.8 0.8United Statesa. . . . . . . . . . . . . . . . . 84.7 100.5 100.0 100.8 106.7 109.1 112.6 117.6 0.7Canada . . . . . . . . . . . . . . . . . . . . . . 11.0 14.2 14.0 14.6 15.9 17.0 17.9 18.9 1.3Mexico. . . . . . . . . . . . . . . . . . . . . . . 5.0 6.9 7.4 6.6 7.6 8.6 9.5 10.4 1.4
OECD Europe . . . . . . . . . . . . . . . . . 70.0 81.4 81.6 82.3 86.9 90.7 93.2 95.4 0.7OECD Asia . . . . . . . . . . . . . . . . . . . . 27.0 38.4 38.7 39.6 42.9 44.7 45.6 46.6 0.8Japan . . . . . . . . . . . . . . . . . . . . . . . 18.7 22.7 22.8 21.9 23.4 24.2 24.1 24.0 0.2South Korea . . . . . . . . . . . . . . . . . . 3.8 9.2 9.4 11.0 12.1 12.6 13.3 13.9 1.6Australia/New Zealand . . . . . . . . . . 4.5 6.4 6.5 6.7 7.4 7.9 8.3 8.7 1.2Total OECD . . . . . . . . . . . . . . . . . 197.7 241.3 241.7 243.9 260.1 270.1 278.8 288.9 0.7
Non-OECDNon-OECD Europe and Eurasia. . . 67.3 50.6 50.7 54.0 58.4 61.4 63.2 64.7 1.0Russia . . . . . . . . . . . . . . . . . . . . . . . 39.4 30.1 30.4 32.2 34.8 36.6 37.5 38.3 1.0Other . . . . . . . . . . . . . . . . . . . . . . . . 28.0 20.6 20.3 21.8 23.7 24.8 25.7 26.3 1.1
Non-OECD Asia. . . . . . . . . . . . . . . . 47.4 109.4 117.6 139.5 166.5 195.2 221.6 247.5 3.1China. . . . . . . . . . . . . . . . . . . . . . . . 27.0 66.8 73.8 90.7 107.6 126.4 143.8 159.7 3.3India . . . . . . . . . . . . . . . . . . . . . . . . 7.9 16.3 17.7 19.2 23.3 27.6 30.5 33.5 2.7Other Non-OECD Asia . . . . . . . . . . 12.5 26.3 26.1 29.7 35.6 41.2 47.3 54.4 3.1
Middle East . . . . . . . . . . . . . . . . . . . 11.2 22.7 23.8 27.6 31.0 33.3 36.1 39.7 2.2Africa . . . . . . . . . . . . . . . . . . . . . . . . 9.5 14.5 14.5 16.3 18.4 20.0 21.6 23.0 1.9Central and South America . . . . . . 14.5 23.4 24.2 28.3 31.3 33.8 36.7 39.5 2.1Brazil . . . . . . . . . . . . . . . . . . . . . . . . 5.8 9.4 9.6 11.4 13.2 15.0 16.9 18.8 2.8Other Central and South America. . 8.8 14.0 14.6 17.0 18.0 18.7 19.8 20.7 1.5Total Non-OECD . . . . . . . . . . . . . 149.9 220.7 230.8 265.7 305.7 343.7 379.2 414.4 2.5
Total World . . . . . . . . . . . . . . . . . . . . 347.7 462.1 472.4 509.6 565.7 613.8 658.0 703.3 1.7aIncludes the 50 States and the District of Columbia.Notes: Energy totals include net imports of coal coke and electricity generated from biomass in the United States. Totals may not
equal sum of components due to independent rounding. The electricity portion of the national fuel consumption values consists ofgeneration for domestic use plus an adjustment for electricity trade based on a fuel’s share of total generation in the exporting coun-try.
Sources: History: Energy Information Administration (EIA), International Energy Annual 2006 (June-December 2008), web sitewww.eia.doe.gov/iea. Projections: EIA, Annual Energy Outlook 2009, DOE/EIA-0383(2009) (Washington, DC, March 2009),AEO2009 National Energy Modeling System, run LP2009.D122308A, web site www.eia.doe.gov/oiaf/aeo; and World Energy Projec-tions Plus (2009).

Table E2. World Total Energy Consumption by Region and Fuel, Low Oil Price Case, 1990-2030(Quadrillion Btu)
Appendix E
188 Energy Information Administration / International Energy Outlook 2009
Region/Country
History Projections Average AnnualPercent Change,
2006-20301990 2005 2006 2010 2015 2020 2025 2030
OECDOECD North AmericaLiquids . . . . . . . . . . . . . . . . . . . . . 40.5 49.6 49.2 46.3 50.7 52.2 54.1 57.5 0.7Natural Gas . . . . . . . . . . . . . . . . . 23.0 28.0 28.0 29.4 30.8 31.5 33.3 33.6 0.8Coal . . . . . . . . . . . . . . . . . . . . . . . 20.6 24.7 24.3 24.8 25.5 25.9 26.2 28.2 0.6Nuclear. . . . . . . . . . . . . . . . . . . . . 6.9 9.2 9.4 9.8 10.0 10.3 10.4 10.7 0.6Other . . . . . . . . . . . . . . . . . . . . . . 9.7 10.3 10.5 11.8 13.3 14.7 16.0 16.8 2.0Total. . . . . . . . . . . . . . . . . . . . . . 100.7 121.6 121.3 122.0 130.3 134.7 140.0 146.8 0.8
OECD EuropeLiquids . . . . . . . . . . . . . . . . . . . . . 28.4 32.3 32.4 30.0 32.0 33.5 34.0 34.6 0.3Natural Gas . . . . . . . . . . . . . . . . . 11.2 19.8 19.7 21.0 22.2 23.4 24.3 24.9 1.0Coal . . . . . . . . . . . . . . . . . . . . . . . 17.7 12.9 13.2 13.0 12.8 12.4 12.2 12.1 -0.4Nuclear. . . . . . . . . . . . . . . . . . . . . 7.9 9.7 9.6 9.7 9.6 9.5 9.4 9.5 -0.1Other . . . . . . . . . . . . . . . . . . . . . . 4.8 6.5 6.6 8.5 10.3 11.8 13.2 14.3 3.3Total. . . . . . . . . . . . . . . . . . . . . . 70.0 81.4 81.6 82.3 86.9 90.7 93.2 95.4 0.7
OECD AsiaLiquids . . . . . . . . . . . . . . . . . . . . . 14.7 17.5 17.2 17.0 18.5 19.3 19.5 19.7 0.6Natural Gas . . . . . . . . . . . . . . . . . 3.1 5.8 6.1 6.5 7.1 7.5 7.6 7.7 1.0Coal . . . . . . . . . . . . . . . . . . . . . . . 5.2 9.3 9.4 9.5 9.6 9.5 9.7 9.9 0.2Nuclear. . . . . . . . . . . . . . . . . . . . . 2.5 4.3 4.3 4.5 5.0 5.6 5.9 6.4 1.6Other . . . . . . . . . . . . . . . . . . . . . . 1.6 1.6 1.7 2.1 2.6 2.8 2.9 3.0 2.4Total. . . . . . . . . . . . . . . . . . . . . . 27.0 38.4 38.7 39.6 42.9 44.7 45.6 46.6 0.8
Total OECDLiquids . . . . . . . . . . . . . . . . . . . . . 83.6 99.4 98.8 93.2 101.2 105.1 107.6 111.8 0.5Natural Gas . . . . . . . . . . . . . . . . . 37.3 53.6 53.9 57.0 60.2 62.4 65.2 66.2 0.9Coal . . . . . . . . . . . . . . . . . . . . . . . 43.5 46.9 46.9 47.4 47.9 47.9 48.1 50.1 0.3Nuclear. . . . . . . . . . . . . . . . . . . . . 17.3 23.2 23.3 24.0 24.7 25.4 25.8 26.6 0.5Other . . . . . . . . . . . . . . . . . . . . . . 16.0 18.3 18.8 22.4 26.2 29.3 32.1 34.1 2.5Total. . . . . . . . . . . . . . . . . . . . . . 197.7 241.3 241.7 243.9 260.1 270.1 278.8 288.9 0.7
Non-OECDNon-OECD Europe and EurasiaLiquids . . . . . . . . . . . . . . . . . . . . . 19.6 10.1 10.2 10.5 11.5 12.1 12.4 12.7 0.9Natural Gas . . . . . . . . . . . . . . . . . 27.5 25.8 25.8 28.0 30.5 31.9 32.7 33.4 1.1Coal . . . . . . . . . . . . . . . . . . . . . . . 15.1 8.9 8.7 9.2 9.5 9.3 9.2 9.4 0.3Nuclear. . . . . . . . . . . . . . . . . . . . . 2.5 2.9 2.9 3.0 3.6 4.5 5.2 5.5 2.6Other . . . . . . . . . . . . . . . . . . . . . . 2.8 3.1 3.0 3.2 3.4 3.5 3.7 3.8 0.9Total. . . . . . . . . . . . . . . . . . . . . . 67.3 50.6 50.7 54.0 58.4 61.4 63.2 64.7 1.0
Non-OECD AsiaLiquids . . . . . . . . . . . . . . . . . . . . . 14.0 31.6 33.1 36.8 45.5 54.6 62.4 70.3 3.2Natural Gas . . . . . . . . . . . . . . . . . 3.0 9.6 9.6 11.8 15.7 19.3 22.4 25.2 4.1Coal . . . . . . . . . . . . . . . . . . . . . . . 27.0 60.4 66.5 78.7 87.8 98.5 111.1 122.6 2.6Nuclear. . . . . . . . . . . . . . . . . . . . . 0.4 1.1 1.1 1.6 3.0 4.7 6.2 7.0 7.9Other . . . . . . . . . . . . . . . . . . . . . . 3.0 6.6 7.2 10.7 14.5 18.1 19.4 22.3 4.8Total. . . . . . . . . . . . . . . . . . . . . . 47.4 109.4 117.6 139.5 166.5 195.2 221.6 247.5 3.1
See notes at end of table.

Table E2. World Total Energy Consumption by Region and Fuel, Low Oil Price Case, 1990-2030 (Continued)(Quadrillion Btu)
Low Oil Price Case Projections
Energy Information Administration / International Energy Outlook 2009 189
Region/Country
History Projections Average AnnualPercent Change,
2006-20301990 2005 2006 2010 2015 2020 2025 2030
Non-OECD (Continued)Middle EastLiquids . . . . . . . . . . . . . . . . . . . . . 7.2 11.9 12.4 14.4 16.2 17.7 19.8 22.7 2.5Natural Gas . . . . . . . . . . . . . . . . . 3.8 10.2 10.8 12.5 14.0 14.6 15.3 16.0 1.7Coal . . . . . . . . . . . . . . . . . . . . . . . 0.1 0.4 0.4 0.4 0.4 0.4 0.4 0.4 0.5Nuclear. . . . . . . . . . . . . . . . . . . . . 0.0 0.0 0.0 0.0 0.1 0.1 0.1 0.1 —Other . . . . . . . . . . . . . . . . . . . . . . 0.1 0.2 0.2 0.3 0.4 0.4 0.5 0.5 3.3Total. . . . . . . . . . . . . . . . . . . . . . 11.2 22.7 23.8 27.6 31.0 33.3 36.1 39.7 2.2
AfricaLiquids . . . . . . . . . . . . . . . . . . . . . 4.3 6.1 6.1 7.1 7.9 8.3 8.8 9.3 1.7Natural Gas . . . . . . . . . . . . . . . . . 1.5 3.2 3.2 3.7 4.7 5.6 6.3 6.8 3.2Coal . . . . . . . . . . . . . . . . . . . . . . . 3.0 4.2 4.2 4.3 4.4 4.6 4.8 5.3 1.0Nuclear. . . . . . . . . . . . . . . . . . . . . 0.1 0.1 0.1 0.1 0.2 0.2 0.2 0.2 3.2Other . . . . . . . . . . . . . . . . . . . . . . 0.6 0.9 0.9 1.0 1.3 1.4 1.5 1.5 2.0Total. . . . . . . . . . . . . . . . . . . . . . 9.5 14.5 14.5 16.3 18.4 20.0 21.6 23.0 1.9
Central and South AmericaLiquids . . . . . . . . . . . . . . . . . . . . . 7.8 11.3 11.7 13.5 14.5 15.0 16.1 17.4 1.7Natural Gas . . . . . . . . . . . . . . . . . 2.2 4.7 4.8 5.9 6.8 7.6 8.4 8.8 2.5Coal . . . . . . . . . . . . . . . . . . . . . . . 0.6 0.9 0.8 0.9 1.1 1.2 1.4 1.6 2.8Nuclear. . . . . . . . . . . . . . . . . . . . . 0.1 0.2 0.2 0.2 0.3 0.4 0.4 0.4 2.0Other . . . . . . . . . . . . . . . . . . . . . . 3.9 6.4 6.6 7.8 8.6 9.5 10.5 11.4 2.3Total. . . . . . . . . . . . . . . . . . . . . . 14.5 23.4 24.2 28.3 31.3 33.8 36.7 39.5 2.1
Total Non-OECDLiquids . . . . . . . . . . . . . . . . . . . . . 52.9 71.0 73.6 82.4 95.5 107.8 119.4 132.2 2.5Natural Gas . . . . . . . . . . . . . . . . . 38.0 53.5 54.2 61.8 71.7 79.2 85.1 90.2 2.1Coal . . . . . . . . . . . . . . . . . . . . . . . 45.7 74.8 80.6 93.5 103.2 114.0 127.0 139.3 2.3Nuclear. . . . . . . . . . . . . . . . . . . . . 3.1 4.3 4.4 5.0 7.1 9.8 12.1 13.2 4.7Other . . . . . . . . . . . . . . . . . . . . . . 10.3 17.2 18.0 23.0 28.1 33.0 35.6 39.6 3.3Total. . . . . . . . . . . . . . . . . . . . . . 149.9 220.7 230.8 265.7 305.7 343.7 379.2 414.4 2.5
Total WorldLiquids . . . . . . . . . . . . . . . . . . . . . 136.4 170.4 172.4 175.6 196.7 212.8 227.1 244.0 1.5Natural Gas . . . . . . . . . . . . . . . . . 75.3 107.1 108.1 118.8 131.9 141.6 150.4 156.4 1.6Coal . . . . . . . . . . . . . . . . . . . . . . . 89.2 121.7 127.5 140.9 151.0 161.9 175.0 189.4 1.7Nuclear. . . . . . . . . . . . . . . . . . . . . 20.4 27.5 27.8 28.9 31.8 35.2 37.9 39.8 1.5Other . . . . . . . . . . . . . . . . . . . . . . 26.3 35.5 36.8 45.4 54.3 62.3 67.6 73.7 2.9Total. . . . . . . . . . . . . . . . . . . . . . 347.7 462.1 472.4 509.6 565.7 613.8 658.0 703.3 1.7
Notes: Energy totals include net imports of coal coke and electricity generated from biomass in the United States. Totals may notequal sum of components due to independent rounding. The electricity portion of the national fuel consumption values consists ofgeneration for domestic use plus an adjustment for electricity trade based on a fuel’s share of total generation in the exporting coun-try.
Sources: History: Energy Information Administration (EIA), International Energy Annual 2006 (June-December 2008), web sitewww.eia.doe.gov/iea. Projections: EIA, Annual Energy Outlook 2009, DOE/EIA-0383(2009) (Washington, DC, March 2009),AEO2009 National Energy Modeling System, run LP2009.D122308A, web site www.eia.doe.gov/oiaf/aeo; and World Energy Projec-tions Plus (2009).

Table E3. World Gross Domestic Product (GDP) by Region Expressed in Purchasing Power Parity,Low Oil Price Case, 1990-2030(Billion 2005 Dollars)
Appendix E
190 Energy Information Administration / International Energy Outlook 2009
Region/Country
History Projections Average AnnualPercent Change,
2006-20301990 2005 2006 2010 2015 2020 2025 2030
OECDOECD North America . . . . . . . . . . . 9,651 14,885 15,331 16,147 19,000 21,302 24,181 27,732 2.5United Statesa. . . . . . . . . . . . . . . . . 8,040 12,422 12,768 13,386 15,745 17,506 19,778 22,658 2.4Canada . . . . . . . . . . . . . . . . . . . . . . 773 1,167 1,204 1,275 1,453 1,629 1,822 2,035 2.2Mexico. . . . . . . . . . . . . . . . . . . . . . . 838 1,296 1,359 1,486 1,802 2,167 2,581 3,039 3.4
OECD Europe . . . . . . . . . . . . . . . . . 9,703 13,756 14,224 15,060 16,879 18,854 20,959 23,197 2.1OECD Asia . . . . . . . . . . . . . . . . . . . . 4,080 5,509 5,667 6,065 6,792 7,333 7,845 8,392 1.6
Japan . . . . . . . . . . . . . . . . . . . . . . . 3,222 3,873 3,966 4,121 4,452 4,615 4,707 4,798 0.8South Korea . . . . . . . . . . . . . . . . . . 374 843 886 1,044 1,285 1,496 1,720 1,949 3.3Australia/New Zealand . . . . . . . . . . 485 794 815 899 1,056 1,222 1,418 1,645 3.0Total OECD . . . . . . . . . . . . . . . . . 23,434 34,150 35,221 37,272 42,671 47,490 52,986 59,320 2.2
Non-OECDNon-OECD Europe and Eurasia. . . 3,039 2,932 3,159 3,939 4,865 5,724 6,536 7,381 3.6Russia . . . . . . . . . . . . . . . . . . . . . . . 1,880 1,703 1,829 2,322 2,849 3,325 3,761 4,217 3.5Other . . . . . . . . . . . . . . . . . . . . . . . . 1,159 1,229 1,330 1,617 2,016 2,399 2,775 3,164 3.7
Non-OECD Asia. . . . . . . . . . . . . . . . 4,457 12,272 13,408 17,990 24,669 32,807 41,566 50,930 5.7China. . . . . . . . . . . . . . . . . . . . . . . . 1,265 5,389 6,014 8,716 12,297 16,933 21,742 26,501 6.4India . . . . . . . . . . . . . . . . . . . . . . . . 1,019 2,436 2,672 3,510 4,886 6,447 8,072 9,928 5.6Other Non-OECD Asia . . . . . . . . . . 2,173 4,448 4,723 5,765 7,486 9,427 11,753 14,500 4.8
Middle East . . . . . . . . . . . . . . . . . . . 1,072 1,919 2,053 2,464 3,011 3,599 4,264 5,048 3.8Africa . . . . . . . . . . . . . . . . . . . . . . . . 1,387 2,211 2,341 2,880 3,622 4,396 5,201 5,985 4.0Central and South America . . . . . . 2,270 3,555 3,757 4,503 5,424 6,460 7,631 8,968 3.7Brazil . . . . . . . . . . . . . . . . . . . . . . . . 1,045 1,534 1,591 1,895 2,296 2,753 3,292 3,922 3.8Other Central and South America. . 1,224 2,021 2,165 2,609 3,128 3,707 4,339 5,046 3.6Total Non-OECD . . . . . . . . . . . . . 12,225 22,888 24,717 31,778 41,590 52,986 65,198 78,311 4.9
Total World . . . . . . . . . . . . . . . . . . . . 35,659 57,038 59,939 69,050 84,261 100,476 118,184 137,631 3.5aIncludes the 50 States and the District of Columbia.Note: Totals may not equal sum of components due to independent rounding.Sources: History: IHS Global Insight World Overview (Lexington, MA, various issues). Projections: Derived from IHS Global
Insight, World Overview, Fourth Quarter 2008 (Lexington, MA, January 2009); and Energy Information Administration, AnnualEnergy Outlook 2009, DOE/EIA-0383(2009) (Washington, DC, March 2009), Table B4.

Table E4. World Liquids Consumption by Region, Low Oil Price Case, 1990-2030(Million Barrels per Day)
Low Oil Price Case Projections
Energy Information Administration / International Energy Outlook 2009 191
Region/Country
History Projections Average AnnualPercent Change,
2006-20301990 2005 2006 2010 2015 2020 2025 2030
OECDOECD North America . . . . . . . . . . . 20.5 25.2 25.1 24.0 26.2 26.9 27.9 29.5 0.7United Statesa. . . . . . . . . . . . . . . . . 17.0 20.8 20.7 20.1 21.9 22.3 23.1 24.4 0.7Canada . . . . . . . . . . . . . . . . . . . . . . 1.7 2.3 2.3 2.3 2.5 2.6 2.7 2.8 0.8Mexico. . . . . . . . . . . . . . . . . . . . . . . 1.8 2.1 2.1 1.5 1.8 2.0 2.2 2.3 0.5
OECD Europe . . . . . . . . . . . . . . . . . 13.7 15.7 15.7 14.5 15.5 16.2 16.5 16.7 0.3OECD Asia . . . . . . . . . . . . . . . . . . . . 7.2 8.6 8.5 8.4 9.1 9.5 9.6 9.7 0.6Japan . . . . . . . . . . . . . . . . . . . . . . . 5.3 5.3 5.2 4.6 5.1 5.4 5.3 5.2 0.0South Korea . . . . . . . . . . . . . . . . . . 1.0 2.2 2.2 2.8 2.9 2.9 3.0 3.1 1.5Australia/New Zealand . . . . . . . . . . 0.8 1.1 1.1 1.0 1.1 1.3 1.3 1.4 1.1Total OECD . . . . . . . . . . . . . . . . . 41.4 49.5 49.2 46.8 50.8 52.7 54.0 55.9 0.5
Non-OECDNon-OECD Europe and Eurasia. . . 9.4 4.9 5.0 5.1 5.6 5.9 6.0 6.2 0.9Russia . . . . . . . . . . . . . . . . . . . . . . . 5.4 2.8 2.8 2.7 3.0 3.2 3.1 3.1 0.4Other . . . . . . . . . . . . . . . . . . . . . . . . 3.9 2.1 2.1 2.4 2.6 2.7 2.9 3.1 1.6
Non-OECD Asia. . . . . . . . . . . . . . . . 6.6 15.3 16.0 17.8 22.0 26.5 30.2 34.1 3.2China. . . . . . . . . . . . . . . . . . . . . . . . 2.3 6.7 7.2 8.5 10.7 13.2 15.3 17.1 3.7India . . . . . . . . . . . . . . . . . . . . . . . . 1.2 2.5 2.7 2.4 3.3 4.2 4.7 5.2 2.9Other Non-OECD Asia . . . . . . . . . . 3.1 6.1 6.1 6.9 8.0 9.0 10.2 11.7 2.7
Middle East . . . . . . . . . . . . . . . . . . . 3.5 5.8 6.1 7.0 7.9 8.6 9.7 11.1 2.5Africa . . . . . . . . . . . . . . . . . . . . . . . . 2.1 3.0 3.0 3.5 3.8 4.0 4.3 4.5 1.7Central and South America . . . . . . 3.8 5.5 5.7 6.6 7.1 7.3 7.8 8.5 1.7Brazil . . . . . . . . . . . . . . . . . . . . . . . . 1.5 2.2 2.3 2.5 3.0 3.3 3.7 4.1 2.5Other Central and South America. . 2.3 3.3 3.4 4.0 4.1 4.0 4.2 4.3 1.0Total Non-OECD . . . . . . . . . . . . . 25.3 34.5 35.8 40.0 46.4 52.4 58.0 64.3 2.5
Total World . . . . . . . . . . . . . . . . . . . . 66.7 84.0 85.9 86.8 97.2 105.0 112.0 120.2 1.5aIncludes the 50 States and the District of Columbia.Note: Totals may not equal sum of components due to independent rounding.Sources: History: Energy Information Administration (EIA), International Energy Annual 2006 (June-December 2008), web site
www.eia.doe.gov/iea. Projections: EIA, Annual Energy Outlook 2009, DOE/EIA-0383(2009) (Washington, DC, March 2009),AEO2009 National Energy Modeling System, run LP2009.D122308A, web site www.eia.doe.gov/oiaf/aeo; and World Energy Projec-tions Plus (2009).

Table E5. World Natural Gas Consumption by Region, Low Oil Price Case, 1990-2030(Trillion Cubic Feet)
Appendix E
192 Energy Information Administration / International Energy Outlook 2009
Region/Country
History Projections Average AnnualPercent Change,
2006-20301990 2005 2006 2010 2015 2020 2025 2030
OECDOECD North America . . . . . . . . . . . 22.5 27.1 27.2 28.5 29.8 30.5 32.2 32.5 0.8United Statesa. . . . . . . . . . . . . . . . . 19.2 22.0 21.7 22.7 23.1 23.1 24.0 23.6 0.4Canada . . . . . . . . . . . . . . . . . . . . . . 2.4 3.4 3.3 3.4 3.9 4.2 4.5 4.7 1.5Mexico. . . . . . . . . . . . . . . . . . . . . . . 0.9 1.8 2.2 2.4 2.8 3.2 3.7 4.2 2.7
OECD Europe . . . . . . . . . . . . . . . . . 11.6 19.3 19.2 20.5 21.6 22.7 23.7 24.3 1.0OECD Asia . . . . . . . . . . . . . . . . . . . . 2.9 5.2 5.5 5.9 6.5 6.8 6.9 7.0 1.0Japan . . . . . . . . . . . . . . . . . . . . . . . 2.0 3.1 3.2 3.4 3.6 3.7 3.7 3.7 0.5South Korea . . . . . . . . . . . . . . . . . . 0.1 1.1 1.1 1.3 1.5 1.6 1.7 1.8 1.8Australia/New Zealand . . . . . . . . . . 0.8 1.1 1.2 1.3 1.4 1.5 1.5 1.6 1.3Total OECD . . . . . . . . . . . . . . . . . 37.0 51.7 51.9 54.9 57.9 60.1 62.8 63.7 0.9
Non-OECDNon-OECD Europe and Eurasia. . . 26.7 25.3 25.4 27.5 29.9 31.4 32.1 32.8 1.1Russia . . . . . . . . . . . . . . . . . . . . . . . 17.3 16.2 16.6 18.0 19.1 19.9 20.3 20.8 0.9Other . . . . . . . . . . . . . . . . . . . . . . . . 9.5 9.1 8.8 9.6 10.8 11.5 11.9 12.0 1.3
Non-OECD Asia. . . . . . . . . . . . . . . . 2.9 9.3 9.4 11.5 15.3 18.9 21.9 24.6 4.1China. . . . . . . . . . . . . . . . . . . . . . . . 0.5 1.7 2.0 2.6 3.8 4.9 5.9 6.8 5.2India . . . . . . . . . . . . . . . . . . . . . . . . 0.4 1.3 1.4 1.8 2.4 3.0 3.4 3.7 4.2Other Non-OECD Asia . . . . . . . . . . 2.0 6.4 6.0 7.1 9.1 11.0 12.6 14.2 3.6
Middle East . . . . . . . . . . . . . . . . . . . 3.6 9.8 10.3 11.9 13.4 14.0 14.6 15.2 1.7Africa . . . . . . . . . . . . . . . . . . . . . . . . 1.4 3.0 2.9 3.4 4.4 5.2 5.9 6.3 3.2Central and South America . . . . . . 2.0 4.4 4.5 5.5 6.4 7.2 7.9 8.2 2.5Brazil . . . . . . . . . . . . . . . . . . . . . . . . 0.1 0.7 0.7 1.0 1.2 1.5 1.7 1.8 4.2Other Central and South America. . 1.9 3.7 3.8 4.5 5.2 5.7 6.2 6.4 2.2Total Non-OECD . . . . . . . . . . . . . 36.5 51.8 52.5 59.9 69.4 76.6 82.4 87.2 2.1
Total World . . . . . . . . . . . . . . . . . . . . 73.5 103.4 104.4 114.8 127.4 136.7 145.1 151.0 1.5aIncludes the 50 States and the District of Columbia.Note: Totals may not equal sum of components due to independent rounding.Sources: History: Energy Information Administration (EIA), International Energy Annual 2006 (June-December 2008), web site
www.eia.doe.gov/iea. Projections: EIA, Annual Energy Outlook 2009, DOE/EIA-0383(2009) (Washington, DC, March 2009),AEO2009 National Energy Modeling System, run LP2009.D122308A, web site www.eia.doe.gov/oiaf/aeo; and World Energy Projec-tions Plus (2009).

Table E6. World Coal Consumption by Region, Low Oil Price Case, 1990-2030(Quadrillion Btu)
Low Oil Price Case Projections
Energy Information Administration / International Energy Outlook 2009 193
Region/Country
History Projections Average AnnualPercent Change,
2006-20301990 2005 2006 2010 2015 2020 2025 2030
OECDOECD North America . . . . . . . . . . . 20.6 24.7 24.3 24.8 25.5 25.9 26.2 28.2 0.6United Statesa. . . . . . . . . . . . . . . . . 19.2 22.8 22.5 22.9 23.6 23.9 24.1 26.0 0.6Canada . . . . . . . . . . . . . . . . . . . . . . 1.2 1.5 1.4 1.5 1.5 1.6 1.6 1.6 0.6Mexico. . . . . . . . . . . . . . . . . . . . . . . 0.2 0.4 0.4 0.4 0.4 0.4 0.5 0.6 1.5
OECD Europe . . . . . . . . . . . . . . . . . 17.7 12.9 13.2 13.0 12.8 12.4 12.2 12.1 -0.4OECD Asia . . . . . . . . . . . . . . . . . . . . 5.2 9.3 9.4 9.5 9.6 9.5 9.7 9.9 0.2Japan . . . . . . . . . . . . . . . . . . . . . . . 2.7 4.6 4.6 4.5 4.5 4.3 4.2 4.0 -0.6South Korea . . . . . . . . . . . . . . . . . . 1.0 2.1 2.2 2.4 2.5 2.5 2.7 3.0 1.2Australia/New Zealand . . . . . . . . . . 1.5 2.6 2.6 2.6 2.6 2.7 2.7 2.9 0.5Total OECD . . . . . . . . . . . . . . . . . 43.5 46.9 46.9 47.4 47.9 47.9 48.1 50.1 0.3
Non-OECDNon-OECD Europe and Eurasia. . . 15.1 8.9 8.7 9.2 9.5 9.3 9.2 9.4 0.3Russia . . . . . . . . . . . . . . . . . . . . . . . 7.2 4.8 4.6 5.0 5.2 5.1 5.1 5.2 0.5Other . . . . . . . . . . . . . . . . . . . . . . . . 7.9 4.1 4.2 4.3 4.3 4.2 4.2 4.2 0.0
Non-OECD Asia. . . . . . . . . . . . . . . . 27.0 60.4 66.5 78.7 87.8 98.5 111.1 122.6 2.6China. . . . . . . . . . . . . . . . . . . . . . . . 20.3 46.9 52.0 62.9 70.5 79.7 90.2 98.5 2.7India . . . . . . . . . . . . . . . . . . . . . . . . 4.2 8.6 9.4 10.3 11.3 12.1 12.9 14.2 1.7Other Non-OECD Asia . . . . . . . . . . 2.6 4.9 5.1 5.5 6.1 6.7 8.0 9.9 2.8
Middle East . . . . . . . . . . . . . . . . . . . 0.1 0.4 0.4 0.4 0.4 0.4 0.4 0.4 0.5Africa . . . . . . . . . . . . . . . . . . . . . . . . 3.0 4.2 4.2 4.3 4.4 4.6 4.8 5.3 1.0Central and South America . . . . . . 0.6 0.9 0.8 0.9 1.1 1.2 1.4 1.6 2.8Brazil . . . . . . . . . . . . . . . . . . . . . . . . 0.3 0.4 0.4 0.5 0.6 0.7 0.9 1.0 3.6Other Central and South America. . 0.2 0.4 0.4 0.4 0.4 0.4 0.5 0.6 1.8Total Non-OECD . . . . . . . . . . . . . 45.7 74.8 80.6 93.5 103.2 114.0 127.0 139.3 2.3
Total World . . . . . . . . . . . . . . . . . . . . 89.2 121.7 127.5 140.9 151.0 161.9 175.0 189.4 1.7aIncludes the 50 States and the District of Columbia.Notes: Totals may not equal sum of components due to independent rounding.Sources: History: Energy Information Administration (EIA), International Energy Annual 2006 (June-December 2008), web site
www.eia.doe.gov/iea. Projections: EIA, Annual Energy Outlook 2009, DOE/EIA-0383(2009) (Washington, DC, March 2009),AEO2009 National Energy Modeling System, run LP2009.D122308A, web site www.eia.doe.gov/oiaf/aeo; and World Energy Projec-tions Plus (2009).

Table E7. World Nuclear Energy Consumption by Region, Low Oil Price Case, 1990-2030(Billion Kilowatthours)
Appendix E
194 Energy Information Administration / International Energy Outlook 2009
Region/Country
History Projections Average AnnualPercent Change,
2006-20301990 2005 2006 2010 2015 2020 2025 2030
OECDOECD North America . . . . . . . . . . . 649 880 891 928 954 981 993 1,020 0.6
United Statesa. . . . . . . . . . . . . . . . . 577 782 787 809 831 852 856 876 0.4Canada . . . . . . . . . . . . . . . . . . . . . . 69 87 93 108 112 118 126 133 1.5Mexico. . . . . . . . . . . . . . . . . . . . . . . 3 10 10 10 10 10 10 10 0.1
OECD Europe . . . . . . . . . . . . . . . . . 743 932 929 922 913 904 895 899 -0.1OECD Asia . . . . . . . . . . . . . . . . . . . . 242 429 430 440 492 544 581 622 1.6Japan . . . . . . . . . . . . . . . . . . . . . . . 192 290 288 299 318 335 358 380 1.2South Korea . . . . . . . . . . . . . . . . . . 50 139 141 141 173 208 224 241 2.3Australia/New Zealand . . . . . . . . . . 0 0 0 0 0 0 0 0 —Total OECD . . . . . . . . . . . . . . . . . 1,635 2,240 2,250 2,290 2,359 2,428 2,469 2,541 0.5
Non-OECDNon-OECD Europe and Eurasia. . . 219 264 269 283 340 422 491 517 2.8Russia . . . . . . . . . . . . . . . . . . . . . . . 115 140 144 155 196 249 306 327 3.5Other . . . . . . . . . . . . . . . . . . . . . . . . 104 124 124 128 144 172 185 190 1.8
Non-OECD Asia. . . . . . . . . . . . . . . . 38 106 111 150 288 453 598 676 7.8China. . . . . . . . . . . . . . . . . . . . . . . . 0 50 55 65 163 273 365 424 8.9India . . . . . . . . . . . . . . . . . . . . . . . . 6 16 16 37 65 103 133 148 9.8Other Non-OECD Asia . . . . . . . . . . 32 40 40 48 60 76 99 103 4.0
Middle East . . . . . . . . . . . . . . . . . . . 0 0 0 0 6 12 12 12 —Africa . . . . . . . . . . . . . . . . . . . . . . . . 8 12 10 14 15 15 21 21 3.2Central and South America . . . . . . 9 16 21 22 28 33 34 34 2.0Brazil . . . . . . . . . . . . . . . . . . . . . . . . 2 10 14 15 18 21 22 22 2.0Other Central and South America. . 7 6 7 8 10 12 12 12 2.0Total Non-OECD . . . . . . . . . . . . . 274 399 411 469 676 935 1,156 1,260 4.8
Total World . . . . . . . . . . . . . . . . . . . . 1,909 2,639 2,660 2,760 3,035 3,364 3,625 3,801 1.5aIncludes the 50 States and the District of Columbia.Note: Totals may not equal sum of components due to independent rounding.Sources: History: Energy Information Administration (EIA), International Energy Annual 2006 (June-December 2008), web site
www.eia.doe.gov/iea. Projections: EIA, Annual Energy Outlook 2009, DOE/EIA-0383(2009) (Washington, DC, March 2009),AEO2009 National Energy Modeling System, run LP2009.D122308A, web site www.eia.doe.gov/oiaf/aeo; and World Energy Projec-tions Plus (2009).

Table E8. World Consumption of Hydroelectricity and Other Renewable Energy by Region,Low Oil Price Case, 1990-2030(Quadrillion Btu)
Low Oil Price Case Projections
Energy Information Administration / International Energy Outlook 2009 195
Region/Country
History Projections Average AnnualPercent Change,
2006-20301990 2005 2006 2010 2015 2020 2025 2030
OECDOECD North America . . . . . . . . . . . 9.7 10.3 10.5 11.8 13.3 14.7 16.0 16.8 2.0
United Statesa. . . . . . . . . . . . . . . . . 6.2 6.1 6.5 7.4 8.3 9.4 10.2 10.8 2.2Canada . . . . . . . . . . . . . . . . . . . . . . 3.1 3.7 3.6 3.9 4.4 4.7 5.0 5.4 1.7Mexico. . . . . . . . . . . . . . . . . . . . . . . 0.3 0.4 0.5 0.5 0.6 0.6 0.7 0.7 1.8
OECD Europe . . . . . . . . . . . . . . . . . 4.8 6.5 6.6 8.5 10.3 11.8 13.2 14.3 3.3OECD Asia . . . . . . . . . . . . . . . . . . . . 1.6 1.6 1.7 2.1 2.6 2.8 2.9 3.0 2.4Japan . . . . . . . . . . . . . . . . . . . . . . . 1.1 1.0 1.1 1.3 1.4 1.5 1.5 1.5 1.2South Korea . . . . . . . . . . . . . . . . . . 0.0 0.0 0.0 0.1 0.1 0.1 0.1 0.1 5.2Australia/New Zealand . . . . . . . . . . 0.4 0.5 0.5 0.7 1.1 1.2 1.3 1.3 4.2Total OECD . . . . . . . . . . . . . . . . . 16.0 18.3 18.8 22.4 26.2 29.3 32.1 34.1 2.5
Non-OECDNon-OECD Europe and Eurasia. . . 2.8 3.1 3.0 3.2 3.4 3.5 3.7 3.8 0.9Russia . . . . . . . . . . . . . . . . . . . . . . . 1.8 1.8 1.8 1.9 2.0 2.2 2.3 2.4 1.3Other . . . . . . . . . . . . . . . . . . . . . . . . 1.0 1.3 1.3 1.3 1.3 1.4 1.4 1.4 0.3
Non-OECD Asia. . . . . . . . . . . . . . . . 3.0 6.6 7.2 10.7 14.6 18.1 19.4 22.3 4.8China. . . . . . . . . . . . . . . . . . . . . . . . 1.3 4.0 4.3 7.0 9.5 11.8 12.3 14.7 5.2India . . . . . . . . . . . . . . . . . . . . . . . . 0.7 1.1 1.2 1.6 2.1 2.6 3.0 3.2 4.2Other Non-OECD Asia . . . . . . . . . . 0.9 1.6 1.6 2.1 2.9 3.7 4.1 4.4 4.3
Middle East . . . . . . . . . . . . . . . . . . . 0.1 0.2 0.2 0.3 0.4 0.4 0.5 0.5 3.3Africa . . . . . . . . . . . . . . . . . . . . . . . . 0.6 0.9 0.9 1.0 1.3 1.4 1.5 1.5 2.0Central and South America . . . . . . 3.9 6.4 6.6 7.8 8.6 9.5 10.5 11.4 2.3
Brazil . . . . . . . . . . . . . . . . . . . . . . . . 2.2 3.5 3.6 4.4 5.1 5.8 6.6 7.3 3.0Other Central and South America. . 1.7 2.9 3.0 3.3 3.5 3.7 3.9 4.2 1.3Total Non-OECD . . . . . . . . . . . . . 10.3 17.2 18.0 23.0 28.1 33.0 35.6 39.6 3.3
Total World . . . . . . . . . . . . . . . . . . . . 26.3 35.5 36.8 45.4 54.3 62.3 67.6 73.7 2.9aIncludes the 50 States and the District of Columbia.Notes: Totals may not equal sum of components due to independent rounding. U.S. totals include net electricity imports, methanol,
and liquid hydrogen. Numbers for the United States in this table are based on the published AEO2009 reference case (March 2009).In the updated AEO2009 reference case (April 2009), which incorporates provisions from the American Recovery and ReinvestmentAct of 2009 (ARRA2009) that stimulate increased renewable generation, greater use of renewable fuels is projected. U.S. consump-tion of hydroelectricity and other renewable energy is projected to be 9.4 quadrillion Btu in 2015 in the updated AEO2009 referencecase—10 percent higher than in the earlier projections reported in this table.
Sources: History: Energy Information Administration (EIA), International Energy Annual 2006 (June-December 2008), web sitewww.eia.doe.gov/iea. Projections: EIA, Annual Energy Outlook 2009, DOE/EIA-0383(2009) (Washington, DC, March 2009),AEO2009 National Energy Modeling System, run LP2009.D122308A, web site www.eia.doe.gov/oiaf/aeo; and World Energy Projec-tions Plus (2009).

Table E9. World Carbon Dioxide Emissions by Region, Low Oil Price Case, 1990-2030(Million Metric Tons Carbon Dioxide)
Appendix E
196 Energy Information Administration / International Energy Outlook 2009
Region/Country
History Projections Average AnnualPercent Change,
2006-20301990 2005 2006 2010 2015 2020 2025 2030
OECDOECD North America . . . . . . . . . . . 5,762 7,007 6,948 6,859 7,269 7,457 7,693 8,155 0.7United Statesa. . . . . . . . . . . . . . . . . 4,989 5,975 5,907 5,866 6,172 6,262 6,416 6,792 0.6Canada . . . . . . . . . . . . . . . . . . . . . . 471 629 611 622 667 706 740 772 1.0Mexico. . . . . . . . . . . . . . . . . . . . . . . 302 403 431 371 429 488 537 590 1.3
OECD Europe . . . . . . . . . . . . . . . . . 4,149 4,424 4,429 4,341 4,511 4,639 4,700 4,762 0.3OECD Asia . . . . . . . . . . . . . . . . . . . . 1,595 2,200 2,216 2,224 2,356 2,419 2,449 2,484 0.5
Japan . . . . . . . . . . . . . . . . . . . . . . . 1,054 1,250 1,247 1,171 1,240 1,267 1,241 1,215 -0.1South Korea . . . . . . . . . . . . . . . . . . 243 497 515 599 638 647 685 721 1.4Australia/New Zealand . . . . . . . . . . 298 454 455 454 478 504 523 549 0.8Total OECD . . . . . . . . . . . . . . . . . 11,506 13,632 13,594 13,423 14,137 14,514 14,841 15,400 0.5
Non-OECDNon-OECD Europe and Eurasia. . . 4,246 2,889 2,886 3,069 3,291 3,399 3,446 3,518 0.8Russia . . . . . . . . . . . . . . . . . . . . . . . 2,393 1,699 1,704 1,801 1,924 1,984 1,991 2,022 0.7Other . . . . . . . . . . . . . . . . . . . . . . . . 1,853 1,190 1,182 1,268 1,368 1,415 1,455 1,496 1.0
Non-OECD Asia. . . . . . . . . . . . . . . . 3,678 8,305 8,987 10,488 12,127 13,921 15,794 17,551 2.8China. . . . . . . . . . . . . . . . . . . . . . . . 2,293 5,429 6,018 7,239 8,317 9,581 10,914 11,990 2.9India . . . . . . . . . . . . . . . . . . . . . . . . 573 1,192 1,292 1,369 1,603 1,831 1,990 2,188 2.2Other Non-OECD Asia . . . . . . . . . . 811 1,684 1,678 1,880 2,207 2,508 2,890 3,373 3.0
Middle East . . . . . . . . . . . . . . . . . . . 704 1,393 1,456 1,684 1,885 2,024 2,202 2,435 2.2Africa . . . . . . . . . . . . . . . . . . . . . . . . 659 985 982 1,089 1,208 1,301 1,397 1,492 1.8Central and South America . . . . . . 695 1,093 1,123 1,315 1,439 1,530 1,653 1,780 1.9Brazil . . . . . . . . . . . . . . . . . . . . . . . . 235 366 374 438 513 579 655 735 2.9Other Central and South America. . 460 727 749 877 926 950 998 1,045 1.4Total Non-OECD . . . . . . . . . . . . . 9,982 14,664 15,434 17,645 19,951 22,175 24,492 26,776 2.3
Total World . . . . . . . . . . . . . . . . . . . . 21,488 28,296 29,028 31,068 34,087 36,689 39,333 42,176 1.6aIncludes the 50 States and the District of Columbia.Note: The U.S. numbers include carbon dioxide emissions attributable to renewable energy sources.Sources: History: Energy Information Administration (EIA), International Energy Annual 2006 (June-December 2008), web site
www.eia.doe.gov/iea. Projections: EIA, Annual Energy Outlook 2009, DOE/EIA-0383(2009) (Washington, DC, March 2009),AEO2009 National Energy Modeling System, run LP2009.D122308A, web site www.eia.doe.gov/oiaf/aeo; and World Energy Projec-tions Plus (2009).

Table E10. World Carbon Dioxide Emissions from Liquids Use by Region, Low Oil Price Case, 1990-2030(Million Metric Tons Carbon Dioxide)
Low Oil Price Case Projections
Energy Information Administration / International Energy Outlook 2009 197
Region/Country
History Projections Average AnnualPercent Change,
2006-20301990 2005 2006 2010 2015 2020 2025 2030
OECDOECD North America . . . . . . . . . . . 2,637 3,188 3,159 2,944 3,217 3,324 3,437 3,695 0.7United Statesa. . . . . . . . . . . . . . . . . 2,178 2,620 2,596 2,451 2,670 2,731 2,813 3,037 0.7Canada . . . . . . . . . . . . . . . . . . . . . . 227 301 295 295 316 329 343 359 0.8Mexico. . . . . . . . . . . . . . . . . . . . . . . 233 267 268 198 231 263 281 299 0.5
OECD Europe . . . . . . . . . . . . . . . . . 1,884 2,134 2,135 1,978 2,109 2,211 2,245 2,284 0.3OECD Asia . . . . . . . . . . . . . . . . . . . . 945 1,028 1,014 990 1,083 1,130 1,141 1,154 0.5
Japan . . . . . . . . . . . . . . . . . . . . . . . 687 641 626 554 611 645 633 624 0.0South Korea . . . . . . . . . . . . . . . . . . 144 239 237 299 316 314 326 336 1.5Australia/New Zealand . . . . . . . . . . 114 148 151 137 155 171 181 194 1.1Total OECD . . . . . . . . . . . . . . . . . 5,466 6,350 6,308 5,912 6,408 6,665 6,822 7,133 0.5
Non-OECDNon-OECD Europe and Eurasia. . . 1,368 686 692 713 784 824 841 863 0.9Russia . . . . . . . . . . . . . . . . . . . . . . . 782 383 389 375 415 438 430 424 0.4Other . . . . . . . . . . . . . . . . . . . . . . . . 586 303 303 339 369 387 411 439 1.6
Non-OECD Asia. . . . . . . . . . . . . . . . 960 2,077 2,170 2,415 2,980 3,571 4,083 4,600 3.2China. . . . . . . . . . . . . . . . . . . . . . . . 335 889 960 1,130 1,422 1,754 2,031 2,272 3.7India . . . . . . . . . . . . . . . . . . . . . . . . 160 314 332 305 414 531 590 655 2.9Other Non-OECD Asia . . . . . . . . . . 466 874 878 980 1,144 1,286 1,462 1,674 2.7
Middle East . . . . . . . . . . . . . . . . . . . 491 814 849 987 1,105 1,210 1,355 1,548 2.5Africa . . . . . . . . . . . . . . . . . . . . . . . . 302 423 424 496 546 576 610 642 1.7Central and South America . . . . . . 525 761 790 913 976 1,012 1,078 1,164 1.6Brazil . . . . . . . . . . . . . . . . . . . . . . . . 197 288 294 332 387 430 478 538 2.5Other Central and South America. . 328 473 496 581 589 582 600 626 1.0Total Non-OECD . . . . . . . . . . . . . 3,646 4,760 4,926 5,524 6,391 7,193 7,967 8,817 2.5
Total World . . . . . . . . . . . . . . . . . . . . 9,112 11,110 11,234 11,436 12,799 13,858 14,789 15,950 1.5aIncludes the 50 States and the District of Columbia.Sources: History: Energy Information Administration (EIA), International Energy Annual 2006 (June-December 2008), web site
www.eia.doe.gov/iea. Projections: EIA, Annual Energy Outlook 2009, DOE/EIA-0383(2009) (Washington, DC, March 2009),AEO2009 National Energy Modeling System, run LP2009.D122308A, web site www.eia.doe.gov/oiaf/aeo; and World Energy Projec-tions Plus (2009).

Table E11. World Carbon Dioxide Emissions from Natural Gas Use by Region, Low Oil Price Case,1990-2030(Million Metric Tons Carbon Dioxide)
Appendix E
198 Energy Information Administration / International Energy Outlook 2009
Region/Country
History Projections Average AnnualPercent Change,
2006-20301990 2005 2006 2010 2015 2020 2025 2030
OECDOECD North America . . . . . . . . . . . 1,208 1,468 1,465 1,549 1,619 1,659 1,753 1,772 0.8United Statesa. . . . . . . . . . . . . . . . . 1,026 1,183 1,159 1,225 1,249 1,245 1,296 1,275 0.4Canada . . . . . . . . . . . . . . . . . . . . . . 128 185 181 189 212 231 247 260 1.5Mexico. . . . . . . . . . . . . . . . . . . . . . . 54 100 125 135 158 183 210 237 2.7
OECD Europe . . . . . . . . . . . . . . . . . 593 1,053 1,047 1,116 1,180 1,241 1,291 1,323 1.0OECD Asia . . . . . . . . . . . . . . . . . . . . 165 306 323 345 379 398 405 408 1.0
Japan . . . . . . . . . . . . . . . . . . . . . . . 115 181 191 197 213 219 218 215 0.5South Korea . . . . . . . . . . . . . . . . . . 6 64 68 77 91 97 103 106 1.8Australia/New Zealand . . . . . . . . . . 44 61 64 70 75 82 83 87 1.3Total OECD . . . . . . . . . . . . . . . . . 1,966 2,827 2,835 3,010 3,178 3,298 3,449 3,503 0.9
Non-OECDNon-OECD Europe and Eurasia. . . 1,457 1,367 1,371 1,487 1,616 1,695 1,736 1,772 1.1Russia . . . . . . . . . . . . . . . . . . . . . . . 933 865 889 961 1,023 1,065 1,086 1,113 0.9Other . . . . . . . . . . . . . . . . . . . . . . . . 524 502 482 526 594 630 650 659 1.3
Non-OECD Asia. . . . . . . . . . . . . . . . 161 508 510 624 833 1,025 1,189 1,339 4.1China. . . . . . . . . . . . . . . . . . . . . . . . 30 92 111 146 211 269 325 375 5.2India . . . . . . . . . . . . . . . . . . . . . . . . 24 70 76 99 132 165 188 202 4.2Other Non-OECD Asia . . . . . . . . . . 106 347 324 379 490 591 677 762 3.6
Middle East . . . . . . . . . . . . . . . . . . . 200 543 571 661 743 777 810 848 1.7Africa . . . . . . . . . . . . . . . . . . . . . . . . 80 168 168 196 250 297 335 359 3.2Central and South America . . . . . . 117 250 255 312 363 406 447 465 2.5Brazil . . . . . . . . . . . . . . . . . . . . . . . . 6 36 38 54 66 80 95 101 4.2Other Central and South America. . 111 214 218 258 297 326 352 365 2.2Total Non-OECD . . . . . . . . . . . . . 2,015 2,837 2,876 3,281 3,806 4,200 4,517 4,784 2.1
Total World . . . . . . . . . . . . . . . . . . . . 3,981 5,664 5,712 6,291 6,984 7,498 7,965 8,286 1.6aIncludes the 50 States and the District of Columbia.Sources: History: Energy Information Administration (EIA), International Energy Annual 2006 (June-December 2008), web site
www.eia.doe.gov/iea. Projections: EIA, Annual Energy Outlook 2009, DOE/EIA-0383(2009) (Washington, DC, March 2009),AEO2009 National Energy Modeling System, run LP2009.D122308A, web site www.eia.doe.gov/oiaf/aeo; and World Energy Projec-tions Plus (2009).

Table E12. World Carbon Dioxide Emissions from Coal Use by Region, Low Oil Price Case, 1990-2030(Million Metric Tons Carbon Dioxide)
Low Oil Price Case Projections
Energy Information Administration / International Energy Outlook 2009 199
Region/Country
History Projections Average AnnualPercent Change,
2006-20301990 2005 2006 2010 2015 2020 2025 2030
OECDOECD North America . . . . . . . . . . . 1,916 2,339 2,312 2,355 2,421 2,462 2,492 2,676 0.6United Statesa. . . . . . . . . . . . . . . . . 1,784 2,161 2,140 2,178 2,242 2,275 2,295 2,468 0.6Canada . . . . . . . . . . . . . . . . . . . . . . 116 142 134 138 140 145 151 153 0.6Mexico. . . . . . . . . . . . . . . . . . . . . . . 16 36 38 38 39 42 46 54 1.5
OECD Europe . . . . . . . . . . . . . . . . . 1,672 1,237 1,247 1,247 1,222 1,187 1,164 1,155 -0.3OECD Asia . . . . . . . . . . . . . . . . . . . . 485 866 879 889 894 890 903 923 0.2
Japan . . . . . . . . . . . . . . . . . . . . . . . 252 427 430 420 415 403 389 376 -0.6South Korea . . . . . . . . . . . . . . . . . . 93 194 209 223 231 237 256 279 1.2Australia/New Zealand . . . . . . . . . . 140 244 240 247 248 251 258 268 0.5Total OECD . . . . . . . . . . . . . . . . . 4,073 4,443 4,438 4,491 4,538 4,539 4,559 4,753 0.3
Non-OECDNon-OECD Europe and Eurasia. . . 1,421 836 823 869 891 880 869 883 0.3Russia . . . . . . . . . . . . . . . . . . . . . . . 678 451 427 466 486 482 475 485 0.5Other . . . . . . . . . . . . . . . . . . . . . . . . 743 385 396 403 405 398 394 398 0.0
Non-OECD Asia. . . . . . . . . . . . . . . . 2,557 5,720 6,307 7,448 8,314 9,325 10,521 11,611 2.6China. . . . . . . . . . . . . . . . . . . . . . . . 1,929 4,449 4,947 5,963 6,684 7,558 8,559 9,342 2.7India . . . . . . . . . . . . . . . . . . . . . . . . 389 808 883 965 1,057 1,135 1,212 1,331 1.7Other Non-OECD Asia . . . . . . . . . . 239 463 476 520 573 632 751 938 2.9
Middle East . . . . . . . . . . . . . . . . . . . 14 36 36 35 36 36 37 39 0.3Africa . . . . . . . . . . . . . . . . . . . . . . . . 277 394 389 398 413 428 453 491 1.0Central and South America . . . . . . 53 81 77 89 100 112 128 150 2.8Brazil . . . . . . . . . . . . . . . . . . . . . . . . 32 42 42 51 60 70 82 96 3.5Other Central and South America. . 21 40 36 38 40 42 46 54 1.8Total Non-OECD . . . . . . . . . . . . . 4,321 7,067 7,632 8,839 9,754 10,781 12,008 13,174 2.3
Total World . . . . . . . . . . . . . . . . . . . . 8,394 11,510 12,070 13,330 14,292 15,320 16,567 17,928 1.7aIncludes the 50 States and the District of Columbia.Sources: History: Energy Information Administration (EIA), International Energy Annual 2006 (June-December 2008), web site
www.eia.doe.gov/iea. Projections: EIA, Annual Energy Outlook 2009, DOE/EIA-0383(2009) (Washington, DC, March 2009),AEO2009 National Energy Modeling System, run LP2009.D122308A, web site www.eia.doe.gov/oiaf/aeo; and World Energy Projec-tions Plus (2009).


Appendix F
Reference Case Projectionsby End-Use Sector and Country Grouping


Table F1. Total World Delivered Energy Consumption by End-Use Sector and Fuel, 2006-2030(Quadrillion Btu)
Reference Case Projections by End-Use Sector and Country Grouping
Energy Information Administration / International Energy Outlook 2009 203
Sector/Fuel 2006
Projections Average AnnualPercent Change,
2006-20302010 2015 2020 2025 2030ResidentialLiquids . . . . . . . . . . . . . . . . . . . . . . . . . . 10.4 10.1 9.8 10.0 10.1 10.1 -0.1Natural Gas . . . . . . . . . . . . . . . . . . . . . . 20.1 21.3 22.4 23.2 23.9 24.9 0.9Coal . . . . . . . . . . . . . . . . . . . . . . . . . . . . 4.2 4.1 4.1 4.0 4.0 3.9 -0.3Electricity . . . . . . . . . . . . . . . . . . . . . . . . 15.2 16.9 18.9 21.2 23.6 26.3 2.3Renewables. . . . . . . . . . . . . . . . . . . . . . 0.4 0.4 0.5 0.5 0.5 0.5 1.1
Total . . . . . . . . . . . . . . . . . . . . . . . . . . 50.3 52.8 55.6 58.9 62.1 65.7 1.1CommercialLiquids . . . . . . . . . . . . . . . . . . . . . . . . . . 4.9 4.5 4.4 4.5 4.6 4.6 -0.2Natural Gas . . . . . . . . . . . . . . . . . . . . . . 7.5 7.9 8.3 8.6 8.9 9.2 0.8Coal . . . . . . . . . . . . . . . . . . . . . . . . . . . . 0.9 0.9 0.9 0.9 0.9 1.0 0.3Electricity . . . . . . . . . . . . . . . . . . . . . . . . 13.0 14.3 16.0 18.1 20.4 22.8 2.4Renewables. . . . . . . . . . . . . . . . . . . . . . 0.1 0.1 0.1 0.1 0.1 0.1 0.0
Total . . . . . . . . . . . . . . . . . . . . . . . . . . 26.4 27.8 29.8 32.2 34.9 37.7 1.5IndustrialLiquids . . . . . . . . . . . . . . . . . . . . . . . . . . 60.5 59.2 61.8 64.9 67.6 70.3 0.6Natural Gas . . . . . . . . . . . . . . . . . . . . . . 42.3 46.4 52.3 56.1 59.8 62.9 1.7Coal . . . . . . . . . . . . . . . . . . . . . . . . . . . . 43.4 46.4 50.3 54.7 57.8 59.7 1.3Electricity . . . . . . . . . . . . . . . . . . . . . . . . 26.2 31.0 35.7 40.1 44.5 48.4 2.6Renewables. . . . . . . . . . . . . . . . . . . . . . 2.7 2.9 3.2 3.6 4.1 4.3 2.0
Total . . . . . . . . . . . . . . . . . . . . . . . . . . 175.0 185.9 203.3 219.4 233.7 245.6 1.4TransportationLiquids . . . . . . . . . . . . . . . . . . . . . . . . . . 87.5 90.9 97.2 105.1 112.9 121.4 1.4Natural Gas . . . . . . . . . . . . . . . . . . . . . . 3.4 4.0 4.4 4.7 4.9 5.1 1.7Coal . . . . . . . . . . . . . . . . . . . . . . . . . . . . 0.2 0.2 0.2 0.1 0.0 0.0 —Electricity . . . . . . . . . . . . . . . . . . . . . . . . 0.9 1.0 1.0 1.1 1.1 1.2 1.0Total . . . . . . . . . . . . . . . . . . . . . . . . . . 91.9 96.0 102.8 111.0 118.9 127.7 1.4
All End-Use SectorsLiquids . . . . . . . . . . . . . . . . . . . . . . . . . . 163.2 164.7 173.3 184.5 195.1 206.4 1.0Natural Gas . . . . . . . . . . . . . . . . . . . . . . 73.3 79.6 87.4 92.6 97.5 102.1 1.4Coal . . . . . . . . . . . . . . . . . . . . . . . . . . . . 48.7 51.5 55.4 59.8 62.7 64.6 1.2Electricity . . . . . . . . . . . . . . . . . . . . . . . . 55.2 63.2 71.6 80.4 89.5 98.6 2.4Renewables. . . . . . . . . . . . . . . . . . . . . . 3.2 3.5 3.8 4.2 4.7 5.0 1.8
Delivered Energy . . . . . . . . . . . . . . . . 343.6 362.6 391.5 421.5 449.6 476.7 1.4Electricity-Related Lossesa . . . . . . . . . . 128.9 145.7 160.0 174.3 187.7 201.6 1.9Total . . . . . . . . . . . . . . . . . . . . . . . . . . 472.4 508.3 551.5 595.7 637.3 678.3 1.5
Electric Powerb
Liquids . . . . . . . . . . . . . . . . . . . . . . . . . . 10.1 10.0 10.1 9.7 9.5 9.3 -0.3Natural Gas . . . . . . . . . . . . . . . . . . . . . . 34.3 38.8 43.6 49.1 53.8 55.9 2.1Coal . . . . . . . . . . . . . . . . . . . . . . . . . . . . 79.1 89.1 95.3 101.9 112.5 125.6 1.9Nuclear . . . . . . . . . . . . . . . . . . . . . . . . . 27.8 29.0 31.9 35.4 38.1 40.2 1.5Renewables. . . . . . . . . . . . . . . . . . . . . . 33.6 42.0 50.7 58.5 63.2 69.0 3.0
Total . . . . . . . . . . . . . . . . . . . . . . . . . . 186.3 208.9 231.7 254.7 277.2 300.3 2.0Total Energy ConsumptionLiquids . . . . . . . . . . . . . . . . . . . . . . . . . . 172.4 174.7 183.3 194.2 204.6 215.7 0.9Natural Gas . . . . . . . . . . . . . . . . . . . . . . 108.1 118.5 131.0 141.7 151.3 158.0 1.6Coal . . . . . . . . . . . . . . . . . . . . . . . . . . . . 127.5 140.6 150.7 161.7 175.2 190.2 1.7Nuclear . . . . . . . . . . . . . . . . . . . . . . . . . 27.8 29.0 31.9 35.4 38.1 40.2 1.6Renewables. . . . . . . . . . . . . . . . . . . . . . 36.8 45.6 54.6 62.8 68.1 74.1 3.0
Total . . . . . . . . . . . . . . . . . . . . . . . . . . 472.4 508.3 551.5 595.7 637.3 678.3 1.5aElectricity losses incurred in the transmission and distribution of electric power. May include some heat production.bFuel inputs used in the production of electricity and heat at central-station generators.Sources: 2006: Derived from Energy Information Administration (EIA), International Energy Annual 2006 (June-December 2008), web site
www.eia. doe.gov/iea. Projections: EIA, Annual Energy Outlook 2009, DOE/EIA-0383(2009) (Washington, DC, March 2009), AEO2009 NationalEnergy Modeling System, run AEO2009.D120908A, web site www.eia.doe.gov/oiaf/aeo; and World Energy Projections Plus (2009).

Table F2. Total OECD Delivered Energy Consumption by End-Use Sector and Fuel, 2006-2030(Quadrillion Btu)
Appendix F
204 Energy Information Administration / International Energy Outlook 2009
Sector/Fuel 2006
Projections Average AnnualPercent Change,
2006-20302010 2015 2020 2025 2030ResidentialLiquids . . . . . . . . . . . . . . . . . . . . . . . . . . 5.0 4.7 4.5 4.6 4.5 4.5 -0.5Natural Gas . . . . . . . . . . . . . . . . . . . . . . 11.4 11.9 12.2 12.5 12.7 12.8 0.5Coal . . . . . . . . . . . . . . . . . . . . . . . . . . . . 0.6 0.6 0.5 0.5 0.4 0.4 -2.1Electricity . . . . . . . . . . . . . . . . . . . . . . . . 9.8 10.6 11.2 11.8 12.5 13.1 1.2Renewables. . . . . . . . . . . . . . . . . . . . . . 0.4 0.4 0.5 0.5 0.5 0.5 1.1
Total . . . . . . . . . . . . . . . . . . . . . . . . . . 27.2 28.2 28.9 29.8 30.6 31.2 0.6CommercialLiquids . . . . . . . . . . . . . . . . . . . . . . . . . . 3.1 2.8 2.8 2.9 2.9 2.9 -0.3Natural Gas . . . . . . . . . . . . . . . . . . . . . . 6.1 6.4 6.6 6.7 6.9 7.0 0.6Coal . . . . . . . . . . . . . . . . . . . . . . . . . . . . 0.2 0.2 0.2 0.2 0.2 0.1 -0.8Electricity . . . . . . . . . . . . . . . . . . . . . . . . 9.7 10.6 11.5 12.4 13.3 14.1 1.6Renewables. . . . . . . . . . . . . . . . . . . . . . 0.1 0.1 0.1 0.1 0.1 0.1 0.0
Total . . . . . . . . . . . . . . . . . . . . . . . . . . 19.2 20.1 21.1 22.3 23.3 24.3 1.0IndustrialLiquids . . . . . . . . . . . . . . . . . . . . . . . . . . 31.3 27.8 28.2 28.2 28.2 28.4 -0.4Natural Gas . . . . . . . . . . . . . . . . . . . . . . 19.1 19.5 20.5 21.0 21.7 22.4 0.7Coal . . . . . . . . . . . . . . . . . . . . . . . . . . . . 9.2 8.6 8.5 8.4 8.4 8.5 -0.3Electricity . . . . . . . . . . . . . . . . . . . . . . . . 11.2 11.5 12.3 12.8 13.2 13.7 0.8Renewables. . . . . . . . . . . . . . . . . . . . . . 2.4 2.7 2.9 3.3 3.8 4.1 2.2
Total . . . . . . . . . . . . . . . . . . . . . . . . . . 73.1 70.0 72.3 73.7 75.5 77.1 0.2TransportationLiquids . . . . . . . . . . . . . . . . . . . . . . . . . . 56.4 54.0 55.4 57.1 58.6 60.7 0.3Natural Gas . . . . . . . . . . . . . . . . . . . . . . 1.0 1.1 1.1 1.2 1.3 1.4 1.5Coal . . . . . . . . . . . . . . . . . . . . . . . . . . . . 0.0 0.0 0.0 0.0 0.0 0.0 —Electricity . . . . . . . . . . . . . . . . . . . . . . . . 0.4 0.4 0.4 0.4 0.4 0.4 0.3Total . . . . . . . . . . . . . . . . . . . . . . . . . . 57.8 55.4 57.0 58.8 60.4 62.5 0.3
All End-Use SectorsLiquids . . . . . . . . . . . . . . . . . . . . . . . . . . 95.8 89.3 90.9 92.8 94.3 96.5 0.0Natural Gas . . . . . . . . . . . . . . . . . . . . . . 37.5 38.9 40.5 41.4 42.6 43.5 0.6Coal . . . . . . . . . . . . . . . . . . . . . . . . . . . . 10.0 9.3 9.1 9.0 9.0 9.0 -0.4Electricity . . . . . . . . . . . . . . . . . . . . . . . . 31.1 33.0 35.3 37.4 39.4 41.3 1.2Renewables. . . . . . . . . . . . . . . . . . . . . . 2.9 3.2 3.5 3.9 4.5 4.7 2.0
Delivered Energy . . . . . . . . . . . . . . . 177.3 173.7 179.3 184.6 189.8 195.1 0.4Electricity-Related Lossesa . . . . . . . . . . 64.3 69.1 73.0 76.7 79.7 83.0 1.1Total . . . . . . . . . . . . . . . . . . . . . . . . . . 241.7 242.8 252.4 261.3 269.5 278.2 0.6
Electric Powerb
Liquids . . . . . . . . . . . . . . . . . . . . . . . . . . 3.8 3.1 3.1 3.0 2.9 2.8 -1.3Natural Gas . . . . . . . . . . . . . . . . . . . . . . 15.9 17.8 19.1 21.1 23.1 23.3 1.6Coal . . . . . . . . . . . . . . . . . . . . . . . . . . . . 37.2 38.0 38.7 38.8 39.3 41.6 0.5Nuclear . . . . . . . . . . . . . . . . . . . . . . . . . 23.5 24.0 24.7 25.6 26.0 27.0 0.6Renewables. . . . . . . . . . . . . . . . . . . . . . 15.9 19.1 22.6 25.5 27.7 29.5 2.6
Total . . . . . . . . . . . . . . . . . . . . . . . . . . 96.7 102.1 108.3 114.1 119.1 124.4 1.1Total Energy ConsumptionLiquids . . . . . . . . . . . . . . . . . . . . . . . . . . 98.8 92.4 94.0 95.8 97.2 99.4 0.0Natural Gas . . . . . . . . . . . . . . . . . . . . . . 53.9 56.7 59.6 62.6 65.7 66.8 0.9Coal . . . . . . . . . . . . . . . . . . . . . . . . . . . . 46.9 47.3 47.8 47.9 48.3 50.7 0.3Nuclear . . . . . . . . . . . . . . . . . . . . . . . . . 23.3 24.0 24.7 25.6 26.0 27.0 0.6Renewables. . . . . . . . . . . . . . . . . . . . . . 18.8 22.4 26.3 29.5 32.3 34.3 2.5
Total . . . . . . . . . . . . . . . . . . . . . . . . . . 241.7 242.8 252.4 261.3 269.5 278.2 0.6aElectricity losses incurred in the transmission and distribution of electric power. May include some heat production.bFuel inputs used in the production of electricity and heat at central-station generators.Sources: 2006: Derived from Energy Information Administration (EIA), International Energy Annual 2006 (June-December 2008), web site
www.eia. doe.gov/iea. Projections: EIA, Annual Energy Outlook 2009, DOE/EIA-0383(2009) (Washington, DC, March 2009), AEO2009 NationalEnergy Modeling System, run AEO2009.D120908A, web site www.eia.doe.gov/oiaf/aeo; and World Energy Projections Plus (2009).

Table F3. Delivered Energy Consumption in the United States by End-Use Sector and Fuel, 2006-2030(Quadrillion Btu)
Reference Case Projections by End-Use Sector and Country Grouping
Energy Information Administration / International Energy Outlook 2009 205
Sector/Fuel 2006
Projections Average AnnualPercent Change,
2006-20302010 2015 2020 2025 2030ResidentialLiquids . . . . . . . . . . . . . . . . . . . . . . . . . . 1.3 1.3 1.2 1.2 1.1 1.1 -0.6Natural Gas . . . . . . . . . . . . . . . . . . . . . . 4.5 4.9 5.0 5.1 5.1 5.1 0.5Coal . . . . . . . . . . . . . . . . . . . . . . . . . . . . 0.0 0.0 0.0 0.0 0.0 0.0 -0.4Electricity . . . . . . . . . . . . . . . . . . . . . . . . 4.6 4.8 4.9 5.1 5.4 5.7 0.9Renewables. . . . . . . . . . . . . . . . . . . . . . 0.4 0.4 0.5 0.5 0.5 0.5 1.1
Total . . . . . . . . . . . . . . . . . . . . . . . . . . 10.8 11.4 11.5 11.9 12.1 12.4 0.6CommercialLiquids . . . . . . . . . . . . . . . . . . . . . . . . . . 0.6 0.6 0.6 0.6 0.6 0.6 -0.3Natural Gas . . . . . . . . . . . . . . . . . . . . . . 2.9 3.1 3.2 3.3 3.5 3.5 0.8Coal . . . . . . . . . . . . . . . . . . . . . . . . . . . . 0.1 0.1 0.1 0.1 0.1 0.1 -0.1Electricity . . . . . . . . . . . . . . . . . . . . . . . . 4.4 4.8 5.1 5.6 5.9 6.3 1.5Renewables. . . . . . . . . . . . . . . . . . . . . . 0.1 0.1 0.1 0.1 0.1 0.1 0.0
Total . . . . . . . . . . . . . . . . . . . . . . . . . . 8.2 8.7 9.2 9.7 10.2 10.6 1.1IndustrialLiquids . . . . . . . . . . . . . . . . . . . . . . . . . . 10.1 8.4 8.7 8.3 8.2 8.3 -0.8Natural Gas . . . . . . . . . . . . . . . . . . . . . . 7.8 8.0 8.2 8.2 8.4 8.5 0.3Coal . . . . . . . . . . . . . . . . . . . . . . . . . . . . 1.9 1.8 1.8 1.9 2.0 2.2 0.6Electricity . . . . . . . . . . . . . . . . . . . . . . . . 3.5 3.3 3.5 3.5 3.5 3.7 0.3Renewables. . . . . . . . . . . . . . . . . . . . . . 2.0 2.2 2.5 2.9 3.4 3.6 2.5
Total . . . . . . . . . . . . . . . . . . . . . . . . . . 25.3 23.8 24.8 24.7 25.6 26.3 0.2TransportationLiquids . . . . . . . . . . . . . . . . . . . . . . . . . . 28.0 27.1 27.9 28.4 29.4 31.1 0.4Natural Gas . . . . . . . . . . . . . . . . . . . . . . 0.6 0.7 0.7 0.8 0.8 0.8 1.1Coal . . . . . . . . . . . . . . . . . . . . . . . . . . . . 0.0 0.0 0.0 0.0 0.0 0.0 —Electricity . . . . . . . . . . . . . . . . . . . . . . . . 0.0 0.0 0.0 0.0 0.0 0.1 3.6Total . . . . . . . . . . . . . . . . . . . . . . . . . . 28.6 27.8 28.6 29.1 30.2 31.9 0.5
All End-Use SectorsLiquids . . . . . . . . . . . . . . . . . . . . . . . . . . 40.0 37.4 38.4 38.4 39.3 41.1 0.1Natural Gas . . . . . . . . . . . . . . . . . . . . . . 15.9 16.8 17.2 17.4 17.8 17.9 0.5Coal . . . . . . . . . . . . . . . . . . . . . . . . . . . . 2.0 1.9 1.9 2.0 2.1 2.3 0.6Electricity . . . . . . . . . . . . . . . . . . . . . . . . 12.5 12.9 13.5 14.2 14.9 15.7 1.0Renewables. . . . . . . . . . . . . . . . . . . . . . 2.5 2.8 3.1 3.5 4.0 4.2 2.2
Delivered Energy . . . . . . . . . . . . . . . 72.9 71.7 74.1 75.4 78.2 81.3 0.5Electricity-Related Lossesa . . . . . . . . . . 27.1 28.1 28.8 30.0 30.9 32.3 0.7Total . . . . . . . . . . . . . . . . . . . . . . . . . . 100.0 99.9 102.9 105.4 109.1 113.6 0.5
Electric Powerb
Liquids . . . . . . . . . . . . . . . . . . . . . . . . . . 1.2 0.5 0.5 0.5 0.5 0.5 -3.5Natural Gas . . . . . . . . . . . . . . . . . . . . . . 6.0 6.4 6.2 6.7 7.6 7.1 0.7Coal . . . . . . . . . . . . . . . . . . . . . . . . . . . . 20.7 21.0 21.7 22.0 22.3 24.3 0.7Nuclear . . . . . . . . . . . . . . . . . . . . . . . . . 8.2 8.4 8.7 9.0 9.0 9.5 0.6Renewables. . . . . . . . . . . . . . . . . . . . . . 3.6 4.5 5.1 5.9 6.2 6.5 2.5
Total . . . . . . . . . . . . . . . . . . . . . . . . . . 39.8 41.0 42.3 44.2 45.8 48.0 0.8Total Energy ConsumptionLiquids . . . . . . . . . . . . . . . . . . . . . . . . . . 40.6 37.9 38.9 38.9 39.8 41.6 0.1Natural Gas . . . . . . . . . . . . . . . . . . . . . . 22.3 23.2 23.4 24.1 25.4 25.0 0.5Coal . . . . . . . . . . . . . . . . . . . . . . . . . . . . 22.5 22.9 23.6 24.0 24.4 26.6 0.7Nuclear . . . . . . . . . . . . . . . . . . . . . . . . . 8.2 8.4 8.7 9.0 9.0 9.5 0.6Renewables. . . . . . . . . . . . . . . . . . . . . . 6.5 7.4 8.3 9.5 10.4 10.9 2.2
Total . . . . . . . . . . . . . . . . . . . . . . . . . . 100.0 99.9 102.9 105.4 109.1 113.6 0.5aElectricity losses incurred in the transmission and distribution of electric power. May include some heat production.bFuel inputs used in the production of electricity and heat at central-station generators. Includes net electricity imports.Sources: 2006: Based on Energy Information Administration (EIA), Annual Energy Review 2007, DOE/EIA-0384(2007) (Washington, DC, June
2008). Projections: EIA, Annual Energy Outlook 2009, DOE/EIA-0383(2009) (Washington, DC, March 2009), AEO2009 National Energy ModelingSystem, run AEO2009.D120908A, web site www.eia.doe.gov/oiaf/aeo.

Table F4. Delivered Energy Consumption in Canada by End-Use Sector and Fuel, 2006-2030(Quadrillion Btu)
Appendix F
206 Energy Information Administration / International Energy Outlook 2009
Sector/Fuel 2006
Projections Average AnnualPercent Change,
2006-20302010 2015 2020 2025 2030ResidentialLiquids . . . . . . . . . . . . . . . . . . . . . . . . . . 0.1 0.1 0.1 0.1 0.1 0.1 0.1Natural Gas . . . . . . . . . . . . . . . . . . . . . . 0.6 0.6 0.7 0.7 0.7 0.7 0.6Coal . . . . . . . . . . . . . . . . . . . . . . . . . . . . 0.0 0.0 0.0 0.0 0.0 0.0 -2.3Electricity . . . . . . . . . . . . . . . . . . . . . . . . 0.6 0.6 0.6 0.7 0.7 0.8 1.4Renewables. . . . . . . . . . . . . . . . . . . . . . 0.0 0.0 0.0 0.0 0.0 0.0 —
Total . . . . . . . . . . . . . . . . . . . . . . . . . . 1.3 1.3 1.4 1.4 1.5 1.6 1.0CommercialLiquids . . . . . . . . . . . . . . . . . . . . . . . . . . 0.3 0.3 0.3 0.3 0.3 0.3 0.1Natural Gas . . . . . . . . . . . . . . . . . . . . . . 0.5 0.5 0.5 0.5 0.5 0.6 0.9Coal . . . . . . . . . . . . . . . . . . . . . . . . . . . . 0.0 0.0 0.0 0.0 0.0 0.0 —Electricity . . . . . . . . . . . . . . . . . . . . . . . . 0.5 0.5 0.6 0.7 0.7 0.7 1.7Renewables. . . . . . . . . . . . . . . . . . . . . . 0.0 0.0 0.0 0.0 0.0 0.0 —
Total . . . . . . . . . . . . . . . . . . . . . . . . . . 1.3 1.3 1.4 1.5 1.6 1.6 1.0IndustrialLiquids . . . . . . . . . . . . . . . . . . . . . . . . . . 1.7 1.6 1.6 1.6 1.6 1.7 0.0Natural Gas . . . . . . . . . . . . . . . . . . . . . . 1.9 2.0 2.3 2.5 2.7 2.9 1.8Coal . . . . . . . . . . . . . . . . . . . . . . . . . . . . 0.2 0.2 0.2 0.2 0.2 0.2 1.4Electricity . . . . . . . . . . . . . . . . . . . . . . . . 0.8 0.8 0.8 0.9 1.0 1.0 1.2Renewables. . . . . . . . . . . . . . . . . . . . . . 0.1 0.1 0.1 0.1 0.1 0.1 0.3
Total . . . . . . . . . . . . . . . . . . . . . . . . . . 4.6 4.6 5.0 5.3 5.6 6.0 1.1TransportationLiquids . . . . . . . . . . . . . . . . . . . . . . . . . . 2.2 2.3 2.3 2.4 2.5 2.6 0.7Natural Gas . . . . . . . . . . . . . . . . . . . . . . 0.2 0.2 0.3 0.3 0.3 0.3 2.4Coal . . . . . . . . . . . . . . . . . . . . . . . . . . . . 0.0 0.0 0.0 0.0 0.0 0.0 —Electricity . . . . . . . . . . . . . . . . . . . . . . . . 0.0 0.0 0.0 0.0 0.0 0.0 -3.1Total . . . . . . . . . . . . . . . . . . . . . . . . . . 2.4 2.6 2.6 2.7 2.8 3.0 0.8
All End-Use SectorsLiquids . . . . . . . . . . . . . . . . . . . . . . . . . . 4.3 4.3 4.3 4.4 4.6 4.7 0.4Natural Gas . . . . . . . . . . . . . . . . . . . . . . 3.1 3.3 3.7 4.0 4.3 4.5 1.5Coal . . . . . . . . . . . . . . . . . . . . . . . . . . . . 0.2 0.2 0.2 0.2 0.2 0.2 1.4Electricity . . . . . . . . . . . . . . . . . . . . . . . . 1.8 1.9 2.1 2.3 2.4 2.6 1.4Renewables. . . . . . . . . . . . . . . . . . . . . . 0.1 0.1 0.1 0.1 0.1 0.1 0.3
Delivered Energy . . . . . . . . . . . . . . . 9.6 9.8 10.4 11.0 11.6 12.2 1.0Electricity-Related Lossesa . . . . . . . . . . 4.4 4.9 5.2 5.6 5.9 6.1 1.4
Total . . . . . . . . . . . . . . . . . . . . . . . . . . 14.0 14.6 15.6 16.5 17.4 18.3 1.1Electric Powerb
Liquids . . . . . . . . . . . . . . . . . . . . . . . . . . 0.2 0.2 0.2 0.2 0.2 0.2 -0.6Natural Gas . . . . . . . . . . . . . . . . . . . . . . 0.3 0.3 0.3 0.3 0.4 0.4 1.3Coal . . . . . . . . . . . . . . . . . . . . . . . . . . . . 1.3 1.3 1.3 1.3 1.4 1.4 0.4Nuclear . . . . . . . . . . . . . . . . . . . . . . . . . 1.1 1.2 1.3 1.3 1.4 1.5 1.4Renewables. . . . . . . . . . . . . . . . . . . . . . 3.5 3.8 4.3 4.6 5.0 5.3 1.7
Total . . . . . . . . . . . . . . . . . . . . . . . . . . 6.5 6.8 7.3 7.8 8.3 8.7 1.2Total Energy ConsumptionLiquids . . . . . . . . . . . . . . . . . . . . . . . . . . 4.5 4.5 4.5 4.6 4.7 4.9 0.3Natural Gas . . . . . . . . . . . . . . . . . . . . . . 3.4 3.6 4.0 4.3 4.6 4.9 1.5Coal . . . . . . . . . . . . . . . . . . . . . . . . . . . . 1.4 1.5 1.5 1.5 1.6 1.6 0.5Nuclear . . . . . . . . . . . . . . . . . . . . . . . . . 1.1 1.2 1.3 1.3 1.4 1.5 1.4Renewables. . . . . . . . . . . . . . . . . . . . . . 3.6 3.9 4.4 4.7 5.1 5.4 1.7
Total . . . . . . . . . . . . . . . . . . . . . . . . . . 14.0 14.6 15.6 16.5 17.4 18.3 1.1aElectricity losses incurred in the transmission and distribution of electric power. May include some heat production.bFuel inputs used in the production of electricity and heat at central-station generators.Sources: 2006: Derived from Energy Information Administration (EIA), International Energy Annual 2006 (June-December 2008), web site
www.eia. doe.gov/iea. Projections: EIA, World Energy Projections Plus (2009).
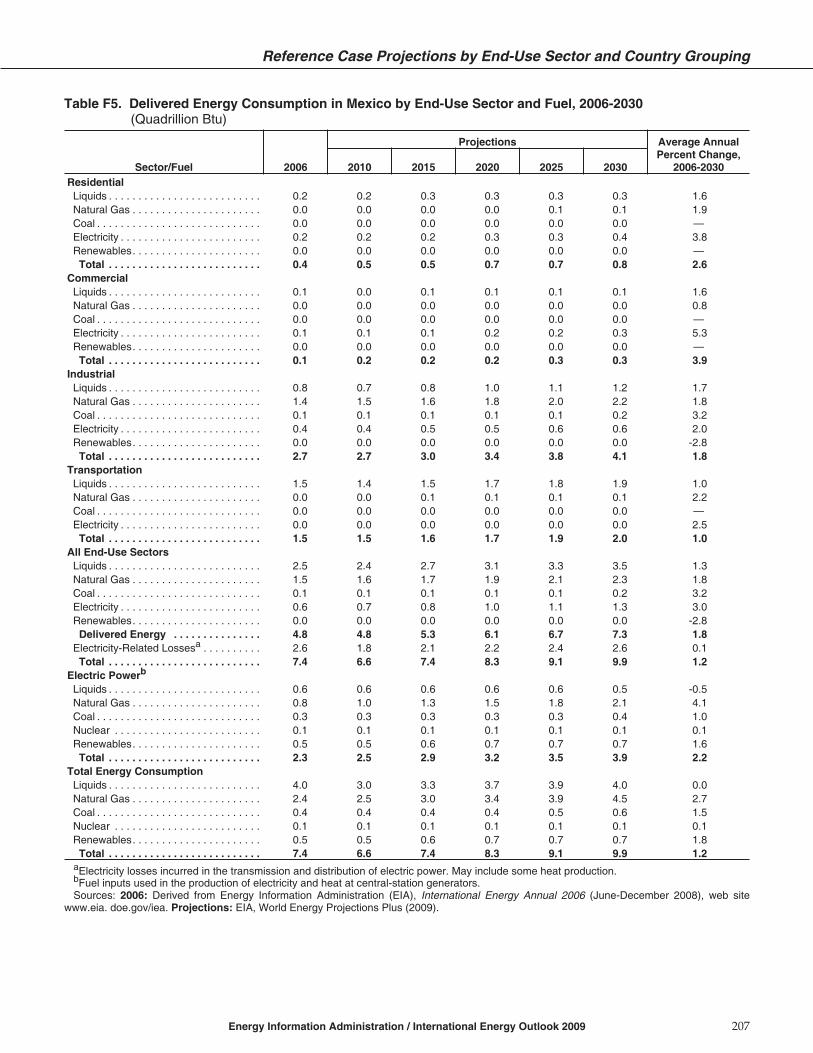
Table F5. Delivered Energy Consumption in Mexico by End-Use Sector and Fuel, 2006-2030(Quadrillion Btu)
Reference Case Projections by End-Use Sector and Country Grouping
Energy Information Administration / International Energy Outlook 2009 207
Sector/Fuel 2006
Projections Average AnnualPercent Change,
2006-20302010 2015 2020 2025 2030ResidentialLiquids . . . . . . . . . . . . . . . . . . . . . . . . . . 0.2 0.2 0.3 0.3 0.3 0.3 1.6Natural Gas . . . . . . . . . . . . . . . . . . . . . . 0.0 0.0 0.0 0.0 0.1 0.1 1.9Coal . . . . . . . . . . . . . . . . . . . . . . . . . . . . 0.0 0.0 0.0 0.0 0.0 0.0 —Electricity . . . . . . . . . . . . . . . . . . . . . . . . 0.2 0.2 0.2 0.3 0.3 0.4 3.8Renewables. . . . . . . . . . . . . . . . . . . . . . 0.0 0.0 0.0 0.0 0.0 0.0 —
Total . . . . . . . . . . . . . . . . . . . . . . . . . . 0.4 0.5 0.5 0.7 0.7 0.8 2.6CommercialLiquids . . . . . . . . . . . . . . . . . . . . . . . . . . 0.1 0.0 0.1 0.1 0.1 0.1 1.6Natural Gas . . . . . . . . . . . . . . . . . . . . . . 0.0 0.0 0.0 0.0 0.0 0.0 0.8Coal . . . . . . . . . . . . . . . . . . . . . . . . . . . . 0.0 0.0 0.0 0.0 0.0 0.0 —Electricity . . . . . . . . . . . . . . . . . . . . . . . . 0.1 0.1 0.1 0.2 0.2 0.3 5.3Renewables. . . . . . . . . . . . . . . . . . . . . . 0.0 0.0 0.0 0.0 0.0 0.0 —
Total . . . . . . . . . . . . . . . . . . . . . . . . . . 0.1 0.2 0.2 0.2 0.3 0.3 3.9IndustrialLiquids . . . . . . . . . . . . . . . . . . . . . . . . . . 0.8 0.7 0.8 1.0 1.1 1.2 1.7Natural Gas . . . . . . . . . . . . . . . . . . . . . . 1.4 1.5 1.6 1.8 2.0 2.2 1.8Coal . . . . . . . . . . . . . . . . . . . . . . . . . . . . 0.1 0.1 0.1 0.1 0.1 0.2 3.2Electricity . . . . . . . . . . . . . . . . . . . . . . . . 0.4 0.4 0.5 0.5 0.6 0.6 2.0Renewables. . . . . . . . . . . . . . . . . . . . . . 0.0 0.0 0.0 0.0 0.0 0.0 -2.8
Total . . . . . . . . . . . . . . . . . . . . . . . . . . 2.7 2.7 3.0 3.4 3.8 4.1 1.8TransportationLiquids . . . . . . . . . . . . . . . . . . . . . . . . . . 1.5 1.4 1.5 1.7 1.8 1.9 1.0Natural Gas . . . . . . . . . . . . . . . . . . . . . . 0.0 0.0 0.1 0.1 0.1 0.1 2.2Coal . . . . . . . . . . . . . . . . . . . . . . . . . . . . 0.0 0.0 0.0 0.0 0.0 0.0 —Electricity . . . . . . . . . . . . . . . . . . . . . . . . 0.0 0.0 0.0 0.0 0.0 0.0 2.5Total . . . . . . . . . . . . . . . . . . . . . . . . . . 1.5 1.5 1.6 1.7 1.9 2.0 1.0
All End-Use SectorsLiquids . . . . . . . . . . . . . . . . . . . . . . . . . . 2.5 2.4 2.7 3.1 3.3 3.5 1.3Natural Gas . . . . . . . . . . . . . . . . . . . . . . 1.5 1.6 1.7 1.9 2.1 2.3 1.8Coal . . . . . . . . . . . . . . . . . . . . . . . . . . . . 0.1 0.1 0.1 0.1 0.1 0.2 3.2Electricity . . . . . . . . . . . . . . . . . . . . . . . . 0.6 0.7 0.8 1.0 1.1 1.3 3.0Renewables. . . . . . . . . . . . . . . . . . . . . . 0.0 0.0 0.0 0.0 0.0 0.0 -2.8
Delivered Energy . . . . . . . . . . . . . . . 4.8 4.8 5.3 6.1 6.7 7.3 1.8Electricity-Related Lossesa . . . . . . . . . . 2.6 1.8 2.1 2.2 2.4 2.6 0.1
Total . . . . . . . . . . . . . . . . . . . . . . . . . . 7.4 6.6 7.4 8.3 9.1 9.9 1.2Electric Powerb
Liquids . . . . . . . . . . . . . . . . . . . . . . . . . . 0.6 0.6 0.6 0.6 0.6 0.5 -0.5Natural Gas . . . . . . . . . . . . . . . . . . . . . . 0.8 1.0 1.3 1.5 1.8 2.1 4.1Coal . . . . . . . . . . . . . . . . . . . . . . . . . . . . 0.3 0.3 0.3 0.3 0.3 0.4 1.0Nuclear . . . . . . . . . . . . . . . . . . . . . . . . . 0.1 0.1 0.1 0.1 0.1 0.1 0.1Renewables. . . . . . . . . . . . . . . . . . . . . . 0.5 0.5 0.6 0.7 0.7 0.7 1.6
Total . . . . . . . . . . . . . . . . . . . . . . . . . . 2.3 2.5 2.9 3.2 3.5 3.9 2.2Total Energy ConsumptionLiquids . . . . . . . . . . . . . . . . . . . . . . . . . . 4.0 3.0 3.3 3.7 3.9 4.0 0.0Natural Gas . . . . . . . . . . . . . . . . . . . . . . 2.4 2.5 3.0 3.4 3.9 4.5 2.7Coal . . . . . . . . . . . . . . . . . . . . . . . . . . . . 0.4 0.4 0.4 0.4 0.5 0.6 1.5Nuclear . . . . . . . . . . . . . . . . . . . . . . . . . 0.1 0.1 0.1 0.1 0.1 0.1 0.1Renewables. . . . . . . . . . . . . . . . . . . . . . 0.5 0.5 0.6 0.7 0.7 0.7 1.8
Total . . . . . . . . . . . . . . . . . . . . . . . . . . 7.4 6.6 7.4 8.3 9.1 9.9 1.2aElectricity losses incurred in the transmission and distribution of electric power. May include some heat production.bFuel inputs used in the production of electricity and heat at central-station generators.Sources: 2006: Derived from Energy Information Administration (EIA), International Energy Annual 2006 (June-December 2008), web site
www.eia. doe.gov/iea. Projections: EIA, World Energy Projections Plus (2009).

Table F6. Delivered Energy Consumption in OECD Europe by End-Use Sector and Fuel, 2006-2030(Quadrillion Btu)
Appendix F
208 Energy Information Administration / International Energy Outlook 2009
Sector/Fuel 2006
Projections Average AnnualPercent Change,
2006-20302010 2015 2020 2025 2030ResidentialLiquids . . . . . . . . . . . . . . . . . . . . . . . . . . 2.6 2.4 2.3 2.3 2.3 2.3 -0.5Natural Gas . . . . . . . . . . . . . . . . . . . . . . 5.3 5.4 5.5 5.6 5.7 5.9 0.4Coal . . . . . . . . . . . . . . . . . . . . . . . . . . . . 0.6 0.5 0.5 0.4 0.4 0.3 -2.0Electricity . . . . . . . . . . . . . . . . . . . . . . . . 3.0 3.5 3.8 4.0 4.2 4.4 1.5Renewables. . . . . . . . . . . . . . . . . . . . . . 0.0 0.0 0.0 0.0 0.0 0.0 —
Total . . . . . . . . . . . . . . . . . . . . . . . . . . 11.5 11.7 12.0 12.3 12.6 12.8 0.5CommercialLiquids . . . . . . . . . . . . . . . . . . . . . . . . . . 1.0 0.9 0.8 0.8 0.8 0.8 -0.8Natural Gas . . . . . . . . . . . . . . . . . . . . . . 1.9 1.9 1.9 1.9 2.0 2.1 0.4Coal . . . . . . . . . . . . . . . . . . . . . . . . . . . . 0.1 0.1 0.1 0.1 0.1 0.1 -1.6Electricity . . . . . . . . . . . . . . . . . . . . . . . . 2.8 3.2 3.4 3.7 3.9 4.1 1.6Renewables. . . . . . . . . . . . . . . . . . . . . . 0.0 0.0 0.0 0.0 0.0 0.0 —
Total . . . . . . . . . . . . . . . . . . . . . . . . . . 5.7 6.0 6.2 6.5 6.8 7.0 0.9IndustrialLiquids . . . . . . . . . . . . . . . . . . . . . . . . . . 10.6 9.7 9.6 9.8 9.9 10.1 -0.2Natural Gas . . . . . . . . . . . . . . . . . . . . . . 6.6 6.6 6.8 6.9 7.1 7.2 0.4Coal . . . . . . . . . . . . . . . . . . . . . . . . . . . . 3.8 3.4 3.2 3.1 3.0 2.9 -1.1Electricity . . . . . . . . . . . . . . . . . . . . . . . . 4.6 4.8 5.1 5.4 5.6 5.8 1.0Renewables. . . . . . . . . . . . . . . . . . . . . . 0.3 0.3 0.3 0.3 0.3 0.3 0.1
Total . . . . . . . . . . . . . . . . . . . . . . . . . . 25.8 24.8 25.0 25.5 25.9 26.2 0.1TransportationLiquids . . . . . . . . . . . . . . . . . . . . . . . . . . 17.4 16.2 16.4 17.0 17.1 17.2 -0.1Natural Gas . . . . . . . . . . . . . . . . . . . . . . 0.1 0.1 0.1 0.1 0.1 0.1 1.4Coal . . . . . . . . . . . . . . . . . . . . . . . . . . . . 0.0 0.0 0.0 0.0 0.0 0.0 —Electricity . . . . . . . . . . . . . . . . . . . . . . . . 0.3 0.3 0.3 0.3 0.3 0.3 0.1Total . . . . . . . . . . . . . . . . . . . . . . . . . . 17.8 16.5 16.7 17.4 17.5 17.6 0.0
All End-Use SectorsLiquids . . . . . . . . . . . . . . . . . . . . . . . . . . 31.6 29.1 29.0 30.0 30.2 30.3 -0.2Natural Gas . . . . . . . . . . . . . . . . . . . . . . 13.8 13.9 14.2 14.5 14.9 15.2 0.4Coal . . . . . . . . . . . . . . . . . . . . . . . . . . . . 4.4 4.0 3.8 3.6 3.4 3.3 -1.3Electricity . . . . . . . . . . . . . . . . . . . . . . . . 10.7 11.7 12.6 13.4 14.0 14.5 1.3Renewables. . . . . . . . . . . . . . . . . . . . . . 0.3 0.3 0.3 0.3 0.3 0.3 0.1
Delivered Energy . . . . . . . . . . . . . . . 60.8 59.0 59.9 61.7 62.8 63.6 0.2Electricity-Related Lossesa . . . . . . . . . . 20.8 23.2 24.9 26.2 27.3 28.2 1.3Total . . . . . . . . . . . . . . . . . . . . . . . . . . 81.6 82.2 84.8 87.9 90.0 91.8 0.5
Electric Powerb
Liquids . . . . . . . . . . . . . . . . . . . . . . . . . . 0.8 0.9 0.9 0.8 0.8 0.8 -0.5Natural Gas . . . . . . . . . . . . . . . . . . . . . . 5.9 7.0 7.9 8.7 9.3 9.6 2.0Coal . . . . . . . . . . . . . . . . . . . . . . . . . . . . 8.7 9.0 9.0 8.8 8.7 8.8 0.0Nuclear . . . . . . . . . . . . . . . . . . . . . . . . . 9.8 9.7 9.7 9.6 9.5 9.5 -0.1Renewables. . . . . . . . . . . . . . . . . . . . . . 6.4 8.3 10.0 11.6 13.0 14.1 3.4Total . . . . . . . . . . . . . . . . . . . . . . . . . . 32.0 34.9 37.5 39.5 41.3 42.7 1.2
Total Energy ConsumptionLiquids . . . . . . . . . . . . . . . . . . . . . . . . . . 32.4 30.0 29.9 30.8 31.0 31.1 -0.2Natural Gas . . . . . . . . . . . . . . . . . . . . . . 19.7 21.0 22.1 23.3 24.2 24.8 1.0Coal . . . . . . . . . . . . . . . . . . . . . . . . . . . . 13.2 13.0 12.8 12.4 12.2 12.0 -0.4Nuclear . . . . . . . . . . . . . . . . . . . . . . . . . 9.6 9.7 9.7 9.6 9.5 9.5 -0.1Renewables. . . . . . . . . . . . . . . . . . . . . . 6.6 8.5 10.3 11.9 13.3 14.4 3.3Total . . . . . . . . . . . . . . . . . . . . . . . . . . 81.6 82.2 84.8 87.9 90.0 91.8 0.5
aElectricity losses incurred in the transmission and distribution of electric power. May include some heat production.bFuel inputs used in the production of electricity and heat at central-station generators.Sources: 2006: Derived from Energy Information Administration (EIA), International Energy Annual 2006 (June-December 2008), web site
www.eia. doe.gov/iea. Projections: EIA, World Energy Projections Plus (2009).

Table F7. Delivered Energy Consumption in Japan by End-Use Sector and Fuel, 2006-2030(Quadrillion Btu)
Reference Case Projections by End-Use Sector and Country Grouping
Energy Information Administration / International Energy Outlook 2009 209
Sector/Fuel 2006
Projections Average AnnualPercent Change,
2006-20302010 2015 2020 2025 2030ResidentialLiquids . . . . . . . . . . . . . . . . . . . . . . . . . . 0.6 0.5 0.6 0.6 0.6 0.5 -0.7Natural Gas . . . . . . . . . . . . . . . . . . . . . . 0.4 0.4 0.5 0.4 0.4 0.4 0.2Coal . . . . . . . . . . . . . . . . . . . . . . . . . . . . 0.0 0.0 0.0 0.0 0.0 0.0 —Electricity . . . . . . . . . . . . . . . . . . . . . . . . 1.0 1.1 1.1 1.2 1.2 1.2 0.7Renewables. . . . . . . . . . . . . . . . . . . . . . 0.0 0.0 0.0 0.0 0.0 0.0 —
Total . . . . . . . . . . . . . . . . . . . . . . . . . . 2.1 2.0 2.1 2.2 2.2 2.2 0.2CommercialLiquids . . . . . . . . . . . . . . . . . . . . . . . . . . 0.9 0.8 0.8 0.8 0.9 0.9 -0.2Natural Gas . . . . . . . . . . . . . . . . . . . . . . 0.7 0.7 0.7 0.7 0.6 0.6 -0.5Coal . . . . . . . . . . . . . . . . . . . . . . . . . . . . 0.0 0.0 0.0 0.0 0.0 0.0 -1.0Electricity . . . . . . . . . . . . . . . . . . . . . . . . 1.3 1.4 1.4 1.5 1.5 1.6 0.8Renewables. . . . . . . . . . . . . . . . . . . . . . 0.0 0.0 0.0 0.0 0.0 0.0 —
Total . . . . . . . . . . . . . . . . . . . . . . . . . . 2.9 2.8 2.9 3.0 3.0 3.0 0.2IndustrialLiquids . . . . . . . . . . . . . . . . . . . . . . . . . . 4.3 3.7 3.9 4.0 3.9 3.8 -0.5Natural Gas . . . . . . . . . . . . . . . . . . . . . . 0.4 0.4 0.5 0.5 0.5 0.5 0.4Coal . . . . . . . . . . . . . . . . . . . . . . . . . . . . 2.1 2.0 2.0 2.0 1.9 1.8 -0.7Electricity . . . . . . . . . . . . . . . . . . . . . . . . 0.9 0.9 1.0 1.0 1.0 1.0 0.1Renewables. . . . . . . . . . . . . . . . . . . . . . 0.1 0.1 0.1 0.1 0.1 0.1 0.6
Total . . . . . . . . . . . . . . . . . . . . . . . . . . 7.8 7.2 7.5 7.6 7.3 7.1 -0.4TransportationLiquids . . . . . . . . . . . . . . . . . . . . . . . . . . 4.0 3.5 3.7 3.9 3.8 3.7 -0.3Natural Gas . . . . . . . . . . . . . . . . . . . . . . 0.0 0.0 0.0 0.0 0.0 0.0 —Coal . . . . . . . . . . . . . . . . . . . . . . . . . . . . 0.0 0.0 0.0 0.0 0.0 0.0 —Electricity . . . . . . . . . . . . . . . . . . . . . . . . 0.1 0.1 0.1 0.1 0.1 0.1 0.0Total . . . . . . . . . . . . . . . . . . . . . . . . . . 4.0 3.6 3.8 3.9 3.8 3.7 -0.3
All End-Use SectorsLiquids . . . . . . . . . . . . . . . . . . . . . . . . . . 9.8 8.6 9.0 9.3 9.1 8.9 -0.4Natural Gas . . . . . . . . . . . . . . . . . . . . . . 1.5 1.6 1.7 1.6 1.5 1.5 0.0Coal . . . . . . . . . . . . . . . . . . . . . . . . . . . . 2.2 2.1 2.0 2.0 1.9 1.8 -0.7Electricity . . . . . . . . . . . . . . . . . . . . . . . . 3.4 3.4 3.6 3.7 3.8 3.8 0.6Renewables. . . . . . . . . . . . . . . . . . . . . . 0.1 0.1 0.1 0.1 0.1 0.1 0.6
Delivered Energy . . . . . . . . . . . . . . . 16.8 15.7 16.3 16.7 16.4 16.1 -0.2Electricity-Related Lossesa . . . . . . . . . . 5.9 6.2 6.5 6.7 6.8 7.0 0.7Total . . . . . . . . . . . . . . . . . . . . . . . . . . 22.8 21.9 22.9 23.4 23.2 23.0 0.0
Electric Powerb
Liquids . . . . . . . . . . . . . . . . . . . . . . . . . . 0.7 0.7 0.7 0.7 0.7 0.7 -0.4Natural Gas . . . . . . . . . . . . . . . . . . . . . . 2.1 2.1 2.3 2.5 2.6 2.6 0.8Coal . . . . . . . . . . . . . . . . . . . . . . . . . . . . 2.5 2.5 2.4 2.4 2.3 2.2 -0.4Nuclear . . . . . . . . . . . . . . . . . . . . . . . . . 2.9 3.1 3.3 3.4 3.7 3.9 1.2Renewables. . . . . . . . . . . . . . . . . . . . . . 1.1 1.3 1.4 1.4 1.4 1.4 0.9
Total . . . . . . . . . . . . . . . . . . . . . . . . . . 9.4 9.7 10.1 10.4 10.6 10.8 0.6Total Energy ConsumptionLiquids . . . . . . . . . . . . . . . . . . . . . . . . . . 10.5 9.3 9.7 10.0 9.8 9.5 -0.4Natural Gas . . . . . . . . . . . . . . . . . . . . . . 3.6 3.7 4.0 4.1 4.1 4.0 0.5Coal . . . . . . . . . . . . . . . . . . . . . . . . . . . . 4.6 4.5 4.5 4.3 4.2 4.0 -0.6Nuclear . . . . . . . . . . . . . . . . . . . . . . . . . 2.9 3.1 3.3 3.4 3.7 3.9 1.2Renewables. . . . . . . . . . . . . . . . . . . . . . 1.1 1.3 1.4 1.5 1.5 1.5 1.2
Total . . . . . . . . . . . . . . . . . . . . . . . . . . 22.8 21.9 22.9 23.4 23.2 23.0 0.0aElectricity losses incurred in the transmission and distribution of electric power. May include some heat production.bFuel inputs used in the production of electricity and heat at central-station generators.Sources: 2006: Derived from Energy Information Administration (EIA), International Energy Annual 2006 (June-December 2008), web site
www.eia. doe.gov/iea. Projections: EIA, World Energy Projections Plus (2009).

Table F8. Delivered Energy Consumption in South Korea by End-Use Sector and Fuel, 2006-2030(Quadrillion Btu)
Appendix F
210 Energy Information Administration / International Energy Outlook 2009
Sector/Fuel 2006
Projections Average AnnualPercent Change,
2006-20302010 2015 2020 2025 2030ResidentialLiquids . . . . . . . . . . . . . . . . . . . . . . . . . . 0.2 0.2 0.2 0.1 0.1 0.1 -1.7Natural Gas . . . . . . . . . . . . . . . . . . . . . . 0.4 0.4 0.5 0.5 0.5 0.5 0.7Coal . . . . . . . . . . . . . . . . . . . . . . . . . . . . 0.0 0.0 0.0 0.0 0.0 0.0 -3.3Electricity . . . . . . . . . . . . . . . . . . . . . . . . 0.2 0.2 0.2 0.3 0.3 0.3 2.4Renewables. . . . . . . . . . . . . . . . . . . . . . 0.0 0.0 0.0 0.0 0.0 0.0 —
Total . . . . . . . . . . . . . . . . . . . . . . . . . . 0.8 0.8 0.9 0.9 0.9 0.9 0.6CommercialLiquids . . . . . . . . . . . . . . . . . . . . . . . . . . 0.2 0.2 0.2 0.2 0.2 0.2 0.4Natural Gas . . . . . . . . . . . . . . . . . . . . . . 0.2 0.2 0.2 0.2 0.2 0.2 1.6Coal . . . . . . . . . . . . . . . . . . . . . . . . . . . . 0.0 0.0 0.0 0.0 0.0 0.0 —Electricity . . . . . . . . . . . . . . . . . . . . . . . . 0.4 0.4 0.5 0.6 0.7 0.8 2.6Renewables. . . . . . . . . . . . . . . . . . . . . . 0.0 0.0 0.0 0.0 0.0 0.0 —
Total . . . . . . . . . . . . . . . . . . . . . . . . . . 0.8 0.8 0.9 1.0 1.1 1.2 1.9IndustrialLiquids . . . . . . . . . . . . . . . . . . . . . . . . . . 3.2 3.1 3.0 2.8 2.8 2.9 -0.4Natural Gas . . . . . . . . . . . . . . . . . . . . . . 0.3 0.3 0.3 0.3 0.3 0.3 1.3Coal . . . . . . . . . . . . . . . . . . . . . . . . . . . . 0.8 0.8 0.8 0.8 0.8 0.8 -0.2Electricity . . . . . . . . . . . . . . . . . . . . . . . . 0.6 0.7 0.8 0.9 1.0 1.1 2.1Renewables. . . . . . . . . . . . . . . . . . . . . . 0.0 0.0 0.0 0.0 0.0 0.0 -2.5
Total . . . . . . . . . . . . . . . . . . . . . . . . . . 4.9 4.9 5.0 4.8 5.0 5.1 0.2TransportationLiquids . . . . . . . . . . . . . . . . . . . . . . . . . . 1.9 2.0 2.1 2.2 2.2 2.3 0.7Natural Gas . . . . . . . . . . . . . . . . . . . . . . 0.0 0.0 0.0 0.0 0.0 0.0 1.0Coal . . . . . . . . . . . . . . . . . . . . . . . . . . . . 0.0 0.0 0.0 0.0 0.0 0.0 —Electricity . . . . . . . . . . . . . . . . . . . . . . . . 0.0 0.0 0.0 0.0 0.0 0.0 1.8Total . . . . . . . . . . . . . . . . . . . . . . . . . . 1.9 2.0 2.1 2.2 2.3 2.3 0.7
All End-Use SectorsLiquids . . . . . . . . . . . . . . . . . . . . . . . . . . 5.5 5.5 5.4 5.3 5.4 5.5 0.0Natural Gas . . . . . . . . . . . . . . . . . . . . . . 0.8 0.9 1.0 1.0 1.0 1.1 1.1Coal . . . . . . . . . . . . . . . . . . . . . . . . . . . . 0.9 0.9 0.9 0.9 0.8 0.8 -0.4Electricity . . . . . . . . . . . . . . . . . . . . . . . . 1.2 1.4 1.6 1.8 1.9 2.1 2.3Renewables. . . . . . . . . . . . . . . . . . . . . . 0.0 0.0 0.0 0.0 0.0 0.0 -2.5
Delivered Energy . . . . . . . . . . . . . . . 8.4 8.6 8.9 8.9 9.3 9.5 0.5Electricity-Related Lossesa . . . . . . . . . . 1.0 2.4 2.8 3.1 3.4 3.7 5.5
Total . . . . . . . . . . . . . . . . . . . . . . . . . . 9.4 11.0 11.6 12.0 12.7 13.2 1.4Electric Powerb
Liquids . . . . . . . . . . . . . . . . . . . . . . . . . . 0.2 0.2 0.2 0.2 0.2 0.2 -0.5Natural Gas . . . . . . . . . . . . . . . . . . . . . . 0.5 0.6 0.7 0.8 0.9 0.9 2.8Coal . . . . . . . . . . . . . . . . . . . . . . . . . . . . 1.3 1.5 1.6 1.6 1.9 2.1 2.0Nuclear . . . . . . . . . . . . . . . . . . . . . . . . . 1.4 1.4 1.8 2.1 2.3 2.5 2.3Renewables. . . . . . . . . . . . . . . . . . . . . . 0.0 0.1 0.1 0.1 0.1 0.1 4.9
Total . . . . . . . . . . . . . . . . . . . . . . . . . . 3.4 3.7 4.3 4.9 5.3 5.8 2.2Total Energy ConsumptionLiquids . . . . . . . . . . . . . . . . . . . . . . . . . . 4.5 5.7 5.6 5.5 5.6 5.7 1.0Natural Gas . . . . . . . . . . . . . . . . . . . . . . 1.3 1.4 1.7 1.8 1.9 2.0 1.8Coal . . . . . . . . . . . . . . . . . . . . . . . . . . . . 2.2 2.4 2.4 2.5 2.7 2.9 1.2Nuclear . . . . . . . . . . . . . . . . . . . . . . . . . 1.4 1.4 1.8 2.1 2.3 2.5 2.4Renewables. . . . . . . . . . . . . . . . . . . . . . 0.0 0.1 0.1 0.1 0.1 0.1 5.3
Total . . . . . . . . . . . . . . . . . . . . . . . . . . 9.4 11.0 11.6 12.0 12.7 13.2 1.4aElectricity losses incurred in the transmission and distribution of electric power. May include some heat production.bFuel inputs used in the production of electricity and heat at central-station generators.Sources: 2006: Derived from Energy Information Administration (EIA), International Energy Annual 2006 (June-December 2008), web site
www.eia. doe.gov/iea. Projections: EIA, World Energy Projections Plus (2009).

Table F9. Delivered Energy Consumption in Australia/New Zealand by End-Use Sector and Fuel, 2006-2030(Quadrillion Btu)
Reference Case Projections by End-Use Sector and Country Grouping
Energy Information Administration / International Energy Outlook 2009 211
Sector/Fuel 2006
Projections Average AnnualPercent Change,
2006-20302010 2015 2020 2025 2030ResidentialLiquids . . . . . . . . . . . . . . . . . . . . . . . . . . 0.0 0.0 0.0 0.0 0.0 0.0 0.4Natural Gas . . . . . . . . . . . . . . . . . . . . . . 0.1 0.1 0.1 0.2 0.2 0.2 1.2Coal . . . . . . . . . . . . . . . . . . . . . . . . . . . . 0.0 0.0 0.0 0.0 0.0 0.0 0.9Electricity . . . . . . . . . . . . . . . . . . . . . . . . 0.3 0.3 0.3 0.3 0.3 0.4 1.4Renewables. . . . . . . . . . . . . . . . . . . . . . 0.0 0.0 0.0 0.0 0.0 0.0 —
Total . . . . . . . . . . . . . . . . . . . . . . . . . . 0.4 0.4 0.5 0.5 0.5 0.5 1.3CommercialLiquids . . . . . . . . . . . . . . . . . . . . . . . . . . 0.0 0.0 0.0 0.0 0.0 0.0 -0.3Natural Gas . . . . . . . . . . . . . . . . . . . . . . 0.0 0.0 0.0 0.0 0.0 0.0 0.3Coal . . . . . . . . . . . . . . . . . . . . . . . . . . . . 0.0 0.0 0.0 0.0 0.0 0.0 -0.4Electricity . . . . . . . . . . . . . . . . . . . . . . . . 0.2 0.2 0.3 0.3 0.3 0.3 1.9Renewables. . . . . . . . . . . . . . . . . . . . . . 0.0 0.0 0.0 0.0 0.0 0.0 —
Total . . . . . . . . . . . . . . . . . . . . . . . . . . 0.3 0.3 0.3 0.4 0.4 0.4 1.5IndustrialLiquids . . . . . . . . . . . . . . . . . . . . . . . . . . 0.6 0.6 0.6 0.6 0.6 0.6 0.0Natural Gas . . . . . . . . . . . . . . . . . . . . . . 0.7 0.7 0.8 0.8 0.8 0.8 0.7Coal . . . . . . . . . . . . . . . . . . . . . . . . . . . . 0.2 0.2 0.3 0.3 0.3 0.4 1.9Electricity . . . . . . . . . . . . . . . . . . . . . . . . 0.4 0.4 0.5 0.5 0.5 0.6 1.4Renewables. . . . . . . . . . . . . . . . . . . . . . 0.0 0.0 0.0 0.0 0.0 0.0 0.1
Total . . . . . . . . . . . . . . . . . . . . . . . . . . 1.9 2.0 2.1 2.2 2.3 2.4 0.8TransportationLiquids . . . . . . . . . . . . . . . . . . . . . . . . . . 1.4 1.4 1.5 1.7 1.8 1.9 1.2Natural Gas . . . . . . . . . . . . . . . . . . . . . . 0.0 0.0 0.0 0.0 0.0 0.0 3.0Coal . . . . . . . . . . . . . . . . . . . . . . . . . . . . 0.0 0.0 0.0 0.0 0.0 0.0 —Electricity . . . . . . . . . . . . . . . . . . . . . . . . 0.0 0.0 0.0 0.0 0.0 0.0 0.6Total . . . . . . . . . . . . . . . . . . . . . . . . . . 1.5 1.4 1.5 1.7 1.8 1.9 1.2
All End-Use SectorsLiquids . . . . . . . . . . . . . . . . . . . . . . . . . . 2.1 2.0 2.1 2.3 2.4 2.5 0.9Natural Gas . . . . . . . . . . . . . . . . . . . . . . 0.9 0.9 1.0 1.0 1.0 1.1 0.8Coal . . . . . . . . . . . . . . . . . . . . . . . . . . . . 0.2 0.3 0.3 0.3 0.3 0.4 1.8Electricity . . . . . . . . . . . . . . . . . . . . . . . . 0.9 1.0 1.1 1.1 1.2 1.3 1.5Renewables. . . . . . . . . . . . . . . . . . . . . . 0.0 0.0 0.0 0.0 0.0 0.0 0.1
Delivered Energy . . . . . . . . . . . . . . . 4.1 4.1 4.4 4.8 5.0 5.2 1.1Electricity-Related Lossesa . . . . . . . . . . 2.4 2.5 2.8 2.9 3.1 3.2 1.1
Total . . . . . . . . . . . . . . . . . . . . . . . . . . 6.5 6.7 7.3 7.7 8.0 8.4 1.1Electric Powerb
Liquids . . . . . . . . . . . . . . . . . . . . . . . . . . 0.0 0.0 0.0 0.0 0.0 0.0 0.3Natural Gas . . . . . . . . . . . . . . . . . . . . . . 0.3 0.4 0.4 0.5 0.6 0.6 2.2Coal . . . . . . . . . . . . . . . . . . . . . . . . . . . . 2.3 2.4 2.4 2.4 2.4 2.5 0.3Nuclear . . . . . . . . . . . . . . . . . . . . . . . . . 0.0 0.0 0.0 0.0 0.0 0.0 —Renewables. . . . . . . . . . . . . . . . . . . . . . 0.5 0.7 1.1 1.2 1.3 1.3 4.1
Total . . . . . . . . . . . . . . . . . . . . . . . . . . 3.2 3.5 3.9 4.1 4.3 4.4 1.4Total Energy Consumption 1.7Liquids . . . . . . . . . . . . . . . . . . . . . . . . . . 2.2 2.0 2.1 2.3 2.4 2.5 0.6Natural Gas . . . . . . . . . . . . . . . . . . . . . . 1.2 1.3 1.4 1.5 1.6 1.6 1.3Coal . . . . . . . . . . . . . . . . . . . . . . . . . . . . 2.6 2.6 2.6 2.7 2.7 2.9 0.5Nuclear . . . . . . . . . . . . . . . . . . . . . . . . . 0.0 0.0 0.0 0.0 0.0 0.0 —Renewables. . . . . . . . . . . . . . . . . . . . . . 0.5 0.7 1.1 1.2 1.3 1.3 4.2
Total . . . . . . . . . . . . . . . . . . . . . . . . . . 6.5 6.7 7.3 7.7 8.0 8.4 1.1aElectricity losses incurred in the transmission and distribution of electric power. May include some heat production.bFuel inputs used in the production of electricity and heat at central-station generators.Sources: 2006: Derived from Energy Information Administration (EIA), International Energy Annual 2006 (June-December 2008), web site
www.eia. doe.gov/iea. Projections: EIA, World Energy Projections Plus (2009).
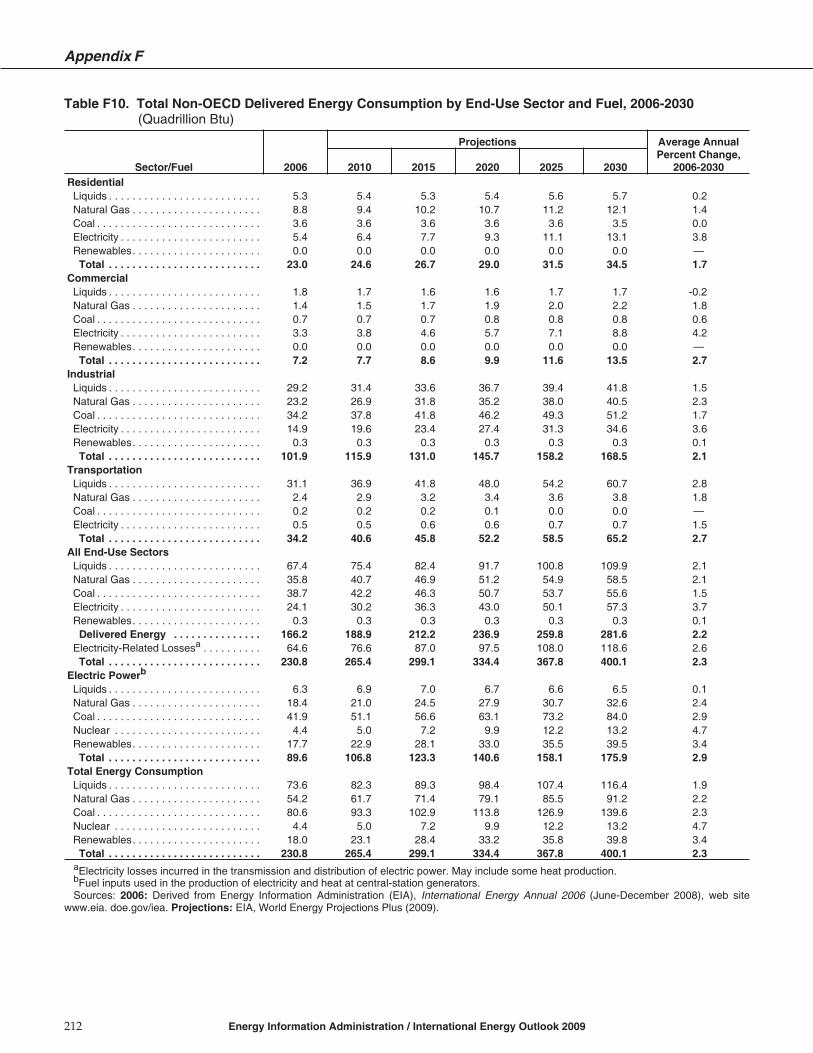
Table F10. Total Non-OECD Delivered Energy Consumption by End-Use Sector and Fuel, 2006-2030(Quadrillion Btu)
Appendix F
212 Energy Information Administration / International Energy Outlook 2009
Sector/Fuel 2006
Projections Average AnnualPercent Change,
2006-20302010 2015 2020 2025 2030ResidentialLiquids . . . . . . . . . . . . . . . . . . . . . . . . . . 5.3 5.4 5.3 5.4 5.6 5.7 0.2Natural Gas . . . . . . . . . . . . . . . . . . . . . . 8.8 9.4 10.2 10.7 11.2 12.1 1.4Coal . . . . . . . . . . . . . . . . . . . . . . . . . . . . 3.6 3.6 3.6 3.6 3.6 3.5 0.0Electricity . . . . . . . . . . . . . . . . . . . . . . . . 5.4 6.4 7.7 9.3 11.1 13.1 3.8Renewables. . . . . . . . . . . . . . . . . . . . . . 0.0 0.0 0.0 0.0 0.0 0.0 —
Total . . . . . . . . . . . . . . . . . . . . . . . . . . 23.0 24.6 26.7 29.0 31.5 34.5 1.7CommercialLiquids . . . . . . . . . . . . . . . . . . . . . . . . . . 1.8 1.7 1.6 1.6 1.7 1.7 -0.2Natural Gas . . . . . . . . . . . . . . . . . . . . . . 1.4 1.5 1.7 1.9 2.0 2.2 1.8Coal . . . . . . . . . . . . . . . . . . . . . . . . . . . . 0.7 0.7 0.7 0.8 0.8 0.8 0.6Electricity . . . . . . . . . . . . . . . . . . . . . . . . 3.3 3.8 4.6 5.7 7.1 8.8 4.2Renewables. . . . . . . . . . . . . . . . . . . . . . 0.0 0.0 0.0 0.0 0.0 0.0 —
Total . . . . . . . . . . . . . . . . . . . . . . . . . . 7.2 7.7 8.6 9.9 11.6 13.5 2.7IndustrialLiquids . . . . . . . . . . . . . . . . . . . . . . . . . . 29.2 31.4 33.6 36.7 39.4 41.8 1.5Natural Gas . . . . . . . . . . . . . . . . . . . . . . 23.2 26.9 31.8 35.2 38.0 40.5 2.3Coal . . . . . . . . . . . . . . . . . . . . . . . . . . . . 34.2 37.8 41.8 46.2 49.3 51.2 1.7Electricity . . . . . . . . . . . . . . . . . . . . . . . . 14.9 19.6 23.4 27.4 31.3 34.6 3.6Renewables. . . . . . . . . . . . . . . . . . . . . . 0.3 0.3 0.3 0.3 0.3 0.3 0.1
Total . . . . . . . . . . . . . . . . . . . . . . . . . . 101.9 115.9 131.0 145.7 158.2 168.5 2.1TransportationLiquids . . . . . . . . . . . . . . . . . . . . . . . . . . 31.1 36.9 41.8 48.0 54.2 60.7 2.8Natural Gas . . . . . . . . . . . . . . . . . . . . . . 2.4 2.9 3.2 3.4 3.6 3.8 1.8Coal . . . . . . . . . . . . . . . . . . . . . . . . . . . . 0.2 0.2 0.2 0.1 0.0 0.0 —Electricity . . . . . . . . . . . . . . . . . . . . . . . . 0.5 0.5 0.6 0.6 0.7 0.7 1.5Total . . . . . . . . . . . . . . . . . . . . . . . . . . 34.2 40.6 45.8 52.2 58.5 65.2 2.7
All End-Use SectorsLiquids . . . . . . . . . . . . . . . . . . . . . . . . . . 67.4 75.4 82.4 91.7 100.8 109.9 2.1Natural Gas . . . . . . . . . . . . . . . . . . . . . . 35.8 40.7 46.9 51.2 54.9 58.5 2.1Coal . . . . . . . . . . . . . . . . . . . . . . . . . . . . 38.7 42.2 46.3 50.7 53.7 55.6 1.5Electricity . . . . . . . . . . . . . . . . . . . . . . . . 24.1 30.2 36.3 43.0 50.1 57.3 3.7Renewables. . . . . . . . . . . . . . . . . . . . . . 0.3 0.3 0.3 0.3 0.3 0.3 0.1
Delivered Energy . . . . . . . . . . . . . . . 166.2 188.9 212.2 236.9 259.8 281.6 2.2Electricity-Related Lossesa . . . . . . . . . . 64.6 76.6 87.0 97.5 108.0 118.6 2.6Total . . . . . . . . . . . . . . . . . . . . . . . . . . 230.8 265.4 299.1 334.4 367.8 400.1 2.3
Electric Powerb
Liquids . . . . . . . . . . . . . . . . . . . . . . . . . . 6.3 6.9 7.0 6.7 6.6 6.5 0.1Natural Gas . . . . . . . . . . . . . . . . . . . . . . 18.4 21.0 24.5 27.9 30.7 32.6 2.4Coal . . . . . . . . . . . . . . . . . . . . . . . . . . . . 41.9 51.1 56.6 63.1 73.2 84.0 2.9Nuclear . . . . . . . . . . . . . . . . . . . . . . . . . 4.4 5.0 7.2 9.9 12.2 13.2 4.7Renewables. . . . . . . . . . . . . . . . . . . . . . 17.7 22.9 28.1 33.0 35.5 39.5 3.4
Total . . . . . . . . . . . . . . . . . . . . . . . . . . 89.6 106.8 123.3 140.6 158.1 175.9 2.9Total Energy ConsumptionLiquids . . . . . . . . . . . . . . . . . . . . . . . . . . 73.6 82.3 89.3 98.4 107.4 116.4 1.9Natural Gas . . . . . . . . . . . . . . . . . . . . . . 54.2 61.7 71.4 79.1 85.5 91.2 2.2Coal . . . . . . . . . . . . . . . . . . . . . . . . . . . . 80.6 93.3 102.9 113.8 126.9 139.6 2.3Nuclear . . . . . . . . . . . . . . . . . . . . . . . . . 4.4 5.0 7.2 9.9 12.2 13.2 4.7Renewables. . . . . . . . . . . . . . . . . . . . . . 18.0 23.1 28.4 33.2 35.8 39.8 3.4
Total . . . . . . . . . . . . . . . . . . . . . . . . . . 230.8 265.4 299.1 334.4 367.8 400.1 2.3aElectricity losses incurred in the transmission and distribution of electric power. May include some heat production.bFuel inputs used in the production of electricity and heat at central-station generators.Sources: 2006: Derived from Energy Information Administration (EIA), International Energy Annual 2006 (June-December 2008), web site
www.eia. doe.gov/iea. Projections: EIA, World Energy Projections Plus (2009).

Table F11. Delivered Energy Consumption in Russia by End-Use Sector and Fuel, 2006-2030(Quadrillion Btu)
Reference Case Projections by End-Use Sector and Country Grouping
Energy Information Administration / International Energy Outlook 2009 213
Sector/Fuel 2006
Projections Average AnnualPercent Change,
2006-20302010 2015 2020 2025 2030ResidentialLiquids . . . . . . . . . . . . . . . . . . . . . . . . . . 0.4 0.3 0.3 0.3 0.3 0.3 -0.4Natural Gas . . . . . . . . . . . . . . . . . . . . . . 3.2 3.2 3.3 3.3 3.4 3.5 0.5Coal . . . . . . . . . . . . . . . . . . . . . . . . . . . . 0.3 0.3 0.3 0.2 0.2 0.2 -2.0Electricity . . . . . . . . . . . . . . . . . . . . . . . . 0.4 0.4 0.5 0.6 0.7 0.8 3.3Renewables. . . . . . . . . . . . . . . . . . . . . . 0.0 0.0 0.0 0.0 0.0 0.0 —
Total . . . . . . . . . . . . . . . . . . . . . . . . . . 4.2 4.2 4.4 4.5 4.6 4.9 0.6CommercialLiquids . . . . . . . . . . . . . . . . . . . . . . . . . . 0.1 0.1 0.1 0.1 0.0 0.0 -2.2Natural Gas . . . . . . . . . . . . . . . . . . . . . . 0.6 0.6 0.6 0.6 0.6 0.6 0.4Coal . . . . . . . . . . . . . . . . . . . . . . . . . . . . 0.1 0.1 0.1 0.1 0.1 0.1 -0.7Electricity . . . . . . . . . . . . . . . . . . . . . . . . 0.4 0.4 0.5 0.6 0.7 0.8 3.4Renewables. . . . . . . . . . . . . . . . . . . . . . 0.0 0.0 0.0 0.0 0.0 0.0 —
Total . . . . . . . . . . . . . . . . . . . . . . . . . . 1.1 1.2 1.3 1.4 1.5 1.6 1.4IndustrialLiquids . . . . . . . . . . . . . . . . . . . . . . . . . . 2.5 2.4 2.6 2.7 2.6 2.6 0.1Natural Gas . . . . . . . . . . . . . . . . . . . . . . 5.7 6.0 6.3 6.6 6.9 7.1 0.9Coal . . . . . . . . . . . . . . . . . . . . . . . . . . . . 1.3 1.4 1.4 1.5 1.5 1.5 0.3Electricity . . . . . . . . . . . . . . . . . . . . . . . . 1.7 2.0 2.3 2.6 2.7 2.8 2.1Renewables. . . . . . . . . . . . . . . . . . . . . . 0.0 0.0 0.0 0.0 0.0 0.0 -2.3
Total . . . . . . . . . . . . . . . . . . . . . . . . . . 11.2 11.9 12.7 13.4 13.7 13.9 0.9TransportationLiquids . . . . . . . . . . . . . . . . . . . . . . . . . . 2.3 2.4 2.4 2.5 2.4 2.3 0.1Natural Gas . . . . . . . . . . . . . . . . . . . . . . 1.7 2.1 2.2 2.3 2.3 2.4 1.5Coal . . . . . . . . . . . . . . . . . . . . . . . . . . . . 0.0 0.0 0.0 0.0 0.0 0.0 —Electricity . . . . . . . . . . . . . . . . . . . . . . . . 0.3 0.3 0.3 0.3 0.3 0.3 0.1Total . . . . . . . . . . . . . . . . . . . . . . . . . . 4.2 4.7 4.9 5.1 5.0 5.0 0.7
All End-Use SectorsLiquids . . . . . . . . . . . . . . . . . . . . . . . . . . 5.2 5.2 5.4 5.6 5.4 5.3 0.1Natural Gas . . . . . . . . . . . . . . . . . . . . . . 11.1 11.8 12.4 12.8 13.2 13.7 0.9Coal . . . . . . . . . . . . . . . . . . . . . . . . . . . . 1.8 1.8 1.8 1.8 1.8 1.8 -0.1Electricity . . . . . . . . . . . . . . . . . . . . . . . . 2.7 3.2 3.7 4.1 4.4 4.7 2.3Renewables. . . . . . . . . . . . . . . . . . . . . . 0.0 0.0 0.0 0.0 0.0 0.0 -2.3
Delivered Energy . . . . . . . . . . . . . . . 20.8 22.0 23.3 24.3 24.9 25.4 0.8Electricity-Related Lossesa . . . . . . . . . . 9.6 10.3 11.1 11.6 12.0 12.3 1.0Total . . . . . . . . . . . . . . . . . . . . . . . . . . 30.4 32.2 34.3 36.0 36.9 37.7 0.9
Electric Powerb
Liquids . . . . . . . . . . . . . . . . . . . . . . . . . . 0.4 0.4 0.4 0.4 0.3 0.3 -0.4Natural Gas . . . . . . . . . . . . . . . . . . . . . . 5.7 6.4 6.9 7.2 7.3 7.4 1.1Coal . . . . . . . . . . . . . . . . . . . . . . . . . . . . 2.7 3.1 3.3 3.3 3.3 3.4 0.9Nuclear . . . . . . . . . . . . . . . . . . . . . . . . . 1.6 1.7 2.1 2.7 3.3 3.5 3.3Renewables. . . . . . . . . . . . . . . . . . . . . . 1.8 1.8 2.0 2.1 2.3 2.4 1.1
Total . . . . . . . . . . . . . . . . . . . . . . . . . . 12.2 13.4 14.8 15.7 16.4 17.0 1.4Total Energy ConsumptionLiquids . . . . . . . . . . . . . . . . . . . . . . . . . . 5.8 5.6 5.7 5.9 5.8 5.6 -0.1Natural Gas . . . . . . . . . . . . . . . . . . . . . . 16.7 18.1 19.3 20.1 20.5 21.0 0.9Coal . . . . . . . . . . . . . . . . . . . . . . . . . . . . 4.6 5.0 5.2 5.1 5.1 5.2 0.5Nuclear . . . . . . . . . . . . . . . . . . . . . . . . . 1.6 1.7 2.1 2.7 3.3 3.5 3.3Renewables. . . . . . . . . . . . . . . . . . . . . . 1.8 1.9 2.0 2.2 2.3 2.4 1.3
Total . . . . . . . . . . . . . . . . . . . . . . . . . . 30.4 32.2 34.3 36.0 36.9 37.7 0.9aElectricity losses incurred in the transmission and distribution of electric power. May include some heat production.bFuel inputs used in the production of electricity and heat at central-station generators.Sources: 2006: Derived from Energy Information Administration (EIA), International Energy Annual 2006 (June-December 2008), web site
www.eia. doe.gov/iea. Projections: EIA, World Energy Projections Plus (2009).

Table F12. Delivered Energy Consumption in Other Non-OECD Europe and Eurasia by End-Use Sector andFuel, 2006-2030(Quadrillion Btu)
Appendix F
214 Energy Information Administration / International Energy Outlook 2009
Sector/Fuel 2006
Projections Average AnnualPercent Change,
2006-20302010 2015 2020 2025 2030ResidentialLiquids . . . . . . . . . . . . . . . . . . . . . . . . . . 0.2 0.2 0.2 0.2 0.2 0.2 -0.4Natural Gas . . . . . . . . . . . . . . . . . . . . . . 2.6 2.8 3.0 3.0 3.0 2.9 0.5Coal . . . . . . . . . . . . . . . . . . . . . . . . . . . . 0.2 0.2 0.1 0.1 0.1 0.1 -3.1Electricity . . . . . . . . . . . . . . . . . . . . . . . . 0.4 0.5 0.6 0.6 0.7 0.7 2.2Renewables. . . . . . . . . . . . . . . . . . . . . . 0.0 0.0 0.0 0.0 0.0 0.0 —
Total . . . . . . . . . . . . . . . . . . . . . . . . . . 3.5 3.6 3.9 4.0 4.0 3.9 0.5CommercialLiquids . . . . . . . . . . . . . . . . . . . . . . . . . . 0.1 0.1 0.0 0.1 0.1 0.1 -0.3Natural Gas . . . . . . . . . . . . . . . . . . . . . . 0.4 0.4 0.5 0.5 0.4 0.4 0.1Coal . . . . . . . . . . . . . . . . . . . . . . . . . . . . 0.0 0.0 0.0 0.0 0.0 0.0 -5.2Electricity . . . . . . . . . . . . . . . . . . . . . . . . 0.2 0.2 0.3 0.3 0.4 0.4 2.9Renewables. . . . . . . . . . . . . . . . . . . . . . 0.0 0.0 0.0 0.0 0.0 0.0 —
Total . . . . . . . . . . . . . . . . . . . . . . . . . . 0.7 0.7 0.8 0.8 0.9 0.9 1.1IndustrialLiquids . . . . . . . . . . . . . . . . . . . . . . . . . . 1.9 1.7 1.6 1.6 1.6 1.6 -0.7Natural Gas . . . . . . . . . . . . . . . . . . . . . . 3.6 4.0 4.6 5.0 5.2 5.4 1.7Coal . . . . . . . . . . . . . . . . . . . . . . . . . . . . 2.0 2.0 1.9 1.9 1.8 1.8 -0.5Electricity . . . . . . . . . . . . . . . . . . . . . . . . 1.0 1.1 1.3 1.4 1.5 1.5 1.5Renewables. . . . . . . . . . . . . . . . . . . . . . 0.0 0.0 0.0 0.0 0.0 0.0 -2.4
Total . . . . . . . . . . . . . . . . . . . . . . . . . . 8.5 8.8 9.5 9.9 10.1 10.3 0.8TransportationLiquids . . . . . . . . . . . . . . . . . . . . . . . . . . 2.3 2.6 2.8 2.9 3.2 3.5 1.8Natural Gas . . . . . . . . . . . . . . . . . . . . . . 0.3 0.3 0.4 0.4 0.4 0.4 1.6Coal . . . . . . . . . . . . . . . . . . . . . . . . . . . . 0.0 0.0 0.0 0.0 0.0 0.0 —Electricity . . . . . . . . . . . . . . . . . . . . . . . . 0.1 0.1 0.1 0.1 0.1 0.1 -0.1Total . . . . . . . . . . . . . . . . . . . . . . . . . . 2.6 3.0 3.2 3.4 3.7 4.0 1.8
All End-Use SectorsLiquids . . . . . . . . . . . . . . . . . . . . . . . . . . 4.4 4.6 4.6 4.8 5.1 5.3 0.8Natural Gas . . . . . . . . . . . . . . . . . . . . . . 6.9 7.5 8.4 8.9 9.1 9.2 1.2Coal . . . . . . . . . . . . . . . . . . . . . . . . . . . . 2.2 2.1 2.1 2.0 2.0 1.9 -0.7Electricity . . . . . . . . . . . . . . . . . . . . . . . . 1.8 1.9 2.2 2.4 2.6 2.7 1.9Renewables. . . . . . . . . . . . . . . . . . . . . . 0.0 0.0 0.0 0.0 0.0 0.0 -2.4
Delivered Energy . . . . . . . . . . . . . . . 15.3 16.2 17.4 18.1 18.7 19.1 0.9Electricity-Related Lossesa . . . . . . . . . . 5.0 5.6 5.9 6.2 6.4 6.5 1.1Total . . . . . . . . . . . . . . . . . . . . . . . . . . 20.3 21.7 23.3 24.3 25.0 25.6 1.0
Electric Powerb
Liquids . . . . . . . . . . . . . . . . . . . . . . . . . . 0.4 0.4 0.4 0.4 0.3 0.3 -0.3Natural Gas . . . . . . . . . . . . . . . . . . . . . . 2.2 2.4 2.7 2.9 3.1 3.2 1.6Coal . . . . . . . . . . . . . . . . . . . . . . . . . . . . 1.9 2.1 2.2 2.2 2.2 2.3 0.7Nuclear . . . . . . . . . . . . . . . . . . . . . . . . . 1.3 1.3 1.5 1.8 1.9 2.0 1.8Renewables. . . . . . . . . . . . . . . . . . . . . . 1.3 1.3 1.3 1.3 1.4 1.4 0.2
Total . . . . . . . . . . . . . . . . . . . . . . . . . . 7.1 7.5 8.1 8.6 8.9 9.2 1.1Total Energy ConsumptionLiquids . . . . . . . . . . . . . . . . . . . . . . . . . . 4.4 4.9 5.0 5.1 5.4 5.6 1.0Natural Gas . . . . . . . . . . . . . . . . . . . . . . 9.1 9.9 11.1 11.8 12.2 12.4 1.3Coal . . . . . . . . . . . . . . . . . . . . . . . . . . . . 4.2 4.2 4.3 4.2 4.1 4.2 0.0Nuclear . . . . . . . . . . . . . . . . . . . . . . . . . 1.4 1.3 1.5 1.8 1.9 2.0 1.6Renewables. . . . . . . . . . . . . . . . . . . . . . 1.3 1.3 1.3 1.4 1.4 1.4 0.3
Total . . . . . . . . . . . . . . . . . . . . . . . . . . 20.3 21.7 23.3 24.3 25.0 25.6 1.0aElectricity losses incurred in the transmission and distribution of electric power. May include some heat production.bFuel inputs used in the production of electricity and heat at central-station generators.Sources: 2006: Derived from Energy Information Administration (EIA), International Energy Annual 2006 (June-December 2008), web site
www.eia. doe.gov/iea. Projections: EIA, World Energy Projections Plus (2009).

Table F13. Delivered Energy Consumption in China by End-Use Sector and Fuel, 2006-2030(Quadrillion Btu)
Reference Case Projections by End-Use Sector and Country Grouping
Energy Information Administration / International Energy Outlook 2009 215
Sector/Fuel 2006
Projections Average AnnualPercent Change,
2006-20302010 2015 2020 2025 2030ResidentialLiquids . . . . . . . . . . . . . . . . . . . . . . . . . . 0.9 0.8 0.7 0.7 0.7 0.6 -1.2Natural Gas . . . . . . . . . . . . . . . . . . . . . . 0.5 0.6 0.8 1.0 1.3 1.8 5.8Coal . . . . . . . . . . . . . . . . . . . . . . . . . . . . 2.8 2.8 2.8 2.9 2.9 2.8 0.1Electricity . . . . . . . . . . . . . . . . . . . . . . . . 1.1 1.5 1.9 2.5 3.2 4.1 5.4Renewables. . . . . . . . . . . . . . . . . . . . . . 0.0 0.0 0.0 0.0 0.0 0.0 —
Total . . . . . . . . . . . . . . . . . . . . . . . . . . 5.2 5.6 6.2 7.0 8.0 9.3 2.4CommercialLiquids . . . . . . . . . . . . . . . . . . . . . . . . . . 1.0 0.9 0.8 0.8 0.8 0.8 -1.0Natural Gas . . . . . . . . . . . . . . . . . . . . . . 0.1 0.1 0.2 0.3 0.4 0.6 6.9Coal . . . . . . . . . . . . . . . . . . . . . . . . . . . . 0.3 0.3 0.3 0.3 0.3 0.3 0.0Electricity . . . . . . . . . . . . . . . . . . . . . . . . 0.5 0.5 0.7 1.0 1.4 2.0 6.3Renewables. . . . . . . . . . . . . . . . . . . . . . 0.0 0.0 0.0 0.0 0.0 0.0 —
Total . . . . . . . . . . . . . . . . . . . . . . . . . . 1.9 1.9 2.1 2.4 3.0 3.7 2.9IndustrialLiquids . . . . . . . . . . . . . . . . . . . . . . . . . . 7.2 8.3 9.2 10.6 11.6 12.3 2.2Natural Gas . . . . . . . . . . . . . . . . . . . . . . 1.1 1.4 2.1 2.5 2.9 3.2 4.6Coal . . . . . . . . . . . . . . . . . . . . . . . . . . . . 23.9 27.0 30.2 33.9 36.4 37.9 1.9Electricity . . . . . . . . . . . . . . . . . . . . . . . . 7.1 10.4 12.8 15.5 18.4 20.7 4.6Renewables. . . . . . . . . . . . . . . . . . . . . . 0.0 0.0 0.0 0.0 0.0 0.0 0.4
Total . . . . . . . . . . . . . . . . . . . . . . . . . . 39.3 47.1 54.3 62.5 69.3 74.1 2.7TransportationLiquids . . . . . . . . . . . . . . . . . . . . . . . . . . 5.2 6.9 9.1 12.1 14.8 17.2 5.1Natural Gas . . . . . . . . . . . . . . . . . . . . . . 0.0 0.0 0.0 0.0 0.0 0.0 11.2Coal . . . . . . . . . . . . . . . . . . . . . . . . . . . . 0.2 0.2 0.2 0.1 0.0 0.0 —Electricity . . . . . . . . . . . . . . . . . . . . . . . . 0.1 0.1 0.1 0.2 0.2 0.2 4.4Total . . . . . . . . . . . . . . . . . . . . . . . . . . 5.4 7.2 9.4 12.4 15.0 17.4 5.0
All End-Use SectorsLiquids . . . . . . . . . . . . . . . . . . . . . . . . . . 14.3 16.9 19.9 24.2 27.8 30.9 3.3Natural Gas . . . . . . . . . . . . . . . . . . . . . . 1.6 2.2 3.0 3.8 4.6 5.5 5.2Coal . . . . . . . . . . . . . . . . . . . . . . . . . . . . 27.1 30.2 33.5 37.2 39.6 41.0 1.7Electricity . . . . . . . . . . . . . . . . . . . . . . . . 8.8 12.5 15.6 19.2 23.2 27.0 4.8Renewables. . . . . . . . . . . . . . . . . . . . . . 0.0 0.0 0.0 0.0 0.0 0.0 0.4
Delivered Energy . . . . . . . . . . . . . . . 51.8 61.8 72.1 84.4 95.3 104.4 3.0Electricity-Related Lossesa . . . . . . . . . . 22.0 28.7 33.8 39.6 45.4 51.4 3.6Total . . . . . . . . . . . . . . . . . . . . . . . . . . 73.8 90.5 105.9 124.0 140.7 155.8 3.2
Electric Powerb
Liquids . . . . . . . . . . . . . . . . . . . . . . . . . . 0.5 0.5 0.5 0.5 0.5 0.5 0.1Natural Gas . . . . . . . . . . . . . . . . . . . . . . 0.4 0.6 0.9 1.2 1.5 1.5 5.3Coal . . . . . . . . . . . . . . . . . . . . . . . . . . . . 24.9 32.5 36.8 42.4 50.5 57.3 3.5Nuclear . . . . . . . . . . . . . . . . . . . . . . . . . 0.6 0.7 1.7 2.8 3.8 4.4 9.0Renewables. . . . . . . . . . . . . . . . . . . . . . 4.3 7.0 9.5 11.8 12.3 14.7 5.2Total . . . . . . . . . . . . . . . . . . . . . . . . . . 30.9 41.2 49.5 58.8 68.6 78.4 4.0
Total Energy ConsumptionLiquids . . . . . . . . . . . . . . . . . . . . . . . . . . 14.8 17.4 20.5 24.7 28.3 31.3 3.2Natural Gas . . . . . . . . . . . . . . . . . . . . . . 2.1 2.7 4.0 5.1 6.1 7.1 5.2Coal . . . . . . . . . . . . . . . . . . . . . . . . . . . . 52.0 62.7 70.3 79.5 90.1 98.3 2.7Nuclear . . . . . . . . . . . . . . . . . . . . . . . . . 0.6 0.7 1.7 2.8 3.8 4.4 9.0Renewables. . . . . . . . . . . . . . . . . . . . . . 4.3 7.0 9.5 11.8 12.4 14.7 5.2Total . . . . . . . . . . . . . . . . . . . . . . . . . . 73.8 90.5 105.9 124.0 140.7 155.8 3.2
aElectricity losses incurred in the transmission and distribution of electric power. May include some heat production.bFuel inputs used in the production of electricity and heat at central-station generators.Sources: 2006: Derived from Energy Information Administration (EIA), International Energy Annual 2006 (June-December 2008), web site
www.eia. doe.gov/iea. Projections: EIA, World Energy Projections Plus (2009).

Table F14. Delivered Energy Consumption in India by End-Use Sector and Fuel, 2006-2030(Quadrillion Btu)
Appendix F
216 Energy Information Administration / International Energy Outlook 2009
Sector/Fuel 2006
Projections Average AnnualPercent Change,
2006-20302010 2015 2020 2025 2030ResidentialLiquids . . . . . . . . . . . . . . . . . . . . . . . . . . 0.7 0.7 0.8 0.9 0.9 1.0 1.1Natural Gas . . . . . . . . . . . . . . . . . . . . . . 0.0 0.0 0.0 0.0 0.1 0.1 3.4Coal . . . . . . . . . . . . . . . . . . . . . . . . . . . . 0.1 0.1 0.2 0.2 0.2 0.2 1.6Electricity . . . . . . . . . . . . . . . . . . . . . . . . 0.4 0.5 0.7 0.9 1.2 1.5 5.6Renewables. . . . . . . . . . . . . . . . . . . . . . 0.0 0.0 0.0 0.0 0.0 0.0 —
Total . . . . . . . . . . . . . . . . . . . . . . . . . . 1.3 1.4 1.7 2.1 2.4 2.7 3.1CommercialLiquids . . . . . . . . . . . . . . . . . . . . . . . . . . 0.0 0.0 0.0 0.0 0.0 0.0 —Natural Gas . . . . . . . . . . . . . . . . . . . . . . 0.0 0.0 0.0 0.0 0.0 0.0 —Coal . . . . . . . . . . . . . . . . . . . . . . . . . . . . 0.2 0.2 0.2 0.2 0.2 0.3 2.0Electricity . . . . . . . . . . . . . . . . . . . . . . . . 0.1 0.2 0.3 0.3 0.4 0.6 5.9Renewables. . . . . . . . . . . . . . . . . . . . . . 0.0 0.0 0.0 0.0 0.0 0.0 —
Total . . . . . . . . . . . . . . . . . . . . . . . . . . 0.3 0.4 0.4 0.6 0.7 0.8 4.3IndustrialLiquids . . . . . . . . . . . . . . . . . . . . . . . . . . 2.4 2.5 3.2 4.0 4.3 4.6 2.8Natural Gas . . . . . . . . . . . . . . . . . . . . . . 0.8 1.0 1.2 1.4 1.5 1.6 2.7Coal . . . . . . . . . . . . . . . . . . . . . . . . . . . . 3.2 3.4 3.8 4.2 4.3 4.4 1.3Electricity . . . . . . . . . . . . . . . . . . . . . . . . 1.1 1.5 1.8 2.1 2.4 2.6 3.4Renewables. . . . . . . . . . . . . . . . . . . . . . 0.0 0.0 0.0 0.0 0.0 0.0 -0.4
Total . . . . . . . . . . . . . . . . . . . . . . . . . . 7.6 8.4 10.0 11.7 12.6 13.3 2.3TransportationLiquids . . . . . . . . . . . . . . . . . . . . . . . . . . 1.2 1.5 2.1 2.8 3.3 3.8 4.7Natural Gas . . . . . . . . . . . . . . . . . . . . . . 0.0 0.0 0.1 0.1 0.1 0.1 2.8Coal . . . . . . . . . . . . . . . . . . . . . . . . . . . . 0.0 0.0 0.0 0.0 0.0 0.0 —Electricity . . . . . . . . . . . . . . . . . . . . . . . . 0.0 0.0 0.1 0.1 0.1 0.1 3.3Total . . . . . . . . . . . . . . . . . . . . . . . . . . 1.3 1.6 2.2 3.0 3.4 3.9 4.7
All End-Use SectorsLiquids . . . . . . . . . . . . . . . . . . . . . . . . . . 4.4 4.8 6.1 7.7 8.6 9.4 3.2Natural Gas . . . . . . . . . . . . . . . . . . . . . . 0.9 1.0 1.3 1.5 1.7 1.8 2.8Coal . . . . . . . . . . . . . . . . . . . . . . . . . . . . 3.5 3.7 4.2 4.5 4.7 4.9 1.4Electricity . . . . . . . . . . . . . . . . . . . . . . . . 1.7 2.2 2.8 3.4 4.1 4.8 4.3Renewables. . . . . . . . . . . . . . . . . . . . . . 0.0 0.0 0.0 0.0 0.0 0.0 -0.4
Delivered Energy . . . . . . . . . . . . . . . 10.6 11.8 14.4 17.3 19.0 20.8 2.9Electricity-Related Lossesa . . . . . . . . . . 7.1 7.3 8.5 9.6 10.5 11.5 2.0Total . . . . . . . . . . . . . . . . . . . . . . . . . . 17.7 19.1 22.9 26.8 29.6 32.3 2.5
Electric Powerb
Liquids . . . . . . . . . . . . . . . . . . . . . . . . . . 0.2 0.2 0.2 0.2 0.2 0.2 -0.4Natural Gas . . . . . . . . . . . . . . . . . . . . . . 0.5 0.8 1.2 1.6 1.8 2.0 5.9Coal . . . . . . . . . . . . . . . . . . . . . . . . . . . . 5.9 6.5 7.1 7.5 8.1 9.3 1.9Nuclear . . . . . . . . . . . . . . . . . . . . . . . . . 0.2 0.4 0.7 1.1 1.4 1.6 9.2Renewables. . . . . . . . . . . . . . . . . . . . . . 1.2 1.6 2.1 2.6 3.0 3.2 4.2
Total . . . . . . . . . . . . . . . . . . . . . . . . . . 8.1 9.6 11.3 13.0 14.6 16.3 3.0Total Energy ConsumptionLiquids . . . . . . . . . . . . . . . . . . . . . . . . . . 5.4 5.0 6.3 7.9 8.7 9.6 2.4Natural Gas . . . . . . . . . . . . . . . . . . . . . . 1.4 1.9 2.5 3.1 3.5 3.8 4.2Coal . . . . . . . . . . . . . . . . . . . . . . . . . . . . 9.4 10.3 11.2 12.1 12.9 14.2 1.7Nuclear . . . . . . . . . . . . . . . . . . . . . . . . . 0.2 0.4 0.7 1.1 1.4 1.6 9.2Renewables. . . . . . . . . . . . . . . . . . . . . . 1.2 1.6 2.1 2.6 3.0 3.2 4.2
Total . . . . . . . . . . . . . . . . . . . . . . . . . . 17.7 19.1 22.9 26.8 29.6 32.3 2.5aElectricity losses incurred in the transmission and distribution of electric power. May include some heat production.bFuel inputs used in the production of electricity and heat at central-station generators.Sources: 2006: Derived from Energy Information Administration (EIA), International Energy Annual 2006 (June-December 2008), web site
www.eia. doe.gov/iea. Projections: EIA, World Energy Projections Plus (2009).

Table F15. Delivered Energy Consumption in Other Non-OECD Asia by End-Use Sector and Fuel, 2006-2030(Quadrillion Btu)
Reference Case Projections by End-Use Sector and Country Grouping
Energy Information Administration / International Energy Outlook 2009 217
Sector/Fuel 2006
Projections Average AnnualPercent Change,
2006-20302010 2015 2020 2025 2030ResidentialLiquids . . . . . . . . . . . . . . . . . . . . . . . . . . 0.9 0.8 0.8 0.9 0.9 1.0 0.3Natural Gas . . . . . . . . . . . . . . . . . . . . . . 0.3 0.3 0.4 0.5 0.6 0.7 3.3Coal . . . . . . . . . . . . . . . . . . . . . . . . . . . . 0.0 0.0 0.0 0.0 0.0 0.0 0.5Electricity . . . . . . . . . . . . . . . . . . . . . . . . 0.9 1.0 1.2 1.4 1.7 2.0 3.4Renewables. . . . . . . . . . . . . . . . . . . . . . 0.0 0.0 0.0 0.0 0.0 0.0 —
Total . . . . . . . . . . . . . . . . . . . . . . . . . . 2.1 2.2 2.5 2.8 3.2 3.6 2.3CommercialLiquids . . . . . . . . . . . . . . . . . . . . . . . . . . 0.3 0.3 0.3 0.3 0.3 0.3 0.5Natural Gas . . . . . . . . . . . . . . . . . . . . . . 0.1 0.1 0.1 0.1 0.1 0.1 2.1Coal . . . . . . . . . . . . . . . . . . . . . . . . . . . . 0.0 0.0 0.0 0.0 0.0 0.0 2.8Electricity . . . . . . . . . . . . . . . . . . . . . . . . 0.7 0.8 1.0 1.2 1.5 1.9 4.0Renewables. . . . . . . . . . . . . . . . . . . . . . 0.0 0.0 0.0 0.0 0.0 0.0 —
Total . . . . . . . . . . . . . . . . . . . . . . . . . . 1.1 1.1 1.3 1.6 1.9 2.3 3.2IndustrialLiquids . . . . . . . . . . . . . . . . . . . . . . . . . . 5.4 5.3 5.7 6.1 6.7 7.4 1.3Natural Gas . . . . . . . . . . . . . . . . . . . . . . 2.7 3.3 4.4 5.4 6.3 7.3 4.3Coal . . . . . . . . . . . . . . . . . . . . . . . . . . . . 2.1 2.2 2.5 2.7 3.0 3.3 1.9Electricity . . . . . . . . . . . . . . . . . . . . . . . . 1.3 1.5 1.8 2.2 2.5 3.0 3.6Renewables. . . . . . . . . . . . . . . . . . . . . . 0.0 0.0 0.0 0.0 0.0 0.0 0.8
Total . . . . . . . . . . . . . . . . . . . . . . . . . . 11.4 12.2 14.3 16.4 18.6 21.0 2.6TransportationLiquids . . . . . . . . . . . . . . . . . . . . . . . . . . 6.2 7.0 7.9 8.9 10.3 11.8 2.7Natural Gas . . . . . . . . . . . . . . . . . . . . . . 0.1 0.1 0.1 0.1 0.1 0.1 1.9Coal . . . . . . . . . . . . . . . . . . . . . . . . . . . . 0.0 0.0 0.0 0.0 0.0 0.0 —Electricity . . . . . . . . . . . . . . . . . . . . . . . . 0.0 0.0 0.0 0.0 0.0 0.0 1.4Total . . . . . . . . . . . . . . . . . . . . . . . . . . 6.3 7.0 7.9 9.0 10.4 11.9 2.7
All End-Use SectorsLiquids . . . . . . . . . . . . . . . . . . . . . . . . . . 12.7 13.4 14.6 16.2 18.2 20.4 2.0Natural Gas . . . . . . . . . . . . . . . . . . . . . . 3.1 3.7 5.0 6.0 7.0 8.2 4.1Coal . . . . . . . . . . . . . . . . . . . . . . . . . . . . 2.1 2.3 2.5 2.8 3.1 3.3 1.9Electricity . . . . . . . . . . . . . . . . . . . . . . . . 2.9 3.3 4.0 4.8 5.7 6.8 3.7Renewables. . . . . . . . . . . . . . . . . . . . . . 0.0 0.0 0.0 0.0 0.0 0.0 0.8
Delivered Energy . . . . . . . . . . . . . . . 20.9 22.6 26.1 29.8 34.0 38.7 2.6Electricity-Related Lossesa . . . . . . . . . . 5.2 7.0 8.3 9.7 11.1 12.8 3.8Total . . . . . . . . . . . . . . . . . . . . . . . . . . 26.1 29.6 34.4 39.5 45.1 51.5 2.9
Electric Powerb
Liquids . . . . . . . . . . . . . . . . . . . . . . . . . . 1.0 1.0 1.0 1.0 1.0 0.9 -0.3Natural Gas . . . . . . . . . . . . . . . . . . . . . . 3.0 3.4 4.2 5.0 5.6 6.1 3.0Coal . . . . . . . . . . . . . . . . . . . . . . . . . . . . 2.9 3.3 3.6 4.0 5.1 7.0 3.7Nuclear . . . . . . . . . . . . . . . . . . . . . . . . . 0.4 0.5 0.6 0.8 1.0 1.1 4.2Renewables. . . . . . . . . . . . . . . . . . . . . . 1.6 2.1 2.9 3.7 4.2 4.5 4.3
Total . . . . . . . . . . . . . . . . . . . . . . . . . . 9.0 10.3 12.3 14.5 16.8 19.6 3.3Total Energy ConsumptionLiquids . . . . . . . . . . . . . . . . . . . . . . . . . . 12.9 14.4 15.6 17.2 19.1 21.3 2.1Natural Gas . . . . . . . . . . . . . . . . . . . . . . 6.1 7.1 9.1 11.0 12.7 14.3 3.6Coal . . . . . . . . . . . . . . . . . . . . . . . . . . . . 5.1 5.5 6.1 6.7 8.1 10.4 3.0Nuclear . . . . . . . . . . . . . . . . . . . . . . . . . 0.4 0.5 0.6 0.8 1.0 1.1 4.1Renewables. . . . . . . . . . . . . . . . . . . . . . 1.6 2.1 2.9 3.7 4.2 4.5 4.3
Total . . . . . . . . . . . . . . . . . . . . . . . . . . 26.1 29.6 34.4 39.5 45.1 51.5 2.9aElectricity losses incurred in the transmission and distribution of electric power. May include some heat production.bFuel inputs used in the production of electricity and heat at central-station generators.Sources: 2006: Derived from Energy Information Administration (EIA), International Energy Annual 2006 (June-December 2008), web site
www.eia. doe.gov/iea. Projections: EIA, World Energy Projections Plus (2009).

Table F16. Delivered Energy Consumption in the Middle East by End-Use Sector and Fuel, 2006-2030(Quadrillion Btu)
Appendix F
218 Energy Information Administration / International Energy Outlook 2009
Sector/Fuel 2006
Projections Average AnnualPercent Change,
2006-20302010 2015 2020 2025 2030ResidentialLiquids . . . . . . . . . . . . . . . . . . . . . . . . . . 0.8 0.9 0.8 0.8 0.8 0.9 0.4Natural Gas . . . . . . . . . . . . . . . . . . . . . . 1.5 1.8 1.8 1.8 1.8 1.9 0.8Coal . . . . . . . . . . . . . . . . . . . . . . . . . . . . 0.0 0.0 0.0 0.0 0.0 0.0 5.9Electricity . . . . . . . . . . . . . . . . . . . . . . . . 0.9 1.0 1.1 1.3 1.4 1.6 2.5Renewables. . . . . . . . . . . . . . . . . . . . . . 0.0 0.0 0.0 0.0 0.0 0.0 —
Total . . . . . . . . . . . . . . . . . . . . . . . . . . 3.2 3.6 3.8 3.9 4.1 4.3 1.2CommercialLiquids . . . . . . . . . . . . . . . . . . . . . . . . . . 0.2 0.2 0.2 0.2 0.2 0.2 1.4Natural Gas . . . . . . . . . . . . . . . . . . . . . . 0.2 0.3 0.3 0.3 0.3 0.3 2.1Coal . . . . . . . . . . . . . . . . . . . . . . . . . . . . 0.0 0.0 0.0 0.0 0.0 0.0 —Electricity . . . . . . . . . . . . . . . . . . . . . . . . 0.5 0.5 0.6 0.7 0.9 1.0 3.2Renewables. . . . . . . . . . . . . . . . . . . . . . 0.0 0.0 0.0 0.0 0.0 0.0 —
Total . . . . . . . . . . . . . . . . . . . . . . . . . . 0.9 1.0 1.1 1.2 1.4 1.6 2.6IndustrialLiquids . . . . . . . . . . . . . . . . . . . . . . . . . . 4.0 4.8 5.0 5.3 5.9 6.5 2.1Natural Gas . . . . . . . . . . . . . . . . . . . . . . 5.1 6.3 7.4 7.7 8.1 8.6 2.2Coal . . . . . . . . . . . . . . . . . . . . . . . . . . . . 0.0 0.0 0.1 0.1 0.1 0.1 3.0Electricity . . . . . . . . . . . . . . . . . . . . . . . . 0.5 0.6 0.6 0.6 0.7 0.7 1.3Renewables. . . . . . . . . . . . . . . . . . . . . . 0.0 0.0 0.0 0.0 0.0 0.0 —
Total . . . . . . . . . . . . . . . . . . . . . . . . . . 9.6 11.7 13.1 13.8 14.7 15.9 2.1TransportationLiquids . . . . . . . . . . . . . . . . . . . . . . . . . . 5.0 6.0 6.6 7.2 7.9 8.9 2.4Natural Gas . . . . . . . . . . . . . . . . . . . . . . 0.0 0.0 0.0 0.0 0.0 0.0 1.0Coal . . . . . . . . . . . . . . . . . . . . . . . . . . . . 0.0 0.0 0.0 0.0 0.0 0.0 —Electricity . . . . . . . . . . . . . . . . . . . . . . . . 0.0 0.0 0.0 0.0 0.0 0.0 —Total . . . . . . . . . . . . . . . . . . . . . . . . . . 5.0 6.0 6.6 7.2 7.9 8.9 2.4
All End-Use SectorsLiquids . . . . . . . . . . . . . . . . . . . . . . . . . . 10.0 11.8 12.6 13.5 14.9 16.5 2.1Natural Gas . . . . . . . . . . . . . . . . . . . . . . 6.8 8.3 9.5 9.8 10.2 10.8 1.9Coal . . . . . . . . . . . . . . . . . . . . . . . . . . . . 0.0 0.0 0.1 0.1 0.1 0.1 3.0Electricity . . . . . . . . . . . . . . . . . . . . . . . . 1.9 2.1 2.4 2.6 3.0 3.3 2.4Renewables. . . . . . . . . . . . . . . . . . . . . . 0.0 0.0 0.0 0.0 0.0 0.0 —
Delivered Energy . . . . . . . . . . . . . . . 18.8 22.3 24.5 26.1 28.1 30.7 2.1Electricity-Related Lossesa . . . . . . . . . . 5.0 5.4 5.7 6.1 6.5 7.0 1.4Total . . . . . . . . . . . . . . . . . . . . . . . . . . 23.8 27.7 30.3 32.2 34.6 37.7 1.9
Electric Powerb
Liquids . . . . . . . . . . . . . . . . . . . . . . . . . . 2.4 2.6 2.7 2.6 2.6 2.7 0.5Natural Gas . . . . . . . . . . . . . . . . . . . . . . 3.9 4.2 4.7 5.2 5.8 6.5 2.1Coal . . . . . . . . . . . . . . . . . . . . . . . . . . . . 0.3 0.3 0.3 0.3 0.4 0.4 0.8Nuclear . . . . . . . . . . . . . . . . . . . . . . . . . 0.0 0.0 0.1 0.1 0.1 0.1 —Renewables. . . . . . . . . . . . . . . . . . . . . . 0.2 0.3 0.4 0.4 0.5 0.5 3.3
Total . . . . . . . . . . . . . . . . . . . . . . . . . . 6.9 7.5 8.1 8.7 9.4 10.3 1.7Total Energy ConsumptionLiquids . . . . . . . . . . . . . . . . . . . . . . . . . . 12.4 14.4 15.3 16.1 17.5 19.2 1.8Natural Gas . . . . . . . . . . . . . . . . . . . . . . 10.8 12.5 14.2 15.0 16.1 17.4 2.0Coal . . . . . . . . . . . . . . . . . . . . . . . . . . . . 0.4 0.4 0.4 0.4 0.4 0.5 1.1Nuclear . . . . . . . . . . . . . . . . . . . . . . . . . 0.0 0.0 0.1 0.1 0.1 0.1 —Renewables. . . . . . . . . . . . . . . . . . . . . . 0.2 0.3 0.4 0.5 0.5 0.5 3.4
Total . . . . . . . . . . . . . . . . . . . . . . . . . . 23.8 27.7 30.3 32.2 34.6 37.7 1.9aElectricity losses incurred in the transmission and distribution of electric power. May include some heat production.bFuel inputs used in the production of electricity and heat at central-station generators.Sources: 2006: Derived from Energy Information Administration (EIA), International Energy Annual 2006 (June-December 2008), web site
www.eia. doe.gov/iea. Projections: EIA, World Energy Projections Plus (2009).

Table F17. Delivered Energy Consumption in Africa by End-Use Sector and Fuel, 2006-2030(Quadrillion Btu)
Reference Case Projections by End-Use Sector and Country Grouping
Energy Information Administration / International Energy Outlook 2009 219
Sector/Fuel 2006
Projections Average AnnualPercent Change,
2006-20302010 2015 2020 2025 2030ResidentialLiquids . . . . . . . . . . . . . . . . . . . . . . . . . . 0.8 0.8 0.8 0.8 0.9 0.9 0.7Natural Gas . . . . . . . . . . . . . . . . . . . . . . 0.2 0.3 0.3 0.4 0.4 0.5 3.1Coal . . . . . . . . . . . . . . . . . . . . . . . . . . . . 0.1 0.1 0.1 0.1 0.2 0.2 2.3Electricity . . . . . . . . . . . . . . . . . . . . . . . . 0.5 0.6 0.7 0.8 0.9 1.1 3.3Renewables. . . . . . . . . . . . . . . . . . . . . . 0.0 0.0 0.0 0.0 0.0 0.0 —
Total . . . . . . . . . . . . . . . . . . . . . . . . . . 1.6 1.8 1.9 2.2 2.4 2.7 2.1CommercialLiquids . . . . . . . . . . . . . . . . . . . . . . . . . . 0.1 0.1 0.1 0.1 0.1 0.1 1.1Natural Gas . . . . . . . . . . . . . . . . . . . . . . 0.0 0.0 0.0 0.0 0.0 0.0 4.7Coal . . . . . . . . . . . . . . . . . . . . . . . . . . . . 0.1 0.1 0.1 0.1 0.1 0.1 2.0Electricity . . . . . . . . . . . . . . . . . . . . . . . . 0.2 0.2 0.3 0.4 0.4 0.5 3.9Renewables. . . . . . . . . . . . . . . . . . . . . . 0.0 0.0 0.0 0.0 0.0 0.0 —
Total . . . . . . . . . . . . . . . . . . . . . . . . . . 0.3 0.4 0.4 0.5 0.6 0.7 3.2IndustrialLiquids . . . . . . . . . . . . . . . . . . . . . . . . . . 1.5 1.7 1.7 1.7 1.7 1.8 0.7Natural Gas . . . . . . . . . . . . . . . . . . . . . . 1.3 1.6 2.0 2.3 2.6 2.7 3.1Coal . . . . . . . . . . . . . . . . . . . . . . . . . . . . 1.3 1.3 1.4 1.4 1.4 1.5 0.6Electricity . . . . . . . . . . . . . . . . . . . . . . . . 0.9 1.0 1.1 1.3 1.4 1.4 1.9Renewables. . . . . . . . . . . . . . . . . . . . . . 0.0 0.0 0.0 0.0 0.0 0.0 0.5
Total . . . . . . . . . . . . . . . . . . . . . . . . . . 5.0 5.5 6.2 6.7 7.1 7.4 1.6TransportationLiquids . . . . . . . . . . . . . . . . . . . . . . . . . . 3.2 3.7 3.9 4.1 4.3 4.5 1.5Natural Gas . . . . . . . . . . . . . . . . . . . . . . 0.1 0.1 0.1 0.1 0.1 0.1 2.8Coal . . . . . . . . . . . . . . . . . . . . . . . . . . . . 0.0 0.0 0.0 0.0 0.0 0.0 —Electricity . . . . . . . . . . . . . . . . . . . . . . . . 0.0 0.0 0.0 0.0 0.0 0.0 1.6Total . . . . . . . . . . . . . . . . . . . . . . . . . . 3.3 3.8 4.0 4.2 4.5 4.7 1.5
All End-Use SectorsLiquids . . . . . . . . . . . . . . . . . . . . . . . . . . 5.5 6.2 6.4 6.6 7.0 7.3 1.2Natural Gas . . . . . . . . . . . . . . . . . . . . . . 1.6 1.9 2.4 2.8 3.1 3.4 3.1Coal . . . . . . . . . . . . . . . . . . . . . . . . . . . . 1.4 1.5 1.5 1.6 1.7 1.7 0.8Electricity . . . . . . . . . . . . . . . . . . . . . . . . 1.6 1.8 2.1 2.5 2.8 3.1 2.6Renewables. . . . . . . . . . . . . . . . . . . . . . 0.0 0.0 0.0 0.0 0.0 0.0 0.5
Delivered Energy . . . . . . . . . . . . . . . 10.2 11.5 12.5 13.6 14.6 15.5 1.8Electricity-Related Lossesa . . . . . . . . . . 4.3 4.7 5.2 5.6 6.0 6.3 1.6Total . . . . . . . . . . . . . . . . . . . . . . . . . . 14.5 16.2 17.7 19.1 20.6 21.8 1.7
Electric Powerb
Liquids . . . . . . . . . . . . . . . . . . . . . . . . . . 0.6 0.9 0.9 0.9 0.8 0.8 1.0Natural Gas . . . . . . . . . . . . . . . . . . . . . . 1.6 1.7 2.2 2.7 3.1 3.3 3.2Coal . . . . . . . . . . . . . . . . . . . . . . . . . . . . 2.7 2.8 2.8 2.9 3.1 3.6 1.1Nuclear . . . . . . . . . . . . . . . . . . . . . . . . . 0.1 0.1 0.2 0.2 0.2 0.2 3.3Renewables. . . . . . . . . . . . . . . . . . . . . . 0.9 1.0 1.3 1.4 1.5 1.5 2.1
Total . . . . . . . . . . . . . . . . . . . . . . . . . . 6.0 6.6 7.3 8.0 8.7 9.4 1.9Total Energy ConsumptionLiquids . . . . . . . . . . . . . . . . . . . . . . . . . . 6.1 7.1 7.3 7.5 7.8 8.1 1.2Natural Gas . . . . . . . . . . . . . . . . . . . . . . 3.2 3.7 4.6 5.5 6.2 6.7 3.2Coal . . . . . . . . . . . . . . . . . . . . . . . . . . . . 4.2 4.2 4.4 4.6 4.8 5.3 1.0Nuclear . . . . . . . . . . . . . . . . . . . . . . . . . 0.1 0.1 0.2 0.2 0.2 0.2 3.3Renewables. . . . . . . . . . . . . . . . . . . . . . 0.9 1.0 1.3 1.4 1.5 1.5 2.1
Total . . . . . . . . . . . . . . . . . . . . . . . . . . 14.5 16.2 17.7 19.1 20.6 21.8 1.7aElectricity losses incurred in the transmission and distribution of electric power. May include some heat production.bFuel inputs used in the production of electricity and heat at central-station generators.Sources: 2006: Derived from Energy Information Administration (EIA), International Energy Annual 2006 (June-December 2008), web site
www.eia. doe.gov/iea. Projections: EIA, World Energy Projections Plus (2009).

Table F18. Delivered Energy Consumption in Brazil by End-Use Sector and Fuel, 2006-2030(Quadrillion Btu)
Appendix F
220 Energy Information Administration / International Energy Outlook 2009
Sector/Fuel 2006
Projections Average AnnualPercent Change,
2006-20302010 2015 2020 2025 2030ResidentialLiquids . . . . . . . . . . . . . . . . . . . . . . . . . . 0.3 0.3 0.3 0.3 0.3 0.3 1.1Natural Gas . . . . . . . . . . . . . . . . . . . . . . 0.0 0.0 0.0 0.0 0.0 0.0 7.3Coal . . . . . . . . . . . . . . . . . . . . . . . . . . . . 0.0 0.0 0.0 0.0 0.0 0.0 —Electricity . . . . . . . . . . . . . . . . . . . . . . . . 0.3 0.4 0.5 0.5 0.6 0.7 3.3Renewables. . . . . . . . . . . . . . . . . . . . . . 0.0 0.0 0.0 0.0 0.0 0.0 —
Total . . . . . . . . . . . . . . . . . . . . . . . . . . 0.6 0.7 0.8 0.9 1.0 1.1 2.5CommercialLiquids . . . . . . . . . . . . . . . . . . . . . . . . . . 0.0 0.1 0.1 0.1 0.1 0.1 1.3Natural Gas . . . . . . . . . . . . . . . . . . . . . . 0.0 0.0 0.0 0.0 0.0 0.0 5.0Coal . . . . . . . . . . . . . . . . . . . . . . . . . . . . 0.0 0.0 0.0 0.0 0.0 0.0 —Electricity . . . . . . . . . . . . . . . . . . . . . . . . 0.3 0.4 0.5 0.7 0.8 0.9 4.4Renewables. . . . . . . . . . . . . . . . . . . . . . 0.0 0.0 0.0 0.0 0.0 0.0 —
Total . . . . . . . . . . . . . . . . . . . . . . . . . . 0.4 0.5 0.6 0.7 0.9 1.0 4.1IndustrialLiquids . . . . . . . . . . . . . . . . . . . . . . . . . . 1.7 1.9 2.1 2.2 2.4 2.6 1.9Natural Gas . . . . . . . . . . . . . . . . . . . . . . 0.4 0.5 0.6 0.7 0.7 0.7 2.0Coal . . . . . . . . . . . . . . . . . . . . . . . . . . . . 0.4 0.4 0.5 0.6 0.7 0.8 3.2Electricity . . . . . . . . . . . . . . . . . . . . . . . . 0.6 0.8 0.9 1.0 1.0 1.1 2.4Renewables. . . . . . . . . . . . . . . . . . . . . . 0.2 0.2 0.2 0.2 0.2 0.2 0.5
Total . . . . . . . . . . . . . . . . . . . . . . . . . . 3.3 3.8 4.2 4.7 5.1 5.5 2.1TransportationLiquids . . . . . . . . . . . . . . . . . . . . . . . . . . 2.4 2.8 3.2 3.5 4.0 4.5 2.6Natural Gas . . . . . . . . . . . . . . . . . . . . . . 0.1 0.1 0.1 0.1 0.1 0.1 3.3Coal . . . . . . . . . . . . . . . . . . . . . . . . . . . . 0.0 0.0 0.0 0.0 0.0 0.0 —Electricity . . . . . . . . . . . . . . . . . . . . . . . . 0.0 0.0 0.0 0.0 0.0 0.0 1.1Total . . . . . . . . . . . . . . . . . . . . . . . . . . 2.5 2.9 3.3 3.7 4.1 4.7 2.7
All End-Use SectorsLiquids . . . . . . . . . . . . . . . . . . . . . . . . . . 4.4 5.1 5.6 6.1 6.8 7.6 2.3Natural Gas . . . . . . . . . . . . . . . . . . . . . . 0.5 0.6 0.7 0.8 0.9 0.9 2.4Coal . . . . . . . . . . . . . . . . . . . . . . . . . . . . 0.4 0.4 0.5 0.6 0.7 0.8 3.2Electricity . . . . . . . . . . . . . . . . . . . . . . . . 1.3 1.6 1.9 2.2 2.5 2.8 3.2Renewables. . . . . . . . . . . . . . . . . . . . . . 0.2 0.2 0.2 0.2 0.2 0.2 0.5
Delivered Energy . . . . . . . . . . . . . . . 6.8 7.9 8.9 9.9 11.1 12.3 2.5Electricity-Related Lossesa . . . . . . . . . . 2.8 3.4 4.0 4.6 5.2 5.8 3.0Total . . . . . . . . . . . . . . . . . . . . . . . . . . 9.6 11.4 12.9 14.5 16.3 18.0 2.6
Electric Powerb
Liquids . . . . . . . . . . . . . . . . . . . . . . . . . . 0.1 0.1 0.1 0.1 0.1 0.1 -0.6Natural Gas . . . . . . . . . . . . . . . . . . . . . . 0.2 0.4 0.5 0.6 0.9 0.9 7.1Coal . . . . . . . . . . . . . . . . . . . . . . . . . . . . 0.1 0.1 0.1 0.1 0.2 0.2 5.1Nuclear . . . . . . . . . . . . . . . . . . . . . . . . . 0.1 0.2 0.2 0.2 0.2 0.2 2.0Renewables. . . . . . . . . . . . . . . . . . . . . . 3.4 4.3 5.0 5.7 6.4 7.1 3.1
Total . . . . . . . . . . . . . . . . . . . . . . . . . . 4.2 5.0 5.9 6.8 7.7 8.5 3.0Total Energy ConsumptionLiquids . . . . . . . . . . . . . . . . . . . . . . . . . . 4.6 5.2 5.7 6.2 6.8 7.6 2.1Natural Gas . . . . . . . . . . . . . . . . . . . . . . 0.7 1.0 1.2 1.5 1.8 1.9 4.1Coal . . . . . . . . . . . . . . . . . . . . . . . . . . . . 0.4 0.5 0.6 0.7 0.9 1.0 3.5Nuclear . . . . . . . . . . . . . . . . . . . . . . . . . 0.1 0.2 0.2 0.2 0.2 0.2 2.1Renewables. . . . . . . . . . . . . . . . . . . . . . 3.6 4.5 5.2 5.9 6.6 7.3 3.0
Total . . . . . . . . . . . . . . . . . . . . . . . . . . 9.6 11.4 12.9 14.5 16.3 18.0 2.6aElectricity losses incurred in the transmission and distribution of electric power. May include some heat production.bFuel inputs used in the production of electricity and heat at central-station generators.Sources: 2006: Derived from Energy Information Administration (EIA), International Energy Annual 2006 (June-December 2008), web site
www.eia. doe.gov/iea. Projections: EIA, World Energy Projections Plus (2009).

Table F19. Delivered Energy Consumption in Other Central and South America by End-Use Sector and Fuel,2006-2030(Quadrillion Btu)
Reference Case Projections by End-Use Sector and Country Grouping
Energy Information Administration / International Energy Outlook 2009 221
Sector/Fuel 2006
Projections Average AnnualPercent Change,
2006-20302010 2015 2020 2025 2030ResidentialLiquids . . . . . . . . . . . . . . . . . . . . . . . . . . 0.5 0.5 0.5 0.5 0.5 0.5 0.1Natural Gas . . . . . . . . . . . . . . . . . . . . . . 0.4 0.5 0.6 0.6 0.7 0.8 2.6Coal . . . . . . . . . . . . . . . . . . . . . . . . . . . . 0.0 0.0 0.0 0.0 0.0 0.0 4.7Electricity . . . . . . . . . . . . . . . . . . . . . . . . 0.4 0.5 0.6 0.6 0.7 0.7 2.0Renewables. . . . . . . . . . . . . . . . . . . . . . 0.0 0.0 0.0 0.0 0.0 0.0 —
Total . . . . . . . . . . . . . . . . . . . . . . . . . . 1.3 1.5 1.6 1.7 1.8 2.0 1.6CommercialLiquids . . . . . . . . . . . . . . . . . . . . . . . . . . 0.1 0.1 0.1 0.1 0.1 0.1 0.7Natural Gas . . . . . . . . . . . . . . . . . . . . . . 0.1 0.1 0.1 0.1 0.1 0.1 1.5Coal . . . . . . . . . . . . . . . . . . . . . . . . . . . . 0.0 0.0 0.0 0.0 0.0 0.0 —Electricity . . . . . . . . . . . . . . . . . . . . . . . . 0.3 0.3 0.4 0.5 0.5 0.6 2.7Renewables. . . . . . . . . . . . . . . . . . . . . . 0.0 0.0 0.0 0.0 0.0 0.0 —
Total . . . . . . . . . . . . . . . . . . . . . . . . . . 0.5 0.5 0.6 0.6 0.7 0.8 2.1IndustrialLiquids . . . . . . . . . . . . . . . . . . . . . . . . . . 2.6 2.8 2.6 2.4 2.4 2.4 -0.3Natural Gas . . . . . . . . . . . . . . . . . . . . . . 2.5 2.9 3.3 3.5 3.8 3.8 1.8Coal . . . . . . . . . . . . . . . . . . . . . . . . . . . . 0.0 0.0 0.0 0.1 0.1 0.1 5.8Electricity . . . . . . . . . . . . . . . . . . . . . . . . 0.6 0.7 0.7 0.7 0.8 0.8 0.9Renewables. . . . . . . . . . . . . . . . . . . . . . 0.0 0.0 0.0 0.0 0.0 0.0 -0.2
Total . . . . . . . . . . . . . . . . . . . . . . . . . . 5.8 6.4 6.6 6.7 7.0 7.1 0.9TransportationLiquids . . . . . . . . . . . . . . . . . . . . . . . . . . 3.4 4.1 4.0 3.9 4.1 4.3 1.1Natural Gas . . . . . . . . . . . . . . . . . . . . . . 0.2 0.2 0.3 0.3 0.4 0.4 3.0Coal . . . . . . . . . . . . . . . . . . . . . . . . . . . . 0.0 0.0 0.0 0.0 0.0 0.0 —Electricity . . . . . . . . . . . . . . . . . . . . . . . . 0.0 0.0 0.0 0.0 0.0 0.0 2.6Total . . . . . . . . . . . . . . . . . . . . . . . . . . 3.6 4.3 4.3 4.3 4.5 4.8 1.2
All End-Use SectorsLiquids . . . . . . . . . . . . . . . . . . . . . . . . . . 6.5 7.5 7.1 6.9 7.1 7.4 0.5Natural Gas . . . . . . . . . . . . . . . . . . . . . . 3.2 3.7 4.2 4.6 4.9 5.1 2.0Coal . . . . . . . . . . . . . . . . . . . . . . . . . . . . 0.0 0.0 0.0 0.1 0.1 0.1 5.8Electricity . . . . . . . . . . . . . . . . . . . . . . . . 1.4 1.5 1.7 1.8 2.0 2.1 1.7Renewables. . . . . . . . . . . . . . . . . . . . . . 0.0 0.0 0.0 0.0 0.0 0.0 -0.2
Delivered Energy . . . . . . . . . . . . . . . 11.2 12.8 13.0 13.4 14.1 14.6 1.1Electricity-Related Lossesa . . . . . . . . . . 3.4 4.2 4.4 4.6 4.8 5.0 1.6Total . . . . . . . . . . . . . . . . . . . . . . . . . . 14.6 17.0 17.5 18.0 18.9 19.7 1.3
Electric Powerb
Liquids . . . . . . . . . . . . . . . . . . . . . . . . . . 0.8 0.8 0.8 0.7 0.7 0.7 -0.7Natural Gas . . . . . . . . . . . . . . . . . . . . . . 0.9 1.2 1.3 1.4 1.5 1.6 2.3Coal . . . . . . . . . . . . . . . . . . . . . . . . . . . . 0.4 0.4 0.4 0.4 0.4 0.5 1.3Nuclear . . . . . . . . . . . . . . . . . . . . . . . . . 0.1 0.1 0.1 0.1 0.1 0.1 2.0Renewables. . . . . . . . . . . . . . . . . . . . . . 3.0 3.3 3.6 3.8 4.0 4.2 1.4
Total . . . . . . . . . . . . . . . . . . . . . . . . . . 5.3 5.7 6.1 6.4 6.8 7.1 1.3Total Energy ConsumptionLiquids . . . . . . . . . . . . . . . . . . . . . . . . . . 7.1 8.3 7.9 7.7 7.8 8.0 0.5Natural Gas . . . . . . . . . . . . . . . . . . . . . . 4.1 4.8 5.4 6.0 6.5 6.7 2.1Coal . . . . . . . . . . . . . . . . . . . . . . . . . . . . 0.4 0.4 0.4 0.4 0.5 0.6 1.7Nuclear . . . . . . . . . . . . . . . . . . . . . . . . . 0.1 0.1 0.1 0.1 0.1 0.1 2.0Renewables. . . . . . . . . . . . . . . . . . . . . . 3.0 3.4 3.6 3.8 4.0 4.2 1.4
Total . . . . . . . . . . . . . . . . . . . . . . . . . . 14.6 17.0 17.5 18.0 18.9 19.7 1.3aElectricity losses incurred in the transmission and distribution of electric power. May include some heat production.bFuel inputs used in the production of electricity and heat at central-station generators.Sources: 2006: Derived from Energy Information Administration (EIA), International Energy Annual 2006 (June-December 2008), web site
www.eia. doe.gov/iea. Projections: EIA, World Energy Projections Plus (2009).


Appendix G
Projections of Liquid Fuels and Other PetroleumProduction in Five Cases:
• Reference• High Price• Low Price• High Economic Growth• Low Economic Growth


Table G1. World Total Liquids Production by Region and Country, Reference Case, 1990-2030(Million Barrels per Day)
Liquids Production Projections
Energy Information Administration / International Energy Outlook 2009 225
Region/Country
History (Estimates) Projections Average AnnualPercent Change,
2006-20301990 2006 2007 2010 2015 2020 2025 2030
OPECa . . . . . . . . . . . . . . . . . . . . . . . . . . . 23.7 34.7 34.4 35.6 38.1 39.9 41.4 43.8 1.0Middle East . . . . . . . . . . . . . . . . . . . . . . 16.1 23.6 23.1 23.8 25.4 26.7 27.8 29.5 0.9Iran . . . . . . . . . . . . . . . . . . . . . . . . . . . . 3.1 4.1 4.0 4.2 4.0 3.8 3.9 4.2 0.1Iraq . . . . . . . . . . . . . . . . . . . . . . . . . . . . 2.1 2.0 2.1 2.5 2.9 4.2 4.6 5.0 3.9Kuwait . . . . . . . . . . . . . . . . . . . . . . . . . . 1.2 2.7 2.6 2.7 2.7 2.6 2.7 2.9 0.3Qatar . . . . . . . . . . . . . . . . . . . . . . . . . . . 0.4 1.1 1.1 1.4 1.9 2.1 2.3 2.5 3.3Saudi Arabia . . . . . . . . . . . . . . . . . . . . . 7.0 10.7 10.2 10.0 10.9 11.0 11.3 12.0 0.5United Arab Emirates . . . . . . . . . . . . . . 2.3 2.9 2.9 3.0 3.0 2.9 2.9 2.9 -0.1
North Africa . . . . . . . . . . . . . . . . . . . . . . 2.7 3.9 4.0 4.1 4.4 4.3 4.3 4.3 0.4Algeria . . . . . . . . . . . . . . . . . . . . . . . . . . 1.3 2.1 2.2 2.2 2.7 2.8 2.8 2.8 1.1Libya . . . . . . . . . . . . . . . . . . . . . . . . . . . 1.4 1.8 1.8 1.9 1.7 1.5 1.5 1.5 -0.7
West Africa . . . . . . . . . . . . . . . . . . . . . . 2.3 3.9 4.1 4.8 5.6 5.7 5.8 6.1 1.9Angola . . . . . . . . . . . . . . . . . . . . . . . . . . 0.5 1.4 1.8 2.3 2.5 2.4 2.5 2.7 2.7Nigeria. . . . . . . . . . . . . . . . . . . . . . . . . . 1.8 2.4 2.4 2.4 3.1 3.3 3.4 3.4 1.4
South America. . . . . . . . . . . . . . . . . . . . 2.5 3.3 3.2 2.9 2.8 3.2 3.6 3.8 0.6Ecuador. . . . . . . . . . . . . . . . . . . . . . . . . 0.3 0.5 0.5 0.5 0.4 0.4 0.4 0.4 -0.7Venezuela . . . . . . . . . . . . . . . . . . . . . . . 2.3 2.7 2.7 2.4 2.4 2.8 3.1 3.4 0.9
Non-OPEC . . . . . . . . . . . . . . . . . . . . . . . . 42.8 49.9 50.4 50.7 52.5 56.0 59.6 62.8 1.0OECD . . . . . . . . . . . . . . . . . . . . . . . . . . . 20.0 21.7 21.7 21.5 21.5 22.1 23.8 24.8 0.6OECD North America . . . . . . . . . . . . . 14.7 15.3 15.5 16.1 16.7 17.7 19.5 20.4 1.2United States. . . . . . . . . . . . . . . . . . . . 9.7 8.3 8.6 9.7 10.2 11.3 12.4 12.7 1.8Canada . . . . . . . . . . . . . . . . . . . . . . . . 2.0 3.3 3.4 3.7 4.3 4.6 5.0 5.4 2.1Mexico. . . . . . . . . . . . . . . . . . . . . . . . . 3.0 3.7 3.5 2.7 2.1 1.9 2.0 2.3 -2.0
OECD Europe . . . . . . . . . . . . . . . . . . . 4.5 5.6 5.4 4.6 4.0 3.6 3.5 3.5 -2.0OECD Asia . . . . . . . . . . . . . . . . . . . . . . 0.8 0.7 0.8 0.8 0.7 0.8 0.8 0.9 0.8
Japan . . . . . . . . . . . . . . . . . . . . . . . . . 0.1 0.1 0.1 0.1 0.1 0.2 0.2 0.2 2.2South Korea . . . . . . . . . . . . . . . . . . . . 0.0 0.0 0.0 0.0 0.0 0.0 0.0 0.0 4.6Australia and New Zealand . . . . . . . . . 0.7 0.6 0.6 0.6 0.6 0.6 0.6 0.6 0.3
Non-OECD . . . . . . . . . . . . . . . . . . . . . . . 22.8 28.2 28.7 29.2 31.0 34.0 35.9 38.1 1.2Non-OECD Europe and Eurasia. . . . . 11.6 12.3 12.8 12.6 13.6 15.2 16.0 16.8 1.3
Russia . . . . . . . . . . . . . . . . . . . . . . . . . 10.1 9.7 9.9 9.4 9.5 10.9 11.5 11.9 0.9Caspian Area . . . . . . . . . . . . . . . . . . . 1.1 2.3 2.6 2.9 3.8 4.1 4.3 4.6 2.9Other . . . . . . . . . . . . . . . . . . . . . . . . . . 0.4 0.3 0.3 0.3 0.2 0.2 0.2 0.2 -1.4
Non-OECD Asia . . . . . . . . . . . . . . . . . . 6.0 7.8 7.7 7.9 7.8 7.9 8.1 8.4 0.3China. . . . . . . . . . . . . . . . . . . . . . . . . . 2.8 3.9 3.9 4.1 3.8 3.8 3.9 4.1 0.3India . . . . . . . . . . . . . . . . . . . . . . . . . . 0.7 0.9 0.9 0.9 1.0 1.1 1.3 1.3 1.7Other . . . . . . . . . . . . . . . . . . . . . . . . . . 2.5 3.0 2.9 2.9 3.0 3.0 2.9 3.0 -0.1
Middle East (Non-OPEC) . . . . . . . . . . 1.3 1.6 1.5 1.5 1.6 1.3 1.3 1.2 -1.2Africa . . . . . . . . . . . . . . . . . . . . . . . . . . 1.7 2.5 2.6 2.7 2.8 2.9 3.1 3.2 1.0Central and South America . . . . . . . . 2.2 4.0 4.1 4.5 5.3 6.5 7.4 8.4 3.2Brazil . . . . . . . . . . . . . . . . . . . . . . . . . . 0.9 2.1 2.3 2.6 3.6 4.7 5.3 5.9 4.3Other . . . . . . . . . . . . . . . . . . . . . . . . . . 1.3 1.8 1.8 1.8 1.7 1.8 2.1 2.5 1.4
Total World . . . . . . . . . . . . . . . . . . . . . . . 66.5 84.6 84.8 86.3 90.6 95.9 101.1 106.6 1.0
OPEC Share of World Production. . . . . . . 36% 41% 41% 41% 42% 42% 41% 41%Persian Gulf Share of World Production . . 24% 28% 27% 28% 28% 28% 27% 28%
aOPEC = Organization of the Petroleum Exporting Countries (OPEC-12).Sources: History: Energy Information Administration (EIA), Office of Energy Markets and End Use. Projections: EIA, Generate
World Oil Balance Model (2009).

Table G2. World Conventional Liquids Production by Region and Country, Reference Case, 1990-2030(Million Barrels per Day)
Appendix G
226 Energy Information Administration / International Energy Outlook 2009
Region/Country
History (Estimates) Projections Average AnnualPercent Change,
2006-20301990 2006 2007 2010 2015 2020 2025 2030
OPECa . . . . . . . . . . . . . . . . . . . . . . . . . . . 23.7 34.0 33.7 35.0 37.3 38.8 40.2 42.3 0.9Middle East . . . . . . . . . . . . . . . . . . . . . . 16.1 23.5 23.0 23.8 25.3 26.5 27.6 29.3 0.9Iran . . . . . . . . . . . . . . . . . . . . . . . . . . . . 3.1 4.1 4.0 4.2 4.0 3.8 3.9 4.2 0.1Iraq . . . . . . . . . . . . . . . . . . . . . . . . . . . . 2.1 2.0 2.1 2.5 2.9 4.2 4.6 5.0 3.9Kuwait . . . . . . . . . . . . . . . . . . . . . . . . . . 1.2 2.7 2.6 2.7 2.7 2.6 2.7 2.9 0.3Qatar . . . . . . . . . . . . . . . . . . . . . . . . . . . 0.4 1.1 1.1 1.4 1.8 1.9 2.1 2.3 3.0Saudi Arabia . . . . . . . . . . . . . . . . . . . . . 7.0 10.6 10.2 10.0 10.9 11.0 11.3 12.0 0.5United Arab Emirates . . . . . . . . . . . . . . 2.3 2.9 2.9 3.0 3.0 2.9 2.9 2.9 -0.1
North Africa . . . . . . . . . . . . . . . . . . . . . . 2.7 3.9 4.0 4.1 4.4 4.3 4.3 4.3 0.4Algeria . . . . . . . . . . . . . . . . . . . . . . . . . . 1.3 2.1 2.2 2.2 2.7 2.8 2.8 2.8 1.1Libya . . . . . . . . . . . . . . . . . . . . . . . . . . . 1.4 1.8 1.8 1.9 1.7 1.5 1.5 1.5 -0.7
West Africa . . . . . . . . . . . . . . . . . . . . . . 2.3 3.9 4.1 4.8 5.6 5.6 5.8 6.0 1.9Angola . . . . . . . . . . . . . . . . . . . . . . . . . . 0.5 1.4 1.8 2.3 2.5 2.4 2.5 2.7 2.7Nigeria. . . . . . . . . . . . . . . . . . . . . . . . . . 1.8 2.4 2.4 2.4 3.1 3.2 3.3 3.3 1.3
South America. . . . . . . . . . . . . . . . . . . . 2.5 2.7 2.6 2.2 2.1 2.4 2.6 2.6 -0.1Ecuador. . . . . . . . . . . . . . . . . . . . . . . . . 0.3 0.5 0.5 0.5 0.4 0.4 0.4 0.4 -0.7Venezuela . . . . . . . . . . . . . . . . . . . . . . . 2.3 2.1 2.1 1.8 1.7 1.9 2.1 2.2 0.0
Non-OPEC . . . . . . . . . . . . . . . . . . . . . . . . 42.0 47.5 47.4 46.3 46.1 47.9 49.4 50.9 0.3OECD . . . . . . . . . . . . . . . . . . . . . . . . . . . 19.5 19.8 19.4 18.0 16.5 16.1 16.6 16.7 -0.7OECD North America . . . . . . . . . . . . . 14.3 13.6 13.4 13.0 12.2 12.3 12.9 13.1 -0.2United States. . . . . . . . . . . . . . . . . . . . 9.6 7.8 7.8 8.5 8.6 9.3 10.0 10.0 1.0Canada . . . . . . . . . . . . . . . . . . . . . . . . 1.7 2.1 2.1 1.8 1.5 1.2 1.1 1.0 -2.9Mexico. . . . . . . . . . . . . . . . . . . . . . . . . 3.0 3.7 3.5 2.7 2.1 1.8 1.9 2.1 -2.4
OECD Europe . . . . . . . . . . . . . . . . . . . 4.5 5.5 5.2 4.2 3.6 3.1 2.9 2.9 -2.7Denmark . . . . . . . . . . . . . . . . . . . . . . . 0.1 0.3 0.3 0.3 0.2 0.1 0.1 0.1 -5.7Norway . . . . . . . . . . . . . . . . . . . . . . . . 1.7 2.8 2.6 2.2 1.9 1.6 1.5 1.4 -2.9United Kngdom . . . . . . . . . . . . . . . . . . 2.0 1.7 1.7 1.2 1.0 0.8 0.7 0.7 -3.4Other . . . . . . . . . . . . . . . . . . . . . . . . . . 0.7 0.7 0.7 0.6 0.6 0.6 0.7 0.7 0.1
OECD Asia . . . . . . . . . . . . . . . . . . . . . . 0.8 0.7 0.8 0.8 0.7 0.7 0.7 0.7 0.1Japan . . . . . . . . . . . . . . . . . . . . . . . . . 0.1 0.1 0.1 0.1 0.1 0.2 0.2 0.2 1.2South Korea . . . . . . . . . . . . . . . . . . . . 0.0 0.0 0.0 0.0 0.0 0.0 0.0 0.0 4.0Australia and New Zealand . . . . . . . . . 0.7 0.6 0.6 0.6 0.6 0.5 0.5 0.5 -0.3
aOPEC = Organization of the Petroleum Exporting Countries (OPEC-12).

Table G2. World Conventional Liquids Production by Region and Country, Reference Case, 1990-2030(Continued)(Million Barrels per Day)
Liquids Production Projections
Energy Information Administration / International Energy Outlook 2009 227
Region/Country
History (Estimates) Projections Average AnnualPercent Change,
2006-20301990 2006 2007 2010 2015 2020 2025 2030
Non-OECD . . . . . . . . . . . . . . . . . . . . . . . 22.5 27.7 28.0 28.3 29.6 31.8 32.8 34.2 0.9Non-OECD Europe and Eurasia. . . . . 11.6 12.3 12.8 12.6 13.6 15.2 16.0 16.8 1.3
Russia . . . . . . . . . . . . . . . . . . . . . . . . 10.1 9.7 9.9 9.4 9.5 10.9 11.5 11.9 0.9Caspian Area . . . . . . . . . . . . . . . . . . . 1.1 2.3 2.6 2.9 3.8 4.1 4.3 4.6 2.9
Azerbaijan . . . . . . . . . . . . . . . . . . . . . 0.3 0.6 0.8 1.1 1.0 1.0 1.0 1.0 1.9Kazakhstan . . . . . . . . . . . . . . . . . . . . 0.6 1.4 1.4 1.6 2.5 2.7 2.9 3.2 3.6Turkmenistan . . . . . . . . . . . . . . . . . . 0.1 0.2 0.2 0.2 0.3 0.3 0.3 0.3 2.6Uzbekistan . . . . . . . . . . . . . . . . . . . . 0.1 0.1 0.1 0.1 0.1 0.1 0.1 0.1 -1.3
Other. . . . . . . . . . . . . . . . . . . . . . . . . . 0.4 0.3 0.3 0.3 0.2 0.2 0.2 0.2 -1.4Non-OECD Asia . . . . . . . . . . . . . . . . . . 6.0 7.7 7.7 7.7 7.4 7.3 7.0 6.7 -0.6China. . . . . . . . . . . . . . . . . . . . . . . . . . 2.8 3.9 3.9 4.0 3.6 3.5 3.2 3.1 -0.9India . . . . . . . . . . . . . . . . . . . . . . . . . . 0.7 0.9 0.9 0.9 0.9 1.0 1.1 1.0 0.4Brunei . . . . . . . . . . . . . . . . . . . . . . . . . 0.2 0.2 0.2 0.1 0.1 0.1 0.1 0.1 -2.6Malaysia . . . . . . . . . . . . . . . . . . . . . . . 0.6 0.7 0.7 0.7 0.7 0.7 0.7 0.7 -0.2Thailand . . . . . . . . . . . . . . . . . . . . . . . 0.1 0.3 0.3 0.4 0.4 0.4 0.4 0.4 0.6Vietnam . . . . . . . . . . . . . . . . . . . . . . . . 0.1 0.4 0.4 0.4 0.4 0.4 0.4 0.4 0.3Other . . . . . . . . . . . . . . . . . . . . . . . . . . 1.6 1.4 1.3 1.3 1.3 1.2 1.1 1.0 -1.3
Middle East (Non-OPEC) . . . . . . . . . . 1.3 1.6 1.5 1.5 1.6 1.3 1.3 1.2 -1.2Oman . . . . . . . . . . . . . . . . . . . . . . . . . 0.7 0.7 0.7 0.8 0.9 0.7 0.7 0.7 -0.2Syria . . . . . . . . . . . . . . . . . . . . . . . . . . 0.4 0.4 0.4 0.5 0.4 0.4 0.3 0.3 -1.5Yemen. . . . . . . . . . . . . . . . . . . . . . . . . 0.2 0.4 0.3 0.3 0.2 0.2 0.2 0.2 -3.7Other . . . . . . . . . . . . . . . . . . . . . . . . . . 0.0 0.1 0.1 0.1 0.0 0.0 0.0 0.0 -0.5
Africa . . . . . . . . . . . . . . . . . . . . . . . . . . 1.6 2.4 2.4 2.5 2.4 2.5 2.6 2.7 0.5Chad . . . . . . . . . . . . . . . . . . . . . . . . . . 0.0 0.2 0.1 0.1 0.1 0.1 0.1 0.1 -4.0Congo (Brazzaville) . . . . . . . . . . . . . . . 0.2 0.2 0.2 0.3 0.3 0.3 0.4 0.4 2.0Egypt . . . . . . . . . . . . . . . . . . . . . . . . . . 0.9 0.7 0.7 0.5 0.6 0.6 0.6 0.6 -0.2Equatorial Guniea . . . . . . . . . . . . . . . . 0.0 0.4 0.4 0.3 0.4 0.3 0.4 0.3 -0.4Gabon . . . . . . . . . . . . . . . . . . . . . . . . . 0.3 0.2 0.2 0.2 0.2 0.2 0.2 0.1 -2.0Sao Tome and Principe. . . . . . . . . . . . 0.0 0.0 0.0 0.0 0.0 0.0 0.0 0.1 —Sudan . . . . . . . . . . . . . . . . . . . . . . . . . 0.0 0.4 0.5 0.6 0.5 0.5 0.6 0.7 2.3Other . . . . . . . . . . . . . . . . . . . . . . . . . . 0.3 0.3 0.3 0.4 0.4 0.4 0.4 0.4 0.5
Central and South America . . . . . . . . 2.0 3.7 3.7 4.0 4.5 5.4 6.0 6.8 2.6Brazil . . . . . . . . . . . . . . . . . . . . . . . . . . 0.7 1.9 1.9 2.2 3.0 3.9 4.4 4.8 4.1Argentina. . . . . . . . . . . . . . . . . . . . . . . 0.5 0.8 0.8 0.7 0.5 0.4 0.4 0.3 -3.4Colombia . . . . . . . . . . . . . . . . . . . . . . . 0.5 0.5 0.5 0.5 0.4 0.4 0.4 0.4 -1.8Peru. . . . . . . . . . . . . . . . . . . . . . . . . . . 0.1 0.1 0.1 0.1 0.2 0.2 0.3 0.3 4.3Trinidad and Tobago . . . . . . . . . . . . . . 0.1 0.2 0.2 0.2 0.2 0.1 0.1 0.1 -1.4Other . . . . . . . . . . . . . . . . . . . . . . . . . . 0.1 0.2 0.2 0.2 0.2 0.3 0.5 0.8 6.4
Total World . . . . . . . . . . . . . . . . . . . . . . . 65.7 81.5 81.1 81.3 83.4 86.7 89.6 93.1 0.6
OPEC Share of World Production. . . . . . . 36% 42% 42% 43% 45% 45% 45% 45%Persian Gulf Share of World Production . . 25% 29% 28% 29% 30% 31% 31% 31%
Note: Conventional liquids include crude oil and lease condensate, natural gas plant liquids, and refinery gain.Sources: History: Energy Information Administration (EIA), Office of Energy Markets and End Use. Projections: EIA, Generate
World Oil Balance Model (2009).

Table G3. World Unconventional Liquids Production by Region and Country, Reference Case, 1990-2030(Million Barrels per Day)
Appendix G
228 Energy Information Administration / International Energy Outlook 2009
Region/Country
History (Estimates) Projections Average AnnualPercent Change,
2006-20301990 2006 2007 2010 2015 2020 2025 2030
OPECa . . . . . . . . . . . . . . . . . . . . . . . . . . . 0.0 0.7 0.7 0.6 0.8 1.1 1.3 1.5 3.3Biofuels . . . . . . . . . . . . . . . . . . . . . . . . . . 0.0 0.0 0.0 0.0 0.0 0.0 0.0 0.0 —Extra-Heavy Oil (Venezuela). . . . . . . . . . 0.0 0.6 0.6 0.6 0.7 0.8 1.0 1.2 2.8Coal-to-Liquids . . . . . . . . . . . . . . . . . . . . 0.0 0.0 0.0 0.0 0.0 0.0 0.0 0.0 —Gas-to-Liquids (primarily Qatar) . . . . . . . 0.0 0.0 0.0 0.0 0.1 0.2 0.3 0.3 18.3
Non-OPEC . . . . . . . . . . . . . . . . . . . . . . . . 0.7 2.4 3.0 4.4 6.4 8.1 10.3 11.9 6.9OECD . . . . . . . . . . . . . . . . . . . . . . . . . . . 0.5 1.9 2.3 3.5 5.0 5.9 7.2 8.1 6.3Biofuels . . . . . . . . . . . . . . . . . . . . . . . . . 0.0 0.5 0.6 1.2 1.7 2.1 2.7 2.9 8.0Oil Sands/Bitumen (Canada) . . . . . . . . 0.4 1.2 1.4 1.9 2.8 3.3 3.8 4.2 5.3Extra-Heavy Oil (Mexico) . . . . . . . . . . . 0.0 0.0 0.0 0.0 0.0 0.0 0.1 0.1 14.3Coal-to-Liquids . . . . . . . . . . . . . . . . . . . 0.0 0.0 0.0 0.0 0.1 0.1 0.2 0.3 26.0Gas-to-Liquids. . . . . . . . . . . . . . . . . . . . 0.0 0.0 0.0 0.0 0.0 0.0 0.0 0.0 —Shale Oil . . . . . . . . . . . . . . . . . . . . . . . . 0.0 0.0 0.0 0.0 0.0 0.0 0.1 0.1 —
Non-OECD . . . . . . . . . . . . . . . . . . . . . . . 0.3 0.5 0.7 0.9 1.4 2.2 3.1 3.9 8.8Biofuels . . . . . . . . . . . . . . . . . . . . . . . . . 0.2 0.3 0.4 0.7 1.2 1.7 2.4 2.9 9.3Extra-Heavy Oil . . . . . . . . . . . . . . . . . . . 0.0 0.0 0.0 0.0 0.0 0.0 0.0 0.0 —Coal-to-Liquids . . . . . . . . . . . . . . . . . . . 0.1 0.1 0.2 0.2 0.2 0.4 0.7 0.9 8.0Gas-to-Liquids. . . . . . . . . . . . . . . . . . . . 0.0 0.0 0.0 0.0 0.1 0.1 0.1 0.1 —Shale Oil . . . . . . . . . . . . . . . . . . . . . . . . 0.0 0.0 0.0 0.0 0.0 0.0 0.0 0.0 0.5
WorldBiofuels . . . . . . . . . . . . . . . . . . . . . . . . . . 0.2 0.8 1.1 1.9 2.8 3.9 5.1 5.9 8.6Oil Sands/Bitumen . . . . . . . . . . . . . . . . . 0.4 1.2 1.4 1.9 2.8 3.3 3.8 4.2 5.3Extra-Heavy Oil . . . . . . . . . . . . . . . . . . . . 0.0 0.6 0.6 0.7 0.7 0.9 1.0 1.2 3.0Coal-to-Liquids . . . . . . . . . . . . . . . . . . . . 0.1 0.1 0.2 0.2 0.3 0.5 0.8 1.2 9.0Gas-to-Liquids. . . . . . . . . . . . . . . . . . . . . 0.0 0.0 0.1 0.1 0.2 0.3 0.3 0.3 19.3Shale Oil . . . . . . . . . . . . . . . . . . . . . . . . . 0.0 0.0 0.0 0.0 0.0 0.0 0.1 0.2 13.9
World Total . . . . . . . . . . . . . . . . . . . . . . . 0.8 3.1 3.7 5.0 7.2 9.2 11.5 13.4 6.3
Selected Country HighlightsBiofuelsBrazil . . . . . . . . . . . . . . . . . . . . . . . . . . . 0.2 0.3 0.3 0.4 0.6 0.8 0.9 1.0 5.6China. . . . . . . . . . . . . . . . . . . . . . . . . . . 0.0 0.0 0.0 0.1 0.2 0.3 0.4 0.5 12.9India . . . . . . . . . . . . . . . . . . . . . . . . . . . 0.0 0.0 0.0 0.0 0.0 0.1 0.2 0.2 18.5United States. . . . . . . . . . . . . . . . . . . . . 0.0 0.3 0.5 0.9 1.2 1.4 1.8 1.9 7.4
Coal-to-LiquidsAustralia and New Zealand . . . . . . . . . . 0.0 0.0 0.0 0.0 0.0 0.0 0.0 0.0 —China. . . . . . . . . . . . . . . . . . . . . . . . . . . 0.0 0.0 0.0 0.0 0.0 0.1 0.3 0.5 —Germany . . . . . . . . . . . . . . . . . . . . . . . . 0.0 0.0 0.0 0.0 0.0 0.0 0.0 0.0 0.4India . . . . . . . . . . . . . . . . . . . . . . . . . . . 0.0 0.0 0.0 0.0 0.0 0.0 0.1 0.1 —South Africa. . . . . . . . . . . . . . . . . . . . . . 0.1 0.1 0.2 0.2 0.2 0.3 0.3 0.3 2.6United States. . . . . . . . . . . . . . . . . . . . . 0.0 0.0 0.0 0.0 0.1 0.1 0.2 0.3 —
Gas-to-LiquidsQatar . . . . . . . . . . . . . . . . . . . . . . . . . . . 0.0 0.0 0.0 0.0 0.1 0.2 0.2 0.2 17.1South Africa. . . . . . . . . . . . . . . . . . . . . . 0.0 0.0 0.0 0.0 0.1 0.1 0.1 0.1 —
aOPEC = Organization of the Petroleum Exporting Countries (OPEC-12).Sources: History: Energy Information Administration (EIA), Office of Energy Markets and End Use. Projections: EIA, Generate
World Oil Balance Model (2009).

Table G4. World Total Liquids Production by Region and Country, High Oil Price Case, 1990-2030(Million Barrels per Day)
Liquids Production Projections
Energy Information Administration / International Energy Outlook 2009 229
Region/Country
History (Estimates) Projections Average AnnualPercent Change,
2006-20301990 2006 2007 2010 2015 2020 2025 2030
OPECa . . . . . . . . . . . . . . . . . . . . . . . . . . . 23.7 34.7 34.4 35.4 31.1 29.0 28.2 28.2 -0.9Middle East . . . . . . . . . . . . . . . . . . . . . . 16.1 23.6 23.1 23.8 20.8 19.6 19.0 19.1 -0.9Iran . . . . . . . . . . . . . . . . . . . . . . . . . . . . 3.1 4.1 4.0 4.2 3.2 2.7 2.6 2.6 -1.9Iraq . . . . . . . . . . . . . . . . . . . . . . . . . . . . 2.1 2.0 2.1 2.5 2.3 2.9 2.9 3.0 1.7Kuwait . . . . . . . . . . . . . . . . . . . . . . . . . . 1.2 2.7 2.6 2.7 2.2 1.9 1.8 1.8 -1.6Qatar . . . . . . . . . . . . . . . . . . . . . . . . . . . 0.4 1.1 1.1 1.4 1.6 1.7 1.7 1.9 2.0Saudi Arabia . . . . . . . . . . . . . . . . . . . . . 7.0 10.7 10.2 10.0 9.1 8.2 7.9 7.9 -1.2United Arab Emirates . . . . . . . . . . . . . . 2.3 2.9 2.9 3.0 2.5 2.2 2.0 1.9 -1.7
North Africa . . . . . . . . . . . . . . . . . . . . . . 2.7 3.9 4.0 4.1 3.6 3.2 2.9 2.8 -1.4Algeria . . . . . . . . . . . . . . . . . . . . . . . . . . 1.3 2.1 2.2 2.2 2.2 2.0 1.9 1.8 -0.6Libya . . . . . . . . . . . . . . . . . . . . . . . . . . . 1.4 1.8 1.8 1.9 1.4 1.1 1.0 1.0 -2.4
West Africa . . . . . . . . . . . . . . . . . . . . . . 2.3 3.9 4.1 4.8 4.5 4.0 3.9 3.8 -0.1Angola . . . . . . . . . . . . . . . . . . . . . . . . . . 0.5 1.4 1.8 2.3 2.0 1.7 1.6 1.6 0.5Nigeria. . . . . . . . . . . . . . . . . . . . . . . . . . 1.8 2.4 2.4 2.4 2.5 2.4 2.3 2.2 -0.5
South America. . . . . . . . . . . . . . . . . . . . 2.5 3.3 3.2 2.8 2.2 2.3 2.4 2.5 -1.1Ecuador. . . . . . . . . . . . . . . . . . . . . . . . . 0.3 0.5 0.5 0.5 0.3 0.3 0.3 0.3 -2.8Venezuela . . . . . . . . . . . . . . . . . . . . . . . 2.3 2.7 2.7 2.3 1.9 2.0 2.1 2.2 -0.9
Non-OPEC . . . . . . . . . . . . . . . . . . . . . . . . 42.8 49.9 50.4 50.8 52.6 54.9 58.5 61.8 0.9OECD . . . . . . . . . . . . . . . . . . . . . . . . . . . 20.0 21.7 21.7 21.5 22.0 24.1 26.9 27.8 1.0OECD North America . . . . . . . . . . . . . 14.7 15.3 15.5 16.2 17.4 20.1 23.0 23.8 1.8United States. . . . . . . . . . . . . . . . . . . . 9.7 8.3 8.6 9.7 10.5 12.4 13.9 14.3 2.3Canada . . . . . . . . . . . . . . . . . . . . . . . . 2.0 3.3 3.4 3.7 4.7 6.0 7.3 7.6 3.5Mexico. . . . . . . . . . . . . . . . . . . . . . . . . 3.0 3.7 3.5 2.7 2.1 1.7 1.8 2.0 -2.6
OECD Europe . . . . . . . . . . . . . . . . . . . 4.5 5.6 5.4 4.6 4.0 3.4 3.2 3.2 -2.3OECD Asia . . . . . . . . . . . . . . . . . . . . . . 0.8 0.7 0.8 0.8 0.7 0.7 0.7 0.8 0.3
Japan . . . . . . . . . . . . . . . . . . . . . . . . . 0.1 0.1 0.1 0.1 0.1 0.2 0.2 0.2 1.8South Korea . . . . . . . . . . . . . . . . . . . . 0.0 0.0 0.0 0.0 0.0 0.0 0.0 0.0 4.0Australia and New Zealand . . . . . . . . . 0.7 0.6 0.6 0.6 0.6 0.5 0.5 0.6 -0.2
Non-OECD . . . . . . . . . . . . . . . . . . . . . . . 22.8 28.2 28.7 29.3 30.5 30.8 31.6 34.0 0.8Non-OECD Europe and Eurasia. . . . . 11.6 12.3 12.8 12.7 13.3 13.5 13.5 14.1 0.6
Russia . . . . . . . . . . . . . . . . . . . . . . . . . 10.1 9.7 9.9 9.4 9.3 9.6 9.5 9.8 0.1Caspian Area . . . . . . . . . . . . . . . . . . . 1.1 2.3 2.6 2.9 3.8 3.7 3.8 4.1 2.4Other . . . . . . . . . . . . . . . . . . . . . . . . . . 0.4 0.3 0.3 0.3 0.2 0.2 0.2 0.2 -2.1
Non-OECD Asia . . . . . . . . . . . . . . . . . . 6.0 7.8 7.7 7.9 7.6 7.2 7.5 8.3 0.3China. . . . . . . . . . . . . . . . . . . . . . . . . . 2.8 3.9 3.9 4.1 3.7 3.5 3.6 4.4 0.5India . . . . . . . . . . . . . . . . . . . . . . . . . . 0.7 0.9 0.9 0.9 0.9 1.0 1.2 1.2 1.5Other . . . . . . . . . . . . . . . . . . . . . . . . . . 2.5 3.0 2.9 2.9 3.0 2.7 2.6 2.7 -0.5
Middle East (Non-OPEC) . . . . . . . . . . 1.3 1.6 1.5 1.5 1.5 1.2 1.1 1.0 -1.9Africa . . . . . . . . . . . . . . . . . . . . . . . . . . 1.7 2.5 2.6 2.7 2.7 2.7 2.7 2.9 0.5Central and South America . . . . . . . . 2.2 4.0 4.1 4.5 5.3 6.2 6.9 7.7 2.8Brazil . . . . . . . . . . . . . . . . . . . . . . . . . . 0.9 2.1 2.3 2.7 3.6 4.4 4.9 5.3 3.8Other . . . . . . . . . . . . . . . . . . . . . . . . . . 1.3 1.8 1.8 1.8 1.7 1.8 2.0 2.4 1.1
Total World . . . . . . . . . . . . . . . . . . . . . . . 66.5 84.6 84.8 86.2 83.7 84.0 86.7 90.0 0.3
OPEC Share of World Production. . . . . . . 36% 41% 41% 41% 37% 35% 33% 31%Persian Gulf Share of World Production . . 24% 28% 27% 28% 25% 23% 22% 21%
aOPEC = Organization of the Petroleum Exporting Countries (OPEC-12).Sources: History: Energy Information Administration (EIA), Office of Energy Markets and End Use. Projections: EIA, Generate
World Oil Balance Model (2009).

Table G5. World Conventional Liquids Production by Region and Country, High Oil Price Case, 1990-2030(Million Barrels per Day)
Appendix G
230 Energy Information Administration / International Energy Outlook 2009
Region/Country
History (Estimates) Projections Average AnnualPercent Change,
2006-20301990 2006 2007 2010 2015 2020 2025 2030
OPECa . . . . . . . . . . . . . . . . . . . . . . . . . . . 23.7 34.0 33.7 34.8 30.5 28.3 27.3 27.2 -0.9Middle East . . . . . . . . . . . . . . . . . . . . . . 16.1 23.5 23.0 23.7 20.7 19.4 18.8 18.9 -0.9Iran . . . . . . . . . . . . . . . . . . . . . . . . . . . . 3.1 4.1 4.0 4.2 3.2 2.7 2.6 2.6 -1.9Iraq . . . . . . . . . . . . . . . . . . . . . . . . . . . . 2.1 2.0 2.1 2.5 2.3 2.9 2.9 3.0 1.7Kuwait . . . . . . . . . . . . . . . . . . . . . . . . . . 1.2 2.7 2.6 2.7 2.2 1.9 1.8 1.8 -1.6Qatar . . . . . . . . . . . . . . . . . . . . . . . . . . . 0.4 1.1 1.1 1.4 1.5 1.5 1.6 1.7 1.6Saudi Arabia . . . . . . . . . . . . . . . . . . . . . 7.0 10.6 10.2 10.0 9.1 8.2 7.9 7.9 -1.2United Arab Emirates . . . . . . . . . . . . . . 2.3 2.9 2.9 3.0 2.5 2.2 2.0 1.9 -1.7
North Africa . . . . . . . . . . . . . . . . . . . . . . 2.7 3.9 4.0 4.1 3.6 3.2 2.9 2.8 -1.4Algeria . . . . . . . . . . . . . . . . . . . . . . . . . . 1.3 2.1 2.2 2.2 2.2 2.0 1.9 1.8 -0.6Libya . . . . . . . . . . . . . . . . . . . . . . . . . . . 1.4 1.8 1.8 1.9 1.4 1.1 1.0 1.0 -2.4
West Africa . . . . . . . . . . . . . . . . . . . . . . 2.3 3.9 4.1 4.8 4.5 4.0 3.8 3.7 -0.1Angola . . . . . . . . . . . . . . . . . . . . . . . . . . 0.5 1.4 1.8 2.3 2.0 1.7 1.6 1.6 0.5Nigeria. . . . . . . . . . . . . . . . . . . . . . . . . . 1.8 2.4 2.4 2.4 2.5 2.3 2.2 2.1 -0.6
South America. . . . . . . . . . . . . . . . . . . . 2.5 2.7 2.6 2.2 1.7 1.7 1.8 1.7 -1.9Ecuador. . . . . . . . . . . . . . . . . . . . . . . . . 0.3 0.5 0.5 0.5 0.3 0.3 0.3 0.3 -2.8Venezuela . . . . . . . . . . . . . . . . . . . . . . . 2.3 2.1 2.1 1.8 1.4 1.4 1.5 1.4 -1.7
Non-OPEC . . . . . . . . . . . . . . . . . . . . . . . . 42.0 47.5 47.4 46.3 45.2 44.1 44.2 45.1 -0.2OECD . . . . . . . . . . . . . . . . . . . . . . . . . . . 19.5 19.8 19.4 18.0 16.4 16.0 16.7 16.6 -0.7OECD North America . . . . . . . . . . . . . 14.3 13.6 13.4 13.0 12.2 12.7 13.6 13.6 0.0United States. . . . . . . . . . . . . . . . . . . . 9.6 7.8 7.8 8.5 8.7 10.0 11.1 11.0 1.4Canada . . . . . . . . . . . . . . . . . . . . . . . . 1.7 2.1 2.1 1.8 1.5 1.1 1.0 0.9 -3.4Mexico. . . . . . . . . . . . . . . . . . . . . . . . . 3.0 3.7 3.5 2.7 2.0 1.6 1.6 1.7 -3.2
OECD Europe . . . . . . . . . . . . . . . . . . . 4.5 5.5 5.2 4.2 3.5 2.8 2.5 2.4 -3.4Denmark . . . . . . . . . . . . . . . . . . . . . . . 0.1 0.3 0.3 0.3 0.2 0.1 0.1 0.1 -6.5Norway . . . . . . . . . . . . . . . . . . . . . . . . 1.7 2.8 2.6 2.2 1.8 1.4 1.3 1.2 -3.5United Kngdom . . . . . . . . . . . . . . . . . . 2.0 1.7 1.7 1.2 0.9 0.7 0.6 0.6 -4.1Other . . . . . . . . . . . . . . . . . . . . . . . . . . 0.7 0.7 0.7 0.6 0.6 0.5 0.5 0.5 -0.9
OECD Asia . . . . . . . . . . . . . . . . . . . . . . 0.8 0.7 0.8 0.8 0.7 0.6 0.6 0.6 -0.7Japan . . . . . . . . . . . . . . . . . . . . . . . . . 0.1 0.1 0.1 0.1 0.1 0.1 0.1 0.1 0.2South Korea . . . . . . . . . . . . . . . . . . . . 0.0 0.0 0.0 0.0 0.0 0.0 0.0 0.0 2.8Australia and New Zealand . . . . . . . . . 0.7 0.6 0.6 0.6 0.5 0.5 0.5 0.5 -1.0
aOPEC = Organization of the Petroleum Exporting Countries (OPEC-12).

Table G5. World Conventional Liquids Production by Region and Country, High Oil Price Case, 1990-2030(Continued)(Million Barrels per Day)
Liquids Production Projections
Energy Information Administration / International Energy Outlook 2009 231
Region/Country
History (Estimates) Projections Average AnnualPercent Change,
2006-20301990 2006 2007 2010 2015 2020 2025 2030
Non-OECD . . . . . . . . . . . . . . . . . . . . . . . 22.5 27.7 28.0 28.3 28.8 28.0 27.5 28.4 0.1Non-OECD Europe and Eurasia. . . . . 11.6 12.3 12.8 12.6 13.3 13.5 13.5 14.1 0.6
Russia . . . . . . . . . . . . . . . . . . . . . . . . 10.1 9.7 9.9 9.4 9.3 9.6 9.5 9.8 0.1Caspian Area . . . . . . . . . . . . . . . . . . . 1.1 2.3 2.6 2.9 3.8 3.7 3.8 4.1 2.4
Azerbaijan . . . . . . . . . . . . . . . . . . . . . 0.3 0.6 0.8 1.1 1.0 0.9 0.9 0.9 1.4Kazakhstan . . . . . . . . . . . . . . . . . . . . 0.6 1.4 1.4 1.6 2.5 2.5 2.6 2.9 3.1Turkmenistan . . . . . . . . . . . . . . . . . . 0.1 0.2 0.2 0.2 0.2 0.3 0.3 0.3 2.0Uzbekistan . . . . . . . . . . . . . . . . . . . . 0.1 0.1 0.1 0.1 0.1 0.1 0.1 0.1 -1.7
Other. . . . . . . . . . . . . . . . . . . . . . . . . . 0.4 0.3 0.3 0.3 0.2 0.2 0.2 0.2 -2.2Non-OECD Asia . . . . . . . . . . . . . . . . . . 6.0 7.7 7.7 7.7 7.2 6.4 5.8 5.5 -1.4China. . . . . . . . . . . . . . . . . . . . . . . . . . 2.8 3.9 3.9 4.0 3.4 3.0 2.6 2.5 -1.8India . . . . . . . . . . . . . . . . . . . . . . . . . . 0.7 0.9 0.9 0.9 0.9 0.9 0.9 0.8 -0.2Brunei . . . . . . . . . . . . . . . . . . . . . . . . . 0.2 0.2 0.2 0.1 0.1 0.1 0.1 0.1 -3.3Malaysia . . . . . . . . . . . . . . . . . . . . . . . 0.6 0.7 0.7 0.7 0.7 0.6 0.6 0.6 -0.9Thailand . . . . . . . . . . . . . . . . . . . . . . . 0.1 0.3 0.3 0.4 0.4 0.3 0.3 0.3 0.2Vietnam . . . . . . . . . . . . . . . . . . . . . . . . 0.1 0.4 0.4 0.4 0.4 0.4 0.3 0.3 -0.4Other . . . . . . . . . . . . . . . . . . . . . . . . . . 1.6 1.4 1.3 1.3 1.3 1.0 0.9 0.9 -2.0
Middle East (Non-OPEC) . . . . . . . . . . 1.3 1.6 1.5 1.5 1.5 1.2 1.1 1.0 -1.9Oman . . . . . . . . . . . . . . . . . . . . . . . . . 0.7 0.7 0.7 0.8 0.9 0.6 0.6 0.6 -0.9Syria . . . . . . . . . . . . . . . . . . . . . . . . . . 0.4 0.4 0.4 0.5 0.4 0.3 0.3 0.3 -2.1Yemen. . . . . . . . . . . . . . . . . . . . . . . . . 0.2 0.4 0.3 0.3 0.2 0.2 0.1 0.1 -4.5Other . . . . . . . . . . . . . . . . . . . . . . . . . . 0.0 0.1 0.1 0.1 0.0 0.0 0.0 0.0 -1.2
Africa . . . . . . . . . . . . . . . . . . . . . . . . . . 1.6 2.4 2.4 2.5 2.4 2.2 2.1 2.2 -0.4Chad . . . . . . . . . . . . . . . . . . . . . . . . . . 0.0 0.2 0.1 0.1 0.1 0.1 0.1 0.0 -4.8Congo (Brazzaville) . . . . . . . . . . . . . . . 0.2 0.2 0.2 0.3 0.3 0.3 0.3 0.3 1.2Egypt . . . . . . . . . . . . . . . . . . . . . . . . . . 0.9 0.7 0.7 0.5 0.5 0.6 0.5 0.5 -0.9Equatorial Guniea . . . . . . . . . . . . . . . . 0.0 0.4 0.4 0.3 0.3 0.3 0.3 0.3 -1.2Gabon . . . . . . . . . . . . . . . . . . . . . . . . . 0.3 0.2 0.2 0.2 0.2 0.1 0.1 0.1 -2.8Sao Tome and Principe. . . . . . . . . . . . 0.0 0.0 0.0 0.0 0.0 0.0 0.0 0.0 —Sudan . . . . . . . . . . . . . . . . . . . . . . . . . 0.0 0.4 0.5 0.6 0.5 0.5 0.5 0.5 1.4Other . . . . . . . . . . . . . . . . . . . . . . . . . . 0.3 0.3 0.3 0.4 0.4 0.3 0.3 0.3 -0.4
Central and South America . . . . . . . . 2.0 3.7 3.7 4.0 4.4 4.8 5.0 5.6 1.7Brazil . . . . . . . . . . . . . . . . . . . . . . . . . . 0.7 1.9 1.9 2.2 2.9 3.4 3.6 3.9 3.2Argentina. . . . . . . . . . . . . . . . . . . . . . . 0.5 0.8 0.8 0.7 0.5 0.4 0.3 0.3 -4.0Colombia . . . . . . . . . . . . . . . . . . . . . . . 0.5 0.5 0.5 0.5 0.4 0.3 0.3 0.3 -2.7Peru. . . . . . . . . . . . . . . . . . . . . . . . . . . 0.1 0.1 0.1 0.1 0.2 0.2 0.2 0.3 3.6Trinidad and Tobago . . . . . . . . . . . . . . 0.1 0.2 0.2 0.2 0.2 0.1 0.1 0.1 -1.7Other . . . . . . . . . . . . . . . . . . . . . . . . . . 0.1 0.2 0.2 0.2 0.2 0.3 0.4 0.7 5.5
Total World . . . . . . . . . . . . . . . . . . . . . . . 65.7 81.5 81.1 81.2 75.8 72.4 71.6 72.2 -0.5
OPEC Share of World Production. . . . . . . 36% 42% 42% 43% 40% 39% 38% 38%Persian Gulf Share of World Production . . 25% 29% 28% 29% 27% 27% 26% 26%
Note: Conventional liquids include crude oil and lease condensate, natural gas plant liquids, and refinery gain.Sources: History: Energy Information Administration (EIA), Office of Energy Markets and End Use. Projections: EIA, Generate
World Oil Balance Model (2009).

Table G6. World Unconventional Liquids Production by Region and Country, High Oil Price Case, 1990-2030(Million Barrels per Day)
Appendix G
232 Energy Information Administration / International Energy Outlook 2009
Region/Country
History (Estimates) Projections Average AnnualPercent Change,
2006-20301990 2006 2007 2010 2015 2020 2025 2030
OPECa . . . . . . . . . . . . . . . . . . . . . . . . . . . 0.0 0.7 0.7 0.6 0.6 0.7 0.9 1.1 1.9Biofuels . . . . . . . . . . . . . . . . . . . . . . . . . . 0.0 0.0 0.0 0.0 0.0 0.0 0.0 0.0 —Extra-Heavy Oil (Venezuela). . . . . . . . . . 0.0 0.6 0.6 0.6 0.5 0.5 0.6 0.8 1.0Coal-to-Liquids . . . . . . . . . . . . . . . . . . . . 0.0 0.0 0.0 0.0 0.0 0.0 0.0 0.0 —Gas-to-Liquids (primarily Qatar) . . . . . . . 0.0 0.0 0.0 0.0 0.1 0.2 0.2 0.3 18.1
Non-OPEC . . . . . . . . . . . . . . . . . . . . . . . . 0.7 2.4 3.0 4.5 7.3 10.9 14.3 16.7 8.5OECD . . . . . . . . . . . . . . . . . . . . . . . . . . . 0.5 1.9 2.3 3.5 5.6 8.1 10.2 11.1 7.7Biofuels . . . . . . . . . . . . . . . . . . . . . . . . . 0.0 0.5 0.6 1.3 1.9 2.7 3.1 3.3 8.6Oil Sands/Bitumen (Canada) . . . . . . . . 0.4 1.2 1.4 1.9 3.2 4.7 6.1 6.5 7.2Extra-Heavy Oil (Mexico) . . . . . . . . . . . 0.0 0.0 0.0 0.0 0.0 0.1 0.1 0.1 15.4Coal-to-Liquids . . . . . . . . . . . . . . . . . . . 0.0 0.0 0.0 0.0 0.1 0.1 0.2 0.3 26.6Gas-to-Liquids. . . . . . . . . . . . . . . . . . . . 0.0 0.0 0.0 0.0 0.0 0.1 0.2 0.4 —Shale Oil . . . . . . . . . . . . . . . . . . . . . . . . 0.0 0.0 0.0 0.0 0.0 0.0 0.1 0.1 —
Non-OECD . . . . . . . . . . . . . . . . . . . . . . . 0.3 0.5 0.7 1.0 1.7 2.8 4.1 5.5 10.4Biofuels . . . . . . . . . . . . . . . . . . . . . . . . . 0.2 0.3 0.4 0.7 1.4 2.2 3.1 3.8 10.5Extra-Heavy Oil . . . . . . . . . . . . . . . . . . . 0.0 0.0 0.0 0.0 0.0 0.0 0.0 0.0 —Coal-to-Liquids . . . . . . . . . . . . . . . . . . . 0.1 0.1 0.2 0.2 0.2 0.5 0.9 1.7 10.7Gas-to-Liquids. . . . . . . . . . . . . . . . . . . . 0.0 0.0 0.0 0.0 0.1 0.1 0.1 0.1 —Shale Oil . . . . . . . . . . . . . . . . . . . . . . . . 0.0 0.0 0.0 0.0 0.0 0.0 0.0 0.0 1.1
WorldBiofuels . . . . . . . . . . . . . . . . . . . . . . . . . . 0.2 0.8 1.1 2.0 3.4 5.0 6.2 7.2 9.5Oil Sands/Bitumen . . . . . . . . . . . . . . . . . 0.4 1.2 1.4 1.9 3.2 4.7 6.1 6.5 7.2Extra-Heavy Oil . . . . . . . . . . . . . . . . . . . . 0.0 0.6 0.6 0.6 0.5 0.6 0.7 0.8 1.4Coal-to-Liquids . . . . . . . . . . . . . . . . . . . . 0.1 0.1 0.2 0.2 0.3 0.6 1.1 2.0 11.4Gas-to-Liquids. . . . . . . . . . . . . . . . . . . . . 0.0 0.0 0.1 0.1 0.2 0.4 0.5 0.7 23.1Shale Oil . . . . . . . . . . . . . . . . . . . . . . . . . 0.0 0.0 0.0 0.0 0.0 0.0 0.1 0.2 14.0
World Total . . . . . . . . . . . . . . . . . . . . . . . 0.8 3.1 3.7 5.0 7.9 11.6 15.2 17.8 7.6
Selected Country HighlightsBiofuelsBrazil . . . . . . . . . . . . . . . . . . . . . . . . . . . 0.2 0.3 0.3 0.4 0.7 1.0 1.2 1.3 6.7China. . . . . . . . . . . . . . . . . . . . . . . . . . . 0.0 0.0 0.0 0.1 0.2 0.3 0.5 0.6 14.2India . . . . . . . . . . . . . . . . . . . . . . . . . . . 0.0 0.0 0.0 0.0 0.0 0.1 0.2 0.3 19.9United States. . . . . . . . . . . . . . . . . . . . . 0.0 0.3 0.5 0.9 1.4 1.8 1.9 2.0 7.7
Coal-to-LiquidsAustralia and New Zealand . . . . . . . . . . 0.0 0.0 0.0 0.0 0.0 0.0 0.0 0.0 —China. . . . . . . . . . . . . . . . . . . . . . . . . . . 0.0 0.0 0.0 0.0 0.0 0.1 0.5 1.2 —Germany . . . . . . . . . . . . . . . . . . . . . . . . 0.0 0.0 0.0 0.0 0.0 0.0 0.0 0.0 0.9India . . . . . . . . . . . . . . . . . . . . . . . . . . . 0.0 0.0 0.0 0.0 0.0 0.0 0.1 0.1 —South Africa. . . . . . . . . . . . . . . . . . . . . . 0.1 0.1 0.2 0.2 0.2 0.3 0.3 0.3 3.2United States. . . . . . . . . . . . . . . . . . . . . 0.0 0.0 0.0 0.0 0.1 0.1 0.2 0.3 —
Gas-to-LiquidsQatar . . . . . . . . . . . . . . . . . . . . . . . . . . . 0.0 0.0 0.0 0.0 0.1 0.2 0.2 0.2 16.9South Africa. . . . . . . . . . . . . . . . . . . . . . 0.0 0.0 0.0 0.0 0.1 0.1 0.1 0.1 —
aOPEC = Organization of the Petroleum Exporting Countries (OPEC-12).Sources: History: Energy Information Administration (EIA), Office of Energy Markets and End Use. Projections: EIA, Generate
World Oil Balance Model (2009).

Table G7. World Total Liquids Production by Region and Country, Low Oil Price Case, 1990-2030(Million Barrels per Day)
Liquids Production Projections
Energy Information Administration / International Energy Outlook 2009 233
Region/Country
History (Estimates) Projections Average AnnualPercent Change,
2006-20301990 2006 2007 2010 2015 2020 2025 2030
OPECa . . . . . . . . . . . . . . . . . . . . . . . . . . . 23.7 34.7 34.4 36.2 44.9 49.1 53.2 57.4 2.1Middle East . . . . . . . . . . . . . . . . . . . . . . 16.1 23.6 23.1 24.1 29.3 32.2 34.8 37.6 2.0Iran . . . . . . . . . . . . . . . . . . . . . . . . . . . . 3.1 4.1 4.0 4.3 4.7 4.8 5.1 5.6 1.2Iraq . . . . . . . . . . . . . . . . . . . . . . . . . . . . 2.1 2.0 2.1 2.5 3.4 5.3 6.0 6.7 5.1Kuwait . . . . . . . . . . . . . . . . . . . . . . . . . . 1.2 2.7 2.6 2.8 3.2 3.2 3.4 3.8 1.4Qatar . . . . . . . . . . . . . . . . . . . . . . . . . . . 0.4 1.1 1.1 1.4 2.1 2.4 2.6 2.9 3.9Saudi Arabia . . . . . . . . . . . . . . . . . . . . . 7.0 10.7 10.2 10.1 12.4 13.1 14.0 15.2 1.5United Arab Emirates . . . . . . . . . . . . . . 2.3 2.9 2.9 3.0 3.5 3.5 3.6 3.5 0.8
North Africa . . . . . . . . . . . . . . . . . . . . . . 2.7 3.9 4.0 4.1 5.0 5.2 5.3 5.5 1.4Algeria . . . . . . . . . . . . . . . . . . . . . . . . . . 1.3 2.1 2.2 2.2 3.0 3.3 3.5 3.5 2.1Libya . . . . . . . . . . . . . . . . . . . . . . . . . . . 1.4 1.8 1.8 1.9 2.0 1.9 1.9 2.0 0.3
West Africa . . . . . . . . . . . . . . . . . . . . . . 2.3 3.9 4.1 4.8 6.6 7.0 7.5 8.0 3.0Angola . . . . . . . . . . . . . . . . . . . . . . . . . . 0.5 1.4 1.8 2.4 3.0 3.0 3.3 3.6 3.9Nigeria. . . . . . . . . . . . . . . . . . . . . . . . . . 1.8 2.4 2.4 2.5 3.6 4.0 4.2 4.3 2.4
South America. . . . . . . . . . . . . . . . . . . . 2.5 3.3 3.2 3.1 4.0 4.7 5.6 6.4 2.8Ecuador. . . . . . . . . . . . . . . . . . . . . . . . . 0.3 0.5 0.5 0.5 0.5 0.5 0.6 0.6 0.5Venezuela . . . . . . . . . . . . . . . . . . . . . . . 2.3 2.7 2.7 2.7 3.5 4.2 5.0 5.8 3.1
Non-OPEC . . . . . . . . . . . . . . . . . . . . . . . . 42.8 49.9 50.4 50.6 52.3 55.9 58.8 62.7 1.0OECD . . . . . . . . . . . . . . . . . . . . . . . . . . . 20.0 21.7 21.7 21.4 20.7 20.5 21.2 22.0 0.1OECD North America . . . . . . . . . . . . . 14.7 15.3 15.5 16.1 15.9 16.1 17.1 17.8 0.6United States. . . . . . . . . . . . . . . . . . . . 9.7 8.3 8.6 9.8 10.1 10.0 10.3 10.4 0.9Canada . . . . . . . . . . . . . . . . . . . . . . . . 2.0 3.3 3.4 3.7 3.7 4.1 4.5 4.8 1.6Mexico. . . . . . . . . . . . . . . . . . . . . . . . . 3.0 3.7 3.5 2.7 2.2 2.0 2.2 2.6 -1.4
OECD Europe . . . . . . . . . . . . . . . . . . . 4.5 5.6 5.4 4.5 4.0 3.6 3.4 3.3 -2.2OECD Asia . . . . . . . . . . . . . . . . . . . . . . 0.8 0.7 0.8 0.8 0.8 0.8 0.8 0.9 0.7
Japan . . . . . . . . . . . . . . . . . . . . . . . . . 0.1 0.1 0.1 0.1 0.2 0.2 0.2 0.2 2.5South Korea . . . . . . . . . . . . . . . . . . . . 0.0 0.0 0.0 0.0 0.0 0.0 0.0 0.0 5.0Australia and New Zealand . . . . . . . . . 0.7 0.6 0.6 0.7 0.6 0.6 0.6 0.6 0.0
Non-OECD . . . . . . . . . . . . . . . . . . . . . . . 22.8 28.2 28.7 29.1 31.6 35.5 37.6 40.8 1.5Non-OECD Europe and Eurasia. . . . . 11.6 12.3 12.8 12.7 14.2 16.8 18.3 20.4 2.1
Russia . . . . . . . . . . . . . . . . . . . . . . . . . 10.1 9.7 9.9 9.5 10.0 12.1 13.2 14.6 1.7Caspian Area . . . . . . . . . . . . . . . . . . . 1.1 2.3 2.6 3.0 4.0 4.5 4.8 5.5 3.7Other . . . . . . . . . . . . . . . . . . . . . . . . . . 0.4 0.3 0.3 0.3 0.2 0.2 0.2 0.2 -1.6
Non-OECD Asia . . . . . . . . . . . . . . . . . . 6.0 7.8 7.7 7.9 7.9 7.9 7.5 7.4 -0.2China. . . . . . . . . . . . . . . . . . . . . . . . . . 2.8 3.9 3.9 4.1 3.9 3.8 3.6 3.5 -0.4India . . . . . . . . . . . . . . . . . . . . . . . . . . 0.7 0.9 0.9 0.9 1.0 1.1 1.2 1.1 1.1Other . . . . . . . . . . . . . . . . . . . . . . . . . . 2.5 3.0 2.9 2.9 3.1 3.0 2.8 2.7 -0.4
Middle East (Non-OPEC) . . . . . . . . . . 1.3 1.6 1.5 1.5 1.6 1.4 1.2 1.2 -1.4Africa . . . . . . . . . . . . . . . . . . . . . . . . . . 1.7 2.5 2.6 2.6 2.7 2.8 2.8 2.8 0.3Central and South America . . . . . . . . 2.2 4.0 4.1 4.4 5.2 6.7 7.8 9.1 3.5Brazil . . . . . . . . . . . . . . . . . . . . . . . . . . 0.9 2.1 2.3 2.5 3.5 4.9 5.8 6.8 4.9Other . . . . . . . . . . . . . . . . . . . . . . . . . . 1.3 1.8 1.8 1.8 1.7 1.8 2.0 2.3 1.0
Total World . . . . . . . . . . . . . . . . . . . . . . . 66.5 84.6 84.8 86.8 97.2 105.0 112.0 120.2 1.5
OPEC Share of World Production. . . . . . . 36% 41% 41% 42% 46% 47% 47% 48%Persian Gulf Share of World Production . . 24% 28% 27% 28% 30% 31% 31% 31%
aOPEC = Organization of the Petroleum Exporting Countries (OPEC-12).Sources: History: Energy Information Administration (EIA), Office of Energy Markets and End Use. Projections: EIA, Generate
World Oil Balance Model (2009).

Table G8. World Conventional Liquids Production by Region and Country, Low Oil Price Case, 1990-2030(Million Barrels per Day)
Appendix G
234 Energy Information Administration / International Energy Outlook 2009
Region/Country
History (Estimates) Projections Average AnnualPercent Change,
2006-20301990 2006 2007 2010 2015 2020 2025 2030
OPECa . . . . . . . . . . . . . . . . . . . . . . . . . . . 23.7 34.0 33.7 35.3 43.2 47.0 50.6 54.2 2.0Middle East . . . . . . . . . . . . . . . . . . . . . . 16.1 23.5 23.0 24.1 29.2 32.0 34.6 37.5 2.0Iran . . . . . . . . . . . . . . . . . . . . . . . . . . . . 3.1 4.1 4.0 4.3 4.7 4.8 5.1 5.6 1.2Iraq . . . . . . . . . . . . . . . . . . . . . . . . . . . . 2.1 2.0 2.1 2.5 3.4 5.3 6.0 6.7 5.1Kuwait . . . . . . . . . . . . . . . . . . . . . . . . . . 1.2 2.7 2.6 2.8 3.2 3.2 3.4 3.8 1.4Qatar . . . . . . . . . . . . . . . . . . . . . . . . . . . 0.4 1.1 1.1 1.4 2.0 2.2 2.4 2.7 3.7Saudi Arabia . . . . . . . . . . . . . . . . . . . . . 7.0 10.6 10.2 10.1 12.4 13.1 14.0 15.2 1.5United Arab Emirates . . . . . . . . . . . . . . 2.3 2.9 2.9 3.0 3.5 3.5 3.6 3.5 0.8
North Africa . . . . . . . . . . . . . . . . . . . . . . 2.7 3.9 4.0 4.1 5.0 5.2 5.3 5.5 1.4Algeria . . . . . . . . . . . . . . . . . . . . . . . . . . 1.3 2.1 2.2 2.2 3.0 3.3 3.5 3.5 2.1Libya . . . . . . . . . . . . . . . . . . . . . . . . . . . 1.4 1.8 1.8 1.9 2.0 1.9 1.9 2.0 0.3
West Africa . . . . . . . . . . . . . . . . . . . . . . 2.3 3.9 4.1 4.8 6.6 7.0 7.5 7.9 3.0Angola . . . . . . . . . . . . . . . . . . . . . . . . . . 0.5 1.4 1.8 2.4 3.0 3.0 3.3 3.6 3.9Nigeria. . . . . . . . . . . . . . . . . . . . . . . . . . 1.8 2.4 2.4 2.5 3.6 3.9 4.2 4.3 2.4
South America. . . . . . . . . . . . . . . . . . . . 2.5 2.7 2.6 2.3 2.4 2.8 3.2 3.3 0.9Ecuador. . . . . . . . . . . . . . . . . . . . . . . . . 0.3 0.5 0.5 0.5 0.5 0.5 0.6 0.6 0.5Venezuela . . . . . . . . . . . . . . . . . . . . . . . 2.3 2.1 2.1 1.8 1.9 2.3 2.6 2.7 1.0
Non-OPEC . . . . . . . . . . . . . . . . . . . . . . . . 42.0 47.5 47.4 46.6 47.4 49.5 50.7 53.6 0.5OECD . . . . . . . . . . . . . . . . . . . . . . . . . . . 19.5 19.8 19.4 18.1 16.7 15.4 15.1 15.3 -1.1OECD North America . . . . . . . . . . . . . 14.3 13.6 13.4 13.1 12.2 11.4 11.4 11.7 -0.6United States. . . . . . . . . . . . . . . . . . . . 9.6 7.8 7.8 8.6 8.5 8.3 8.2 8.2 0.2Canada . . . . . . . . . . . . . . . . . . . . . . . . 1.7 2.1 2.1 1.8 1.5 1.2 1.1 1.0 -3.0Mexico. . . . . . . . . . . . . . . . . . . . . . . . . 3.0 3.7 3.5 2.7 2.2 1.9 2.1 2.5 -1.6
OECD Europe . . . . . . . . . . . . . . . . . . . 4.5 5.5 5.2 4.3 3.7 3.2 3.0 2.8 -2.7Denmark . . . . . . . . . . . . . . . . . . . . . . . 0.1 0.3 0.3 0.3 0.2 0.1 0.1 0.1 -5.9Norway . . . . . . . . . . . . . . . . . . . . . . . . 1.7 2.8 2.6 2.2 1.9 1.6 1.4 1.3 -3.1United Kngdom . . . . . . . . . . . . . . . . . . 2.0 1.7 1.7 1.2 1.0 0.8 0.7 0.7 -3.6Other . . . . . . . . . . . . . . . . . . . . . . . . . . 0.7 0.7 0.7 0.6 0.7 0.7 0.7 0.7 0.5
OECD Asia . . . . . . . . . . . . . . . . . . . . . . 0.8 0.7 0.8 0.8 0.8 0.8 0.7 0.8 0.2Japan . . . . . . . . . . . . . . . . . . . . . . . . . 0.1 0.1 0.1 0.1 0.2 0.2 0.2 0.2 1.8South Korea . . . . . . . . . . . . . . . . . . . . 0.0 0.0 0.0 0.0 0.0 0.0 0.0 0.0 4.8Australia and New Zealand . . . . . . . . . 0.7 0.6 0.6 0.7 0.6 0.6 0.5 0.5 -0.4
aOPEC = Organization of the Petroleum Exporting Countries (OPEC-12).

Table G8. World Conventional Liquids Production by Region and Country, Low Oil Price Case, 1990-2030(Continued)(Million Barrels per Day)
Liquids Production Projections
Energy Information Administration / International Energy Outlook 2009 235
Region/Country
History (Estimates) Projections Average AnnualPercent Change,
2006-20301990 2006 2007 2010 2015 2020 2025 2030
Non-OECD . . . . . . . . . . . . . . . . . . . . . . . 22.5 27.7 28.0 28.5 30.7 34.1 35.6 38.3 1.4Non-OECD Europe and Eurasia. . . . . 11.6 12.3 12.8 12.7 14.2 16.8 18.3 20.4 2.1
Russia . . . . . . . . . . . . . . . . . . . . . . . . 10.1 9.7 9.9 9.5 10.0 12.1 13.2 14.6 1.7Caspian Area . . . . . . . . . . . . . . . . . . . 1.1 2.3 2.6 3.0 4.0 4.5 4.8 5.5 3.7
Azerbaijan . . . . . . . . . . . . . . . . . . . . . 0.3 0.6 0.8 1.1 1.1 1.1 1.2 1.3 2.8Kazakhstan . . . . . . . . . . . . . . . . . . . . 0.6 1.4 1.4 1.6 2.6 3.0 3.3 3.9 4.4Turkmenistan . . . . . . . . . . . . . . . . . . 0.1 0.2 0.2 0.2 0.3 0.3 0.3 0.3 2.3Uzbekistan . . . . . . . . . . . . . . . . . . . . 0.1 0.1 0.1 0.1 0.1 0.1 0.1 0.1 -1.5
Other. . . . . . . . . . . . . . . . . . . . . . . . . . 0.4 0.3 0.3 0.3 0.2 0.2 0.2 0.2 -1.5Non-OECD Asia . . . . . . . . . . . . . . . . . . 6.0 7.7 7.7 7.7 7.7 7.5 6.9 6.4 -0.8China. . . . . . . . . . . . . . . . . . . . . . . . . . 2.8 3.9 3.9 4.0 3.7 3.6 3.2 3.0 -1.0India . . . . . . . . . . . . . . . . . . . . . . . . . . 0.7 0.9 0.9 0.9 0.9 1.0 1.0 0.9 0.3Brunei . . . . . . . . . . . . . . . . . . . . . . . . . 0.2 0.2 0.2 0.1 0.2 0.1 0.1 0.1 -2.8Malaysia . . . . . . . . . . . . . . . . . . . . . . . 0.6 0.7 0.7 0.7 0.7 0.7 0.7 0.6 -0.4Thailand . . . . . . . . . . . . . . . . . . . . . . . 0.1 0.3 0.3 0.4 0.4 0.4 0.4 0.4 0.5Vietnam . . . . . . . . . . . . . . . . . . . . . . . . 0.1 0.4 0.4 0.4 0.5 0.4 0.4 0.4 0.0Other . . . . . . . . . . . . . . . . . . . . . . . . . . 1.6 1.4 1.3 1.3 1.3 1.2 1.1 1.0 -1.5
Middle East (Non-OPEC) . . . . . . . . . . 1.3 1.6 1.5 1.5 1.6 1.4 1.2 1.2 -1.4Oman . . . . . . . . . . . . . . . . . . . . . . . . . 0.7 0.7 0.7 0.8 0.9 0.7 0.7 0.7 -0.4Syria . . . . . . . . . . . . . . . . . . . . . . . . . . 0.4 0.4 0.4 0.5 0.4 0.4 0.3 0.3 -1.7Yemen. . . . . . . . . . . . . . . . . . . . . . . . . 0.2 0.4 0.3 0.3 0.3 0.2 0.2 0.1 -4.0Other . . . . . . . . . . . . . . . . . . . . . . . . . . 0.0 0.1 0.1 0.1 0.1 0.0 0.0 0.0 -0.5
Africa . . . . . . . . . . . . . . . . . . . . . . . . . . 1.6 2.4 2.4 2.5 2.5 2.6 2.5 2.5 0.2Chad . . . . . . . . . . . . . . . . . . . . . . . . . . 0.0 0.2 0.1 0.1 0.1 0.1 0.1 0.1 -4.2Congo (Brazzaville) . . . . . . . . . . . . . . . 0.2 0.2 0.2 0.3 0.3 0.3 0.3 0.4 1.7Egypt . . . . . . . . . . . . . . . . . . . . . . . . . . 0.9 0.7 0.7 0.5 0.6 0.7 0.6 0.6 -0.4Equatorial Guniea . . . . . . . . . . . . . . . . 0.0 0.4 0.4 0.4 0.4 0.4 0.3 0.3 -0.7Gabon . . . . . . . . . . . . . . . . . . . . . . . . . 0.3 0.2 0.2 0.2 0.2 0.2 0.1 0.1 -2.2Sao Tome and Principe. . . . . . . . . . . . 0.0 0.0 0.0 0.0 0.0 0.0 0.0 0.1 —Sudan . . . . . . . . . . . . . . . . . . . . . . . . . 0.0 0.4 0.5 0.6 0.5 0.6 0.6 0.6 2.0Other . . . . . . . . . . . . . . . . . . . . . . . . . . 0.3 0.3 0.3 0.4 0.5 0.4 0.4 0.4 0.3
Central and South America . . . . . . . . 2.0 3.7 3.7 4.0 4.7 5.9 6.7 7.8 3.2Brazil . . . . . . . . . . . . . . . . . . . . . . . . . . 0.7 1.9 1.9 2.2 3.2 4.4 5.1 6.0 5.0Argentina. . . . . . . . . . . . . . . . . . . . . . . 0.5 0.8 0.8 0.8 0.5 0.4 0.4 0.3 -3.5Colombia . . . . . . . . . . . . . . . . . . . . . . . 0.5 0.5 0.5 0.5 0.4 0.4 0.4 0.3 -2.0Peru. . . . . . . . . . . . . . . . . . . . . . . . . . . 0.1 0.1 0.1 0.1 0.2 0.2 0.3 0.3 4.1Trinidad and Tobago . . . . . . . . . . . . . . 0.1 0.2 0.2 0.2 0.2 0.1 0.1 0.1 -1.5Other . . . . . . . . . . . . . . . . . . . . . . . . . . 0.1 0.2 0.2 0.2 0.2 0.3 0.5 0.8 6.2
Total World . . . . . . . . . . . . . . . . . . . . . . . 65.7 81.5 81.1 81.9 90.7 96.5 101.4 107.8 1.2
OPEC Share of World Production. . . . . . . 36% 42% 42% 43% 48% 49% 50% 50%Persian Gulf Share of World Production . . 25% 29% 28% 29% 32% 33% 34% 35%
Note: Conventional liquids include crude oil and lease condensate, natural gas plant liquids, and refinery gain.Sources: History: Energy Information Administration (EIA), Office of Energy Markets and End Use. Projections: EIA, Generate
World Oil Balance Model (2009).

Table G9. World Unconventional Liquids Production by Region and Country, Low Oil Price Case, 1990-2030(Million Barrels per Day)
Appendix G
236 Energy Information Administration / International Energy Outlook 2009
Region/Country
History (Estimates) Projections Average AnnualPercent Change,
2006-20301990 2006 2007 2010 2015 2020 2025 2030
OPECa . . . . . . . . . . . . . . . . . . . . . . . . . . . 0.0 0.7 0.7 0.9 1.6 2.1 2.6 3.3 6.7Biofuels . . . . . . . . . . . . . . . . . . . . . . . . . . 0.0 0.0 0.0 0.0 0.0 0.0 0.0 0.0 —Extra-Heavy Oil (Venezuela). . . . . . . . . . 0.0 0.6 0.6 0.9 1.5 1.9 2.3 3.0 7.0Coal-to-Liquids . . . . . . . . . . . . . . . . . . . . 0.0 0.0 0.0 0.0 0.0 0.0 0.0 0.0 —Gas-to-Liquids (primarily Qatar) . . . . . . . 0.0 0.0 0.0 0.0 0.1 0.2 0.2 0.2 16.9
Non-OPEC . . . . . . . . . . . . . . . . . . . . . . . . 0.7 2.4 3.0 4.0 4.9 6.4 8.1 9.1 5.8OECD . . . . . . . . . . . . . . . . . . . . . . . . . . . 0.5 1.9 2.3 3.3 4.0 5.0 6.1 6.7 5.4Biofuels . . . . . . . . . . . . . . . . . . . . . . . . . 0.0 0.5 0.6 1.2 1.4 1.8 2.3 2.5 7.3Oil Sands/Bitumen (Canada) . . . . . . . . 0.4 1.2 1.4 1.8 2.1 2.8 3.3 3.7 4.6Extra-Heavy Oil (Mexico) . . . . . . . . . . . 0.0 0.0 0.0 0.0 0.0 0.0 0.0 0.0 4.9Coal-to-Liquids . . . . . . . . . . . . . . . . . . . 0.0 0.0 0.0 0.0 0.0 0.0 0.0 0.0 17.0Gas-to-Liquids. . . . . . . . . . . . . . . . . . . . 0.0 0.0 0.0 0.0 0.0 0.0 0.0 0.0 —Shale Oil . . . . . . . . . . . . . . . . . . . . . . . . 0.0 0.0 0.0 0.0 0.0 0.0 0.0 0.0 —
Non-OECD . . . . . . . . . . . . . . . . . . . . . . . 0.3 0.5 0.7 0.7 0.9 1.4 2.0 2.5 6.8Biofuels . . . . . . . . . . . . . . . . . . . . . . . . . 0.2 0.3 0.4 0.5 0.7 1.2 1.8 2.2 8.1Extra-Heavy Oil . . . . . . . . . . . . . . . . . . . 0.0 0.0 0.0 0.0 0.0 0.0 0.0 0.0 —Coal-to-Liquids . . . . . . . . . . . . . . . . . . . 0.1 0.1 0.2 0.1 0.1 0.1 0.2 0.2 1.6Gas-to-Liquids. . . . . . . . . . . . . . . . . . . . 0.0 0.0 0.0 0.0 0.0 0.0 0.0 0.0 —Shale Oil . . . . . . . . . . . . . . . . . . . . . . . . 0.0 0.0 0.0 0.0 0.0 0.0 0.0 0.0 -5.4
WorldBiofuels . . . . . . . . . . . . . . . . . . . . . . . . . . 0.2 0.8 1.1 1.7 2.2 3.1 4.1 4.8 7.7Oil Sands/Bitumen . . . . . . . . . . . . . . . . . 0.4 1.2 1.4 1.8 2.1 2.8 3.3 3.7 4.6Extra-Heavy Oil . . . . . . . . . . . . . . . . . . . . 0.0 0.6 0.6 0.9 1.5 1.9 2.4 3.1 7.0Coal-to-Liquids . . . . . . . . . . . . . . . . . . . . 0.1 0.1 0.2 0.1 0.1 0.2 0.2 0.3 2.4Gas-to-Liquids. . . . . . . . . . . . . . . . . . . . . 0.0 0.0 0.1 0.0 0.1 0.2 0.2 0.2 17.2Shale Oil . . . . . . . . . . . . . . . . . . . . . . . . . 0.0 0.0 0.0 0.0 0.0 0.0 0.0 0.0 -5.4
World Total . . . . . . . . . . . . . . . . . . . . . . . 0.8 3.1 3.7 4.9 6.5 8.5 10.7 12.4 6.0
Selected Country HighlightsBiofuelsBrazil . . . . . . . . . . . . . . . . . . . . . . . . . . . 0.2 0.3 0.3 0.3 0.4 0.5 0.7 0.8 4.4China. . . . . . . . . . . . . . . . . . . . . . . . . . . 0.0 0.0 0.0 0.1 0.1 0.2 0.3 0.4 11.7India . . . . . . . . . . . . . . . . . . . . . . . . . . . 0.0 0.0 0.0 0.0 0.0 0.1 0.1 0.2 17.3United States. . . . . . . . . . . . . . . . . . . . . 0.0 0.3 0.5 0.9 1.1 1.3 1.7 1.7 7.0
Coal-to-LiquidsAustralia and New Zealand . . . . . . . . . . 0.0 0.0 0.0 0.0 0.0 0.0 0.0 0.0 —China. . . . . . . . . . . . . . . . . . . . . . . . . . . 0.0 0.0 0.0 0.0 0.0 0.0 0.1 0.1 —Germany . . . . . . . . . . . . . . . . . . . . . . . . 0.0 0.0 0.0 0.0 0.0 0.0 0.0 0.0 -5.5India . . . . . . . . . . . . . . . . . . . . . . . . . . . 0.0 0.0 0.0 0.0 0.0 0.0 0.0 0.0 —South Africa. . . . . . . . . . . . . . . . . . . . . . 0.1 0.1 0.2 0.1 0.1 0.1 0.1 0.1 -3.4United States. . . . . . . . . . . . . . . . . . . . . 0.0 0.0 0.0 0.0 0.0 0.0 0.0 0.0 —
Gas-to-LiquidsQatar . . . . . . . . . . . . . . . . . . . . . . . . . . . 0.0 0.0 0.0 0.0 0.1 0.2 0.2 0.2 15.7South Africa. . . . . . . . . . . . . . . . . . . . . . 0.0 0.0 0.0 0.0 0.0 0.0 0.0 0.0 —
aOPEC = Organization of the Petroleum Exporting Countries (OPEC-12).Sources: History: Energy Information Administration (EIA), Office of Energy Markets and End Use. Projections: EIA, Generate
World Oil Balance Model (2009).
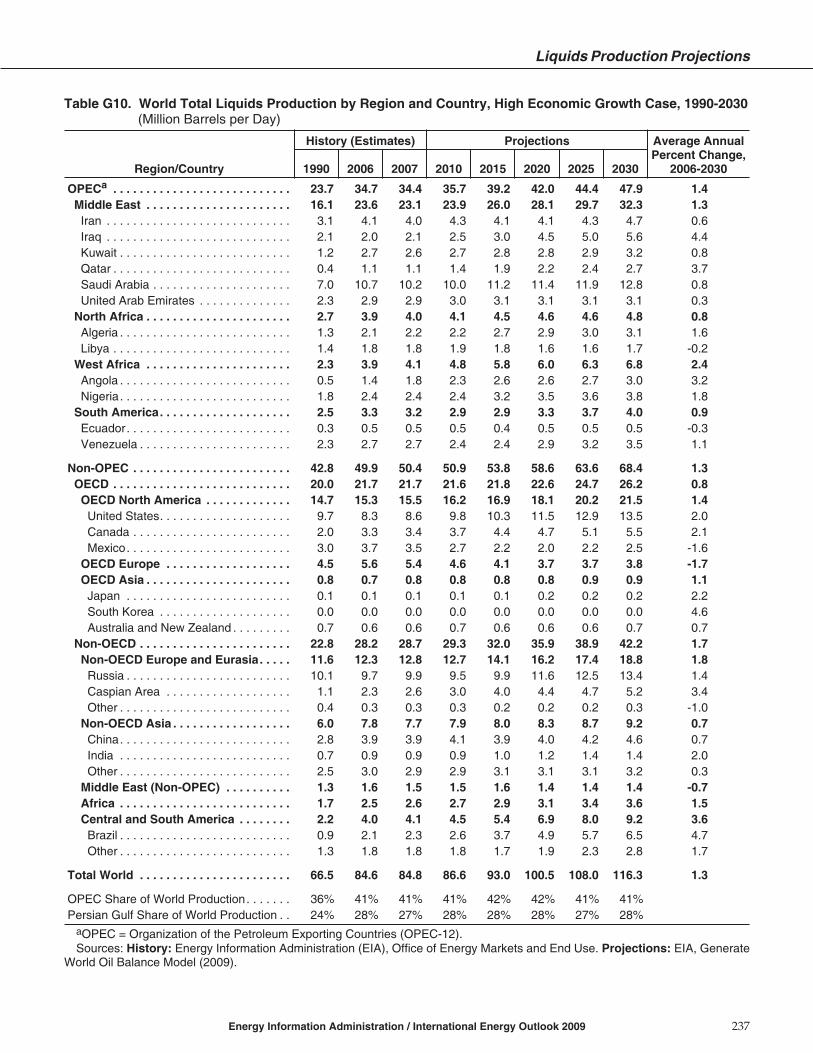
Table G10. World Total Liquids Production by Region and Country, High Economic Growth Case, 1990-2030(Million Barrels per Day)
Liquids Production Projections
Energy Information Administration / International Energy Outlook 2009 237
Region/Country
History (Estimates) Projections Average AnnualPercent Change,
2006-20301990 2006 2007 2010 2015 2020 2025 2030
OPECa . . . . . . . . . . . . . . . . . . . . . . . . . . . 23.7 34.7 34.4 35.7 39.2 42.0 44.4 47.9 1.4Middle East . . . . . . . . . . . . . . . . . . . . . . 16.1 23.6 23.1 23.9 26.0 28.1 29.7 32.3 1.3Iran . . . . . . . . . . . . . . . . . . . . . . . . . . . . 3.1 4.1 4.0 4.3 4.1 4.1 4.3 4.7 0.6Iraq . . . . . . . . . . . . . . . . . . . . . . . . . . . . 2.1 2.0 2.1 2.5 3.0 4.5 5.0 5.6 4.4Kuwait . . . . . . . . . . . . . . . . . . . . . . . . . . 1.2 2.7 2.6 2.7 2.8 2.8 2.9 3.2 0.8Qatar . . . . . . . . . . . . . . . . . . . . . . . . . . . 0.4 1.1 1.1 1.4 1.9 2.2 2.4 2.7 3.7Saudi Arabia . . . . . . . . . . . . . . . . . . . . . 7.0 10.7 10.2 10.0 11.2 11.4 11.9 12.8 0.8United Arab Emirates . . . . . . . . . . . . . . 2.3 2.9 2.9 3.0 3.1 3.1 3.1 3.1 0.3
North Africa . . . . . . . . . . . . . . . . . . . . . . 2.7 3.9 4.0 4.1 4.5 4.6 4.6 4.8 0.8Algeria . . . . . . . . . . . . . . . . . . . . . . . . . . 1.3 2.1 2.2 2.2 2.7 2.9 3.0 3.1 1.6Libya . . . . . . . . . . . . . . . . . . . . . . . . . . . 1.4 1.8 1.8 1.9 1.8 1.6 1.6 1.7 -0.2
West Africa . . . . . . . . . . . . . . . . . . . . . . 2.3 3.9 4.1 4.8 5.8 6.0 6.3 6.8 2.4Angola . . . . . . . . . . . . . . . . . . . . . . . . . . 0.5 1.4 1.8 2.3 2.6 2.6 2.7 3.0 3.2Nigeria. . . . . . . . . . . . . . . . . . . . . . . . . . 1.8 2.4 2.4 2.4 3.2 3.5 3.6 3.8 1.8
South America. . . . . . . . . . . . . . . . . . . . 2.5 3.3 3.2 2.9 2.9 3.3 3.7 4.0 0.9Ecuador. . . . . . . . . . . . . . . . . . . . . . . . . 0.3 0.5 0.5 0.5 0.4 0.5 0.5 0.5 -0.3Venezuela . . . . . . . . . . . . . . . . . . . . . . . 2.3 2.7 2.7 2.4 2.4 2.9 3.2 3.5 1.1
Non-OPEC . . . . . . . . . . . . . . . . . . . . . . . . 42.8 49.9 50.4 50.9 53.8 58.6 63.6 68.4 1.3OECD . . . . . . . . . . . . . . . . . . . . . . . . . . . 20.0 21.7 21.7 21.6 21.8 22.6 24.7 26.2 0.8OECD North America . . . . . . . . . . . . . 14.7 15.3 15.5 16.2 16.9 18.1 20.2 21.5 1.4United States. . . . . . . . . . . . . . . . . . . . 9.7 8.3 8.6 9.8 10.3 11.5 12.9 13.5 2.0Canada . . . . . . . . . . . . . . . . . . . . . . . . 2.0 3.3 3.4 3.7 4.4 4.7 5.1 5.5 2.1Mexico. . . . . . . . . . . . . . . . . . . . . . . . . 3.0 3.7 3.5 2.7 2.2 2.0 2.2 2.5 -1.6
OECD Europe . . . . . . . . . . . . . . . . . . . 4.5 5.6 5.4 4.6 4.1 3.7 3.7 3.8 -1.7OECD Asia . . . . . . . . . . . . . . . . . . . . . . 0.8 0.7 0.8 0.8 0.8 0.8 0.9 0.9 1.1
Japan . . . . . . . . . . . . . . . . . . . . . . . . . 0.1 0.1 0.1 0.1 0.1 0.2 0.2 0.2 2.2South Korea . . . . . . . . . . . . . . . . . . . . 0.0 0.0 0.0 0.0 0.0 0.0 0.0 0.0 4.6Australia and New Zealand . . . . . . . . . 0.7 0.6 0.6 0.7 0.6 0.6 0.6 0.7 0.7
Non-OECD . . . . . . . . . . . . . . . . . . . . . . . 22.8 28.2 28.7 29.3 32.0 35.9 38.9 42.2 1.7Non-OECD Europe and Eurasia. . . . . 11.6 12.3 12.8 12.7 14.1 16.2 17.4 18.8 1.8
Russia . . . . . . . . . . . . . . . . . . . . . . . . . 10.1 9.7 9.9 9.5 9.9 11.6 12.5 13.4 1.4Caspian Area . . . . . . . . . . . . . . . . . . . 1.1 2.3 2.6 3.0 4.0 4.4 4.7 5.2 3.4Other . . . . . . . . . . . . . . . . . . . . . . . . . . 0.4 0.3 0.3 0.3 0.2 0.2 0.2 0.3 -1.0
Non-OECD Asia . . . . . . . . . . . . . . . . . . 6.0 7.8 7.7 7.9 8.0 8.3 8.7 9.2 0.7China. . . . . . . . . . . . . . . . . . . . . . . . . . 2.8 3.9 3.9 4.1 3.9 4.0 4.2 4.6 0.7India . . . . . . . . . . . . . . . . . . . . . . . . . . 0.7 0.9 0.9 0.9 1.0 1.2 1.4 1.4 2.0Other . . . . . . . . . . . . . . . . . . . . . . . . . . 2.5 3.0 2.9 2.9 3.1 3.1 3.1 3.2 0.3
Middle East (Non-OPEC) . . . . . . . . . . 1.3 1.6 1.5 1.5 1.6 1.4 1.4 1.4 -0.7Africa . . . . . . . . . . . . . . . . . . . . . . . . . . 1.7 2.5 2.6 2.7 2.9 3.1 3.4 3.6 1.5Central and South America . . . . . . . . 2.2 4.0 4.1 4.5 5.4 6.9 8.0 9.2 3.6Brazil . . . . . . . . . . . . . . . . . . . . . . . . . . 0.9 2.1 2.3 2.6 3.7 4.9 5.7 6.5 4.7Other . . . . . . . . . . . . . . . . . . . . . . . . . . 1.3 1.8 1.8 1.8 1.7 1.9 2.3 2.8 1.7
Total World . . . . . . . . . . . . . . . . . . . . . . . 66.5 84.6 84.8 86.6 93.0 100.5 108.0 116.3 1.3
OPEC Share of World Production. . . . . . . 36% 41% 41% 41% 42% 42% 41% 41%Persian Gulf Share of World Production . . 24% 28% 27% 28% 28% 28% 27% 28%
aOPEC = Organization of the Petroleum Exporting Countries (OPEC-12).Sources: History: Energy Information Administration (EIA), Office of Energy Markets and End Use. Projections: EIA, Generate
World Oil Balance Model (2009).

Table G11. World Conventional Liquids Production by Region and Country, High Economic Growth Case,1990-2030(Million Barrels per Day)
Appendix G
238 Energy Information Administration / International Energy Outlook 2009
Region/Country
History (Estimates) Projections Average AnnualPercent Change,
2006-20301990 2006 2007 2010 2015 2020 2025 2030
OPECa . . . . . . . . . . . . . . . . . . . . . . . . . . . 23.7 34.0 33.7 35.1 38.3 40.9 43.2 46.5 1.3Middle East . . . . . . . . . . . . . . . . . . . . . . 16.1 23.5 23.0 23.9 25.9 27.9 29.5 32.1 1.3Iran . . . . . . . . . . . . . . . . . . . . . . . . . . . . 3.1 4.1 4.0 4.3 4.1 4.1 4.3 4.7 0.6Iraq . . . . . . . . . . . . . . . . . . . . . . . . . . . . 2.1 2.0 2.1 2.5 3.0 4.5 5.0 5.6 4.4Kuwait . . . . . . . . . . . . . . . . . . . . . . . . . . 1.2 2.7 2.6 2.7 2.8 2.8 2.9 3.2 0.8Qatar . . . . . . . . . . . . . . . . . . . . . . . . . . . 0.4 1.1 1.1 1.4 1.8 2.0 2.2 2.5 3.3Saudi Arabia . . . . . . . . . . . . . . . . . . . . . 7.0 10.6 10.2 10.0 11.2 11.4 11.9 12.8 0.8United Arab Emirates . . . . . . . . . . . . . . 2.3 2.9 2.9 3.0 3.1 3.1 3.1 3.1 0.3
North Africa . . . . . . . . . . . . . . . . . . . . . . 2.7 3.9 4.0 4.1 4.5 4.6 4.6 4.8 0.8Algeria . . . . . . . . . . . . . . . . . . . . . . . . . . 1.3 2.1 2.2 2.2 2.7 2.9 3.0 3.1 1.6Libya . . . . . . . . . . . . . . . . . . . . . . . . . . . 1.4 1.8 1.8 1.9 1.8 1.6 1.6 1.7 -0.2
West Africa . . . . . . . . . . . . . . . . . . . . . . 2.3 3.9 4.1 4.8 5.7 6.0 6.3 6.8 2.3Angola . . . . . . . . . . . . . . . . . . . . . . . . . . 0.5 1.4 1.8 2.3 2.6 2.6 2.7 3.0 3.2Nigeria. . . . . . . . . . . . . . . . . . . . . . . . . . 1.8 2.4 2.4 2.4 3.2 3.4 3.6 3.7 1.8
South America. . . . . . . . . . . . . . . . . . . . 2.5 2.7 2.6 2.3 2.2 2.5 2.8 2.9 0.3Ecuador. . . . . . . . . . . . . . . . . . . . . . . . . 0.3 0.5 0.5 0.5 0.4 0.5 0.5 0.5 -0.3Venezuela . . . . . . . . . . . . . . . . . . . . . . . 2.3 2.1 2.1 1.8 1.7 2.0 2.3 2.4 0.4
Non-OPEC . . . . . . . . . . . . . . . . . . . . . . . . 42.0 47.5 47.4 46.5 47.3 50.4 53.1 56.1 0.7OECD . . . . . . . . . . . . . . . . . . . . . . . . . . . 19.5 19.8 19.4 18.1 16.8 16.6 17.4 17.8 -0.4OECD North America . . . . . . . . . . . . . 14.3 13.6 13.4 13.0 12.3 12.6 13.5 13.9 0.1United States. . . . . . . . . . . . . . . . . . . . 9.6 7.8 7.8 8.5 8.7 9.5 10.3 10.5 1.2Canada . . . . . . . . . . . . . . . . . . . . . . . . 1.7 2.1 2.1 1.8 1.5 1.3 1.1 1.1 -2.7Mexico. . . . . . . . . . . . . . . . . . . . . . . . . 3.0 3.7 3.5 2.7 2.2 1.9 2.0 2.3 -2.0
OECD Europe . . . . . . . . . . . . . . . . . . . 4.5 5.5 5.2 4.3 3.7 3.3 3.1 3.1 -2.3Denmark . . . . . . . . . . . . . . . . . . . . . . . 0.1 0.3 0.3 0.3 0.2 0.2 0.1 0.1 -5.2Norway . . . . . . . . . . . . . . . . . . . . . . . . 1.7 2.8 2.6 2.2 1.9 1.7 1.6 1.5 -2.5United Kngdom . . . . . . . . . . . . . . . . . . 2.0 1.7 1.7 1.2 1.0 0.8 0.8 0.8 -3.1Other . . . . . . . . . . . . . . . . . . . . . . . . . . 0.7 0.7 0.7 0.6 0.6 0.6 0.7 0.7 0.3
OECD Asia . . . . . . . . . . . . . . . . . . . . . . 0.8 0.7 0.8 0.8 0.7 0.7 0.8 0.8 0.4Japan . . . . . . . . . . . . . . . . . . . . . . . . . 0.1 0.1 0.1 0.1 0.1 0.2 0.2 0.2 1.2South Korea . . . . . . . . . . . . . . . . . . . . 0.0 0.0 0.0 0.0 0.0 0.0 0.0 0.0 4.0Australia and New Zealand . . . . . . . . . 0.7 0.6 0.6 0.6 0.6 0.6 0.6 0.6 0.2
aOPEC = Organization of the Petroleum Exporting Countries (OPEC-12).

Table G11. World Conventional Liquids Production by Region and Country, High Economic Growth Case,1990-2030 (Continued)(Million Barrels per Day)
Liquids Production Projections
Energy Information Administration / International Energy Outlook 2009 239
Region/Country
History (Estimates) Projections Average AnnualPercent Change,
2006-20301990 2006 2007 2010 2015 2020 2025 2030
Non-OECD . . . . . . . . . . . . . . . . . . . . . . . 22.5 27.7 28.0 28.4 30.5 33.7 35.8 38.2 1.3Non-OECD Europe and Eurasia. . . . . 11.6 12.3 12.8 12.7 14.1 16.2 17.4 18.8 1.8
Russia . . . . . . . . . . . . . . . . . . . . . . . . 10.1 9.7 9.9 9.5 9.9 11.6 12.5 13.4 1.4Caspian Area . . . . . . . . . . . . . . . . . . . 1.1 2.3 2.6 3.0 4.0 4.4 4.7 5.2 3.4
Azerbaijan . . . . . . . . . . . . . . . . . . . . . 0.3 0.6 0.8 1.1 1.1 1.1 1.1 1.1 2.4Kazakhstan . . . . . . . . . . . . . . . . . . . . 0.6 1.4 1.4 1.6 2.6 2.9 3.1 3.6 4.0Turkmenistan . . . . . . . . . . . . . . . . . . 0.1 0.2 0.2 0.2 0.3 0.3 0.3 0.4 3.1Uzbekistan . . . . . . . . . . . . . . . . . . . . 0.1 0.1 0.1 0.1 0.1 0.1 0.1 0.1 -1.0
Other. . . . . . . . . . . . . . . . . . . . . . . . . . 0.4 0.3 0.3 0.3 0.2 0.2 0.2 0.2 -1.1Non-OECD Asia . . . . . . . . . . . . . . . . . . 6.0 7.7 7.7 7.7 7.7 7.7 7.6 7.4 -0.2China. . . . . . . . . . . . . . . . . . . . . . . . . . 2.8 3.9 3.9 4.0 3.7 3.7 3.5 3.5 -0.4India . . . . . . . . . . . . . . . . . . . . . . . . . . 0.7 0.9 0.9 0.9 0.9 1.1 1.1 1.0 0.8Brunei . . . . . . . . . . . . . . . . . . . . . . . . . 0.2 0.2 0.2 0.1 0.2 0.1 0.1 0.1 -2.1Malaysia . . . . . . . . . . . . . . . . . . . . . . . 0.6 0.7 0.7 0.7 0.7 0.7 0.7 0.7 0.2Thailand . . . . . . . . . . . . . . . . . . . . . . . 0.1 0.3 0.3 0.4 0.4 0.4 0.4 0.4 0.9Vietnam . . . . . . . . . . . . . . . . . . . . . . . . 0.1 0.4 0.4 0.4 0.5 0.4 0.4 0.4 0.7Other . . . . . . . . . . . . . . . . . . . . . . . . . . 1.6 1.4 1.3 1.3 1.3 1.3 1.2 1.1 -0.8
Middle East (Non-OPEC) . . . . . . . . . . 1.3 1.6 1.5 1.5 1.6 1.4 1.4 1.4 -0.7Oman . . . . . . . . . . . . . . . . . . . . . . . . . 0.7 0.7 0.7 0.8 0.9 0.8 0.8 0.8 0.3Syria . . . . . . . . . . . . . . . . . . . . . . . . . . 0.4 0.4 0.4 0.5 0.4 0.4 0.4 0.3 -1.1Yemen. . . . . . . . . . . . . . . . . . . . . . . . . 0.2 0.4 0.3 0.3 0.2 0.2 0.2 0.2 -3.2Other . . . . . . . . . . . . . . . . . . . . . . . . . . 0.0 0.1 0.1 0.1 0.0 0.0 0.0 0.1 -0.2
Africa . . . . . . . . . . . . . . . . . . . . . . . . . . 1.6 2.4 2.4 2.5 2.5 2.7 2.8 3.0 1.0Chad . . . . . . . . . . . . . . . . . . . . . . . . . . 0.0 0.2 0.1 0.1 0.1 0.1 0.1 0.1 -3.4Congo (Brazzaville) . . . . . . . . . . . . . . . 0.2 0.2 0.2 0.3 0.3 0.3 0.4 0.5 2.6Egypt . . . . . . . . . . . . . . . . . . . . . . . . . . 0.9 0.7 0.7 0.5 0.6 0.7 0.7 0.7 0.3Equatorial Guniea . . . . . . . . . . . . . . . . 0.0 0.4 0.4 0.4 0.4 0.4 0.4 0.4 0.1Gabon . . . . . . . . . . . . . . . . . . . . . . . . . 0.3 0.2 0.2 0.2 0.2 0.2 0.2 0.2 -1.4Sao Tome and Principe. . . . . . . . . . . . 0.0 0.0 0.0 0.0 0.0 0.0 0.1 0.1 —Sudan . . . . . . . . . . . . . . . . . . . . . . . . . 0.0 0.4 0.5 0.6 0.5 0.6 0.6 0.8 2.9Other . . . . . . . . . . . . . . . . . . . . . . . . . . 0.3 0.3 0.3 0.4 0.5 0.4 0.4 0.4 1.0
Central and South America . . . . . . . . 2.0 3.7 3.7 4.0 4.7 5.8 6.6 7.6 3.1Brazil . . . . . . . . . . . . . . . . . . . . . . . . . . 0.7 1.9 1.9 2.2 3.1 4.2 4.8 5.4 4.6Argentina. . . . . . . . . . . . . . . . . . . . . . . 0.5 0.8 0.8 0.8 0.5 0.4 0.4 0.4 -3.1Colombia . . . . . . . . . . . . . . . . . . . . . . . 0.5 0.5 0.5 0.5 0.4 0.4 0.4 0.4 -1.3Peru. . . . . . . . . . . . . . . . . . . . . . . . . . . 0.1 0.1 0.1 0.1 0.2 0.3 0.3 0.4 4.8Trinidad and Tobago . . . . . . . . . . . . . . 0.1 0.2 0.2 0.2 0.2 0.2 0.1 0.1 -1.1Other . . . . . . . . . . . . . . . . . . . . . . . . . . 0.1 0.2 0.2 0.2 0.2 0.3 0.6 0.9 7.0
Total World . . . . . . . . . . . . . . . . . . . . . . . 65.7 81.5 81.1 81.6 85.7 91.3 96.3 102.5 1.0
OPEC Share of World Production. . . . . . . 36% 42% 42% 43% 45% 45% 45% 45%Persian Gulf Share of World Production . . 25% 29% 28% 29% 30% 31% 31% 31%
Note: Conventional liquids include crude oil and lease condensate, natural gas plant liquids, and refinery gain.Sources: History: Energy Information Administration (EIA), Office of Energy Markets and End Use. Projections: EIA, Generate
World Oil Balance Model (2009).

Table G12. World Unconventional Liquids Production by Region and Country, High Economic Growth Case,1990-2030(Million Barrels per Day)
Appendix G
240 Energy Information Administration / International Energy Outlook 2009
Region/Country
History (Estimates) Projections Average AnnualPercent Change,
2006-20301990 2006 2007 2010 2015 2020 2025 2030
OPECa . . . . . . . . . . . . . . . . . . . . . . . . . . . 0.0 0.7 0.7 0.7 0.8 1.1 1.2 1.4 3.1Biofuels . . . . . . . . . . . . . . . . . . . . . . . . . . 0.0 0.0 0.0 0.0 0.0 0.0 0.0 0.0 —Extra-Heavy Oil (Venezuela). . . . . . . . . . 0.0 0.6 0.6 0.6 0.7 0.8 0.9 1.1 2.6Coal-to-Liquids . . . . . . . . . . . . . . . . . . . . 0.0 0.0 0.0 0.0 0.0 0.0 0.0 0.0 —Gas-to-Liquids (primarily Qatar) . . . . . . . 0.0 0.0 0.0 0.0 0.1 0.2 0.3 0.3 18.3
Non-OPEC . . . . . . . . . . . . . . . . . . . . . . . . 0.7 2.4 3.0 4.4 6.5 8.2 10.5 12.4 7.1OECD . . . . . . . . . . . . . . . . . . . . . . . . . . . 0.5 1.9 2.3 3.5 5.0 6.0 7.3 8.4 6.4Biofuels . . . . . . . . . . . . . . . . . . . . . . . . . 0.0 0.5 0.6 1.2 1.7 2.1 2.7 3.1 8.3Oil Sands/Bitumen (Canada) . . . . . . . . 0.4 1.2 1.4 1.9 2.8 3.3 3.8 4.2 5.3Extra-Heavy Oil (Mexico) . . . . . . . . . . . 0.0 0.0 0.0 0.0 0.0 0.0 0.1 0.1 14.8Coal-to-Liquids . . . . . . . . . . . . . . . . . . . 0.0 0.0 0.0 0.0 0.1 0.1 0.2 0.3 26.1Gas-to-Liquids. . . . . . . . . . . . . . . . . . . . 0.0 0.0 0.0 0.0 0.0 0.0 0.0 0.0 —Shale Oil . . . . . . . . . . . . . . . . . . . . . . . . 0.0 0.0 0.0 0.0 0.0 0.0 0.1 0.1 —
Non-OECD . . . . . . . . . . . . . . . . . . . . . . . 0.3 0.5 0.7 0.9 1.5 2.2 3.2 4.0 8.9Biofuels . . . . . . . . . . . . . . . . . . . . . . . . . 0.2 0.3 0.4 0.7 1.2 1.7 2.4 2.9 9.3Extra-Heavy Oil . . . . . . . . . . . . . . . . . . . 0.0 0.0 0.0 0.0 0.0 0.0 0.0 0.0 —Coal-to-Liquids . . . . . . . . . . . . . . . . . . . 0.1 0.1 0.2 0.2 0.2 0.4 0.7 1.0 8.2Gas-to-Liquids. . . . . . . . . . . . . . . . . . . . 0.0 0.0 0.0 0.0 0.1 0.1 0.1 0.1 —Shale Oil . . . . . . . . . . . . . . . . . . . . . . . . 0.0 0.0 0.0 0.0 0.0 0.0 0.0 0.0 0.8
WorldBiofuels . . . . . . . . . . . . . . . . . . . . . . . . . . 0.2 0.8 1.1 1.9 2.8 3.9 5.2 6.1 8.8Oil Sands/Bitumen . . . . . . . . . . . . . . . . . 0.4 1.2 1.4 1.9 2.8 3.3 3.8 4.2 5.3Extra-Heavy Oil . . . . . . . . . . . . . . . . . . . . 0.0 0.6 0.6 0.7 0.7 0.9 1.0 1.2 2.9Coal-to-Liquids . . . . . . . . . . . . . . . . . . . . 0.1 0.1 0.2 0.2 0.3 0.5 0.9 1.2 9.3Gas-to-Liquids. . . . . . . . . . . . . . . . . . . . . 0.0 0.0 0.1 0.1 0.2 0.3 0.3 0.4 19.4Shale Oil . . . . . . . . . . . . . . . . . . . . . . . . . 0.0 0.0 0.0 0.0 0.0 0.0 0.1 0.2 14.0
World Total . . . . . . . . . . . . . . . . . . . . . . . 0.8 3.1 3.7 5.0 7.3 9.3 11.7 13.8 6.5
Selected Country HighlightsBiofuelsBrazil . . . . . . . . . . . . . . . . . . . . . . . . . . . 0.2 0.3 0.3 0.4 0.6 0.8 1.0 1.0 5.6China. . . . . . . . . . . . . . . . . . . . . . . . . . . 0.0 0.0 0.0 0.1 0.2 0.3 0.4 0.5 13.0India . . . . . . . . . . . . . . . . . . . . . . . . . . . 0.0 0.0 0.0 0.0 0.0 0.1 0.2 0.2 18.6United States. . . . . . . . . . . . . . . . . . . . . 0.0 0.3 0.5 0.9 1.2 1.4 1.8 2.0 7.8
Coal-to-LiquidsAustralia and New Zealand . . . . . . . . . . 0.0 0.0 0.0 0.0 0.0 0.0 0.0 0.0 —China. . . . . . . . . . . . . . . . . . . . . . . . . . . 0.0 0.0 0.0 0.0 0.0 0.1 0.3 0.6 —Germany . . . . . . . . . . . . . . . . . . . . . . . . 0.0 0.0 0.0 0.0 0.0 0.0 0.0 0.0 0.6India . . . . . . . . . . . . . . . . . . . . . . . . . . . 0.0 0.0 0.0 0.0 0.0 0.0 0.1 0.1 —South Africa. . . . . . . . . . . . . . . . . . . . . . 0.1 0.1 0.2 0.2 0.2 0.3 0.3 0.3 2.9United States. . . . . . . . . . . . . . . . . . . . . 0.0 0.0 0.0 0.0 0.1 0.1 0.2 0.3 —
Gas-to-LiquidsQatar . . . . . . . . . . . . . . . . . . . . . . . . . . . 0.0 0.0 0.0 0.0 0.1 0.2 0.2 0.2 17.2South Africa. . . . . . . . . . . . . . . . . . . . . . 0.0 0.0 0.0 0.0 0.1 0.1 0.1 0.1 —
aOPEC = Organization of the Petroleum Exporting Countries (OPEC-12).Sources: History: Energy Information Administration (EIA), Office of Energy Markets and End Use. Projections: EIA, Generate
World Oil Balance Model (2009).

Table G13. World Total Liquids Production by Region and Country, Low Economic Growth Case, 1990-2030(Million Barrels per Day)
Liquids Production Projections
Energy Information Administration / International Energy Outlook 2009 241
Region/Country
History (Estimates) Projections Average AnnualPercent Change,
2006-20301990 2006 2007 2010 2015 2020 2025 2030
OPECa . . . . . . . . . . . . . . . . . . . . . . . . . . . 23.7 34.7 34.4 35.6 37.3 38.1 38.5 39.7 0.6Middle East . . . . . . . . . . . . . . . . . . . . . . 16.1 23.6 23.1 23.8 24.8 25.5 25.9 26.9 0.5Iran . . . . . . . . . . . . . . . . . . . . . . . . . . . . 3.1 4.1 4.0 4.2 3.8 3.6 3.6 3.7 -0.4Iraq . . . . . . . . . . . . . . . . . . . . . . . . . . . . 2.1 2.0 2.1 2.5 2.8 3.9 4.2 4.4 3.3Kuwait . . . . . . . . . . . . . . . . . . . . . . . . . . 1.2 2.7 2.6 2.7 2.6 2.5 2.5 2.6 -0.2Qatar . . . . . . . . . . . . . . . . . . . . . . . . . . . 0.4 1.1 1.1 1.4 1.8 2.1 2.2 2.3 3.0Saudi Arabia . . . . . . . . . . . . . . . . . . . . . 7.0 10.7 10.2 10.0 10.8 10.7 10.8 11.3 0.2United Arab Emirates . . . . . . . . . . . . . . 2.3 2.9 2.9 3.0 2.9 2.8 2.7 2.6 -0.5
North Africa . . . . . . . . . . . . . . . . . . . . . . 2.7 3.9 4.0 4.1 4.2 4.1 3.9 3.9 -0.1Algeria . . . . . . . . . . . . . . . . . . . . . . . . . . 1.3 2.1 2.2 2.2 2.6 2.6 2.6 2.5 0.7Libya . . . . . . . . . . . . . . . . . . . . . . . . . . . 1.4 1.8 1.8 1.9 1.7 1.5 1.4 1.4 -1.1
West Africa . . . . . . . . . . . . . . . . . . . . . . 2.3 3.9 4.1 4.8 5.4 5.4 5.3 5.4 1.4Angola . . . . . . . . . . . . . . . . . . . . . . . . . . 0.5 1.4 1.8 2.3 2.4 2.3 2.3 2.4 2.1Nigeria. . . . . . . . . . . . . . . . . . . . . . . . . . 1.8 2.4 2.4 2.4 3.0 3.1 3.1 3.0 0.9
South America. . . . . . . . . . . . . . . . . . . . 2.5 3.3 3.2 2.9 2.8 3.1 3.4 3.6 0.4Ecuador. . . . . . . . . . . . . . . . . . . . . . . . . 0.3 0.5 0.5 0.5 0.4 0.4 0.4 0.4 -1.3Venezuela . . . . . . . . . . . . . . . . . . . . . . . 2.3 2.7 2.7 2.4 2.4 2.7 3.0 3.2 0.6
Non-OPEC . . . . . . . . . . . . . . . . . . . . . . . . 42.8 49.9 50.4 50.6 51.1 53.6 56.0 57.7 0.6OECD . . . . . . . . . . . . . . . . . . . . . . . . . . . 20.0 21.7 21.7 21.4 21.1 21.5 23.1 23.8 0.4OECD North America . . . . . . . . . . . . . 14.7 15.3 15.5 16.1 16.5 17.3 19.0 19.8 1.1United States. . . . . . . . . . . . . . . . . . . . 9.7 8.3 8.6 9.7 10.2 11.1 12.3 12.5 1.7Canada . . . . . . . . . . . . . . . . . . . . . . . . 2.0 3.3 3.4 3.7 4.3 4.5 4.9 5.3 2.0Mexico. . . . . . . . . . . . . . . . . . . . . . . . . 3.0 3.7 3.5 2.7 2.1 1.8 1.9 2.0 -2.5
OECD Europe . . . . . . . . . . . . . . . . . . . 4.5 5.6 5.4 4.6 3.9 3.4 3.3 3.2 -2.3OECD Asia . . . . . . . . . . . . . . . . . . . . . . 0.8 0.7 0.8 0.8 0.7 0.7 0.8 0.8 0.5
Japan . . . . . . . . . . . . . . . . . . . . . . . . . 0.1 0.1 0.1 0.1 0.1 0.2 0.2 0.2 2.2South Korea . . . . . . . . . . . . . . . . . . . . 0.0 0.0 0.0 0.0 0.0 0.0 0.0 0.0 4.6Australia and New Zealand . . . . . . . . . 0.7 0.6 0.6 0.6 0.6 0.5 0.5 0.6 -0.1
Non-OECD . . . . . . . . . . . . . . . . . . . . . . . 22.8 28.2 28.7 29.1 29.9 32.0 32.9 33.9 0.8Non-OECD Europe and Eurasia. . . . . 11.6 12.3 12.8 12.6 13.1 14.3 14.5 14.7 0.7
Russia . . . . . . . . . . . . . . . . . . . . . . . . . 10.1 9.7 9.9 9.4 9.2 10.2 10.4 10.4 0.3Caspian Area . . . . . . . . . . . . . . . . . . . 1.1 2.3 2.6 2.9 3.7 3.9 3.9 4.1 2.4Other . . . . . . . . . . . . . . . . . . . . . . . . . . 0.4 0.3 0.3 0.3 0.2 0.2 0.2 0.2 -1.8
Non-OECD Asia . . . . . . . . . . . . . . . . . . 6.0 7.8 7.7 7.9 7.5 7.5 7.5 7.6 -0.1China. . . . . . . . . . . . . . . . . . . . . . . . . . 2.8 3.9 3.9 4.1 3.7 3.6 3.6 3.7 -0.2India . . . . . . . . . . . . . . . . . . . . . . . . . . 0.7 0.9 0.9 0.9 0.9 1.1 1.2 1.2 1.4Other . . . . . . . . . . . . . . . . . . . . . . . . . . 2.5 3.0 2.9 2.9 2.9 2.8 2.7 2.7 -0.5
Middle East (Non-OPEC) . . . . . . . . . . 1.3 1.6 1.5 1.5 1.5 1.3 1.2 1.1 -1.6Africa . . . . . . . . . . . . . . . . . . . . . . . . . . 1.7 2.5 2.6 2.7 2.7 2.8 2.8 2.9 0.6Central and South America . . . . . . . . 2.2 4.0 4.1 4.5 5.1 6.2 6.9 7.5 2.7Brazil . . . . . . . . . . . . . . . . . . . . . . . . . . 0.9 2.1 2.3 2.6 3.5 4.4 4.9 5.2 3.8Other . . . . . . . . . . . . . . . . . . . . . . . . . . 1.3 1.8 1.8 1.8 1.6 1.8 2.0 2.3 1.0
Total World . . . . . . . . . . . . . . . . . . . . . . . 66.5 84.6 84.8 86.1 88.3 91.6 94.5 97.4 0.6
OPEC Share of World Production. . . . . . . 36% 41% 41% 41% 42% 42% 41% 41%Persian Gulf Share of World Production . . 24% 28% 27% 28% 28% 28% 27% 28%
aOPEC = Organization of the Petroleum Exporting Countries (OPEC-12).Sources: History: Energy Information Administration (EIA), Office of Energy Markets and End Use. Projections: EIA, Generate
World Oil Balance Model (2009).

Table G14. World Conventional Liquids Production by Region and Country, Low Economic Growth Case,1990-2030(Million Barrels per Day)
Appendix G
242 Energy Information Administration / International Energy Outlook 2009
Region/Country
History (Estimates) Projections Average AnnualPercent Change,
2006-20301990 2006 2007 2010 2015 2020 2025 2030
OPECa . . . . . . . . . . . . . . . . . . . . . . . . . . . 23.7 34.0 33.7 34.9 36.4 37.0 37.3 38.2 0.5Middle East . . . . . . . . . . . . . . . . . . . . . . 16.1 23.5 23.0 23.8 24.7 25.3 25.7 26.7 0.5Iran . . . . . . . . . . . . . . . . . . . . . . . . . . . . 3.1 4.1 4.0 4.2 3.8 3.6 3.6 3.7 -0.4Iraq . . . . . . . . . . . . . . . . . . . . . . . . . . . . 2.1 2.0 2.1 2.5 2.8 3.9 4.2 4.4 3.3Kuwait . . . . . . . . . . . . . . . . . . . . . . . . . . 1.2 2.7 2.6 2.7 2.6 2.5 2.5 2.6 -0.2Qatar . . . . . . . . . . . . . . . . . . . . . . . . . . . 0.4 1.1 1.1 1.4 1.7 1.9 2.0 2.1 2.6Saudi Arabia . . . . . . . . . . . . . . . . . . . . . 7.0 10.6 10.2 10.0 10.8 10.7 10.8 11.3 0.3United Arab Emirates . . . . . . . . . . . . . . 2.3 2.9 2.9 3.0 2.9 2.8 2.7 2.6 -0.5
North Africa . . . . . . . . . . . . . . . . . . . . . . 2.7 3.9 4.0 4.1 4.2 4.1 3.9 3.9 -0.1Algeria . . . . . . . . . . . . . . . . . . . . . . . . . . 1.3 2.1 2.2 2.2 2.6 2.6 2.6 2.5 0.7Libya . . . . . . . . . . . . . . . . . . . . . . . . . . . 1.4 1.8 1.8 1.9 1.7 1.5 1.4 1.4 -1.1
West Africa . . . . . . . . . . . . . . . . . . . . . . 2.3 3.9 4.1 4.8 5.4 5.3 5.3 5.3 1.3Angola . . . . . . . . . . . . . . . . . . . . . . . . . . 0.5 1.4 1.8 2.3 2.4 2.3 2.3 2.4 2.1Nigeria. . . . . . . . . . . . . . . . . . . . . . . . . . 1.8 2.4 2.4 2.4 3.0 3.1 3.0 3.0 0.8
South America. . . . . . . . . . . . . . . . . . . . 2.5 2.7 2.6 2.2 2.0 2.2 2.4 2.3 -0.6Ecuador. . . . . . . . . . . . . . . . . . . . . . . . . 0.3 0.5 0.5 0.5 0.4 0.4 0.4 0.4 -1.3Venezuela . . . . . . . . . . . . . . . . . . . . . . . 2.3 2.1 2.1 1.8 1.7 1.8 2.0 1.9 -0.4
Non-OPEC . . . . . . . . . . . . . . . . . . . . . . . . 42.0 47.5 47.4 46.2 44.6 45.4 45.8 45.8 -0.2OECD . . . . . . . . . . . . . . . . . . . . . . . . . . . 19.5 19.8 19.4 18.0 16.1 15.6 15.9 15.8 -0.9OECD North America . . . . . . . . . . . . . 14.3 13.6 13.4 12.9 11.9 11.9 12.5 12.5 -0.4United States. . . . . . . . . . . . . . . . . . . . 9.6 7.8 7.8 8.5 8.4 9.1 9.8 9.7 0.9Canada . . . . . . . . . . . . . . . . . . . . . . . . 1.7 2.1 2.1 1.8 1.5 1.2 1.1 1.0 -3.1Mexico. . . . . . . . . . . . . . . . . . . . . . . . . 3.0 3.7 3.5 2.7 2.0 1.7 1.7 1.8 -2.9
OECD Europe . . . . . . . . . . . . . . . . . . . 4.5 5.5 5.2 4.2 3.5 3.0 2.7 2.6 -3.0Denmark . . . . . . . . . . . . . . . . . . . . . . . 0.1 0.3 0.3 0.3 0.2 0.1 0.1 0.1 -6.2Norway . . . . . . . . . . . . . . . . . . . . . . . . 1.7 2.8 2.6 2.2 1.8 1.5 1.4 1.2 -3.3United Kngdom . . . . . . . . . . . . . . . . . . 2.0 1.7 1.7 1.2 0.9 0.7 0.7 0.7 -3.8Other . . . . . . . . . . . . . . . . . . . . . . . . . . 0.7 0.7 0.7 0.6 0.6 0.6 0.6 0.7 -0.1
OECD Asia . . . . . . . . . . . . . . . . . . . . . . 0.8 0.7 0.8 0.8 0.7 0.7 0.7 0.7 -0.2Japan . . . . . . . . . . . . . . . . . . . . . . . . . 0.1 0.1 0.1 0.1 0.1 0.2 0.2 0.2 1.2South Korea . . . . . . . . . . . . . . . . . . . . 0.0 0.0 0.0 0.0 0.0 0.0 0.0 0.0 4.1Australia and New Zealand . . . . . . . . . 0.7 0.6 0.6 0.6 0.5 0.5 0.5 0.5 -0.7
aOPEC = Organization of the Petroleum Exporting Countries (OPEC-12).

Table G14. World Conventional Liquids Production by Region and Country, Low Economic Growth Case,1990-2030 (Continued)(Million Barrels per Day)
Liquids Production Projections
Energy Information Administration / International Energy Outlook 2009 243
Region/Country
History (Estimates) Projections Average AnnualPercent Change,
2006-20301990 2006 2007 2010 2015 2020 2025 2030
Non-OECD . . . . . . . . . . . . . . . . . . . . . . . 22.5 27.7 28.0 28.2 28.5 29.8 29.8 30.0 0.3Non-OECD Europe and Eurasia. . . . . 11.6 12.3 12.8 12.6 13.1 14.3 14.5 14.7 0.7
Russia . . . . . . . . . . . . . . . . . . . . . . . . 10.1 9.7 9.9 9.4 9.2 10.2 10.4 10.4 0.3Caspian Area . . . . . . . . . . . . . . . . . . . 1.1 2.3 2.6 2.9 3.7 3.9 3.9 4.1 2.4
Azerbaijan . . . . . . . . . . . . . . . . . . . . . 0.3 0.6 0.8 1.1 1.0 0.9 0.9 0.9 1.3Kazakhstan . . . . . . . . . . . . . . . . . . . . 0.6 1.4 1.4 1.6 2.4 2.6 2.6 2.8 3.0Turkmenistan . . . . . . . . . . . . . . . . . . 0.1 0.2 0.2 0.2 0.2 0.3 0.3 0.3 2.0Uzbekistan . . . . . . . . . . . . . . . . . . . . 0.1 0.1 0.1 0.1 0.1 0.1 0.1 0.1 -1.7
Other. . . . . . . . . . . . . . . . . . . . . . . . . . 0.4 0.3 0.3 0.3 0.2 0.2 0.2 0.2 -1.8Non-OECD Asia . . . . . . . . . . . . . . . . . . 6.0 7.7 7.7 7.7 7.2 6.9 6.4 6.0 -1.1China. . . . . . . . . . . . . . . . . . . . . . . . . . 2.8 3.9 3.9 3.9 3.4 3.2 2.9 2.8 -1.4India . . . . . . . . . . . . . . . . . . . . . . . . . . 0.7 0.9 0.9 0.9 0.9 1.0 1.0 0.9 0.1Brunei . . . . . . . . . . . . . . . . . . . . . . . . . 0.2 0.2 0.2 0.1 0.1 0.1 0.1 0.1 -3.0Malaysia . . . . . . . . . . . . . . . . . . . . . . . 0.6 0.7 0.7 0.7 0.7 0.7 0.6 0.6 -0.7Thailand . . . . . . . . . . . . . . . . . . . . . . . 0.1 0.3 0.3 0.4 0.4 0.4 0.4 0.4 0.4Vietnam . . . . . . . . . . . . . . . . . . . . . . . . 0.1 0.4 0.4 0.4 0.4 0.4 0.4 0.3 -0.2Other . . . . . . . . . . . . . . . . . . . . . . . . . . 1.6 1.4 1.3 1.3 1.3 1.1 1.0 0.9 -1.7
Middle East (Non-OPEC) . . . . . . . . . . 1.3 1.6 1.5 1.5 1.5 1.3 1.2 1.1 -1.6Oman . . . . . . . . . . . . . . . . . . . . . . . . . 0.7 0.7 0.7 0.7 0.9 0.7 0.6 0.6 -0.7Syria . . . . . . . . . . . . . . . . . . . . . . . . . . 0.4 0.4 0.4 0.4 0.4 0.3 0.3 0.3 -1.9Yemen. . . . . . . . . . . . . . . . . . . . . . . . . 0.2 0.4 0.3 0.3 0.2 0.2 0.2 0.1 -4.3Other . . . . . . . . . . . . . . . . . . . . . . . . . . 0.0 0.1 0.1 0.1 0.0 0.0 0.0 0.0 -0.8
Africa . . . . . . . . . . . . . . . . . . . . . . . . . . 1.6 2.4 2.4 2.4 2.3 2.3 2.3 2.3 -0.1Chad . . . . . . . . . . . . . . . . . . . . . . . . . . 0.0 0.2 0.1 0.1 0.1 0.1 0.1 0.1 -4.5Congo (Brazzaville) . . . . . . . . . . . . . . . 0.2 0.2 0.2 0.3 0.3 0.3 0.3 0.3 1.4Egypt . . . . . . . . . . . . . . . . . . . . . . . . . . 0.9 0.7 0.7 0.5 0.5 0.6 0.6 0.6 -0.7Equatorial Guniea . . . . . . . . . . . . . . . . 0.0 0.4 0.4 0.3 0.3 0.3 0.3 0.3 -1.0Gabon . . . . . . . . . . . . . . . . . . . . . . . . . 0.3 0.2 0.2 0.2 0.2 0.2 0.1 0.1 -2.6Sao Tome and Principe. . . . . . . . . . . . 0.0 0.0 0.0 0.0 0.0 0.0 0.0 0.0 —Sudan . . . . . . . . . . . . . . . . . . . . . . . . . 0.0 0.4 0.5 0.6 0.5 0.5 0.5 0.6 1.7Other . . . . . . . . . . . . . . . . . . . . . . . . . . 0.3 0.3 0.3 0.4 0.4 0.4 0.3 0.3 0.0
Central and South America . . . . . . . . 2.0 3.7 3.7 4.0 4.4 5.1 5.5 6.0 2.0Brazil . . . . . . . . . . . . . . . . . . . . . . . . . . 0.7 1.9 1.9 2.2 2.9 3.7 4.0 4.2 3.5Argentina. . . . . . . . . . . . . . . . . . . . . . . 0.5 0.8 0.8 0.7 0.5 0.4 0.3 0.3 -3.7Colombia . . . . . . . . . . . . . . . . . . . . . . . 0.5 0.5 0.5 0.5 0.4 0.4 0.3 0.3 -2.4Peru. . . . . . . . . . . . . . . . . . . . . . . . . . . 0.1 0.1 0.1 0.1 0.2 0.2 0.3 0.3 3.8Trinidad and Tobago . . . . . . . . . . . . . . 0.1 0.2 0.2 0.2 0.2 0.1 0.1 0.1 -1.6Other . . . . . . . . . . . . . . . . . . . . . . . . . . 0.1 0.2 0.2 0.2 0.2 0.3 0.5 0.7 5.8
Total World . . . . . . . . . . . . . . . . . . . . . . . 65.7 81.5 81.1 81.1 81.1 82.4 83.0 84.1 0.1
OPEC Share of World Production. . . . . . . 36% 42% 42% 43% 45% 45% 45% 45%Persian Gulf Share of World Production . . 25% 29% 28% 29% 31% 31% 31% 32%
Note: Conventional liquids include crude oil and lease condensate, natural gas plant liquids, and refinery gain.Sources: History: Energy Information Administration (EIA), Office of Energy Markets and End Use. Projections: EIA, Generate
World Oil Balance Model (2009).

Table G15. World Unconventional Liquids Production by Region and Country, Low Economic Growth Case,1990-2030(Million Barrels per Day)
Appendix G
244 Energy Information Administration / International Energy Outlook 2009
Region/Country
History (Estimates) Projections Average AnnualPercent Change,
2006-20301990 2006 2007 2010 2015 2020 2025 2030
OPECa . . . . . . . . . . . . . . . . . . . . . . . . . . . 0.0 0.7 0.7 0.7 0.8 1.1 1.3 1.5 3.4Biofuels . . . . . . . . . . . . . . . . . . . . . . . . . . 0.0 0.0 0.0 0.0 0.0 0.0 0.0 0.0 —Extra-Heavy Oil (Venezuela). . . . . . . . . . 0.0 0.6 0.6 0.7 0.7 0.8 1.0 1.2 2.9Coal-to-Liquids . . . . . . . . . . . . . . . . . . . . 0.0 0.0 0.0 0.0 0.0 0.0 0.0 0.0 —Gas-to-Liquids (primarily Qatar) . . . . . . . 0.0 0.0 0.0 0.0 0.1 0.2 0.3 0.3 18.3
Non-OPEC . . . . . . . . . . . . . . . . . . . . . . . . 0.7 2.4 3.0 4.4 6.4 8.1 10.2 11.9 6.9OECD . . . . . . . . . . . . . . . . . . . . . . . . . . . 0.5 1.9 2.3 3.5 5.0 6.0 7.2 8.0 6.3Biofuels . . . . . . . . . . . . . . . . . . . . . . . . . 0.0 0.5 0.6 1.2 1.7 2.1 2.7 2.9 8.0Oil Sands/Bitumen (Canada) . . . . . . . . 0.4 1.2 1.4 1.9 2.8 3.2 3.7 4.1 5.2Extra-Heavy Oil (Mexico) . . . . . . . . . . . 0.0 0.0 0.0 0.0 0.0 0.0 0.1 0.1 14.3Coal-to-Liquids . . . . . . . . . . . . . . . . . . . 0.0 0.0 0.0 0.0 0.1 0.1 0.2 0.3 26.0Gas-to-Liquids. . . . . . . . . . . . . . . . . . . . 0.0 0.0 0.0 0.0 0.0 0.0 0.0 0.0 —Shale Oil . . . . . . . . . . . . . . . . . . . . . . . . 0.0 0.0 0.0 0.0 0.0 0.0 0.1 0.1 —
Non-OECD . . . . . . . . . . . . . . . . . . . . . . . 0.3 0.5 0.7 0.9 1.4 2.2 3.0 3.8 8.7Biofuels . . . . . . . . . . . . . . . . . . . . . . . . . 0.2 0.3 0.4 0.7 1.2 1.7 2.3 2.9 9.2Extra-Heavy Oil . . . . . . . . . . . . . . . . . . . 0.0 0.0 0.0 0.0 0.0 0.0 0.0 0.0 —Coal-to-Liquids . . . . . . . . . . . . . . . . . . . 0.1 0.1 0.2 0.2 0.2 0.4 0.6 0.9 7.8Gas-to-Liquids. . . . . . . . . . . . . . . . . . . . 0.0 0.0 0.0 0.0 0.1 0.1 0.1 0.1 —Shale Oil . . . . . . . . . . . . . . . . . . . . . . . . 0.0 0.0 0.0 0.0 0.0 0.0 0.0 0.0 0.5
WorldBiofuels . . . . . . . . . . . . . . . . . . . . . . . . . . 0.2 0.8 1.1 1.9 2.8 3.8 5.0 5.8 8.6Oil Sands/Bitumen . . . . . . . . . . . . . . . . . 0.4 1.2 1.4 1.9 2.8 3.2 3.7 4.1 5.2Extra-Heavy Oil . . . . . . . . . . . . . . . . . . . . 0.0 0.6 0.6 0.7 0.7 0.9 1.0 1.3 3.1Coal-to-Liquids . . . . . . . . . . . . . . . . . . . . 0.1 0.1 0.2 0.2 0.3 0.5 0.8 1.1 8.9Gas-to-Liquids. . . . . . . . . . . . . . . . . . . . . 0.0 0.0 0.1 0.1 0.2 0.3 0.3 0.3 19.3Shale Oil . . . . . . . . . . . . . . . . . . . . . . . . . 0.0 0.0 0.0 0.0 0.0 0.0 0.1 0.2 13.9
World Total . . . . . . . . . . . . . . . . . . . . . . . 0.8 3.1 3.7 5.0 7.3 9.2 11.5 13.4 6.3
Selected Country HighlightsBiofuelsBrazil . . . . . . . . . . . . . . . . . . . . . . . . . . . 0.2 0.3 0.3 0.4 0.6 0.8 0.9 1.0 5.5China. . . . . . . . . . . . . . . . . . . . . . . . . . . 0.0 0.0 0.0 0.1 0.2 0.3 0.4 0.5 12.8India . . . . . . . . . . . . . . . . . . . . . . . . . . . 0.0 0.0 0.0 0.0 0.0 0.1 0.2 0.2 18.5United States. . . . . . . . . . . . . . . . . . . . . 0.0 0.3 0.5 0.9 1.2 1.4 1.8 1.9 7.4
Coal-to-LiquidsAustralia and New Zealand . . . . . . . . . . 0.0 0.0 0.0 0.0 0.0 0.0 0.0 0.0 —China. . . . . . . . . . . . . . . . . . . . . . . . . . . 0.0 0.0 0.0 0.0 0.0 0.1 0.3 0.5 —Germany . . . . . . . . . . . . . . . . . . . . . . . . 0.0 0.0 0.0 0.0 0.0 0.0 0.0 0.0 0.3India . . . . . . . . . . . . . . . . . . . . . . . . . . . 0.0 0.0 0.0 0.0 0.0 0.0 0.1 0.1 —South Africa. . . . . . . . . . . . . . . . . . . . . . 0.1 0.1 0.2 0.2 0.2 0.3 0.3 0.3 2.6United States. . . . . . . . . . . . . . . . . . . . . 0.0 0.0 0.0 0.0 0.1 0.1 0.2 0.3 —
Gas-to-LiquidsQatar . . . . . . . . . . . . . . . . . . . . . . . . . . . 0.0 0.0 0.0 0.0 0.1 0.2 0.2 0.2 17.1South Africa. . . . . . . . . . . . . . . . . . . . . . 0.0 0.0 0.0 0.0 0.1 0.1 0.1 0.1 —
aOPEC = Organization of the Petroleum Exporting Countries (OPEC-12).Sources: History: Energy Information Administration (EIA), Office of Energy Markets and End Use. Projections: EIA, Generate
World Oil Balance Model (2009).

Appendix H
Reference Case Projections forElectricity Capacity and Generation by Fuel


Table H1. World Total Installed Generating Capacity by Region and Country, 2006-2030(Gigawatts)
Reference Case Electricity Capacity and Generation Projections
Energy Information Administration / International Energy Outlook 2009 247
Region/Country
History Projections Average AnnualPercent Change,
2006-20302006 2010 2015 2020 2025 2030
OECDOECD North America . . . . . . . . . . . 1,132 1,209 1,231 1,284 1,367 1,453 1.0
United Statesa. . . . . . . . . . . . . . . . . 959 1,021 1,024 1,061 1,130 1,201 0.9Canada . . . . . . . . . . . . . . . . . . . . . . 123 133 146 156 163 170 1.4Mexico. . . . . . . . . . . . . . . . . . . . . . . 51 55 61 68 74 81 1.9
OECD Europe . . . . . . . . . . . . . . . . . 754 838 925 978 1,039 1,067 1.5OECD Asia . . . . . . . . . . . . . . . . . . . . 374 386 410 420 428 436 0.6Japan . . . . . . . . . . . . . . . . . . . . . . . 251 253 259 259 257 255 0.1South Korea . . . . . . . . . . . . . . . . . . 64 70 80 87 94 102 1.9Australia/New Zealand . . . . . . . . . . 58 63 71 74 77 79 1.3Total OECD . . . . . . . . . . . . . . . . . 2,261 2,433 2,566 2,682 2,834 2,956 1.1
Non-OECDNon-OECD Europe and Eurasia. . . 400 430 463 486 502 515 1.1Russia . . . . . . . . . . . . . . . . . . . . . . . 218 241 264 280 291 300 1.3Other . . . . . . . . . . . . . . . . . . . . . . . . 182 189 199 206 211 215 0.7
Non-OECD Asia. . . . . . . . . . . . . . . . 870 1,210 1,407 1,674 1,942 2,224 4.0China. . . . . . . . . . . . . . . . . . . . . . . . 518 801 924 1,116 1,310 1,510 4.6India . . . . . . . . . . . . . . . . . . . . . . . . 144 177 213 247 278 310 3.3Other Non-OECD Asia . . . . . . . . . . 209 231 270 311 354 404 2.8
Middle East . . . . . . . . . . . . . . . . . . . 145 156 167 179 192 208 1.5Africa . . . . . . . . . . . . . . . . . . . . . . . . 110 123 139 154 169 182 2.1Central and South America . . . . . . 220 241 278 315 346 366 2.1Brazil . . . . . . . . . . . . . . . . . . . . . . . . 93 108 132 154 177 189 3.0Other Central and South America. . 127 134 146 161 169 177 1.4Total Non-OECD . . . . . . . . . . . . . 1,746 2,160 2,453 2,808 3,151 3,496 2.9
Total World . . . . . . . . . . . . . . . . . . . . 4,006 4,593 5,019 5,490 5,985 6,452 2.0aIncludes the 50 States and the District of Columbia.Note: Totals may not equal sum of components due to independent rounding.Sources: History: Derived from Energy Information Administration (EIA), International Energy Annual 2006 (June-December
2008), web site www.eia.doe.gov/iea. Projections: EIA, Annual Energy Outlook 2009, DOE/EIA-0383(2009) (Washington, DC,March 2009), AEO2009 National Energy Modeling System, run AEO2009.D120908A, web site www.eia.doe.gov/oiaf/aeo; andWorld Energy Projections Plus (2009).

Table H2. World Installed Liquids-Fired Generating Capacity by Region and Country, 2006-2030(Gigawatts)
Appendix H
248 Energy Information Administration / International Energy Outlook 2009
Region/Country
History Projections Average AnnualPercent Change,
2006-20302006 2010 2015 2020 2025 2030
OECDOECD North America . . . . . . . . . . . 140 140 124 123 122 120 -0.6United Statesa. . . . . . . . . . . . . . . . . 121 121 104 104 104 103 -0.7Canada . . . . . . . . . . . . . . . . . . . . . . 5 5 5 5 5 5 -0.6Mexico. . . . . . . . . . . . . . . . . . . . . . . 14 14 14 13 13 12 -0.5
OECD Europe . . . . . . . . . . . . . . . . . 54 54 54 51 49 47 -0.6OECD Asia . . . . . . . . . . . . . . . . . . . . 64 65 65 62 59 56 -0.6Japan . . . . . . . . . . . . . . . . . . . . . . . 57 57 57 55 52 50 -0.6South Korea . . . . . . . . . . . . . . . . . . 6 6 6 6 5 5 -0.5Australia/New Zealand . . . . . . . . . . 1 1 1 1 1 1 -0.4Total OECD . . . . . . . . . . . . . . . . . 258 259 243 236 230 223 -0.6
Non-OECDNon-OECD Europe and Eurasia. . . 29 30 30 28 27 26 -0.5Russia . . . . . . . . . . . . . . . . . . . . . . . 9 9 9 9 8 8 -0.5Other . . . . . . . . . . . . . . . . . . . . . . . . 21 21 21 20 19 18 -0.6
Non-OECD Asia. . . . . . . . . . . . . . . . 57 59 59 56 54 52 -0.4China. . . . . . . . . . . . . . . . . . . . . . . . 15 16 16 16 15 15 -0.2India . . . . . . . . . . . . . . . . . . . . . . . . 6 6 6 6 6 5 -0.4Other Non-OECD Asia . . . . . . . . . . 36 36 37 35 33 32 -0.4
Middle East . . . . . . . . . . . . . . . . . . . 43 45 46 44 44 45 0.2Africa . . . . . . . . . . . . . . . . . . . . . . . . 10 14 14 14 13 12 1.0Central and South America . . . . . . 27 26 26 25 24 23 -0.7Brazil . . . . . . . . . . . . . . . . . . . . . . . . 3 3 3 3 3 3 -0.6Other Central and South America. . 24 23 23 22 21 20 -0.7Total Non-OECD . . . . . . . . . . . . . 165 174 175 168 162 158 -0.2
Total World . . . . . . . . . . . . . . . . . . . . 423 433 418 404 392 380 -0.4aIncludes the 50 States and the District of Columbia.Note: Totals may not equal sum of components due to independent rounding.Sources: History: Derived from Energy Information Administration (EIA), International Energy Annual 2006 (June-December
2008), web site www.eia.doe.gov/iea. Projections: EIA, Annual Energy Outlook 2009, DOE/EIA-0383(2009) (Washington, DC,March 2009), AEO2009 National Energy Modeling System, run AEO2009.D120908A, web site www.eia.doe.gov/oiaf/aeo; andWorld Energy Projections Plus (2009).

Table H3. World Installed Natural-Gas-Fired Generating Capacity by Region and Country, 2006-2030(Gigawatts)
Reference Case Electricity Capacity and Generation Projections
Energy Information Administration / International Energy Outlook 2009 249
Region/Country
History Projections Average AnnualPercent Change,
2006-20302006 2010 2015 2020 2025 2030
OECDOECD North America . . . . . . . . . . . 348 379 387 415 476 512 1.6United Statesa. . . . . . . . . . . . . . . . . 322 351 353 375 430 460 1.5Canada . . . . . . . . . . . . . . . . . . . . . . 8 8 8 9 9 9 0.7Mexico. . . . . . . . . . . . . . . . . . . . . . . 18 20 25 31 37 42 3.6
OECD Europe . . . . . . . . . . . . . . . . . 173 191 205 218 227 230 1.2OECD Asia . . . . . . . . . . . . . . . . . . . . 103 105 109 114 115 115 0.5Japan . . . . . . . . . . . . . . . . . . . . . . . 72 72 74 76 75 74 0.1South Korea . . . . . . . . . . . . . . . . . . 18 20 22 23 25 25 1.4Australia/New Zealand . . . . . . . . . . 12 13 13 15 15 16 1.0Total OECD . . . . . . . . . . . . . . . . . 624 675 701 747 818 857 1.3
Non-OECDNon-OECD Europe and Eurasia. . . 144 160 177 187 192 196 1.3Russia . . . . . . . . . . . . . . . . . . . . . . . 97 110 120 127 128 130 1.2Other . . . . . . . . . . . . . . . . . . . . . . . . 47 51 57 61 64 66 1.4
Non-OECD Asia. . . . . . . . . . . . . . . . 121 136 163 192 214 228 2.7China. . . . . . . . . . . . . . . . . . . . . . . . 26 29 35 42 47 49 2.7India . . . . . . . . . . . . . . . . . . . . . . . . 18 24 30 37 42 46 3.9Other Non-OECD Asia . . . . . . . . . . 77 83 98 113 125 134 2.3
Middle East . . . . . . . . . . . . . . . . . . . 88 92 100 109 121 133 1.7Africa . . . . . . . . . . . . . . . . . . . . . . . . 37 40 48 58 65 69 2.6Central and South America . . . . . . 46 54 58 63 70 72 1.9Brazil . . . . . . . . . . . . . . . . . . . . . . . . 9 13 15 17 21 23 4.1Other Central and South America. . 37 41 43 46 48 50 1.2Total Non-OECD . . . . . . . . . . . . . 437 483 546 609 661 699 2.0
Total World . . . . . . . . . . . . . . . . . . . . 1,060 1,158 1,247 1,356 1,479 1,556 1.6aIncludes the 50 States and the District of Columbia.Note: Totals may not equal sum of components due to independent rounding.Sources: History: Derived from Energy Information Administration (EIA), International Energy Annual 2006 (June-December
2008), web site www.eia.doe.gov/iea. Projections: EIA, Annual Energy Outlook 2009, DOE/EIA-0383(2009) (Washington, DC,March 2009), AEO2009 National Energy Modeling System, run AEO2009.D120908A, web site www.eia.doe.gov/oiaf/aeo; andWorld Energy Projections Plus (2009).
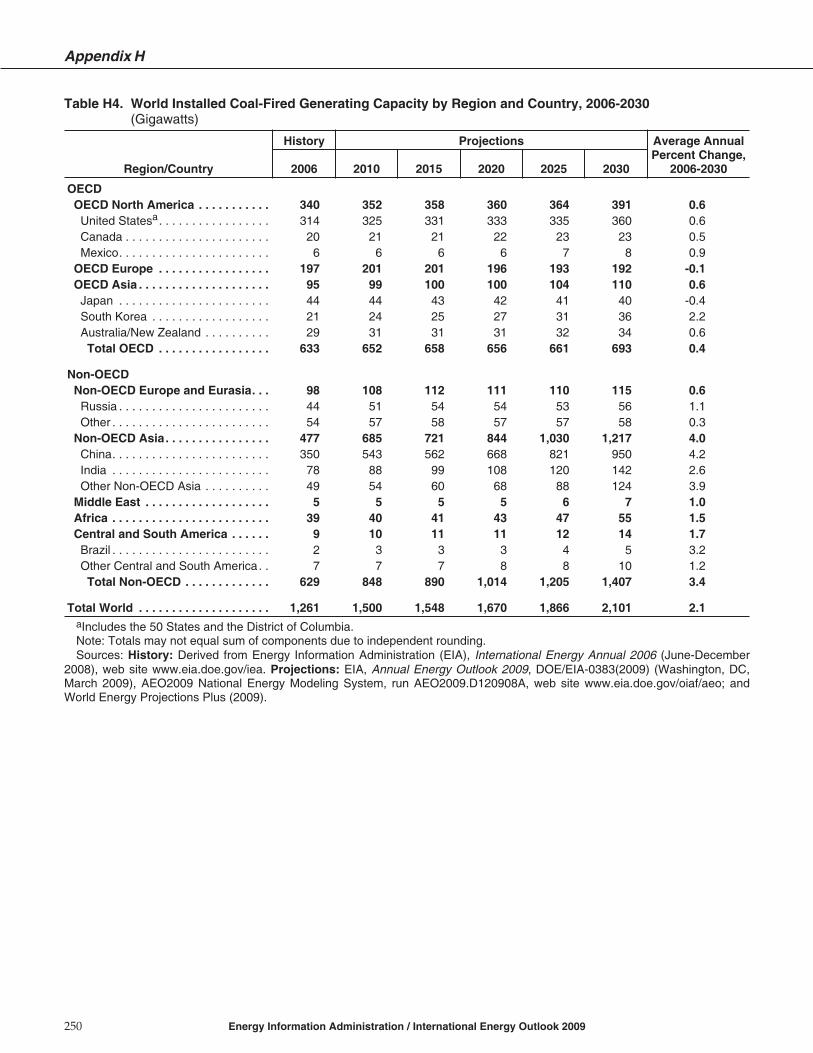
Table H4. World Installed Coal-Fired Generating Capacity by Region and Country, 2006-2030(Gigawatts)
Appendix H
250 Energy Information Administration / International Energy Outlook 2009
Region/Country
History Projections Average AnnualPercent Change,
2006-20302006 2010 2015 2020 2025 2030
OECDOECD North America . . . . . . . . . . . 340 352 358 360 364 391 0.6United Statesa. . . . . . . . . . . . . . . . . 314 325 331 333 335 360 0.6Canada . . . . . . . . . . . . . . . . . . . . . . 20 21 21 22 23 23 0.5Mexico. . . . . . . . . . . . . . . . . . . . . . . 6 6 6 6 7 8 0.9
OECD Europe . . . . . . . . . . . . . . . . . 197 201 201 196 193 192 -0.1OECD Asia . . . . . . . . . . . . . . . . . . . . 95 99 100 100 104 110 0.6Japan . . . . . . . . . . . . . . . . . . . . . . . 44 44 43 42 41 40 -0.4South Korea . . . . . . . . . . . . . . . . . . 21 24 25 27 31 36 2.2Australia/New Zealand . . . . . . . . . . 29 31 31 31 32 34 0.6Total OECD . . . . . . . . . . . . . . . . . 633 652 658 656 661 693 0.4
Non-OECDNon-OECD Europe and Eurasia. . . 98 108 112 111 110 115 0.6Russia . . . . . . . . . . . . . . . . . . . . . . . 44 51 54 54 53 56 1.1Other . . . . . . . . . . . . . . . . . . . . . . . . 54 57 58 57 57 58 0.3
Non-OECD Asia. . . . . . . . . . . . . . . . 477 685 721 844 1,030 1,217 4.0China. . . . . . . . . . . . . . . . . . . . . . . . 350 543 562 668 821 950 4.2India . . . . . . . . . . . . . . . . . . . . . . . . 78 88 99 108 120 142 2.6Other Non-OECD Asia . . . . . . . . . . 49 54 60 68 88 124 3.9
Middle East . . . . . . . . . . . . . . . . . . . 5 5 5 5 6 7 1.0Africa . . . . . . . . . . . . . . . . . . . . . . . . 39 40 41 43 47 55 1.5Central and South America . . . . . . 9 10 11 11 12 14 1.7Brazil . . . . . . . . . . . . . . . . . . . . . . . . 2 3 3 3 4 5 3.2Other Central and South America. . 7 7 7 8 8 10 1.2
Total Non-OECD . . . . . . . . . . . . . 629 848 890 1,014 1,205 1,407 3.4
Total World . . . . . . . . . . . . . . . . . . . . 1,261 1,500 1,548 1,670 1,866 2,101 2.1aIncludes the 50 States and the District of Columbia.Note: Totals may not equal sum of components due to independent rounding.Sources: History: Derived from Energy Information Administration (EIA), International Energy Annual 2006 (June-December
2008), web site www.eia.doe.gov/iea. Projections: EIA, Annual Energy Outlook 2009, DOE/EIA-0383(2009) (Washington, DC,March 2009), AEO2009 National Energy Modeling System, run AEO2009.D120908A, web site www.eia.doe.gov/oiaf/aeo; andWorld Energy Projections Plus (2009).

Table H5. World Installed Nuclear Generating Capacity by Region and Country, 2006-2030(Gigawatts)
Reference Case Electricity Capacity and Generation Projections
Energy Information Administration / International Energy Outlook 2009 251
Region/Country
History Projections Average AnnualPercent Change,
2006-20302006 2010 2015 2020 2025 2030
OECDOECD North America . . . . . . . . . . . 115 118 121 126 127 132 0.6United Statesa. . . . . . . . . . . . . . . . . 100 101 104 108 108 113 0.5Canada . . . . . . . . . . . . . . . . . . . . . . 13 15 15 16 17 18 1.3Mexico. . . . . . . . . . . . . . . . . . . . . . . 1 1 1 1 1 1 0.1
OECD Europe . . . . . . . . . . . . . . . . . 132 130 127 119 121 121 -0.4OECD Asia . . . . . . . . . . . . . . . . . . . . 67 66 74 80 84 88 1.2Japan . . . . . . . . . . . . . . . . . . . . . . . 50 49 52 54 56 58 0.7South Korea . . . . . . . . . . . . . . . . . . 17 17 22 26 28 30 2.4Australia/New Zealand . . . . . . . . . . 0 0 0 0 0 0 —
Total OECD . . . . . . . . . . . . . . . . . 314 314 322 325 331 341 0.3
Non-OECDNon-OECD Europe and Eurasia. . . 42 41 49 59 68 71 2.2Russia . . . . . . . . . . . . . . . . . . . . . . . 23 23 28 35 42 44 2.7Other . . . . . . . . . . . . . . . . . . . . . . . . 19 18 20 24 26 27 1.5
Non-OECD Asia. . . . . . . . . . . . . . . . 16 21 39 60 78 88 7.4China. . . . . . . . . . . . . . . . . . . . . . . . 7 9 22 36 47 54 9.0India . . . . . . . . . . . . . . . . . . . . . . . . 3 5 9 14 18 20 7.7Other Non-OECD Asia . . . . . . . . . . 6 6 8 10 13 14 3.8
Middle East . . . . . . . . . . . . . . . . . . . 0 0 1 2 2 2 —Africa . . . . . . . . . . . . . . . . . . . . . . . . 2 2 2 2 3 3 2.0Central and South America . . . . . . 3 3 4 5 5 5 1.7Brazil . . . . . . . . . . . . . . . . . . . . . . . . 2 2 3 3 3 3 1.7Other Central and South America. . 1 1 1 2 2 2 1.7
Total Non-OECD . . . . . . . . . . . . . 63 67 95 128 156 168 4.2
Total World . . . . . . . . . . . . . . . . . . . . 377 381 416 453 487 509 1.3aIncludes the 50 States and the District of Columbia.Note: Totals may not equal sum of components due to independent rounding.Sources: History: Energy Information Administration (EIA), International Energy Annual 2006 (June-December 2008), web site
www.eia.doe.gov/iea. Projections: EIA, Annual Energy Outlook 2009, DOE/EIA-0383(2009) (Washington, DC, March 2009),AEO2009 National Energy Modeling System, run AEO2009.D120908A, web site www.eia.doe.gov/oiaf/aeo; and World Energy Pro-jections Plus (2009).

Table H6. World Installed Hydroelectric Generating Capacity by Region and Country, 2006-2030(Gigawatts)
Appendix H
252 Energy Information Administration / International Energy Outlook 2009
Region/Country
History Projections Average AnnualPercent Change,
2006-20302006 2010 2015 2020 2025 2030
OECDOECD North America . . . . . . . . . . . 160 164 169 175 178 180 0.5United Statesa. . . . . . . . . . . . . . . . . 77 77 78 78 78 78 0.0Canada . . . . . . . . . . . . . . . . . . . . . . 72 75 80 85 86 87 0.8Mexico. . . . . . . . . . . . . . . . . . . . . . . 11 11 11 13 14 15 1.3
OECD Europe . . . . . . . . . . . . . . . . . 146 152 156 163 170 173 0.7OECD Asia . . . . . . . . . . . . . . . . . . . . 37 37 38 38 38 38 0.1Japan . . . . . . . . . . . . . . . . . . . . . . . 22 22 23 23 23 23 0.2South Korea . . . . . . . . . . . . . . . . . . 2 2 2 2 2 2 0.0Australia/New Zealand . . . . . . . . . . 13 13 13 13 13 13 0.1Total OECD . . . . . . . . . . . . . . . . . 342 353 363 376 386 391 0.6
Non-OECDNon-OECD Europe and Eurasia. . . 87 90 93 98 104 107 0.8Russia . . . . . . . . . . . . . . . . . . . . . . . 46 48 51 55 59 61 1.2Other . . . . . . . . . . . . . . . . . . . . . . . . 41 42 42 43 44 45 0.4
Non-OECD Asia. . . . . . . . . . . . . . . . 188 276 381 457 480 493 4.1China. . . . . . . . . . . . . . . . . . . . . . . . 117 186 265 310 315 318 4.2India . . . . . . . . . . . . . . . . . . . . . . . . 32 44 55 68 77 83 4.0Other Non-OECD Asia . . . . . . . . . . 38 47 62 79 87 93 3.8
Middle East . . . . . . . . . . . . . . . . . . . 9 13 13 15 17 17 2.9Africa . . . . . . . . . . . . . . . . . . . . . . . . 22 25 29 31 33 33 1.7Central and South America . . . . . . 128 139 168 200 225 240 2.6Brazil . . . . . . . . . . . . . . . . . . . . . . . . 71 79 99 118 137 147 3.1Other Central and South America. . 58 60 69 82 87 94 2.0Total Non-OECD . . . . . . . . . . . . . 434 543 685 801 857 891 3.0
Total World . . . . . . . . . . . . . . . . . . . . 776 896 1,047 1,178 1,243 1,283 2.1aIncludes the 50 States and the District of Columbia.Note: Totals may not equal sum of components due to independent rounding.Sources: History: Energy Information Administration (EIA), International Energy Annual 2006 (June-December 2008), web site
www.eia.doe.gov/iea. Projections: EIA, Annual Energy Outlook 2009, DOE/EIA-0383(2009) (Washington, DC, March 2009),AEO2009 National Energy Modeling System, run AEO2009.D120908A, web site www.eia.doe.gov/oiaf/aeo; and World Energy Pro-jections Plus (2009).

Table H7. World Installed Wind-Powered Generating Capacity by Region and Country, 2006-2030(Gigawatts)
Reference Case Electricity Capacity and Generation Projections
Energy Information Administration / International Energy Outlook 2009 253
Region/Country
History Projections Average AnnualPercent Change,
2006-20302006 2010 2015 2020 2025 2030
OECDOECD North America . . . . . . . . . . . 12 37 48 51 61 70 7.6United Statesa. . . . . . . . . . . . . . . . . 11 30 31 33 39 44 5.8Canada . . . . . . . . . . . . . . . . . . . . . . 1 7 16 16 20 24 16.0Mexico. . . . . . . . . . . . . . . . . . . . . . . 0 1 2 2 2 2 —
OECD Europe . . . . . . . . . . . . . . . . . 41 88 149 194 240 263 8.1OECD Asia . . . . . . . . . . . . . . . . . . . . 2 6 12 12 13 14 8.5Japan . . . . . . . . . . . . . . . . . . . . . . . 1 3 3 3 3 3 4.5South Korea . . . . . . . . . . . . . . . . . . 0 0 0 0 0 0 1.9Australia/New Zealand . . . . . . . . . . 1 3 8 9 10 10 11.5Total OECD . . . . . . . . . . . . . . . . . 55 131 209 258 314 346 8.0
Non-OECDNon-OECD Europe and Eurasia. . . 0 1 2 2 2 2 9.6Russia . . . . . . . . . . . . . . . . . . . . . . . 0 0 0 0 0 0 2.9Other . . . . . . . . . . . . . . . . . . . . . . . . 0 1 2 2 2 2 9.8
Non-OECD Asia. . . . . . . . . . . . . . . . 5 23 29 50 72 132 14.3China. . . . . . . . . . . . . . . . . . . . . . . . 1 14 20 40 60 120 23.6India . . . . . . . . . . . . . . . . . . . . . . . . 4 8 9 9 9 9 2.9Other Non-OECD Asia . . . . . . . . . . 0 0 0 2 3 3 14.7
Middle East . . . . . . . . . . . . . . . . . . . 0 1 1 1 1 1 —Africa . . . . . . . . . . . . . . . . . . . . . . . . 0 1 4 4 4 4 12.4Central and South America . . . . . . 0 2 4 4 4 4 14.6Brazil . . . . . . . . . . . . . . . . . . . . . . . . 0 1 3 3 3 3 20.5Other Central and South America. . 0 0 2 2 2 2 11.1Total Non-OECD . . . . . . . . . . . . . 6 27 40 62 83 143 14.2
Total World . . . . . . . . . . . . . . . . . . . . 61 159 249 319 397 490 9.1aIncludes the 50 States and the District of Columbia.Notes: Totals may not equal sum of components due to independent rounding. Numbers for the United States in this table are
based on the published AEO2009 reference case (March 2009). In the updated AEO2009 reference case (April 2009), which incor-porates provisions from the American Recovery and Reinvestment Act of 2009 (ARRA2009) that stimulate increased renewablegeneration, greater use of renewable fuels is projected. As a result, U.S. installed wind-powered generating capacity would be 66gigawatts in 2015 and 68 gigawatts in 2030 in the updated AEO2009 reference case—114 percent higher in 2015 and 54 percenthigher in 2030 than in the earlier projections reported in this table.
Sources: History: Derived from Energy Information Administration (EIA), International Energy Annual 2006 (June-December2008), web site www.eia.doe.gov/iea. Projections: EIA, Annual Energy Outlook 2009, DOE/EIA-0383(2009) (Washington, DC,March 2009), AEO2009 National Energy Modeling System, run AEO2009.D120908A, web site www.eia.doe.gov/oiaf/aeo; andWorld Energy Projections Plus (2009).

Table H8. World Installed Geothermal Generating Capacity by Region and Country, 2006-2030(Gigawatts)
Appendix H
254 Energy Information Administration / International Energy Outlook 2009
Region/Country
History Projections Average AnnualPercent Change,
2006-20302006 2010 2015 2020 2025 2030
OECDOECD North America . . . . . . . . . . . 3 3 4 4 4 4 1.0United Statesa. . . . . . . . . . . . . . . . . 2 3 3 3 3 3 1.1Canada . . . . . . . . . . . . . . . . . . . . . . 0 0 0 0 0 0 —Mexico. . . . . . . . . . . . . . . . . . . . . . . 1 1 1 1 1 1 0.8
OECD Europe . . . . . . . . . . . . . . . . . 1 2 2 2 2 2 1.1OECD Asia . . . . . . . . . . . . . . . . . . . . 1 1 2 2 3 3 4.1Japan . . . . . . . . . . . . . . . . . . . . . . . 1 1 1 1 1 1 0.0South Korea . . . . . . . . . . . . . . . . . . 0 0 0 0 0 0 —Australia/New Zealand . . . . . . . . . . 0 1 1 2 2 2 6.4
Total OECD . . . . . . . . . . . . . . . . . 6 6 7 8 8 8 1.8
Non-OECDNon-OECD Europe and Eurasia. . . 0 0 0 0 0 0 5.0Russia . . . . . . . . . . . . . . . . . . . . . . . 0 0 0 0 0 0 4.5Other . . . . . . . . . . . . . . . . . . . . . . . . 0 0 0 0 0 0 —
Non-OECD Asia. . . . . . . . . . . . . . . . 3 4 5 5 5 5 2.3China. . . . . . . . . . . . . . . . . . . . . . . . 0 0 0 0 0 0 1.7India . . . . . . . . . . . . . . . . . . . . . . . . 0 0 0 0 0 0 —Other Non-OECD Asia . . . . . . . . . . 3 4 5 5 5 5 2.1
Middle East . . . . . . . . . . . . . . . . . . . 0 0 0 0 0 0 —Africa . . . . . . . . . . . . . . . . . . . . . . . . 0 0 0 0 0 0 3.8Central and South America . . . . . . 0 1 1 1 1 1 5.8Brazil . . . . . . . . . . . . . . . . . . . . . . . . 0 0 0 0 0 0 —Other Central and South America. . 0 1 1 1 1 1 5.8
Total Non-OECD . . . . . . . . . . . . . 3 5 6 6 6 7 2.9
Total World . . . . . . . . . . . . . . . . . . . . 9 11 14 14 15 15 2.2aIncludes the 50 States and the District of Columbia.Notes: Totals may not equal sum of components due to independent rounding. Numbers for the United States in this table are
based on the published AEO2009 reference case (March 2009). In the updated AEO2009 reference case (April 2009), which incor-porates provisions from the American Recovery and Reinvestment Act of 2009 (ARRA2009) that stimulate increased renewablegeneration, greater use of renewable fuels is projected. As a result, U.S. installed geothermal generating capacity would be 3.0gigawatts in 2015 and 3.3 gigawatts in 2030 in the updated AEO2009 reference case—16 percent higher in 2015 and 10 percenthigher in 2030 than in the earlier projections reported in this table.
Sources: History: Derived from Energy Information Administration (EIA), International Energy Annual 2006 (June-December2008), web site www.eia.doe.gov/iea. Projections: EIA, Annual Energy Outlook 2009, DOE/EIA-0383(2009) (Washington, DC,March 2009), AEO2009 National Energy Modeling System, run AEO2009.D120908A, web site www.eia.doe.gov/oiaf/aeo; andWorld Energy Projections Plus (2009).

Table H9. World Installed Other Renewable Generating Capacity by Region and Country, 2006-2030(Gigawatts)
Reference Case Electricity Capacity and Generation Projections
Energy Information Administration / International Energy Outlook 2009 255
Region/Country
History Projections Average AnnualPercent Change,
2006-20302006 2010 2015 2020 2025 2030
OECDOECD North America . . . . . . . . . . . 12 15 21 30 36 43 5.4United Statesa. . . . . . . . . . . . . . . . . 11 14 20 27 32 40 5.4Canada . . . . . . . . . . . . . . . . . . . . . . 1 1 1 3 4 4 4.5Mexico. . . . . . . . . . . . . . . . . . . . . . . 0 0 0 0 0 0 6.9
OECD Europe . . . . . . . . . . . . . . . . . 10 21 31 35 39 40 5.9OECD Asia . . . . . . . . . . . . . . . . . . . . 5 7 12 12 12 12 3.5Japan . . . . . . . . . . . . . . . . . . . . . . . 4 5 6 6 6 6 1.7South Korea . . . . . . . . . . . . . . . . . . 0 1 3 3 3 3 16.9Australia/New Zealand . . . . . . . . . . 1 1 2 2 2 2 3.9
Total OECD . . . . . . . . . . . . . . . . . 28 43 64 77 86 96 5.3
Non-OECDNon-OECD Europe and Eurasia. . . 0 0 0 0 0 0 —Russia . . . . . . . . . . . . . . . . . . . . . . . 0 0 0 0 0 0 —Other . . . . . . . . . . . . . . . . . . . . . . . . 0 0 0 0 0 0 —
Non-OECD Asia. . . . . . . . . . . . . . . . 3 6 9 9 9 9 4.9China. . . . . . . . . . . . . . . . . . . . . . . . 1 4 4 4 4 4 5.7India . . . . . . . . . . . . . . . . . . . . . . . . 2 2 5 5 5 5 4.4Other Non-OECD Asia . . . . . . . . . . 0 0 0 0 0 0 5.9
Middle East . . . . . . . . . . . . . . . . . . . 0 0 1 2 2 3 —Africa . . . . . . . . . . . . . . . . . . . . . . . . 0 0 0 2 4 5 —Central and South America . . . . . . 6 6 6 6 6 6 0.1Brazil . . . . . . . . . . . . . . . . . . . . . . . . 6 6 6 6 6 6 0.0Other Central and South America. . 0 0 0 0 0 0 1.7
Total Non-OECD . . . . . . . . . . . . . 9 13 16 19 22 23 3.9
Total World . . . . . . . . . . . . . . . . . . . . 37 56 80 96 108 119 5.0aIncludes the 50 States and the District of Columbia.Notes: Totals may not equal sum of components due to independent rounding. Numbers for the United States in this table are
based on the published AEO2009 reference case (March 2009). In the updated AEO2009 reference case (April 2009), which incor-porates provisions from the American Recovery and Reinvestment Act of 2009 (ARRA2009) that stimulate increased renewablegeneration, greater use of renewable fuels is projected. Although projections for U.S. solar and municipal waste installed capacityare higher in the updated AEO2009 reference case, they are offset by lower projections for U.S. installed wood and other biomassgenerating capacity; as a result, U.S. “other renewable generating capacity” would be 40 gigawatts in 2030 in both the published andupdated AEO2009 reference cases.
Sources: History: Derived from Energy Information Administration (EIA), International Energy Annual 2006 (June-December2008), web site www.eia.doe.gov/iea. Projections: EIA, Annual Energy Outlook 2009, DOE/EIA-0383(2009) (Washington, DC,March 2009), AEO2009 National Energy Modeling System, run AEO2009.D120908A, web site www.eia.doe.gov/oiaf/aeo; andWorld Energy Projections Plus (2009).

Table H10. World Total Net Electricity Generation From Central Producers by Region and Country,2006-2030(Billion Kilowatthours)
Appendix H
256 Energy Information Administration / International Energy Outlook 2009
Region/Country
History Projections Average AnnualPercent Change,
2006-20302006 2010 2015 2020 2025 2030
OECDOECD North America . . . . . . . . . . . 4,889 5,095 5,356 5,694 6,052 6,420 1.1
United Statesa. . . . . . . . . . . . . . . . . 4,063 4,217 4,381 4,618 4,879 5,153 1.0Canada . . . . . . . . . . . . . . . . . . . . . . 601 628 680 737 788 831 1.4Mexico. . . . . . . . . . . . . . . . . . . . . . . 225 250 295 339 385 436 2.8
OECD Europe . . . . . . . . . . . . . . . . . 3,356 3,681 3,967 4,205 4,403 4,569 1.3OECD Asia . . . . . . . . . . . . . . . . . . . . 1,691 1,782 1,928 2,038 2,137 2,233 1.2Japan . . . . . . . . . . . . . . . . . . . . . . . 1,038 1,063 1,115 1,148 1,168 1,187 0.6South Korea . . . . . . . . . . . . . . . . . . 376 412 477 534 591 650 2.3Australia/New Zealand . . . . . . . . . . 277 308 335 357 377 397 1.5Total OECD . . . . . . . . . . . . . . . . . 9,936 10,558 11,251 11,937 12,592 13,223 1.2
Non-OECDNon-OECD Europe and Eurasia. . . 1,522 1,737 1,980 2,178 2,320 2,445 2.0Russia . . . . . . . . . . . . . . . . . . . . . . . 913 1,070 1,234 1,365 1,458 1,540 2.2Other . . . . . . . . . . . . . . . . . . . . . . . . 609 667 746 813 862 905 1.7
Non-OECD Asia. . . . . . . . . . . . . . . . 4,391 5,886 7,295 8,896 10,642 12,419 4.4China. . . . . . . . . . . . . . . . . . . . . . . . 2,773 3,968 4,944 6,079 7,338 8,547 4.8India . . . . . . . . . . . . . . . . . . . . . . . . 691 863 1,067 1,276 1,467 1,687 3.8Other Non-OECD Asia . . . . . . . . . . 927 1,055 1,284 1,542 1,837 2,186 3.6
Middle East . . . . . . . . . . . . . . . . . . . 646 711 791 879 980 1,099 2.2Africa . . . . . . . . . . . . . . . . . . . . . . . . 543 607 703 802 902 996 2.6Central and South America . . . . . . 946 1,084 1,209 1,339 1,480 1,601 2.2
Brazil . . . . . . . . . . . . . . . . . . . . . . . . 413 505 594 686 789 874 3.2Other Central and South America. . 533 579 614 653 691 727 1.3Total Non-OECD . . . . . . . . . . . . . 8,047 10,026 11,978 14,094 16,323 18,559 3.5
Total World . . . . . . . . . . . . . . . . . . . . 17,982 20,584 23,228 26,031 28,915 31,782 2.4aIncludes the 50 States and the District of Columbia.Note: Totals may not equal sum of components due to independent rounding.Sources: History: Derived from Energy Information Administration (EIA), International Energy Annual 2006 (June-December
2008), web site www.eia.doe.gov/iea. Projections: EIA, Annual Energy Outlook 2009, DOE/EIA-0383(2009) (Washington, DC,March 2009), AEO2009 National Energy Modeling System, run AEO2009.D120908A, web site www.eia.doe.gov/oiaf/aeo; andWorld Energy Projections Plus (2009).

Table H11. World Net Liquids-Fired Electricity Generation From Central Producers by Region and Country,2006-2030(Billion Kilowatthours)
Reference Case Electricity Capacity and Generation Projections
Energy Information Administration / International Energy Outlook 2009 257
Region/Country
History Projections Average AnnualPercent Change,
2006-20302006 2010 2015 2020 2025 2030
OECDOECD North America . . . . . . . . . . . 136 129 130 127 125 124 -0.4United Statesa. . . . . . . . . . . . . . . . . 64 56 57 58 59 60 -0.2Canada . . . . . . . . . . . . . . . . . . . . . . 16 16 16 15 15 14 -0.6Mexico. . . . . . . . . . . . . . . . . . . . . . . 56 56 56 54 51 49 -0.5
OECD Europe . . . . . . . . . . . . . . . . . 69 70 70 67 64 61 -0.5OECD Asia . . . . . . . . . . . . . . . . . . . . 99 100 100 96 92 88 -0.5Japan . . . . . . . . . . . . . . . . . . . . . . . 80 81 81 78 75 72 -0.5South Korea . . . . . . . . . . . . . . . . . . 17 18 18 17 16 15 -0.5Australia/New Zealand . . . . . . . . . . 1 1 1 1 1 1 0.4
Total OECD . . . . . . . . . . . . . . . . . 303 298 300 289 280 273 -0.4
Non-OECDNon-OECD Europe and Eurasia. . . 52 55 56 53 51 49 -0.3Russia . . . . . . . . . . . . . . . . . . . . . . . 26 27 27 26 25 24 -0.3Other . . . . . . . . . . . . . . . . . . . . . . . . 26 28 28 27 26 25 -0.3
Non-OECD Asia. . . . . . . . . . . . . . . . 158 168 170 163 157 152 -0.2China. . . . . . . . . . . . . . . . . . . . . . . . 46 52 53 51 49 47 0.1India . . . . . . . . . . . . . . . . . . . . . . . . 19 20 20 19 18 17 -0.4Other Non-OECD Asia . . . . . . . . . . 93 97 97 93 90 87 -0.3
Middle East . . . . . . . . . . . . . . . . . . . 228 243 248 243 244 254 0.5Africa . . . . . . . . . . . . . . . . . . . . . . . . 58 84 84 80 77 73 1.0Central and South America . . . . . . 78 76 76 73 69 66 -0.7Brazil . . . . . . . . . . . . . . . . . . . . . . . . 5 5 5 5 5 5 -0.6Other Central and South America. . 72 71 71 67 64 61 -0.7Total Non-OECD . . . . . . . . . . . . . 574 628 634 612 598 593 0.1
Total World . . . . . . . . . . . . . . . . . . . . 877 926 934 901 878 866 -0.1aIncludes the 50 States and the District of Columbia.Note: Totals may not equal sum of components due to independent rounding.Sources: History: Derived from Energy Information Administration (EIA), International Energy Annual 2006 (June-December
2008), web site www.eia.doe.gov/iea. Projections: EIA, Annual Energy Outlook 2009, DOE/EIA-0383(2009) (Washington, DC,March 2009), AEO2009 National Energy Modeling System, run AEO2009.D120908A, web site www.eia.doe.gov/oiaf/aeo; andWorld Energy Projections Plus (2009).

Table H12. World Net Natural-Gas-Fired Electricity Generation From Central Producers by Region andCountry, 2006-2030(Billion Kilowatthours)
Appendix H
258 Energy Information Administration / International Energy Outlook 2009
Region/Country
History Projections Average AnnualPercent Change,
2006-20302006 2010 2015 2020 2025 2030
OECDOECD North America . . . . . . . . . . . 913 940 981 1,114 1,313 1,320 1.5
United Statesa. . . . . . . . . . . . . . . . . 812 814 815 898 1,050 1,012 0.9Canada . . . . . . . . . . . . . . . . . . . . . . 22 25 24 33 38 39 2.5Mexico. . . . . . . . . . . . . . . . . . . . . . . 80 100 141 183 225 268 5.2
OECD Europe . . . . . . . . . . . . . . . . . 729 878 1,001 1,116 1,200 1,244 2.3OECD Asia . . . . . . . . . . . . . . . . . . . . 360 387 434 485 512 526 1.6Japan . . . . . . . . . . . . . . . . . . . . . . . 265 270 297 323 331 334 1.0South Korea . . . . . . . . . . . . . . . . . . 60 73 89 102 115 122 3.0Australia/New Zealand . . . . . . . . . . 35 45 47 60 66 70 2.9Total OECD . . . . . . . . . . . . . . . . . 2,002 2,204 2,415 2,715 3,025 3,089 1.8
Non-OECDNon-OECD Europe and Eurasia. . . 526 656 791 891 943 993 2.7Russia . . . . . . . . . . . . . . . . . . . . . . . 359 458 542 605 627 658 2.6Other . . . . . . . . . . . . . . . . . . . . . . . . 166 198 249 287 317 335 3.0
Non-OECD Asia. . . . . . . . . . . . . . . . 430 542 755 970 1,132 1,232 4.5China. . . . . . . . . . . . . . . . . . . . . . . . 59 79 125 168 199 206 5.3India . . . . . . . . . . . . . . . . . . . . . . . . 43 83 135 190 230 255 7.7Other Non-OECD Asia . . . . . . . . . . 328 380 496 611 704 771 3.6
Middle East . . . . . . . . . . . . . . . . . . . 365 403 470 549 641 741 3.0Africa . . . . . . . . . . . . . . . . . . . . . . . . 134 159 222 297 356 391 4.6Central and South America . . . . . . 134 193 220 256 303 322 3.7Brazil . . . . . . . . . . . . . . . . . . . . . . . . 24 55 69 86 115 124 7.1Other Central and South America. . 110 138 151 170 189 198 2.5Total Non-OECD . . . . . . . . . . . . . 1,589 1,953 2,457 2,963 3,375 3,680 3.6
Total World . . . . . . . . . . . . . . . . . . . . 3,591 4,157 4,872 5,678 6,401 6,769 2.7aIncludes the 50 States and the District of Columbia.Note: Totals may not equal sum of components due to independent rounding.Sources: History: Derived from Energy Information Administration (EIA), International Energy Annual 2006 (June-December
2008), web site www.eia.doe.gov/iea. Projections: EIA, Annual Energy Outlook 2009, DOE/EIA-0383(2009) (Washington, DC,March 2009), AEO2009 National Energy Modeling System, run AEO2009.D120908A, web site www.eia.doe.gov/oiaf/aeo; andWorld Energy Projections Plus (2009).

Table H13. World Net Coal-Fired Electricity Generation From Central Producers by Region and Country,2006-2030(Billion Kilowatthours)
Reference Case Electricity Capacity and Generation Projections
Energy Information Administration / International Energy Outlook 2009 259
Region/Country
History Projections Average AnnualPercent Change,
2006-20302006 2010 2015 2020 2025 2030
OECDOECD North America . . . . . . . . . . . 2,138 2,207 2,272 2,313 2,358 2,594 0.8
United Statesa. . . . . . . . . . . . . . . . . 1,992 2,057 2,121 2,156 2,191 2,415 0.8Canada . . . . . . . . . . . . . . . . . . . . . . 106 111 111 117 125 128 0.8Mexico. . . . . . . . . . . . . . . . . . . . . . . 40 39 39 40 43 51 1.1
OECD Europe . . . . . . . . . . . . . . . . . 967 1,000 1,003 982 977 987 0.1OECD Asia . . . . . . . . . . . . . . . . . . . . 641 669 676 680 711 753 0.7Japan . . . . . . . . . . . . . . . . . . . . . . . 294 292 288 279 272 266 -0.4South Korea . . . . . . . . . . . . . . . . . . 153 174 183 192 222 256 2.2Australia/New Zealand . . . . . . . . . . 194 204 204 208 217 231 0.7Total OECD . . . . . . . . . . . . . . . . . 3,746 3,877 3,950 3,975 4,046 4,334 0.6
Non-OECDNon-OECD Europe and Eurasia. . . 372 437 470 472 479 524 1.4Russia . . . . . . . . . . . . . . . . . . . . . . . 207 253 276 277 277 301 1.6Other . . . . . . . . . . . . . . . . . . . . . . . . 165 185 194 195 203 223 1.3
Non-OECD Asia. . . . . . . . . . . . . . . . 2,987 4,014 4,707 5,585 6,904 8,230 4.3China. . . . . . . . . . . . . . . . . . . . . . . . 2,178 3,092 3,670 4,426 5,513 6,427 4.6India . . . . . . . . . . . . . . . . . . . . . . . . 489 564 639 707 795 951 2.8Other Non-OECD Asia . . . . . . . . . . 320 358 398 451 597 852 4.2
Middle East . . . . . . . . . . . . . . . . . . . 30 30 31 31 34 41 1.3Africa . . . . . . . . . . . . . . . . . . . . . . . . 247 253 263 277 309 365 1.6Central and South America . . . . . . 49 56 59 61 69 85 2.4Brazil . . . . . . . . . . . . . . . . . . . . . . . . 6 12 14 15 19 25 6.2Other Central and South America. . 43 44 45 46 49 60 1.4Total Non-OECD . . . . . . . . . . . . . 3,684 4,791 5,530 6,427 7,795 9,245 3.9
Total World . . . . . . . . . . . . . . . . . . . . 7,430 8,668 9,480 10,401 11,841 13,579 2.5aIncludes the 50 States and the District of Columbia.Note: Totals may not equal sum of components due to independent rounding.Sources: History: Derived from Energy Information Administration (EIA), International Energy Annual 2006 (June-December
2008), web site www.eia.doe.gov/iea. Projections: EIA, Annual Energy Outlook 2009, DOE/EIA-0383(2009) (Washington, DC,March 2009), AEO2009 National Energy Modeling System, run AEO2009.D120908A, web site www.eia.doe.gov/oiaf/aeo; andWorld Energy Projections Plus (2009).

Table H14. World Net Nuclear Electricity Generation From Central Producers by Region and Country,2006-2030(Billion Kilowatthours)
Appendix H
260 Energy Information Administration / International Energy Outlook 2009
Region/Country
History Projections Average AnnualPercent Change,
2006-20302006 2010 2015 2020 2025 2030
OECDOECD North America . . . . . . . . . . . 891 928 955 992 1,004 1,053 0.7United Statesa. . . . . . . . . . . . . . . . . 787 809 831 862 867 907 0.6Canada . . . . . . . . . . . . . . . . . . . . . . 93 108 113 120 127 135 1.5Mexico. . . . . . . . . . . . . . . . . . . . . . . 10 11 11 11 11 11 0.1
OECD Europe . . . . . . . . . . . . . . . . . 929 922 915 905 896 902 -0.1OECD Asia . . . . . . . . . . . . . . . . . . . . 430 441 494 546 583 624 1.6Japan . . . . . . . . . . . . . . . . . . . . . . . 288 299 319 336 358 381 1.2South Korea . . . . . . . . . . . . . . . . . . 141 142 175 210 225 243 2.3Australia/New Zealand . . . . . . . . . . 0 0 0 0 0 0 —
Total OECD . . . . . . . . . . . . . . . . . 2,250 2,291 2,364 2,443 2,484 2,579 0.6
Non-OECDNon-OECD Europe and Eurasia. . . 269 283 342 424 494 519 2.8Russia . . . . . . . . . . . . . . . . . . . . . . . 144 155 197 251 307 328 3.5Other . . . . . . . . . . . . . . . . . . . . . . . . 124 128 145 173 187 191 1.8
Non-OECD Asia. . . . . . . . . . . . . . . . 111 151 290 455 600 678 7.8China. . . . . . . . . . . . . . . . . . . . . . . . 55 65 164 274 366 425 8.9India . . . . . . . . . . . . . . . . . . . . . . . . 16 37 66 104 134 149 9.9Other Non-OECD Asia . . . . . . . . . . 40 48 61 77 100 104 4.0
Middle East . . . . . . . . . . . . . . . . . . . 0 0 6 13 13 13 —Africa . . . . . . . . . . . . . . . . . . . . . . . . 10 14 15 15 21 21 3.2Central and South America . . . . . . 21 23 28 34 34 34 2.1Brazil . . . . . . . . . . . . . . . . . . . . . . . . 14 15 18 22 22 22 2.0Other Central and South America. . 7 8 10 12 12 12 2.2Total Non-OECD . . . . . . . . . . . . . 411 471 681 941 1,162 1,266 4.8
Total World . . . . . . . . . . . . . . . . . . . . 2,660 2,761 3,045 3,385 3,646 3,844 1.5aIncludes the 50 States and the District of Columbia.Note: Totals may not equal sum of components due to independent rounding.Sources: History: Energy Information Administration (EIA), International Energy Annual 2006 (June-December 2008), web site
www.eia.doe.gov/iea. Projections: EIA, Annual Energy Outlook 2009, DOE/EIA-0383(2009) (Washington, DC, March 2009),AEO2009 National Energy Modeling System, run AEO2009.D120908A, web site www.eia.doe.gov/oiaf/aeo; and World Energy Pro-jections Plus (2009).
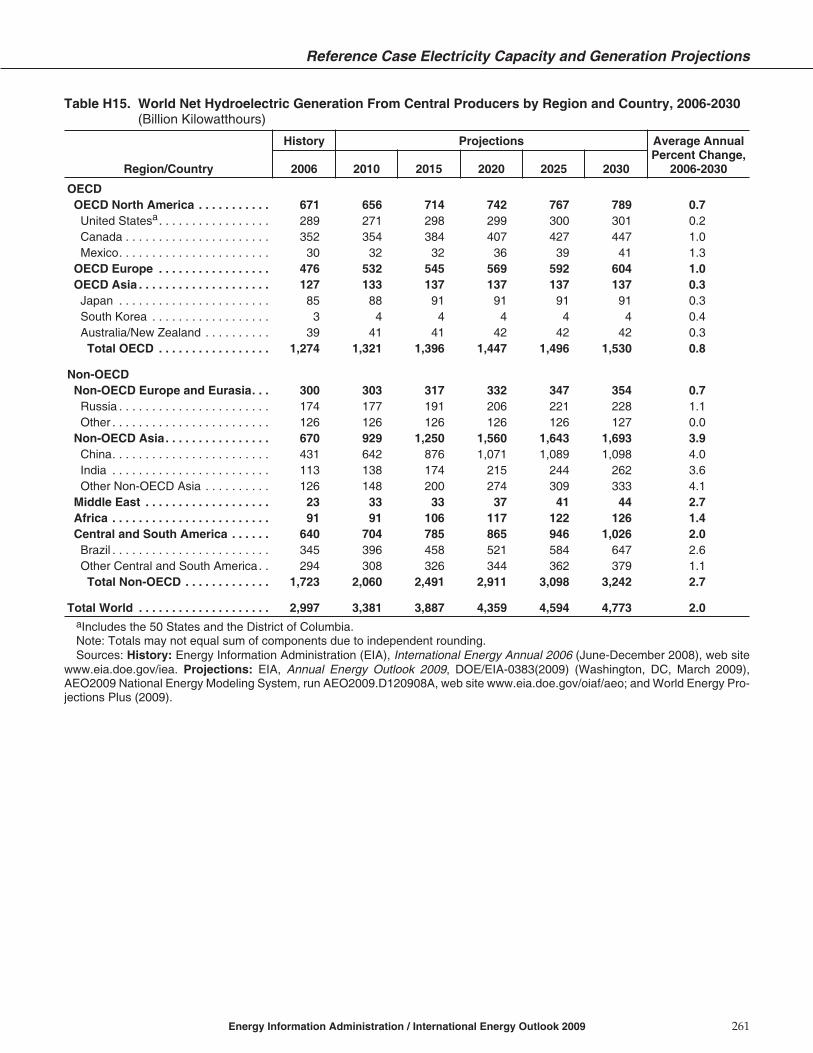
Table H15. World Net Hydroelectric Generation From Central Producers by Region and Country, 2006-2030(Billion Kilowatthours)
Reference Case Electricity Capacity and Generation Projections
Energy Information Administration / International Energy Outlook 2009 261
Region/Country
History Projections Average AnnualPercent Change,
2006-20302006 2010 2015 2020 2025 2030
OECDOECD North America . . . . . . . . . . . 671 656 714 742 767 789 0.7United Statesa. . . . . . . . . . . . . . . . . 289 271 298 299 300 301 0.2Canada . . . . . . . . . . . . . . . . . . . . . . 352 354 384 407 427 447 1.0Mexico. . . . . . . . . . . . . . . . . . . . . . . 30 32 32 36 39 41 1.3
OECD Europe . . . . . . . . . . . . . . . . . 476 532 545 569 592 604 1.0OECD Asia . . . . . . . . . . . . . . . . . . . . 127 133 137 137 137 137 0.3Japan . . . . . . . . . . . . . . . . . . . . . . . 85 88 91 91 91 91 0.3South Korea . . . . . . . . . . . . . . . . . . 3 4 4 4 4 4 0.4Australia/New Zealand . . . . . . . . . . 39 41 41 42 42 42 0.3Total OECD . . . . . . . . . . . . . . . . . 1,274 1,321 1,396 1,447 1,496 1,530 0.8
Non-OECDNon-OECD Europe and Eurasia. . . 300 303 317 332 347 354 0.7Russia . . . . . . . . . . . . . . . . . . . . . . . 174 177 191 206 221 228 1.1Other . . . . . . . . . . . . . . . . . . . . . . . . 126 126 126 126 126 127 0.0
Non-OECD Asia. . . . . . . . . . . . . . . . 670 929 1,250 1,560 1,643 1,693 3.9China. . . . . . . . . . . . . . . . . . . . . . . . 431 642 876 1,071 1,089 1,098 4.0India . . . . . . . . . . . . . . . . . . . . . . . . 113 138 174 215 244 262 3.6Other Non-OECD Asia . . . . . . . . . . 126 148 200 274 309 333 4.1
Middle East . . . . . . . . . . . . . . . . . . . 23 33 33 37 41 44 2.7Africa . . . . . . . . . . . . . . . . . . . . . . . . 91 91 106 117 122 126 1.4Central and South America . . . . . . 640 704 785 865 946 1,026 2.0Brazil . . . . . . . . . . . . . . . . . . . . . . . . 345 396 458 521 584 647 2.6Other Central and South America. . 294 308 326 344 362 379 1.1Total Non-OECD . . . . . . . . . . . . . 1,723 2,060 2,491 2,911 3,098 3,242 2.7
Total World . . . . . . . . . . . . . . . . . . . . 2,997 3,381 3,887 4,359 4,594 4,773 2.0aIncludes the 50 States and the District of Columbia.Note: Totals may not equal sum of components due to independent rounding.Sources: History: Energy Information Administration (EIA), International Energy Annual 2006 (June-December 2008), web site
www.eia.doe.gov/iea. Projections: EIA, Annual Energy Outlook 2009, DOE/EIA-0383(2009) (Washington, DC, March 2009),AEO2009 National Energy Modeling System, run AEO2009.D120908A, web site www.eia.doe.gov/oiaf/aeo; and World Energy Pro-jections Plus (2009).

Table H16. World Net Wind-Powered Electricity Generation From Central Producers by Region and Country,2006-2030(Billion Kilowatthours)
Appendix H
262 Energy Information Administration / International Energy Outlook 2009
Region/Country
History Projections Average AnnualPercent Change,
2006-20302006 2010 2015 2020 2025 2030
OECDOECD North America . . . . . . . . . . . 29 87 108 127 156 183 7.9United Statesa. . . . . . . . . . . . . . . . . 27 81 85 93 113 131 6.8Canada . . . . . . . . . . . . . . . . . . . . . . 2 4 18 29 38 48 13.1Mexico. . . . . . . . . . . . . . . . . . . . . . . 0 2 4 5 5 5 19.4
OECD Europe . . . . . . . . . . . . . . . . . 80 160 283 414 522 621 8.9OECD Asia . . . . . . . . . . . . . . . . . . . . 4 12 27 31 35 38 9.8Japan . . . . . . . . . . . . . . . . . . . . . . . 2 4 6 7 8 9 7.4South Korea . . . . . . . . . . . . . . . . . . 0 0 0 0 1 1 2.7Australia/New Zealand . . . . . . . . . . 2 7 22 24 27 28 11.5Total OECD . . . . . . . . . . . . . . . . . 113 258 418 572 713 842 8.7
Non-OECDNon-OECD Europe and Eurasia. . . 0 2 3 4 4 4 12.9Russia . . . . . . . . . . . . . . . . . . . . . . . 0 0 0 0 0 0 5.9Other . . . . . . . . . . . . . . . . . . . . . . . . 0 2 3 4 4 4 13.1
Non-OECD Asia. . . . . . . . . . . . . . . . 12 45 62 92 124 343 14.8China. . . . . . . . . . . . . . . . . . . . . . . . 2 28 42 70 99 315 23.2India . . . . . . . . . . . . . . . . . . . . . . . . 10 16 19 20 22 23 3.5Other Non-OECD Asia . . . . . . . . . . 0 1 1 2 4 4 12.3
Middle East . . . . . . . . . . . . . . . . . . . 0 1 2 2 2 3 —Africa . . . . . . . . . . . . . . . . . . . . . . . . 1 3 9 10 11 11 11.1Central and South America . . . . . . 1 2 5 7 9 11 13.4Brazil . . . . . . . . . . . . . . . . . . . . . . . . 0 1 3 4 6 7 14.8Other Central and South America. . 0 1 2 3 3 4 11.8Total Non-OECD . . . . . . . . . . . . . 14 53 82 115 150 372 14.6
Total World . . . . . . . . . . . . . . . . . . . . 127 312 500 687 864 1,214 9.9aIncludes the 50 States and the District of Columbia.Notes: Totals may not equal sum of components due to independent rounding. Numbers for the United States in this table are
based on the published AEO2009 reference case (March 2009). In the updated AEO2009 reference case (April 2009), which incor-porates provisions from the American Recovery and Reinvestment Act of 2009 (ARRA2009) that stimulate increased renewablegeneration, greater use of renewable fuels is projected. As a result, U.S. installed wind-powered generation would be 203 billionkilowatthours in 2015 and 208 billion kilowatthours in 2030 in the updated AEO2009 reference case—138 percent higher in 2015 and59 percent higher in 2030 than in the earlier projections reported in this table.
Sources: History: Derived from Energy Information Administration (EIA), International Energy Annual 2006 (June-December2008), web site www.eia.doe.gov/iea. Projections: EIA, Annual Energy Outlook 2009, DOE/EIA-0383(2009) (Washington, DC,March 2009), AEO2009 National Energy Modeling System, run AEO2009.D120908A, web site www.eia.doe.gov/oiaf/aeo; andWorld Energy Projections Plus (2009).

Table H17. World Net Geothermal Electricity Generation From Central Producers by Region and Country,2006-2030(Billion Kilowatthours)
Reference Case Electricity Capacity and Generation Projections
Energy Information Administration / International Energy Outlook 2009 263
Region/Country
History Projections Average AnnualPercent Change,
2006-20302006 2010 2015 2020 2025 2030
OECDOECD North America . . . . . . . . . . . 21 25 27 28 28 30 1.5United Statesa. . . . . . . . . . . . . . . . . 15 18 19 19 20 22 1.7Canada . . . . . . . . . . . . . . . . . . . . . . 0 0 0 0 0 0 —Mexico. . . . . . . . . . . . . . . . . . . . . . . 7 7 9 9 9 9 0.9
OECD Europe . . . . . . . . . . . . . . . . . 8 11 12 12 12 12 1.8OECD Asia . . . . . . . . . . . . . . . . . . . . 6 9 14 17 19 20 5.1Japan . . . . . . . . . . . . . . . . . . . . . . . 3 4 4 4 4 4 1.3South Korea . . . . . . . . . . . . . . . . . . 0 0 0 0 0 0 —Australia/New Zealand . . . . . . . . . . 3 6 10 13 15 16 7.1Total OECD . . . . . . . . . . . . . . . . . 35 45 54 57 59 62 2.4
Non-OECDNon-OECD Europe and Eurasia. . . 0 1 1 1 2 2 6.5Russia . . . . . . . . . . . . . . . . . . . . . . . 0 0 1 1 1 2 5.9Other . . . . . . . . . . . . . . . . . . . . . . . . 0 0 0 0 0 0 —
Non-OECD Asia. . . . . . . . . . . . . . . . 16 23 32 33 34 35 3.4China. . . . . . . . . . . . . . . . . . . . . . . . 0 0 0 0 0 0 —India . . . . . . . . . . . . . . . . . . . . . . . . 0 0 1 1 1 1 —Other Non-OECD Asia . . . . . . . . . . 16 23 30 32 33 34 3.2
Middle East . . . . . . . . . . . . . . . . . . . 0 0 0 0 0 0 —Africa . . . . . . . . . . . . . . . . . . . . . . . . 1 2 2 2 2 2 4.0Central and South America . . . . . . 2 3 4 5 6 7 5.5Brazil . . . . . . . . . . . . . . . . . . . . . . . . 0 0 0 0 0 0 —Other Central and South America. . 2 3 4 5 6 7 5.5
Total Non-OECD . . . . . . . . . . . . . 19 29 40 42 45 47 3.8
Total World . . . . . . . . . . . . . . . . . . . . 55 75 93 99 104 109 2.9aIncludes the 50 States and the District of Columbia.Notes: Totals may not equal sum of components due to independent rounding. Numbers for the United States in this table are
based on the published AEO2009 reference case (March 2009). In the updated AEO2009 reference case (April 2009), which incor-porates provisions from the American Recovery and Reinvestment Act of 2009 (ARRA2009) that stimulate increased renewablegeneration, greater use of renewable fuels is projected. As a result, U.S. installed geothermal generation would be 22 billionkilowatthours in 2015 and 24 billion kilowatthours in 2030 in the updated AEO2009 reference case—17 percent higher in 2015 and11 percent higher in 2030 than in the earlier projections reported in this table.
Sources: History: Derived from Energy Information Administration (EIA), International Energy Annual 2006 (June-December2008), web site www.eia.doe.gov/iea. Projections: EIA, Annual Energy Outlook 2009, DOE/EIA-0383(2009) (Washington, DC,March 2009), AEO2009 National Energy Modeling System, run AEO2009.D120908A, web site www.eia.doe.gov/oiaf/aeo; andWorld Energy Projections Plus (2009).

Table H18. World Net Other Renewable Electricity Generation From Central Producers by Region andCountry, 2006-2030(Billion Kilowatthours)
Appendix H
264 Energy Information Administration / International Energy Outlook 2009
Region/Country
History Projections Average AnnualPercent Change,
2006-20302006 2010 2015 2020 2025 2030
OECDOECD North America . . . . . . . . . . . 90 123 169 252 300 328 5.5United Statesa. . . . . . . . . . . . . . . . . 78 111 153 234 279 305 5.8Canada . . . . . . . . . . . . . . . . . . . . . . 9 9 13 16 18 21 3.5Mexico. . . . . . . . . . . . . . . . . . . . . . . 3 3 3 3 3 2 -0.2
OECD Europe . . . . . . . . . . . . . . . . . 99 109 139 139 139 138 1.4OECD Asia . . . . . . . . . . . . . . . . . . . . 24 32 46 47 47 48 2.9Japan . . . . . . . . . . . . . . . . . . . . . . . 21 25 29 29 29 29 1.4South Korea . . . . . . . . . . . . . . . . . . 0 2 8 8 9 9 12.8Australia/New Zealand . . . . . . . . . . 2 5 9 9 9 10 5.8
Total OECD . . . . . . . . . . . . . . . . . 212 263 354 438 487 513 3.7
Non-OECDNon-OECD Europe and Eurasia. . . 3 0 0 0 0 0 —Russia . . . . . . . . . . . . . . . . . . . . . . . 3 0 0 0 0 0 —Other . . . . . . . . . . . . . . . . . . . . . . . . 0 0 0 0 0 0 —
Non-OECD Asia. . . . . . . . . . . . . . . . 7 13 30 39 47 56 9.2China. . . . . . . . . . . . . . . . . . . . . . . . 1 8 14 19 23 28 13.2India . . . . . . . . . . . . . . . . . . . . . . . . 2 5 15 20 24 28 10.8Other Non-OECD Asia . . . . . . . . . . 3 0 0 0 0 0 -10.1
Middle East . . . . . . . . . . . . . . . . . . . 0 0 1 3 3 3 —Africa . . . . . . . . . . . . . . . . . . . . . . . . 1 0 1 3 5 5 8.9Central and South America . . . . . . 23 27 33 38 44 50 3.3Brazil . . . . . . . . . . . . . . . . . . . . . . . . 19 21 27 33 38 44 3.6Other Central and South America. . 4 5 6 6 6 6 1.2
Total Non-OECD . . . . . . . . . . . . . 33 41 64 83 100 114 5.3
Total World . . . . . . . . . . . . . . . . . . . . 246 304 418 521 587 628 4.0aIncludes the 50 States and the District of Columbia.Notes: Totals may not equal sum of components due to independent rounding. Numbers for the United States in this table are
based on the published AEO2009 reference case (March 2009). In the updated AEO2009 reference case (April 2009), which incor-porates provisions from the American Recovery and Reinvestment Act of 2009 (ARRA2009) that stimulate increased renewablegeneration, greater use of renewable fuels is projected. Although the projections for U.S. solar and municipal waste generation arehigher in the updated AEO2009 reference case, they are more than offset by lower U.S. generation from wood and other biomass; asa result, U.S. “other renewable generation” would be 266 billion kilowatthours in 2030 in the updated AEO2009 reference case—4percent lower than in the earlier projections reported in this table.
Sources: History: Derived from Energy Information Administration (EIA), International Energy Annual 2006 (June-December2008), web site www.eia.doe.gov/iea. Projections: EIA, Annual Energy Outlook 2009, DOE/EIA-0383(2009) (Washington, DC,March 2009), AEO2009 National Energy Modeling System, run AEO2009.D120908A, web site www.eia.doe.gov/oiaf/aeo; andWorld Energy Projections Plus (2009).

Appendix I
Comparisons With International Energy Agencyand IEO2008 Projections
Comparisons with IEA’sWorld Energy Outlook 2008
The International Energy Agency (IEA) in its WorldEnergy Outlook 2008 provides projections that can becompared with those in IEO2009. In both reports thelatest historical year of data upon which the projectionsare based is 2006, and both projection horizons extend to2030. Two time periods were chosen for purposes ofcomparison—2006 to 2015 and 2015 to 2030.
Before turning to a discussion of similarities and differ-ences between the IEO2009 and IEA projections, thedivergent aims of the two publications should be recog-nized. IEO2009 is most directly comparable with theWorld Energy Outlook 2008’s “Part A, Global EnergyTrends to 2030.” In contrast to the World Energy Outlook2008, which presents a single reference case scenario,IEO2009 presents alternative scenarios reflecting highand low economic growth assumptions and high andlow oil price assumptions. Economic growth and oilprices, the latter of which can be affected significantly byabove-the-ground factors as well as the physical avail-ability of petroleum resources, are two major sources of
uncertainly in all energy projections, as is readily shownby a review of past projections.
EIA believes that a full understanding of energy trendsunder current laws and policies requires considerationof the uncertainties. For example, in the IEO2009 refer-ence case, projected demand for liquid fuels in 2030 is106.6 barrels per day, or 100.7 barrel per day if biofuelsare excluded to provide a figure directly comparablewith the 106.4 barrels per day of traditional (non-biofuel) liquids in 2030 in the IEA reference case, whichhas a world price trajectory similar to that in the IEO2009reference case. In the IEO2009 low oil price case, how-ever, in which oil remains at $50 per barrel through 2030,projected world demand for traditional liquids in 2030 issignificantly higher, at 115.4 million barrels per day; andin the high oil price case, in which oil prices rise steadilyto $200 per barrel (2007 dollars) in 2030, world demandfor traditional liquids in 2030 is only 82.8 million barrelsper day.
EIA encourages users of its projections to consider howkey energy market and economic uncertainties, as wellas policy decisions, can affect future energy demand. Asshown in IEO2009, alternative oil price scenarios also
Energy Information Administration / International Energy Outlook 2009 265
Table I1. Comparison of IEO2009 and IEA World Energy Consumption Growth Rates by Region, 2006-2015(Average Annual Percent Growth)
Region
IEO2009 IEA ReferenceScenarioLow Growth Reference High Growth
OECD . . . . . . . . . . . . . . . . . . . . . 0.2 0.5 0.7 0.7North America . . . . . . . . . . . . . . 0.1 0.4 0.7 0.7United States . . . . . . . . . . . . . . 0.0 0.3 0.6 0.5
Europe . . . . . . . . . . . . . . . . . . . . 0.2 0.4 0.6 0.6Asia . . . . . . . . . . . . . . . . . . . . . . 0.6 0.8 1.1 0.9
Non-OECD . . . . . . . . . . . . . . . . . 2.7 2.7 3.2 3.3Europe and Eurasia . . . . . . . . . . 1.2 1.4 1.7 1.8China . . . . . . . . . . . . . . . . . . . . . 3.8 4.1 4.4 4.8India . . . . . . . . . . . . . . . . . . . . . . 2.7 2.9 3.2 3.5Other Non-OECD Asia. . . . . . . . 2.8 3.1 3.4 2.1Middle East . . . . . . . . . . . . . . . . 2.4 2.7 3.0 3.9Africa . . . . . . . . . . . . . . . . . . . . . 2.0 2.3 2.5 1.8Central and South America . . . . 2.3 2.5 2.8 2.7
Total World . . . . . . . . . . . . . . . . . 1.5 1.7 2.0 2.1
Sources: IEO2009: Energy Information Administration (EIA), World Energy Projections Plus (2009). IEA: International EnergyAgency, World Energy Outlook 2008 (Paris, France, November 2008), pp. 506-539.

have significant impacts on the projected composition ofliquids supply, because they affect the mix betweenunconventional and conventional oil sources and thecomposition of the unconventional component ofsupply.
Most of the comparisons in this appendix focus on com-parisons of projections for energy demand in the IEO-2009 reference case and the IEA’s World Energy Outlook2008; however, there is one noteworthy difference inviews regarding the natural gas market in North Amer-ica, especially the United States. IEA projects muchstronger growth in U.S. natural gas prices (with the aver-age U.S. imported price of natural gas reaching $16.13per million Btu in 2007 dollars in 2030), as well as declin-ing domestic production and flat demand. IEO2009 alsoexpects U.S. natural gas prices to rise, but at a muchmore modest rate, with the average imported pricereaching $8.88 per million Btu in 2030. The IEO2009analysis of prospects for North American natural gas,based on work in EIA’s Annual Energy Outlook 2009,reflects a much brighter outlook for production of un-conventional natural gas, particularly from gas shale,than is assumed by IEA. In EIA’s reference case projec-tion, the United States becomes virtually self-sufficientin natural gas supply, at a price much lower than thatassumed necessary to attract significant amounts ofliquefied natural gas (LNG) to the United States in theIEA reference scenario.
In the projection period from the present to 2015, the IEAreference scenario reflects growth that more closelyresembles the IEO2009 high economic growth case thanits reference case. The IEA reference scenario projectsan increase in world energy consumption that averages2.1 percent per year, as compared with 2.0 percent peryear in the IEO2009 high economic growth. In the IEO-2009 reference case, world energy use increases by anaverage of 1.7 percent per year (Table I1).
The slower projected near-term growth in the IEO2009reference case may reflect, in part, the different releasedates for IEO2009 and the World Energy Outlook 2008.The IEO2009 projections were prepared when prelimi-nary assessments of the global recession were becomingavailable (specifically reflected in the near-term GDPestimates in IHS Global Insight’s November 2008release), whereas the World Energy Outlook 2008 wasreleased in November 2008, and its projections were for-mulated several months in advance of the release. Thus,the IEA report may not have incorporated expectationsbased on the impact of the growing global recession.
On a regional basis, both outlooks project much slowergrowth in energy demand among the OECD nationsthan among the non-OECD nations. The IEO2009 refer-ence case, however, projects slower growth in eachof the OECD regions than do the IEA projections. The
largest difference among the OECD projections is forthe United States, with IEA projecting an 0.7-percentaverage yearly increase and the IEO2009 reference caseprojecting an average of 0.4 percent per year.
There is wider variation between the IEA and IEO2009reports in their projections for the non-OECD regions.For the non-OECD as a whole, the IEA projections againresemble those in the IEO2009 high economic growthcase rather than the IEO2009 reference case. On aregional basis, IEA projects non-OECD growth rates thatexceed the IEO2009 projections for non-OECD Europeand Eurasia, China, India, and the Middle East. For eachof those regions and countries, IEA projects highergrowth rates than those in the IEO2009 high economicgrowth case.
For two non-OECD regions—other Asia (non-OECDAsia, excluding China and India) and Africa—IEA pro-jects much slower growth in energy demand to 2015than does the IEO2009 reference case. For other non-OECD Asia, IEA’s projected 2.1-percent average annualgrowth rate for energy consumption is lower than theprojection of 3.1 percent per year in the IEO2009 refer-ence case. In fact, the IEA growth rate falls below the ratein the IEO2009 low economic growth case. Similarly,IEA projects only a 1.8-percent annual increase inAfrica’s energy use to 2015, compared with 2.3 percentper year in the IEO2009 reference case. Again, the IEAprojected growth rate falls below that in the IEO2009low growth case.
In the later years of the projections, the differencesbetween the IEO2009 and IEA narrow substantially,with worldwide energy demand growing by 1.4 percentper year between 2015 and 2030 in the IEO2009 referencecase and 1.3 percent per year in the IEA projection (TableI2). There remain, however, some substantial regionaldifferences between the outlooks. For the OECD region,the largest difference is between the projections forOECD Europe. The IEA projections for annual growth inOECD Europe’s energy consumption from 2015 to 2030are considerably lower than those for 2006 to 2015, andthey are substantially lower than those in the IEO2009reference case. In the IEA projections, OECD Europe’senergy use grows by 0.1 percent per year from 2015 to2030, which compares with 0.5 percent per year in theIEO2009 reference case and is lower than the projectedrate in the IEO2009 low economic growth case.
For the non-OECD region, the greatest differencesbetween the two outlooks are for non-OECD Asia(China, India, and other non-OECD Asia) and the Mid-dle East. For China and other non-OECD Asia, IEAanticipates that energy demand growth will slow to 2.0percent per year and 1.5 percent per year, respectively,for the final 15 years of the outlook, whereas the IEO2009reference case shows China maintaining a 2.6-percent
266 Energy Information Administration / International Energy Outlook 2009

annual growth rate in energy demand and other non-OECD Asia a 2.7-percent average growth rate from 2015to 2030. For both China and other non-OECD Asia, theIEA projections for energy use are below those in theIEO2009 low economic growth case.
In contrast, for India and the Middle East, the IEA pro-jections for energy demand growth from 2015 to 2030 aremuch higher than those in the IEO2009 reference case.The IEA reference scenario projects energy demandgrowth in India averaging 3.4 percent per year from 2015to 2030, whereas the IEO2009 reference case projects anaverage of 2.3 percent per year. For the Middle East, IEAexpects energy demand to grow by 2.8 percent per yearfrom 2015 to 2030, as compared with 1.5 percent per yearin the IEO2009 reference case. For both India and the
Middle East, the IEA projections exceed those in theIEO2009 high economic growth case.
The projections vary not only with respect to levels oftotal world energy demand but also with respect to themix of primary energy inputs. In the 2006 to 2015 period,IEA expects faster growth in the use of liquids and coaland slower growth in the use of nuclear and renewableenergy sources than does IEO2009 (Table I3). Worldliquids consumption in the IEO2009 reference caseincreases by 0.7 percent per year from 2006 to 2015,compared with 1.4 percent per year in the IEA referencescenario. The IEO2009 projections incorporate near-termprojections for liquids consumption from EIA’s Febru-ary 2009 Short-Term Energy Outlook, in which growthrates remain low or decline through 2010. Again, IEA
Energy Information Administration / International Energy Outlook 2009 267
Table I3. Comparison of IEO2009 and IEA World Energy Consumption Growth Rates by Fuel, 2006-2015(Average Annual Percent Growth)
Fuel
IEO2009 IEA ReferenceScenarioLow Growth Reference High Growth
Liquids . . . . . . . . . . . . . . . . . . . . . 0.4 0.7 1.0 1.3Natural Gas . . . . . . . . . . . . . . . . . 1.8 2.2 2.5 2.1Coal . . . . . . . . . . . . . . . . . . . . . . . 1.7 1.9 2.1 3.1Nuclear . . . . . . . . . . . . . . . . . . . . 1.6 1.6 1.6 1.3Renewable/Other. . . . . . . . . . . . . 4.3 4.5 4.7 2.3
Total . . . . . . . . . . . . . . . . . . . . . 1.5 1.7 2.0 2.1
Note: In the IEA projections, Renewable/Other includes traditional biomass.Sources: IEO2009: Energy Information Administration (EIA), World Energy Projections Plus (2009). IEA: International Energy
Agency, World Energy Outlook 2008 (Paris, France, November 2008), pp. 592-630.
Table I2. Comparison of IEO2009 and IEA World Energy Consumption Growth Rates by Region, 2015-2030(Average Annual Percent Growth)
Region
IEO2009 IEA ReferenceScenarioLow Growth Reference High Growth
OECD . . . . . . . . . . . . . . . . . . . . . 0.3 0.7 1.0 0.3North America . . . . . . . . . . . . . . 0.4 0.8 1.2 0.5United States . . . . . . . . . . . . . . 0.3 0.7 1.0 0.4
Europe . . . . . . . . . . . . . . . . . . . . 0.2 0.5 0.8 0.1Asia . . . . . . . . . . . . . . . . . . . . . . 0.1 0.4 0.8 0.2
Non-OECD . . . . . . . . . . . . . . . . . 1.6 1.8 2.4 1.9Europe and Eurasia . . . . . . . . . . 0.3 0.6 1.0 0.7China . . . . . . . . . . . . . . . . . . . . . 2.2 2.6 3.0 2.0India . . . . . . . . . . . . . . . . . . . . . . 1.9 2.3 2.7 3.4Other Non-OECD Asia. . . . . . . . 2.3 2.7 3.1 1.5Middle East . . . . . . . . . . . . . . . . 1.1 1.5 1.9 2.8Africa . . . . . . . . . . . . . . . . . . . . . 1.0 1.4 1.8 1.2Central and South America . . . . 1.1 1.5 1.9 1.7
Total World . . . . . . . . . . . . . . . . . 1.0 1.4 1.8 1.3
Sources: IEO2009: Energy Information Administration (EIA), World Energy Projections Plus (2009). IEA: International EnergyAgency, World Energy Outlook 2008 (Paris, France, November 2008), pp. 506-539.

does not include revisions to near-term economic anddemand expectations that may have been made afterNovember 2008.
The IEA projection for worldwide growth in coal con-sumption from 2006 to 2015 is bullish in comparisonwith the IEO2009 projection for all parts of the world.For China, IEA projects average annual growth of 5.1percent in coal demand from 2006 to 2015, comparedwith 4.8 percent per year in the IEO2009 reference case.Similarly, India’s coal use grows by 3.9 percent per yearin the IEA reference scenario from 2006 to 2015, com-pared with 2.2 percent per year in the IEO2009 referencecase. For OECD Europe, IEA projects increases in coalaveraging 0.4 percent per year, compared with a declineof 0.4 percent per year in the IEO2009 reference casefrom 2006 to 2015.
Differences between the projections for consumption ofrenewables may be explained by the fact that IEAincludes an estimate for traditional, nonmarketed bio-mass in its renewable energy projections, whereas theIEO2009 projections do not attempt to estimate the useof nonmarketed renewable fuels (which, in fact, is notlikely to expand significantly, because developingcountries tend to move away from traditional fuels tocommercial fuels as their energy infrastructures andstandards of living increase). On the other hand, con-sumption of traditional fuels in some developing coun-tries is estimated to be quite large, with effects on totalrenewable energy use that would tend to mask anygrowth in the consumption of energy from marketed,commercial renewable sources—particularly, wind andother nonhydroelectric renewables.
Differences between the IEA and IEO2009 projectionsfor nuclear energy are explained in large part by differ-ing expectations for the OECD region, which account for85 percent of the world’s total nuclear power use.Although IEA projects more rapid growth for nuclearpower in the OECD Asia region than is projected inthe IEO2009 reference case, it also projects a decline in
OECD Europe. In contrast, in the IEO2009 referencecase, nuclear power use in OECD Europe remains flatthrough 2015. Because OECD Europe consumes morethan twice as much nuclear electricity as OECD Asia, thedecline projected by IEA for OECD Europe offsets theprojected increases for other OECD and non-OECDregions (including OECD Asia, Non-OECD Europe andEurasia, and China) that are larger than those in theIEO2009 reference case.
For the period from 2015 to 2030, the IEO2009 referencecase and IEA projections are largely in agreement,except for nuclear power and renewable energy sources,for which the IEA growth projections fall significantlybelow those in the IEO2009 low economic growth case(Table I4). In the IEA projection, the average annualgrowth rate for world nuclear electricity consumptionslows from 1.3 percent in the 2006-2015 period to 0.7 per-cent in the 2015-2030 period. IEO2009 projects averageincreases of 1.6 percent per year from 2006 to 2015 andfrom 2015 to 2030. The IEA reference scenario projectsmore rapid growth for renewable energy use in the lateryears, increasing from 2.0 percent per year in the 2006-2015 period to 2.3 percent per year from 2015 to 2030.The IEO2009 reference case also expects the rate ofgrowth for renewable energy consumption to be higherfrom 2015 to 2030 than from 2006 to 2015, but the incre-ment is even larger. In the IEO2009 reference case,renewable energy use increases by 3.0 percent from 2006to 2015 and by 4.5 percent per year from 2015 to 2030.
Comparisons With IEO2008
The IEO2009 outlook for total energy consumption in2015 is largely the same as the outlook published inIEO2008. In IEO2009, total marketed energy consump-tion in 2015 is projected to be 552 quadrillion Btu, ascompared with 563 quadrillion Btu in IEO2008 (TableI5). There are some relatively modest regional differ-ences between the two IEOs, centered mostly in NorthAmerica. In IEO2009, total energy consumption for theOECD countries in 2015 is about 8 quadrillion Btu lower
268 Energy Information Administration / International Energy Outlook 2009
Table I4. Comparison of IEO2009 and IEA World Energy Consumption Growth Rates by Fuel, 2015-2030(Average Annual Percent Growth)
Fuel
IEO2009 IEA ReferenceScenarioLow Growth Reference High Growth
Liquids . . . . . . . . . . . . . . . . . . . . . 0.7 1.1 1.5 0.8Natural Gas . . . . . . . . . . . . . . . . . 0.9 1.3 1.7 1.6Coal . . . . . . . . . . . . . . . . . . . . . . . 1.1 1.6 2.0 1.3Nuclear . . . . . . . . . . . . . . . . . . . . 1.4 1.6 1.8 0.7Renewable/Other. . . . . . . . . . . . . 2.0 2.1 2.1 1.8
Total . . . . . . . . . . . . . . . . . . . . . 1.0 1.4 1.8 1.3
Note: In the IEA projections, Renewable/Other includes traditional biomass.Sources: IEO2009: Energy Information Administration (EIA), World Energy Projections Plus (2009). IEA: International Energy
Agency, World Energy Outlook 2008 (Paris, France, November 2008), pp. 592-630.

than was projected in IEO2008. More than one-half(6 quadrillion Btu) of the difference is attributed to lowerdemand in North America, with 4 quadrillion Btu of thatdifference attributed to the United States, largelybecause the economic recession dampens demand forenergy in the near term.
For the non-OECD countries, the differences betweenthe projections for 2015 in IEO2009 and IEO2008 are alsomodest. In IEO2009, non-OECD energy use in 2015 is3 quadrillion Btu (about 1 percent) lower than in theIEO2008 projection. Lower growth in energy demandprojected for non-OECD Europe and Eurasia andnon-OECD Asia (excluding China) is offset in part byhigher demand in China and the Middle East. Again,lower economic growth projected for the near term innon-OECD Europe and non-OECD Asia excludingChina, in view of the recent economic downturn, largelyexplains the slower projection for growth in non-OECDenergy demand in IEO2009 compared with IEO2008.
The near-term differences between the IEO2009 andIEO2008 projections continue through to 2030. TheIEO2009 reference case projection for total energy useworldwide in 2030 is 7 quadrillion Btu (about 1 percent)lower than the IEO2008 projection. Again, the largestregional differences between the 2030 projections are forthe United States and for non-OECD Europe and Eur-asia. In the IEO2009 reference case, the lower U.S. energydemand is attributed to a combination of higher energy
prices and greater use of more efficient appliances andvehicles in response to the requirements of the EnergyIndependence and Security Act of 2007 (EISA2007) andthe Energy Improvement and Extension Act of 2008(EIEA2008). The reference case projection for U.S. totalenergy use in 2030 is 4 quadrillion Btu (4 percent) lowerin IEO2009 than was projected in IEO2008.
For non-OECD Europe and Eurasia, the projections foreconomic growth were reassessed and lowered substan-tially in IEO2009. In IEO2008, GDP growth in non-OECD Europe and Eurasia was projected to average4.4 percent per year from 2005 to 2030; in IEO2009, theaverage is 3.8 percent per year. As a result of the down-ward adjustment in GDP growth, energy consumptionin non-OECD Europe and Eurasia in 2030 is 6 quadril-lion Btu lower in IEO2009 than was projected in IEO-2008.
Along with regional differences between the IEO2009and IEO2008 projections, there are some differencesbetween the two projections in the mix of energyresources consumed (Table I6). The IEO2009 projectionsfor worldwide consumption of liquid fuels are 11 qua-drillion Btu lower in 2015 and 14 quadrillion Btu lowerin 2030 than the corresponding IEO2008 projections. Thedifference can be explained largely by the higher worldoil prices in IEO2009. World oil prices in the IEO2009 ref-erence case are 80 percent higher in 2030 than they werein the IEO2008 reference case.
Energy Information Administration / International Energy Outlook 2009 269
Table I5. Comparison of IEO2009 and IEO2008 Total World Energy Consumption, Reference Case,2015 and 2030(Quadrillion Btu)
Region
2015 2030 Change in IEO2009
IEO2009 IEO2008 IEO2009 IEO2008 2015 2030
OECD . . . . . . . . . . . . . . . . . . . . . . . . . . . . 252 260 278 286 -8 -8North America . . . . . . . . . . . . . . . . . . . . . 126 132 142 149 -6 -7United States . . . . . . . . . . . . . . . . . . . . 103 107 114 118 -4 -4
Europe . . . . . . . . . . . . . . . . . . . . . . . . . . 85 87 92 92 -2 0Asia . . . . . . . . . . . . . . . . . . . . . . . . . . . . . 42 41 45 45 0 0
Non-OECD . . . . . . . . . . . . . . . . . . . . . . . . 357 362 463 478 -5 -14Europe and Eurasia . . . . . . . . . . . . . . . . 58 59 63 69 -2 -6Russia . . . . . . . . . . . . . . . . . . . . . . . . . . . 34 35 38 40 -1 -2Other Non-OECD Europe and Eurasia . . 23 25 26 29 -1 -4China. . . . . . . . . . . . . . . . . . . . . . . . . . . . 106 104 156 155 2 1India . . . . . . . . . . . . . . . . . . . . . . . . . . . . 23 23 32 33 0 -1Other Non-OECD Asia . . . . . . . . . . . . . . 34 37 51 52 -3 -1Middle East . . . . . . . . . . . . . . . . . . . . . . . 30 30 38 37 1 1Africa. . . . . . . . . . . . . . . . . . . . . . . . . . . . 18 19 22 24 -1 -2Central and South America. . . . . . . . . . . 30 31 38 38 0 -1
Total World . . . . . . . . . . . . . . . . . . . . . . . 552 563 678 695 -12 -16
Sources: IEO2009: Energy Information Administration (EIA), World Energy Projections Plus (2009). IEO2008: EIA, InternationalEnergy Outlook 2008, DOE/EIA-0484(2008) (Washington, DC, September 2008), Table A1, p. 103.

There are also differences between the IEO2009 and IEO-2008 projections for consumption of the other fossilfuels: the projections for both coal and natural gas con-sumption are lower in IEO2009, largely because renew-able energy use is much higher in this year’s projections.As a result, renewable energy displaces some of thedemand for coal and natural gas in the electric powersector. A more detailed assessment of the worldwide
potential for renewable electric power generation,undertaken in preparing for IEO2009, resulted in anincrease of 13 quadrillion Btu (21 percent) in renewableenergy consumption in 2030 as compared with IEO2008.The projections for nuclear power in IEO2009 are virtu-ally unchanged on a Btu basis from those in IEO2008,with nuclear power use in 2030 only 1 quadrillion Btuhigher in IEO2009 than was projected in IEO2008.
270 Energy Information Administration / International Energy Outlook 2009
Table I6. Comparison of IEO2009 and IEO2008 World Energy Consumption by Fuel, Reference Case,2015 and 2030(Quadrillion Btu)
Fuel
2015 2030 Change in IEO2009
IEO2009 IEO2008 IEO2009 IEO2008 2015 2030Liquids . . . . . . . . . . . . . . . . . . . . . 183 194 216 229 -11 -14Natural Gas . . . . . . . . . . . . . . . . . 131 134 158 165 -3 -7Coal . . . . . . . . . . . . . . . . . . . . . . . 151 158 190 202 -7 -12Nuclear . . . . . . . . . . . . . . . . . . . . 32 31 40 39 0 1Renewable/Other. . . . . . . . . . . . . 55 48 74 61 7 13
Total . . . . . . . . . . . . . . . . . . . . . 552 563 678 695 -12 -16
Sources: IEO2009: Energy Information Administration (EIA), World Energy Projections Plus (2009). IEO2008: EIA, InternationalEnergy Outlook 2008, DOE/EIA-0484(2008) (Washington, DC, September 2008), Table A2, pp. 104-105.

Appendix J
Models Used To Generate the IEO2009 Projections
The IEO2009 projections of world energy consumptionand supply were generated from EIA’s World EnergyProjections Plus (WEPS+) model. WEPS+ consists of asystem of individual sectoral energy models, using anintegrated iterative solution process that allows for con-vergence of consumption and prices to an equilibriumsolution. It is used primarily to provide alternativeenergy projections based on different assumptions forGDP growth and fossil fuel prices and can also be usedto perform other analyses.
WEPS+ produces projections for 16 regions or countriesof the world, including North America (United States,Canada, and Mexico), OECD Europe, OECD Asia(Japan, South Korea, and Australia/New Zealand), Rus-sia, other non-OECD Europe and Eurasia, China, India,other non-OECD Asia, Brazil, and other Central andSouth America. Currently, the projections extend to2030.
The WEPS+ platform allows the various individualmodels to communicate with each other through a com-mon, shared database and provides a comprehensive,central series of output reports for analysis. In the indi-vidual models, the detail also extends to the subsectorlevel. In WEPS+, the end-use demand models (residen-tial, commercial, industrial, and transportation) projectconsumption of the key primary energy sources: severalpetroleum products, other liquids, natural gas, coal,nuclear power, hydropower, wind, geothermal, andother renewable sources. These models also provideintermediate consumption projections for electricity inthe end-use demand sectors.
The end use model projections generally depend onretail supply prices, economic activity as represented byGDP, and population. The transformation models(power generation and district heat) satisfy electricityand heat requirements and also project consumption ofprimary energy sources at resulting price levels. Thesupply models (petroleum, natural gas, and coal) makesupply projections for the key supply sources corre-sponding to the primary consumption sources. Themain model in the WEPS+ system monitors the conver-gence sequence for all the models and projects carbondioxide emissions from the combustion of fossil fuels ata regional level.
Several model enhancements were implemented in thisyear’s version of the WEPS+ model, including animproved modeling platform and improvements in theindividual models. The transportation sector model
includes an extensive level of detail for modes and vehi-cle types. The other end use demand models are nowdynamic simulations with additional product detail.The new electric power generation model is a technol-ogy-based stock/flow model using a least-cost solutiontechnique. There is a distinct district heat model, and thesupply models now provide retail price feedback. Thenatural gas supply model interfaces with the Interna-tional Natural Gas Model (INGM) to provide supplyprices.
WEPS+ includes a detailed model of the world’s trans-portation sector, which provides projections by fourtransport modes: road, rail, water, and air. A variety ofservices are represented for each mode, such as light-duty vehicles, two/three-wheel vehicles, heavy trucks,passenger rail, and freight rail. WEPS+ separates servicedemand (e.g., road travel by cars, commercial trucks,and heavy trucks) from vehicle efficiency and bases theprojections on economic growth (as measured by GDP)and fuel prices.
A new detailed regional power generation model hasalso been incorporated into WEPS+. This model uses astock/flow approach, keeping track of electricity gener-ating capacity, generation, and consumption withinremaining, new, and added vintages. The model is tech-nology-based, with a wide variety of technologies forfossil fuels along with their characteristics, such as costsand heat rates. The model solves for new capacity andgeneration in each year, based on the new generationrequirements from the end use demand models, afteraccounting for transmission and distribution losses. Thesolution technique is a least-cost market share, usinglevelized costs for each technology within various loadsegments based on the system load shape. The overallsystem load shape is built from sectoral load shapes thatare fitted to annual loads from each of the demandmodels.
The other demand models in WEPS+ (residential, com-mercial, and industrial) are now represented in adynamic simulation, in which the projections are builtup over the projection horizon based on changes inGDP, retail prices, consumption in the previous year,and a trend. These core sections of WEPS+ are based on adynamic microeconomic model and are used primarilyto provide a reference case and alternative case energyprojections under different assumptions about GDPgrowth and fossil fuel prices. The reference case reflectsaccumulated knowledge from the results of other com-plex models that focus on specific supply or demand
Energy Information Administration / International Energy Outlook 2009 271

series; reflects the behavioral expectations as repre-sented in the elasticities and trends; and incorporates theanalysts’ judgments on the potential for demand byend-use sector and fuel type on a regional basis. Afterthe reference case is established, WEPS+ is used to runalternative cases that reflect different assumptions aboutfuture economic growth and energy prices. WEPS+ alsocan be used for other analyses, such as the effects of car-bon prices.
The Generate World Oil Balance Model (GWOB) is usedto create a "bottom up" projection of world liquids sup-ply—based on current production capacity, plannedfuture additions to capacity, resource data, geopoliticalconstraints, and prices—and is used to generate conven-tional crude oil production cases. The scenarios (oilprice cases) are developed through an iterative processof examining demand levels at given prices and
considering the price and income sensitivity on both thedemand and supply sides of the equation. Projections ofconventional liquids production for 2009 through 2015are based on analysis of investment and developmenttrends around the globe. Data from EIA’s Short-TermEnergy Outlook are integrated to ensure consistencybetween short- and long-term modeling efforts. Projec-tions of unconventional liquids production are based onexogenous analysis.
Ten major streams of liquids production are tracked on avolume basis: (1) crude oil and lease condensate, (2) nat-ural gas plant liquids, (3) refinery gains, (4) Canadian oilsands, (5) extra-heavy oils, (6) coal-to-liquids, (7) gas-to-liquids, (8) shale oils, (9) ethanol, and (10) biodiesel.Biofuels are tracked on both a volume basis and an oilequivalent basis. All liquid fuels are reported in physicalvolumes, unless otherwise stated.
272 Energy Information Administration / International Energy Outlook 2009

Appendix K
Regional Definitions
The six basic country groupings used in this report(Figure K1) are defined as follows:
•OECD (18 percent of the 2009 world population):North America—United States, Canada, and Mex-ico; OECD Europe—Austria, Belgium, CzechRepublic, Denmark, Finland, France, Germany,Greece, Hungary, Iceland, Ireland, Italy, Luxem-bourg, the Netherlands, Norway, Poland, Portugal,Slovakia, Spain, Sweden, Switzerland, Turkey, andthe United Kingdom. OECD Asia—Japan, SouthKorea, Australia, and New Zealand.
•Non-OECD (82 percent of the 2009 world popula-tion):
- Non-OECD Europe and Eurasia (5 percent of the2009 world population)—Albania, Armenia, Azer-baijan, Belarus, Bosnia and Herzegovina, Bulgaria,Croatia, Cyprus, Estonia, Georgia, Kazakhstan,Kyrgyzstan, Latvia, Lithuania, Macedonia, Malta,Moldova, Montenegro, Romania, Russia, Serbia,Slovenia, Tajikistan, Turkmenistan, Ukraine, andUzbekistan.
- Non-OECD Asia (53 percent of the 2009 worldpopulation)—Afghanistan, American Samoa, Ban-gladesh, Bhutan, Brunei, Cambodia (Kampuchea),China, Cook Islands, Fiji, French Polynesia, Guam,Hong Kong, India, Indonesia, Kiribati, Laos,Macau, Malaysia, Maldives, Mongolia, Myanmar(Burma), Nauru, Nepal, New Caledonia, Niue,North Korea, Pakistan, Papua New Guinea,Philippines, Samoa, Singapore, Solomon Islands,Sri Lanka, Taiwan, Thailand, Timor-Leste (EastTimor), Tonga, U.S. Pacific Islands, Vanuatu, Viet-nam, and Wake Islands.
- Middle East (3 percent of the 2009 world popula-tion)—Bahrain, Iran, Iraq, Israel, Jordan, Kuwait,Lebanon, Oman, Qatar, Saudi Arabia, Syria, theUnited Arab Emirates, and Yemen.
- Africa (14 percent of the 2009 world popula-tion)—Algeria, Angola, Benin, Botswana, BurkinaFaso, Burundi, Cameroon, Cape Verde, CentralAfrican Republic, Chad, Comoros, Congo (Brazza-ville), Congo (Kinshasa), Côte d’Ivoire, Djibouti,Egypt, Equatorial Guinea, Eritrea, Ethiopia, Gabon,
Energy Information Administration / International Energy Outlook 2009 273
Key
Africa
Industrialized CountriesEE/FSUDeveloping AsiaMiddle East
Central and South America
Figure K1. Map of the Six Basic Country Groupings
Source: Energy Information Administration, Office of Integrated Analysis and Forecasting.

The Gambia, Ghana, Guinea, Guinea-Bissau,Kenya, Lesotho, Liberia, Libya, Madagascar,Malawi, Mali, Mauritania, Mauritius, Morocco,Mozambique, Namibia, Niger, Nigeria, Reunion,Rwanda, Sao Tome and Principe, Senegal, Sey-chelles, Sierra Leone, Somalia, South Africa, St. Hel-ena, Sudan, Swaziland, Tanzania, Togo, Tunisia,Uganda, Western Sahara, Zambia, and Zimbabwe.
- Central and South America (7 percent of the 2009world population)—Antarctica, Antigua and Bar-buda, Argentina, Aruba, The Bahamas, Barbados,Belize, Bolivia, Brazil, British Virgin Islands, Cay-man Islands, Chile, Colombia, Costa Rica, Cuba,Dominica, Dominican Republic, Ecuador, El Salva-dor, Falkland Islands, French Guiana, Grenada,Guadeloupe, Guatemala, Guyana, Haiti, Hondu-ras, Jamaica, Martinique, Montserrat, NetherlandsAntilles, Nicaragua, Panama, Paraguay, Peru,Puerto Rico, St. Kitts-Nevis, St. Lucia, St. Vincent/Grenadines, Suriname, Trinidad and Tobago,Turks and Caicos Islands, Uruguay, U.S. VirginIslands, and Venezuela.
In addition, the following commonly used countrygroupings are referenced in this report:
•Countries that have ratified, accepted, acceded, orapproved the Kyoto Climate Change Protocol onGreenhouse Gas Emissions as of January 14, 2009:Albania, Algeria, Angola, Antigua and Barbuda,Argentina, Armenia, Australia, Austria, Azerbaijan,Bahamas, Bahrain, Bangladesh, Barbados, Belarus,Belgium, Belize, Benin, Bhutan, Bolivia, Bosnia andHerzegovina, Botswana, Brazil, Bulgaria, BurkinaFaso, Burundi, Cambodia, Cameroon, Canada, CapeVerde, Central African Republic, Chile, China,Colombia, Comoros, Congo (Brazzaville), Congo(Kinshasa), Cook Islands, Costa Rica, Côte d’Ivoire,Croatia, Cuba, Cyprus, Czech Republic, Denmark,Djibouti, Dominica, Dominican Republic, Ecuador,Egypt, El Salvador, Equatorial Guinea, Eritrea, Esto-nia, Ethiopia, Fiji, Finland, France, Gabon, The Gam-bia, Georgia, Germany, Ghana, Greece, Grenada,Guatemala, Guinea, Guinea-Bissau, Guyana, Haiti,Honduras, Hungary, Iceland, India, Indonesia, Iran,Ireland, Israel, Italy, Jamaica, Japan, Jordan, Kenya,Kiribati, Kuwait, Kyrgyzstan, Laos, Latvia, Lebanon,Lesotho, Liberia, Libya, Liechtenstein, Lithuania,Luxembourg, Macedonia, Madagascar, Malawi,
Malaysia, Maldives, Mali, Malta, Marshall Islands,Mauritania, Mauritius, Mexico, Micronesia, Mol-dova, Monaco, Mongolia, Montenegro, Morocco,Mozambique, Myanmar, Namibia, Nauru, Nepal,Netherlands, New Zealand, Nicaragua, Niger,Nigeria, Niue, North Korea, Norway, Oman, Paki-stan, Palau, Panama, Papua New Guinea, Paraguay,Peru, Philippines, Poland, Portugal, Qatar, Romania,Russia, Rwanda, Samoa, Sao Tome and Principe,Saudi Arabia, Senegal, Serbia, Seychelles, SierraLeone, Singapore, Slovakia, Slovenia, SolomonIslands, South Africa, South Korea, Spain, Sri Lanka,St. Lucia, St. Kitts and Nevis, St. Vincent/Grena-dines, Sudan, Suriname, Swaziland, Sweden,Switzerland, Syria, Tajikistan, Tanzania, Thailand,Timor-Leste, Togo, Tonga, Trinidad and Tobago,Tunisia, Turkmenistan, Tuvalu, Uganda, Ukraine,United Arab Emirates, United Kingdom, Uruguay,Uzbekistan, Vanuatu, Venezuela, Vietnam, Yemen,and Zambia.
•Annex I Countries participating in the Kyoto Cli-mate Change Protocol on Greenhouse Gas Emis-sions: Australia, Austria, Belarus, Belgium, Bulgaria,Canada, Croatia, Czech Republic, Denmark, Estonia,European Community, Finland, France, Germany,Greece, Hungary, Iceland, Ireland, Italy, Japan,Latvia, Liechtenstein, Lithuania, Luxembourg,Monaco, the Netherlands, New Zealand, Norway,Poland, Portugal, Romania, Russia, Slovakia,Slovenia, Spain, Sweden, Switzerland, Ukraine, andthe United Kingdom.50
•European Union (EU): Austria, Belgium, Bulgaria,Cyprus, Czech Republic, Denmark, Estonia, Finland,France, Germany, Greece, Hungary, Ireland, Italy,Latvia, Lithuania, Luxembourg, Malta, the Nether-lands, Poland, Portugal, Romania, Slovakia,Slovenia, Spain, Sweden, and the United Kingdom.
•Organization of the Petroleum Exporting Countries(OPEC): Algeria, Angola, Ecuador, Iran, Iraq,Kuwait, Libya, Nigeria, Qatar, Saudi Arabia,the United Arab Emirates, and Venezuela.
•Persian Gulf Countries: Bahrain, Iran, Iraq, Kuwait,Oman, Qatar, Saudi Arabia, and the United ArabEmirates.
•BRIC Countries: Brazil, Russia, India, and China.
274 Energy Information Administration / International Energy Outlook 2009
50 Turkey is an Annex I nation that has not ratified the Framework Convention on Climate Change and did not commit to quantifiableemissions targets under the Kyoto Protocol. In 2001, the United States withdrew from the Protocol.