effects of variations in hydrogeological parameters on water-table mounding in sandy loam and loamy...
TRANSCRIPT
Effects of variations in hydrogeological parameters on water-tablemounding in sandy loam and loamy sand soils beneath stormwaterinfiltration basins
Anita Thompson & Mike Nimmer & Debasmita Misra
Abstract The two-dimensional variably-saturated numer-ical model HYDRUS-2D, previously calibrated torecharge events from an infiltration basin, was used topredict water-table mounding under hypothetical basindesign scenarios, and the primary factors that affect water-table mounding were evaluated. Infiltration basins areoften utilized in urban environments to recharge storm-water to the aquifer. As a result of localized rechargebeneath these basins, mound formation may reduce thethickness of the unsaturated zone available to filterpollutants and may reduce the infiltration rate of thebasin. Understanding the effects of various physicalfactors on water-table mound formation is important forinfiltration basin siting. For sandy loam and loamy sandsubsurface materials, mound heights increased as thethickness of both the unsaturated and saturated zonesdecreased. Mound heights increased as the initial soilmoisture, basin size and ponding depth increased. Athin sedimentation layer on the basin floor delayedmound formation, but only slightly decreased the
maximum mound height. This analysis could be usedin future selection of infiltration basin locations; how-ever, the analysis is limited to conditions that representonly a select range of basin design conditions andparameters typical of a glacial till environment inWisconsin, USA.
Key words Urban groundwater . Numerical modeling .Groundwater management . Stormwater . USA
Introduction
Proper design, installation, and management of infiltrationbasins require an understanding of the effect of soil andaquifer parameters on the height and shape of the water-table mound beneath the basin. Once understood, infiltra-tion basins can be designed and sited to maintain properinfiltration rates and minimize potential water-tableimpacts.
Limited field-scale observations are available in theliterature that addresses the effects of subsurface hydraulicparameters that affect water-table mounding beneath urbaninfiltration basins. Numerical analysis has also beenlimited in this context. Analytical solutions for predictingwater-table mound development are available. For exam-ple, Hantush (1967) solved the linearized form of thesaturated, radial, water-table flow equation, subject toinfiltration from a rectangular or circular area. Thesolution was for transient water-table mound developmentbeneath a recharge area with a constant rate of infiltration,and required inputs of saturated hydraulic conductivity,storativity, and initial saturated zone thickness. The mostsignificant sources of error with analytical solutionsinvolve unsaturated zone storage, the assumption ofhomogeneous conditions, and neglect of transient floweffects (NDWRCDP 2005). Numerical models can over-come these limitations; however, the added complexityrequires additional site-specific data. Predictions formound height have generally been much higher withanalytical methods compared to numerical methods due tounsaturated zone effects unaccounted for with analyticalmodels (NDWRCDP 2005). Since over estimation of
Received: 5 November 2008 /Accepted: 14 September 2009Published online: 16 October 2009
* Springer-Verlag 2009
A. Thompson ())Department of Biological Systems Engineering,University of Wisconsin - Madison,230 Ag. Eng. Building, 460 Henry Mall, Madison, WI 53706, USAe-mail: [email protected].: +1-608-2620604Fax: +1-608-2621228
M. NimmerFoth Infrastructure and Environment,LLC, 2737 South Ridge Road, Suite 600, Green Bay,WI 54307, USAe-mail: [email protected]
D. MisraDepartment of Mining and Geological Engineering,University of Alaska Fairbanks,PO Box 755800, Fairbanks, AK 99775, USAe-mail: [email protected]
Hydrogeology Journal (2010) 18: 501–508 DOI 10.1007/s10040-009-0532-1
mound height can have basin siting implications, predic-tion of mound formation may best be achieved throughnumerical simulation.
The overall goal of this study was to use a previouslycalibrated numerical water-table model (Nimmer 2008;Nimmer et al. 2009) and conduct variational analysis ofselected critical design parameters that constrain infiltra-tion basin siting conditions to minimize water-tablemounding. The calibrated HYDRUS-2D model was usedto study the effect of hydraulic conductivity, unsaturatedand saturated aquifer thickness, initial moisture content,anisotropy, ponding depth, basin size, and sedimentationlayer thickness on mound height. In doing so, for a limitedset of basin and aquifer parameters, guidance is providedon infiltration basin-siting conditions to minimize water-table mounding. This study is applicable to a glacial tillenvironment common in Wisconsin, and while the generalfindings of this study may be useful for site selection, asite-specific analysis should be performed for basin sitingand sizing decisions in other situations.
Methodology
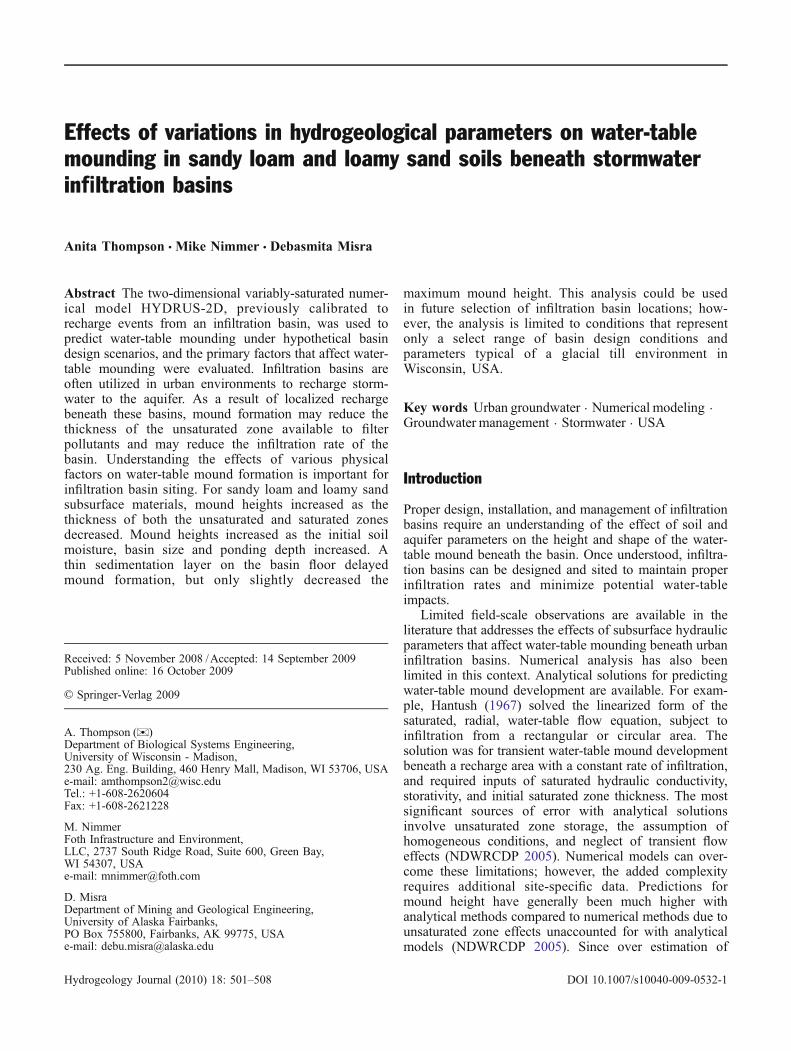
Infiltration basin design parametersIn this study, the numerical model HYDRUS-2D (HYD-RUS 2006; Simunek 2006) was used to determine theeffects of different basin designs, aquifer characteristics,and basin loading conditions on mound height (Fig. 1).Guidelines for this evaluation were taken from theWisconsin Department of Natural Resources (WDNR)Infiltration Basin Standard 1003 (Wisconsin Departmentof Natural Resources 2004a) and Site Evaluation forStormwater Infiltration Standard 1002 (Wisconsin Depart-ment of Natural Resources 2004b), and in consultationwith Mr. Roger Bannerman, WDNR Water ResourcesManagement Specialist (R. Bannerman, WDNR, personalcommunication, 2007).
Two infiltration basin sizes were modeled that weresuggested by the WDNR as representative of typicalinfiltration basin devices in Wisconsin, USA. A45.7 m × 45.7 m (150 ft × 150 ft) basin represented atypical infiltration basin size serving a residential develop-ment. A 9.15 m × 9.15 m (30 ft × 30 ft) basin representeda typical rain garden size. Three ponding depths typical ofinfiltration basins were used: 0.15, 0.305, and 0.61 m. The0.61 m depth is the maximum ponding depth allowedaccording to the WDNR Standard 1003.
Two different subsurface materials, a sandy loam and aloamy sand, were used in the model. These materials arecommonly encountered in areas of Wisconsin whereinfiltration basins are being constructed. The effects ofheterogeneity were not studied, as the addition ofheterogeneous material would be arbitrary and difficultto reproduce across all the model domains created.Thicknesses of 1.52, 3.05, and 6.09 m were used for boththe unsaturated and saturated zones. Finally, two surfacesedimentation layer thicknesses (0.0 and 7.62 cm) wereused to simulate the deposition of influent sediment that
will likely occur over the life of a basin. A loam materialwas used for the sedimentation layer. The total number ofmodel simulations was 216.
Model selection and designHYDRUS-2D, a two-dimensional, finite element, varia-bly-saturated flow and contaminant transport model, wasused to simulate water movement through the unsaturatedzone and saturated aquifer system (Simunek 2006).HYDRUS was selected because: (1) it was designedspecifically for infiltration and recharge simulation in thevariably-saturated flow regime, (2) it contains an extensivedatabase of unsaturated soil hydraulic parameters, and (3)it contains a robust parameter estimation technique forinverse estimation of soil hydraulic parameters.
The governing equation for water flow throughvariably-saturated porous media that HYDRUS solvesusing a Galerkin-type linear finite element scheme is amodified version of Richards equation (Richards 1931).The two-dimensional flow of water in a variably-saturatedrigid porous medium is given by the following mixedform of the Richards equation (HYDRUS 2006; Celia etal. 1990):
@q@t
¼ @
@xiK KijA
@h
@xjþ KizA
� �� �� S ð1Þ
where θ is the volumetric soil water content (L3/L3); t istime (T); h is the pressure head (L); S is a sink term (e.g.,root water uptake; L3/L3 × T); xi and xj are spatialcoordinates (L), Kij
A and KizA are components of the
dimensionless anisotropy tensor KA; and K is theunsaturated hydraulic conductivity function [K(h) = KsKr(h)] (L/T) where Ks is the saturated hydraulicconductivity (L/T), and Kr is the relative hydraulicconductivity.
A potential limitation with a two-dimensional profilemodel is the assumption that flow occurs parallel to theprofile, and that there is no component of flow at an angleto the profile. Therefore, if the modeled profile is notoriented in the direction of flow, errors will occur since theflow at an angle to the profile will be unaccounted for. Itis, therefore, anticipated that a two-dimensional modelwould produce a slight over-estimation of mound heightcompared to a three-dimensional model.
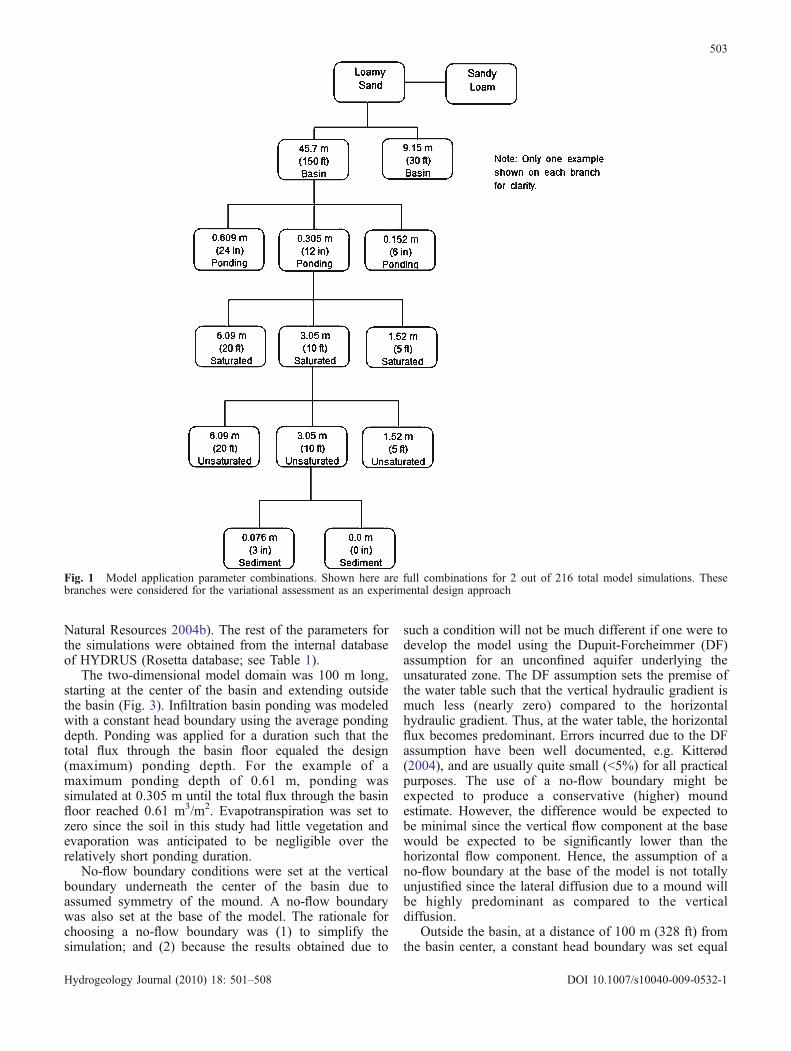
In a previous article that was a rudimentary componentof this study (Nimmer 2008; Nimmer et al. 2009),HYDRUS-2D was calibrated and evaluated using water-table elevation data collected from within and surroundinga 1,000-m2 infiltration basin in Oconomowoc, Wisconsin(Fig. 2). The calibrated model showed that the errorsassociated with the two-dimensional model design wereinsignificant. Hence, the same HYDRUS model designwas used as the basis for the study herein.
The saturated hydraulic conductivities of the loamysand and sandy loam used in this study were taken fromthe WDNR standard 1002 (Wisconsin Department of
502
Hydrogeology Journal (2010) 18: 501–508 DOI 10.1007/s10040-009-0532-1
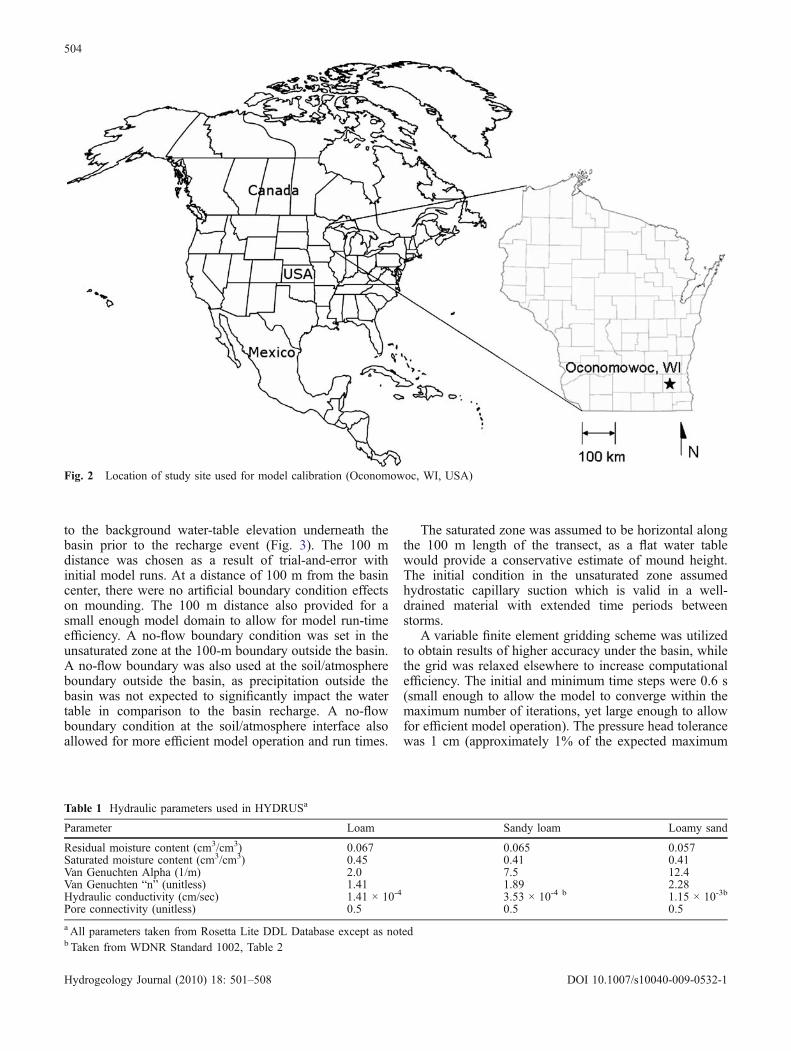
Natural Resources 2004b). The rest of the parameters forthe simulations were obtained from the internal databaseof HYDRUS (Rosetta database; see Table 1).
The two-dimensional model domain was 100 m long,starting at the center of the basin and extending outsidethe basin (Fig. 3). Infiltration basin ponding was modeledwith a constant head boundary using the average pondingdepth. Ponding was applied for a duration such that thetotal flux through the basin floor equaled the design(maximum) ponding depth. For the example of amaximum ponding depth of 0.61 m, ponding wassimulated at 0.305 m until the total flux through the basinfloor reached 0.61 m3/m2. Evapotranspiration was set tozero since the soil in this study had little vegetation andevaporation was anticipated to be negligible over therelatively short ponding duration.
No-flow boundary conditions were set at the verticalboundary underneath the center of the basin due toassumed symmetry of the mound. A no-flow boundarywas also set at the base of the model. The rationale forchoosing a no-flow boundary was (1) to simplify thesimulation; and (2) because the results obtained due to
such a condition will not be much different if one were todevelop the model using the Dupuit-Forcheimmer (DF)assumption for an unconfined aquifer underlying theunsaturated zone. The DF assumption sets the premise ofthe water table such that the vertical hydraulic gradient ismuch less (nearly zero) compared to the horizontalhydraulic gradient. Thus, at the water table, the horizontalflux becomes predominant. Errors incurred due to the DFassumption have been well documented, e.g. Kitterød(2004), and are usually quite small (<5%) for all practicalpurposes. The use of a no-flow boundary might beexpected to produce a conservative (higher) moundestimate. However, the difference would be expected tobe minimal since the vertical flow component at the basewould be expected to be significantly lower than thehorizontal flow component. Hence, the assumption of ano-flow boundary at the base of the model is not totallyunjustified since the lateral diffusion due to a mound willbe highly predominant as compared to the verticaldiffusion.
Outside the basin, at a distance of 100 m (328 ft) fromthe basin center, a constant head boundary was set equal
Fig. 1 Model application parameter combinations. Shown here are full combinations for 2 out of 216 total model simulations. Thesebranches were considered for the variational assessment as an experimental design approach
503
Hydrogeology Journal (2010) 18: 501–508 DOI 10.1007/s10040-009-0532-1
to the background water-table elevation underneath thebasin prior to the recharge event (Fig. 3). The 100 mdistance was chosen as a result of trial-and-error withinitial model runs. At a distance of 100 m from the basincenter, there were no artificial boundary condition effectson mounding. The 100 m distance also provided for asmall enough model domain to allow for model run-timeefficiency. A no-flow boundary condition was set in theunsaturated zone at the 100-m boundary outside the basin.A no-flow boundary was also used at the soil/atmosphereboundary outside the basin, as precipitation outside thebasin was not expected to significantly impact the watertable in comparison to the basin recharge. A no-flowboundary condition at the soil/atmosphere interface alsoallowed for more efficient model operation and run times.
The saturated zone was assumed to be horizontal alongthe 100 m length of the transect, as a flat water tablewould provide a conservative estimate of mound height.The initial condition in the unsaturated zone assumedhydrostatic capillary suction which is valid in a well-drained material with extended time periods betweenstorms.
A variable finite element gridding scheme was utilizedto obtain results of higher accuracy under the basin, whilethe grid was relaxed elsewhere to increase computationalefficiency. The initial and minimum time steps were 0.6 s(small enough to allow the model to converge within themaximum number of iterations, yet large enough to allowfor efficient model operation). The pressure head tolerancewas 1 cm (approximately 1% of the expected maximum
Fig. 2 Location of study site used for model calibration (Oconomowoc, WI, USA)
Table 1 Hydraulic parameters used in HYDRUSa
Parameter Loam Sandy loam Loamy sand
Residual moisture content (cm3/cm3) 0.067 0.065 0.057Saturated moisture content (cm3/cm3) 0.45 0.41 0.41Van Genuchten Alpha (1/m) 2.0 7.5 12.4Van Genuchten “n” (unitless) 1.41 1.89 2.28Hydraulic conductivity (cm/sec) 1.41 × 10⁻⁴ 3.53 × 10⁻⁴ b 1.15 × 10⁻³b
Pore connectivity (unitless) 0.5 0.5 0.5
a All parameters taken from Rosetta Lite DDL Database except as notedb Taken from WDNR Standard 1002, Table 2
504
Hydrogeology Journal (2010) 18: 501–508 DOI 10.1007/s10040-009-0532-1
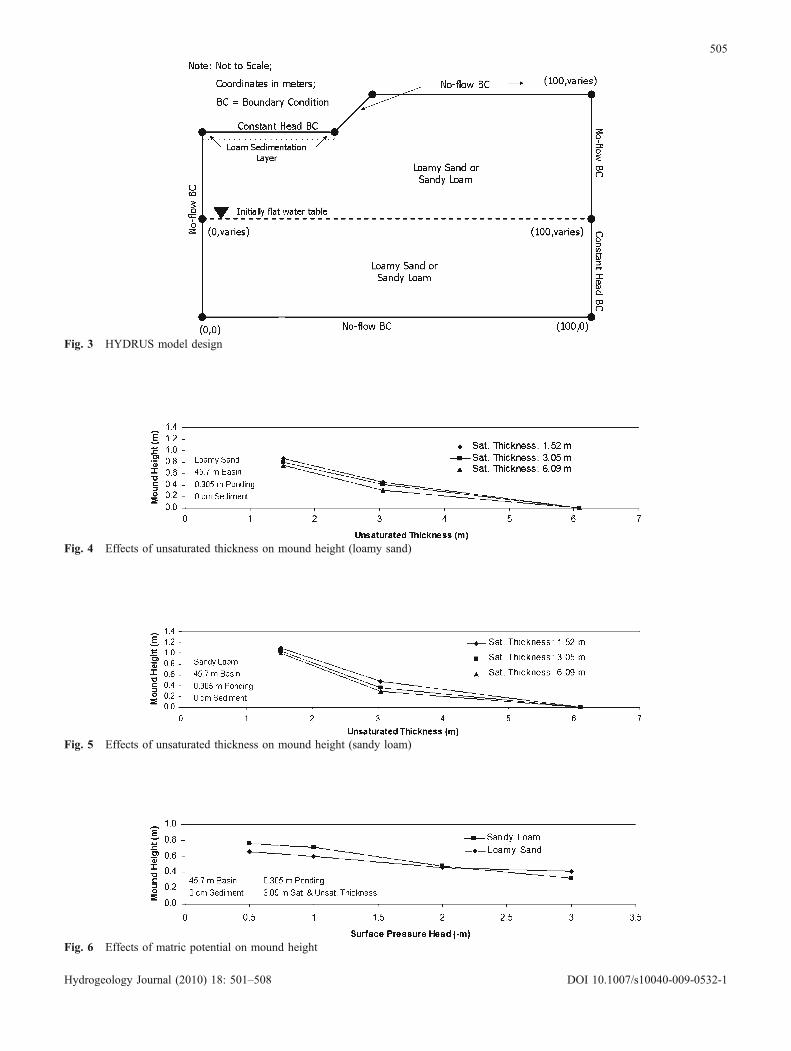
Fig. 6 Effects of matric potential on mound height
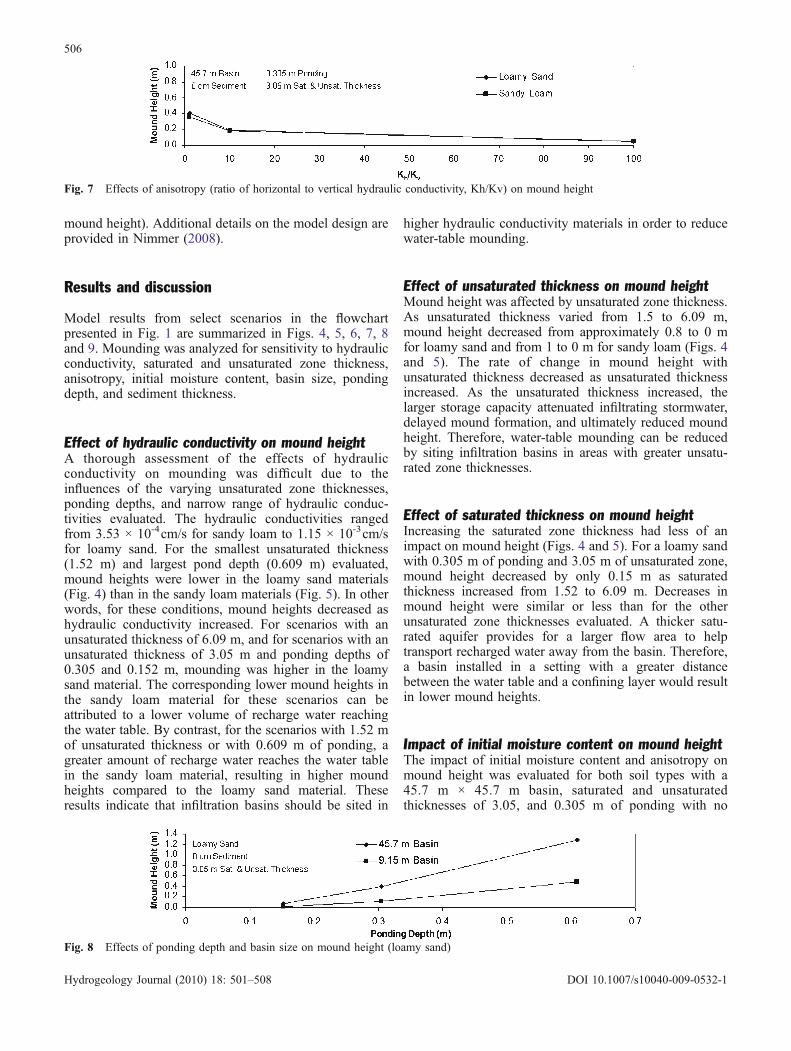
Fig. 5 Effects of unsaturated thickness on mound height (sandy loam)
Fig. 4 Effects of unsaturated thickness on mound height (loamy sand)
Fig. 3 HYDRUS model design
505
Hydrogeology Journal (2010) 18: 501–508 DOI 10.1007/s10040-009-0532-1
mound height). Additional details on the model design areprovided in Nimmer (2008).
Results and discussion
Model results from select scenarios in the flowchartpresented in Fig. 1 are summarized in Figs. 4, 5, 6, 7, 8and 9. Mounding was analyzed for sensitivity to hydraulicconductivity, saturated and unsaturated zone thickness,anisotropy, initial moisture content, basin size, pondingdepth, and sediment thickness.
Effect of hydraulic conductivity on mound heightA thorough assessment of the effects of hydraulicconductivity on mounding was difficult due to theinfluences of the varying unsaturated zone thicknesses,ponding depths, and narrow range of hydraulic conduc-tivities evaluated. The hydraulic conductivities rangedfrom 3.53 × 10⁻⁴cm/s for sandy loam to 1.15 × 10⁻³cm/sfor loamy sand. For the smallest unsaturated thickness(1.52 m) and largest pond depth (0.609 m) evaluated,mound heights were lower in the loamy sand materials(Fig. 4) than in the sandy loam materials (Fig. 5). In otherwords, for these conditions, mound heights decreased ashydraulic conductivity increased. For scenarios with anunsaturated thickness of 6.09 m, and for scenarios with anunsaturated thickness of 3.05 m and ponding depths of0.305 and 0.152 m, mounding was higher in the loamysand material. The corresponding lower mound heights inthe sandy loam material for these scenarios can beattributed to a lower volume of recharge water reachingthe water table. By contrast, for the scenarios with 1.52 mof unsaturated thickness or with 0.609 m of ponding, agreater amount of recharge water reaches the water tablein the sandy loam material, resulting in higher moundheights compared to the loamy sand material. Theseresults indicate that infiltration basins should be sited in
higher hydraulic conductivity materials in order to reducewater-table mounding.
Effect of unsaturated thickness on mound heightMound height was affected by unsaturated zone thickness.As unsaturated thickness varied from 1.5 to 6.09 m,mound height decreased from approximately 0.8 to 0 mfor loamy sand and from 1 to 0 m for sandy loam (Figs. 4and 5). The rate of change in mound height withunsaturated thickness decreased as unsaturated thicknessincreased. As the unsaturated thickness increased, thelarger storage capacity attenuated infiltrating stormwater,delayed mound formation, and ultimately reduced moundheight. Therefore, water-table mounding can be reducedby siting infiltration basins in areas with greater unsatu-rated zone thicknesses.
Effect of saturated thickness on mound heightIncreasing the saturated zone thickness had less of animpact on mound height (Figs. 4 and 5). For a loamy sandwith 0.305 m of ponding and 3.05 m of unsaturated zone,mound height decreased by only 0.15 m as saturatedthickness increased from 1.52 to 6.09 m. Decreases inmound height were similar or less than for the otherunsaturated zone thicknesses evaluated. A thicker satu-rated aquifer provides for a larger flow area to helptransport recharged water away from the basin. Therefore,a basin installed in a setting with a greater distancebetween the water table and a confining layer would resultin lower mound heights.
Impact of initial moisture content on mound heightThe impact of initial moisture content and anisotropy onmound height was evaluated for both soil types with a45.7 m × 45.7 m basin, saturated and unsaturatedthicknesses of 3.05, and 0.305 m of ponding with no
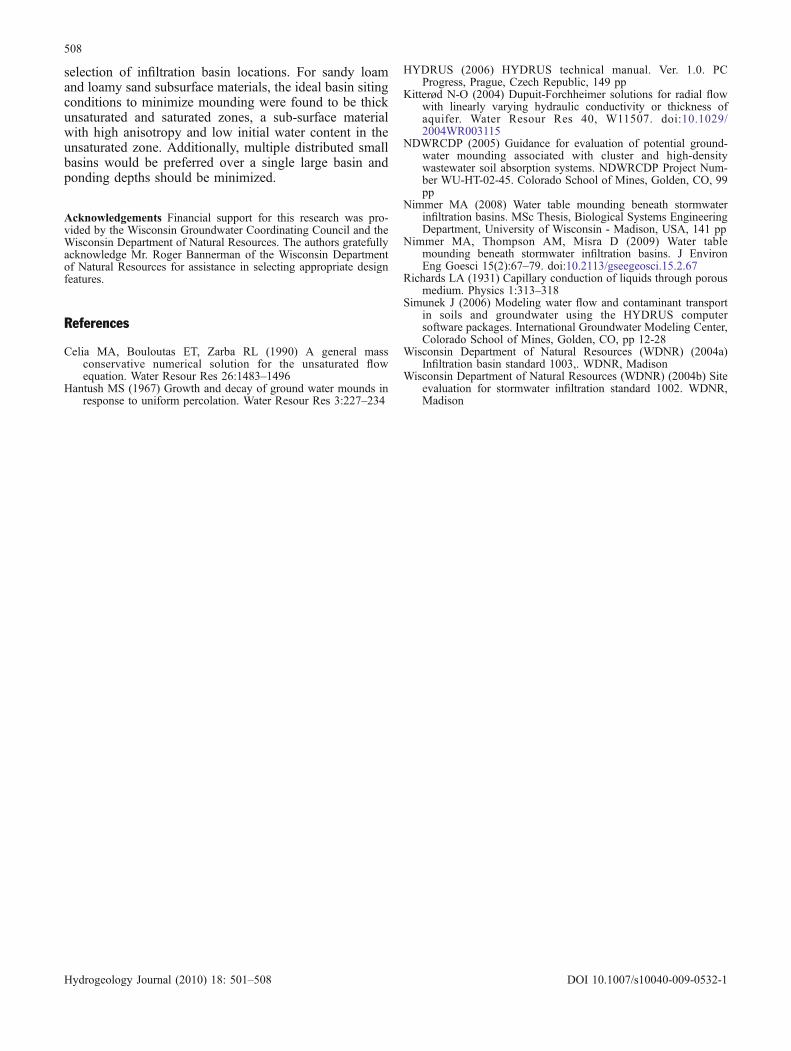
Fig. 7 Effects of anisotropy (ratio of horizontal to vertical hydraulic conductivity, Kh/Kv) on mound height
Fig. 8 Effects of ponding depth and basin size on mound height (loamy sand)
506
Hydrogeology Journal (2010) 18: 501–508 DOI 10.1007/s10040-009-0532-1
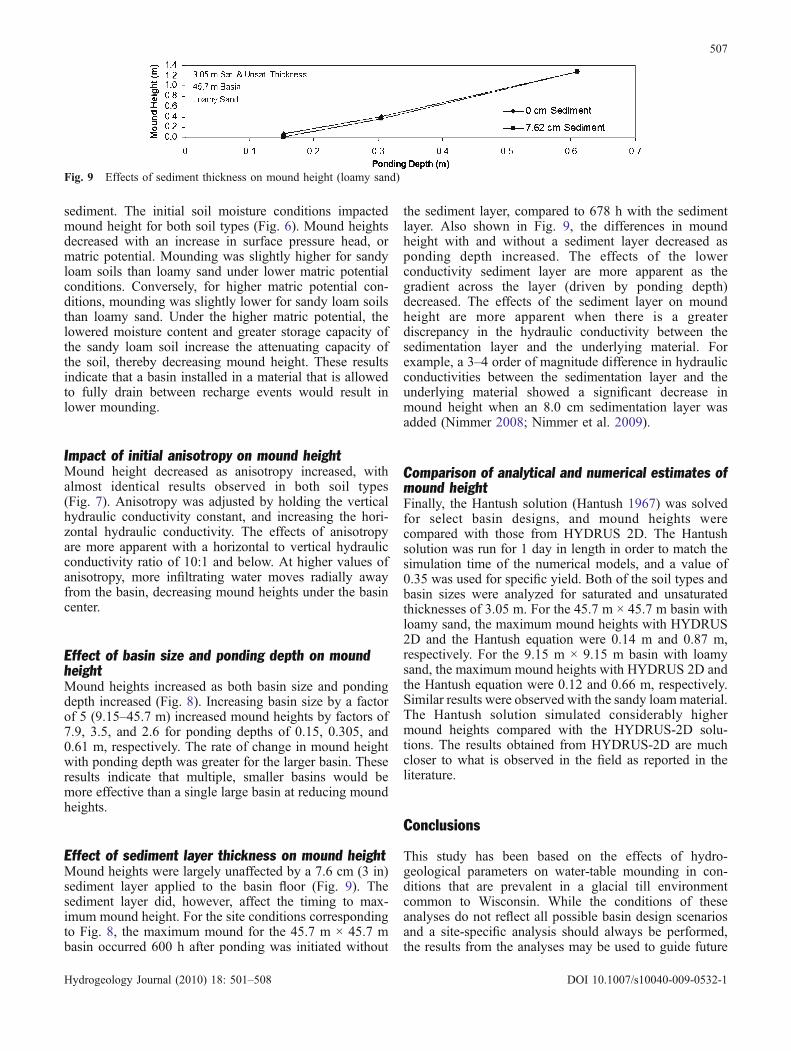
sediment. The initial soil moisture conditions impactedmound height for both soil types (Fig. 6). Mound heightsdecreased with an increase in surface pressure head, ormatric potential. Mounding was slightly higher for sandyloam soils than loamy sand under lower matric potentialconditions. Conversely, for higher matric potential con-ditions, mounding was slightly lower for sandy loam soilsthan loamy sand. Under the higher matric potential, thelowered moisture content and greater storage capacity ofthe sandy loam soil increase the attenuating capacity ofthe soil, thereby decreasing mound height. These resultsindicate that a basin installed in a material that is allowedto fully drain between recharge events would result inlower mounding.
Impact of initial anisotropy on mound heightMound height decreased as anisotropy increased, withalmost identical results observed in both soil types(Fig. 7). Anisotropy was adjusted by holding the verticalhydraulic conductivity constant, and increasing the hori-zontal hydraulic conductivity. The effects of anisotropyare more apparent with a horizontal to vertical hydraulicconductivity ratio of 10:1 and below. At higher values ofanisotropy, more infiltrating water moves radially awayfrom the basin, decreasing mound heights under the basincenter.
Effect of basin size and ponding depth on moundheightMound heights increased as both basin size and pondingdepth increased (Fig. 8). Increasing basin size by a factorof 5 (9.15–45.7 m) increased mound heights by factors of7.9, 3.5, and 2.6 for ponding depths of 0.15, 0.305, and0.61 m, respectively. The rate of change in mound heightwith ponding depth was greater for the larger basin. Theseresults indicate that multiple, smaller basins would bemore effective than a single large basin at reducing moundheights.
Effect of sediment layer thickness on mound heightMound heights were largely unaffected by a 7.6 cm (3 in)sediment layer applied to the basin floor (Fig. 9). Thesediment layer did, however, affect the timing to max-imum mound height. For the site conditions correspondingto Fig. 8, the maximum mound for the 45.7 m × 45.7 mbasin occurred 600 h after ponding was initiated without
the sediment layer, compared to 678 h with the sedimentlayer. Also shown in Fig. 9, the differences in moundheight with and without a sediment layer decreased asponding depth increased. The effects of the lowerconductivity sediment layer are more apparent as thegradient across the layer (driven by ponding depth)decreased. The effects of the sediment layer on moundheight are more apparent when there is a greaterdiscrepancy in the hydraulic conductivity between thesedimentation layer and the underlying material. Forexample, a 3–4 order of magnitude difference in hydraulicconductivities between the sedimentation layer and theunderlying material showed a significant decrease inmound height when an 8.0 cm sedimentation layer wasadded (Nimmer 2008; Nimmer et al. 2009).
Comparison of analytical and numerical estimates ofmound heightFinally, the Hantush solution (Hantush 1967) was solvedfor select basin designs, and mound heights werecompared with those from HYDRUS 2D. The Hantushsolution was run for 1 day in length in order to match thesimulation time of the numerical models, and a value of0.35 was used for specific yield. Both of the soil types andbasin sizes were analyzed for saturated and unsaturatedthicknesses of 3.05 m. For the 45.7 m × 45.7 m basin withloamy sand, the maximum mound heights with HYDRUS2D and the Hantush equation were 0.14 m and 0.87 m,respectively. For the 9.15 m × 9.15 m basin with loamysand, the maximum mound heights with HYDRUS 2D andthe Hantush equation were 0.12 and 0.66 m, respectively.Similar results were observed with the sandy loammaterial.The Hantush solution simulated considerably highermound heights compared with the HYDRUS-2D solu-tions. The results obtained from HYDRUS-2D are muchcloser to what is observed in the field as reported in theliterature.
Conclusions
This study has been based on the effects of hydro-geological parameters on water-table mounding in con-ditions that are prevalent in a glacial till environmentcommon to Wisconsin. While the conditions of theseanalyses do not reflect all possible basin design scenariosand a site-specific analysis should always be performed,the results from the analyses may be used to guide future
Fig. 9 Effects of sediment thickness on mound height (loamy sand)
507
Hydrogeology Journal (2010) 18: 501–508 DOI 10.1007/s10040-009-0532-1
selection of infiltration basin locations. For sandy loamand loamy sand subsurface materials, the ideal basin sitingconditions to minimize mounding were found to be thickunsaturated and saturated zones, a sub-surface materialwith high anisotropy and low initial water content in theunsaturated zone. Additionally, multiple distributed smallbasins would be preferred over a single large basin andponding depths should be minimized.
Acknowledgements Financial support for this research was pro-vided by the Wisconsin Groundwater Coordinating Council and theWisconsin Department of Natural Resources. The authors gratefullyacknowledge Mr. Roger Bannerman of the Wisconsin Departmentof Natural Resources for assistance in selecting appropriate designfeatures.
References
Celia MA, Bouloutas ET, Zarba RL (1990) A general massconservative numerical solution for the unsaturated flowequation. Water Resour Res 26:1483–1496
Hantush MS (1967) Growth and decay of ground water mounds inresponse to uniform percolation. Water Resour Res 3:227–234
HYDRUS (2006) HYDRUS technical manual. Ver. 1.0. PCProgress, Prague, Czech Republic, 149 pp
Kitterød N-O (2004) Dupuit-Forchheimer solutions for radial flowwith linearly varying hydraulic conductivity or thickness ofaquifer. Water Resour Res 40, W11507. doi:10.1029/2004WR003115
NDWRCDP (2005) Guidance for evaluation of potential ground-water mounding associated with cluster and high-densitywastewater soil absorption systems. NDWRCDP Project Num-ber WU-HT-02-45. Colorado School of Mines, Golden, CO, 99pp
Nimmer MA (2008) Water table mounding beneath stormwaterinfiltration basins. MSc Thesis, Biological Systems EngineeringDepartment, University of Wisconsin - Madison, USA, 141 pp
Nimmer MA, Thompson AM, Misra D (2009) Water tablemounding beneath stormwater infiltration basins. J EnvironEng Goesci 15(2):67–79. doi:10.2113/gseegeosci.15.2.67
Richards LA (1931) Capillary conduction of liquids through porousmedium. Physics 1:313–318
Simunek J (2006) Modeling water flow and contaminant transportin soils and groundwater using the HYDRUS computersoftware packages. International Groundwater Modeling Center,Colorado School of Mines, Golden, CO, pp 12-28
Wisconsin Department of Natural Resources (WDNR) (2004a)Infiltration basin standard 1003,. WDNR, Madison
Wisconsin Department of Natural Resources (WDNR) (2004b) Siteevaluation for stormwater infiltration standard 1002. WDNR,Madison
508
Hydrogeology Journal (2010) 18: 501–508 DOI 10.1007/s10040-009-0532-1