effects of traffic on tourism final report - land tirol · the effects of traffic on alpine tourism...
TRANSCRIPT

The Effects of Traffic on Alpine Tourism
An Empirical Analysisby
External Experts on behalf of MONITRAF
Prof. Dr. Harald Pechlaner Mag. Eva-Maria HammannEndowed Chair for Tourism Catholic University of Eichstätt-Ingolstadt
INTERREG IIIb “Alpine Space““Monitoring of road traffic related effects in the Alpine space and common measures”
Prof. Dr. Harald PechlanerMag. Eva-Maria Hammann
March 2006
Content
Theory
Aim of Study
Research Design
Study & Results
Conclusions
Appendices
Contact
References
2
Table of Contents
Table of contents ……………………………………………………………………………………………..…….…….………...…Aim & outline of the study …….………………………………………………………………………….……………….……….
Point of departure of the research project……………………………………………………….………...…….…Focus of the study………………………………………………………………………………………………..…………………
Theoretical background ……………..………………………………………………………………………………………………..Tourism as a system………………………………………………………………………………………………………………..Tourism and traffic – A tense relationship………………………………………………………….………………….Research questions…………………………………………………………………………………………………..…………...
Research Design……………………………………………………………………………………………………………………………..Description of the study program…………………………………………………………………………………………..
The qualitative study …….………………..………………………………………………………………………………...The quantitative study …..…………………………………………………………………………………………………..
Measuring tourist satisfaction……….……………………………………………………………………………………….The empirical study & results ……..……………………………………………………………………………………………….
Description of the sample ……………………………………………………………………………………………………….Positive & negative traffic related factors……………………………………………………………………………..Impact of (im)material costs on vacation……………………………………………………………………………….Impact of (im)material benefits on vacation………………………………………………………………………….
244688
131516161619202627293132
Prof. Dr. Harald PechlanerMag. Eva-Maria Hammann
March 2006
Content
Theory
Aim of Study
Research Design
Study & Results
Conclusions
Appendices
Contact
References
3
Table of Contents
Awareness of traffic…………………………………………………………………………………………………………………..Country difference in realization of traffic ……………………………………………………………………………..Correlation between traffic and tourism……………………………………………………………………………………Direct and indirect effects of traffic on tourism………………………………………………………………………Tourist satisfaction factors……………………………………………………………………………………………………….Importance of these factors……………………………………………………………………………………………………..Overall satisfaction……………………………………………………………………………………………………………………Tourist value map (Importance/performance ratio) ..…………………………………………………………….Traffic producers……………………………………………………………………………………………………………………….Country difference in acceptance of traffic………………………………………………………………………………Alternatives for road traffic………………………………………………………………………………………………………..Inhabitants’ attitude towards tourism ……………………………………………………………………………………..
Conclusions………………………………………………………………………………………………………………………………………..References………………………………………………………………………………………………………………………………………….Contact information……………………………………………………………………………………………………………………………Appendices……………………………………………………………………………………………………………………………………………
34353638414345464849505253575960
Prof. Dr. Harald PechlanerMag. Eva-Maria Hammann
March 2006
Content
Theory
Aim of Study
Research Design
Study & Results
Conclusions
Appendices
Contact
References
4
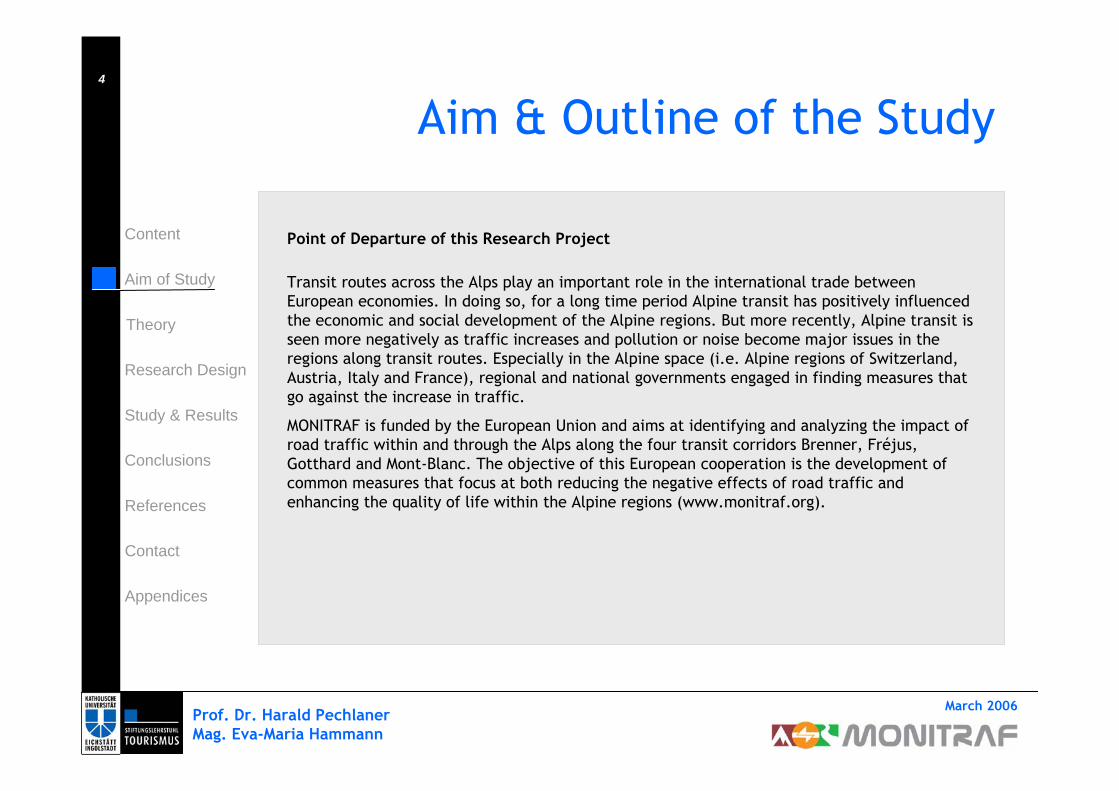
Aim & Outline of the Study
Point of Departure of this Research Project
Transit routes across the Alps play an important role in the international trade between European economies. In doing so, for a long time period Alpine transit has positively influenced the economic and social development of the Alpine regions. But more recently, Alpine transit is seen more negatively as traffic increases and pollution or noise become major issues in the regions along transit routes. Especially in the Alpine space (i.e. Alpine regions of Switzerland, Austria, Italy and France), regional and national governments engaged in finding measures that go against the increase in traffic.
MONITRAF is funded by the European Union and aims at identifying and analyzing the impact of road traffic within and through the Alps along the four transit corridors Brenner, Fréjus, Gotthard and Mont-Blanc. The objective of this European cooperation is the development of common measures that focus at both reducing the negative effects of road traffic and enhancing the quality of life within the Alpine regions (www.monitraf.org).
Prof. Dr. Harald PechlanerMag. Eva-Maria Hammann
March 2006
Content
Theory
Aim of Study
Research Design
Study & Results
Conclusions
Appendices
Contact
References
5
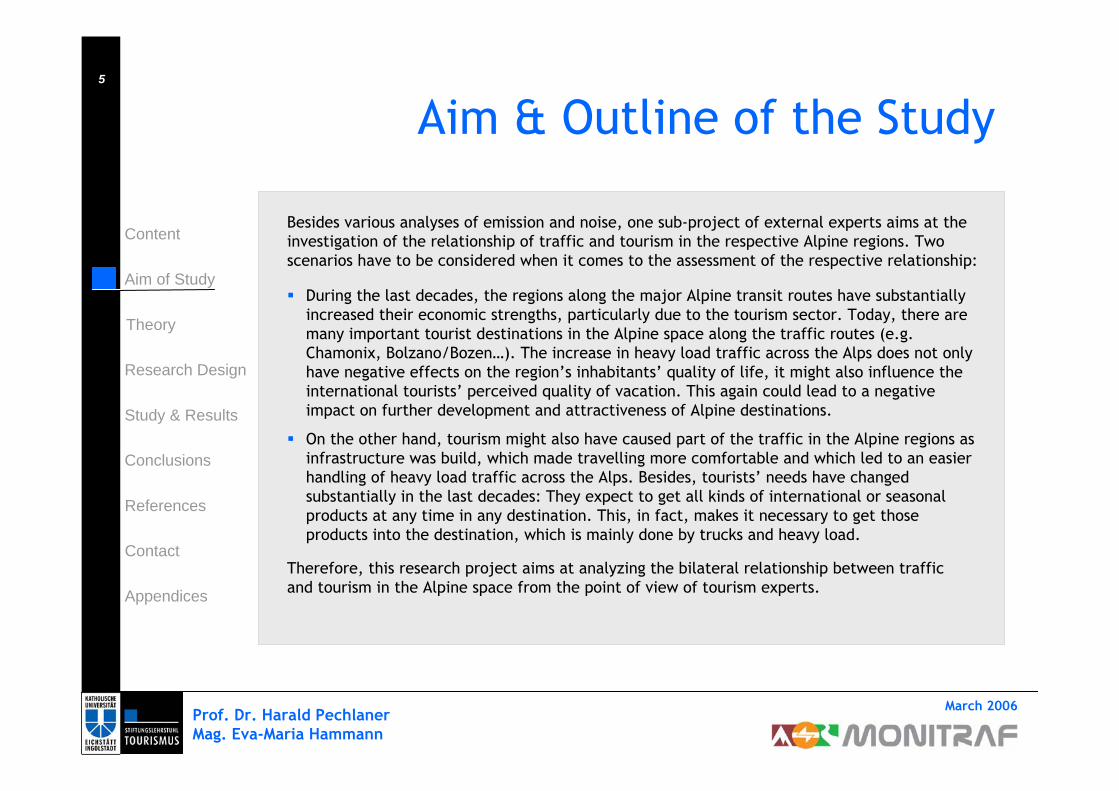
Aim & Outline of the Study
Besides various analyses of emission and noise, one sub-project of external experts aims at the investigation of the relationship of traffic and tourism in the respective Alpine regions. Two scenarios have to be considered when it comes to the assessment of the respective relationship:
During the last decades, the regions along the major Alpine transit routes have substantially increased their economic strengths, particularly due to the tourism sector. Today, there are many important tourist destinations in the Alpine space along the traffic routes (e.g. Chamonix, Bolzano/Bozen…). The increase in heavy load traffic across the Alps does not only have negative effects on the region’s inhabitants’ quality of life, it might also influence the international tourists’ perceived quality of vacation. This again could lead to a negative impact on further development and attractiveness of Alpine destinations.
On the other hand, tourism might also have caused part of the traffic in the Alpine regions as infrastructure was build, which made travelling more comfortable and which led to an easier handling of heavy load traffic across the Alps. Besides, tourists’ needs have changed substantially in the last decades: They expect to get all kinds of international or seasonal products at any time in any destination. This, in fact, makes it necessary to get those products into the destination, which is mainly done by trucks and heavy load.
Therefore, this research project aims at analyzing the bilateral relationship between trafficand tourism in the Alpine space from the point of view of tourism experts.
Prof. Dr. Harald PechlanerMag. Eva-Maria Hammann
March 2006
Content
Theory
Aim of Study
Research Design
Study & Results
Conclusions
Appendices
Contact
References
6
Aim & Outline of the Study
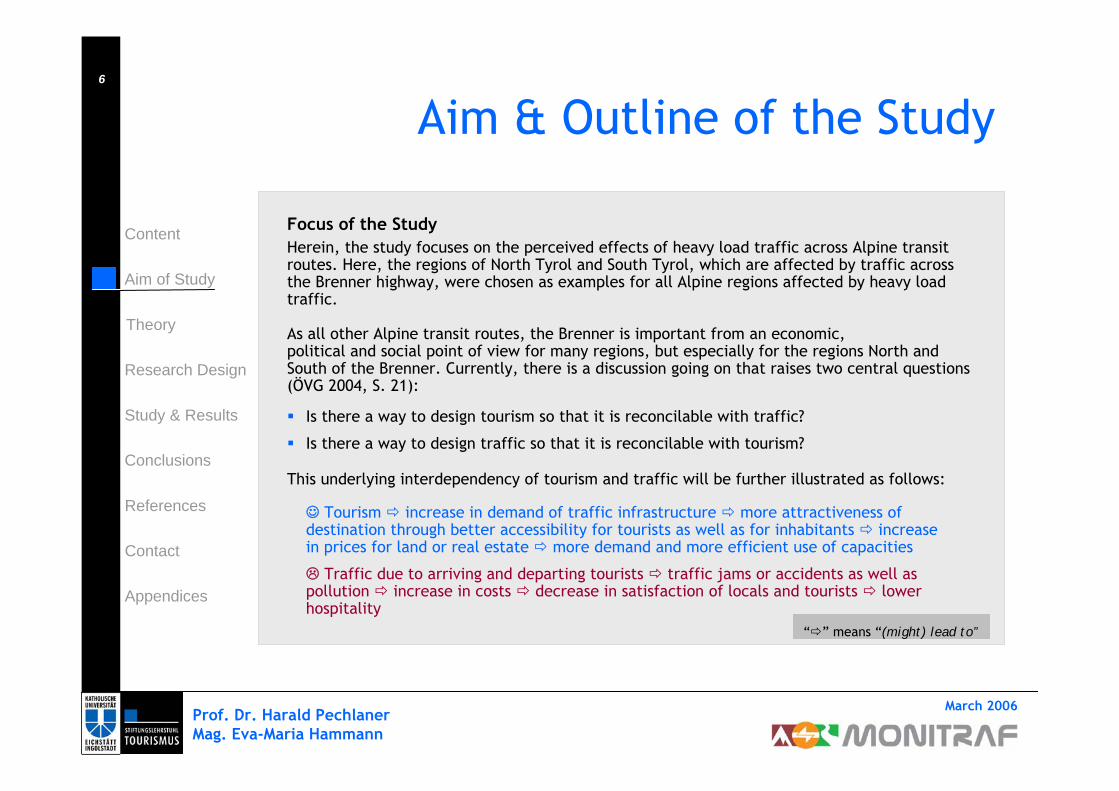
Focus of the StudyHerein, the study focuses on the perceived effects of heavy load traffic across Alpine transit routes. Here, the regions of North Tyrol and South Tyrol, which are affected by traffic across the Brenner highway, were chosen as examples for all Alpine regions affected by heavy load traffic.
As all other Alpine transit routes, the Brenner is important from an economic, political and social point of view for many regions, but especially for the regions North and South of the Brenner. Currently, there is a discussion going on that raises two central questions (ÖVG 2004, S. 21):
Is there a way to design tourism so that it is reconcilable with traffic?
Is there a way to design traffic so that it is reconcilable with tourism?
This underlying interdependency of tourism and traffic will be further illustrated as follows:
☺ Tourism increase in demand of traffic infrastructure more attractiveness of destination through better accessibility for tourists as well as for inhabitants increase in prices for land or real estate more demand and more efficient use of capacities
Traffic due to arriving and departing tourists traffic jams or accidents as well as pollution increase in costs decrease in satisfaction of locals and tourists lower hospitality
“ ” means “(might) lead to”
Prof. Dr. Harald PechlanerMag. Eva-Maria Hammann
March 2006
Content
Theory
Aim of Study
Research Design
Study & Results
Conclusions
Appendices
Contact
References
7
Aim & Outline of the Study
According to these considerations, the empirical study will be twofold:
First, a qualitative, explorative survey will be conducted in seven regions (i.e. South Tyrol, North Tyrol, Central Switzerland, Ticino, Aosta Valley, Rhone Alpes and Piedmont) along four Alpine transit routes (i.e. Brenner, Fréjus, Gotthard and Mont-Blanc), in which experts in tourism and traffic will be interviewed. They will be asked to share their thoughts concerning the correlation between tourism and traffic.Secondly, based on the results of the qualitative study a quantitative study will be conducted via a standardized questionnaire in order to get a profound and statistic-based understanding of the effects of traffic on tourism and vice versa. This study will focus on the relationship between tourism and traffic in considering North and South Tyrol (Brenner) as examples.
Therefore, tourism experts, business actors and public administration will be interviewed in this study in order to get a deeper insight in the perceived relationship of tourism and traffic. The design of the empirical study will be explained in detail in the “Research Design” section of this report.
But before the results of the qualitative and quantitative study are presented and discussed, some theoretical implications will be reflected that have already been debated in literature of tourism management.
Prof. Dr. Harald PechlanerMag. Eva-Maria Hammann
March 2006
Content
Theory
Aim of Study
Research Design
Study & Results
Conclusions
Appendices
Contact
References
8
Theoretical Background
Tourism as a System
Tourism can be characterized as a very vivid and dynamic business sector. From a market- and customer-based perspective, changes in the tourism industry due to globalization have become major challenges for tourist destinations all over the world. As tourists nowadays have the experience and ability to compare products and services on a global scale, business actors have to develop unique and highly specialized products and services that create additional value for the customer or tourist compared to competing firms.
Apart from the economic aspect, tourism is an important cultural and social factor (see Pechlaner/Tschurtschentaler 2003; Hinterhuber/Pechlaner/Matzler 2001; Steinecke 2000; Bieger2002; Bieger/von Rohr 2000). Various regions “survived“ just because jobs could be preserved or even generated in the tourism business sector. From a cultural point of view, tourism leads to an exchange of cultures and traditions as people make experiences in one place and take their impressions and experiences to another place.
Evidently, tourism has many facets and has to be seen as a system that integrates many different elements.
In Figure 1 on the next page the concept of tourism as a system is illustrated.

Prof. Dr. Harald PechlanerMag. Eva-Maria Hammann
March 2006
Content
Theory
Aim of Study
Research Design
Study & Results
Conclusions
Appendices
Contact
References
9
Theoretical Background
Destination
TrafficTour
OperatorsTechnology
Economy
Politics
Society
Demand
Figure 1: Tourism as a System (Source: Bieger 2004)
Ecology

Prof. Dr. Harald PechlanerMag. Eva-Maria Hammann
March 2006
Content
Theory
Aim of Study
Research Design
Study & Results
Conclusions
Appendices
Contact
References
10
Theoretical Background
As can be seen in Figure 1, tourism is best described as a network system. This network consists of four parts:
DestinationTour Operators/ Travel AgenciesDemandTraffic
The entire system is based on the interaction of the following components with their environment (see Bieger 2004):
EconomyTechnologySocietyEcologyPolitics
It is important to note that these elements influence each other equally. Consequently, if the conditions of one element change all other elements as well as the entire system might be affected (e.g. technological advances lead to the implementation of new reservation tools of travel agencies).

Prof. Dr. Harald PechlanerMag. Eva-Maria Hammann
March 2006
Content
Theory
Aim of Study
Research Design
Study & Results
Conclusions
Appendices
Contact
References
11
Theoretical Background
As the focus of this study is on the effects of (heavy load) traffic on tourism, only the subsystem “traffic” is described in more detail.* The relationship between tourism and traffic has quite often been described as ambivalent. Generally speaking, tourism depends on a good infrastructure, i.e. well-built highways and streets, while traffic is one of those factors that have a great potential to influence tourism.Figure 2 indicates the relationship between tourism and traffic:
* Further information concerning the different subsystems can be attained in the Qualitative Report.
Tourism Traffic
Figure 2: Relationship between tourism and traffic
Prof. Dr. Harald PechlanerMag. Eva-Maria Hammann
March 2006
Content
Theory
Aim of Study
Research Design
Study & Results
Conclusions
Appendices
Contact
References
12
Theoretical Background
Traffic is defined as the total of all translocations of people and goods. Overall, it is about objects that are transported (e.g. passenger transportation, transport of goods) from and to some kind of area (e.g. short- or long-distance traffic) by any means of transportation (e.g. car, bus, train, plane, or ship) for a reason (e.g. leisure- or business-related traffic).
From a tourism perspective, there is a distinction between traffic from or to a destination and the traffic within a destination (Bieger 2004). While cars are still the primary means of transportation to/from destinations, there are quite some possibilities to influence tourists’departures and arrivals, i.e.
by offering specific service packages (e.g. concert tickets plus free use of public transportation), by implementing price control mechanisms (e.g. offers of low-cost airlines),by offering certain services, such as car rental.
When it comes to traffic within destinations (e.g. distance between someone’s hotel to the next ski-lift), there are also ways to influence traffic, for example
by restructuring the destination in the way that distances between tourist attraction points are limited to a minimum,by changing arrival habits (e.g. day of arrival at hotels is Sunday instead of Saturday),by making public transportation more attractive,by providing alternatives for car use, e.g. through the installation of foot and bike paths.
Prof. Dr. Harald PechlanerMag. Eva-Maria Hammann
March 2006
Content
Theory
Aim of Study
Research Design
Study & Results
Conclusions
Appendices
Contact
References
13
Theoretical Background
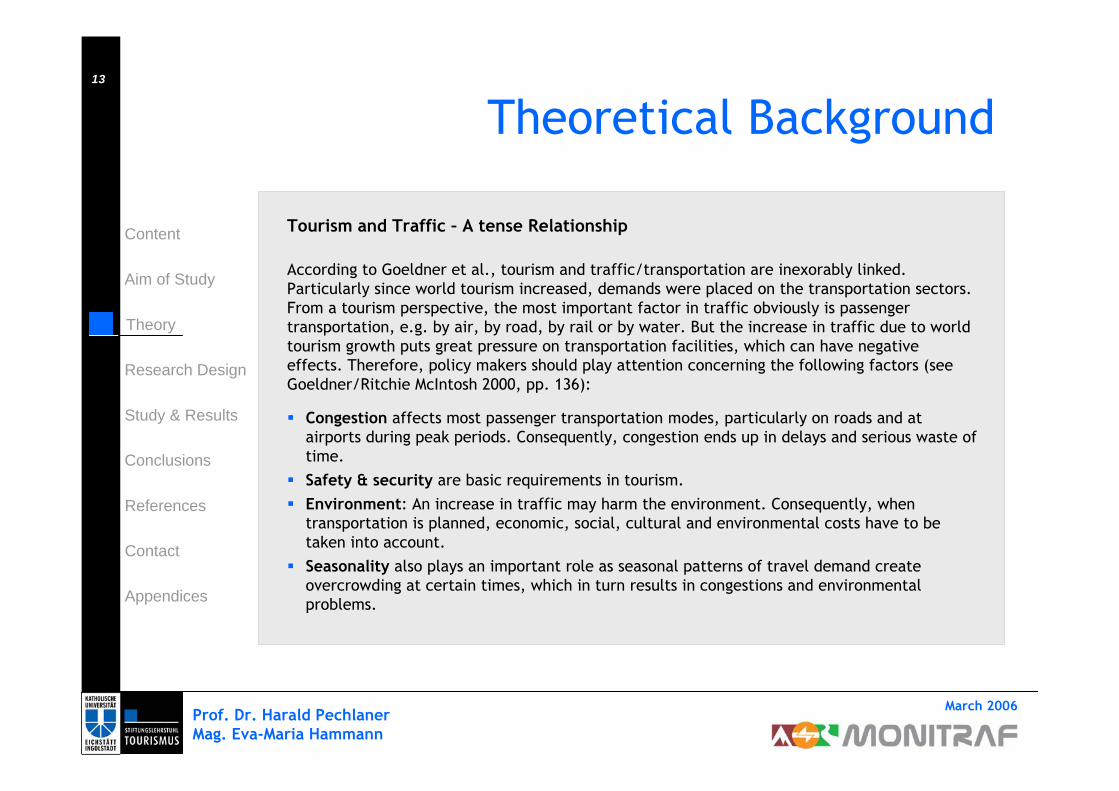
Tourism and Traffic – A tense Relationship
According to Goeldner et al., tourism and traffic/transportation are inexorably linked. Particularly since world tourism increased, demands were placed on the transportation sectors. From a tourism perspective, the most important factor in traffic obviously is passenger transportation, e.g. by air, by road, by rail or by water. But the increase in traffic due to world tourism growth puts great pressure on transportation facilities, which can have negative effects. Therefore, policy makers should play attention concerning the following factors (see Goeldner/Ritchie McIntosh 2000, pp. 136):
Congestion affects most passenger transportation modes, particularly on roads and at airports during peak periods. Consequently, congestion ends up in delays and serious waste of time.Safety & security are basic requirements in tourism.Environment: An increase in traffic may harm the environment. Consequently, when transportation is planned, economic, social, cultural and environmental costs have to be taken into account. Seasonality also plays an important role as seasonal patterns of travel demand create overcrowding at certain times, which in turn results in congestions and environmental problems.
Prof. Dr. Harald PechlanerMag. Eva-Maria Hammann
March 2006
Content
Theory
Aim of Study
Research Design
Study & Results
Conclusions
Appendices
Contact
References
14
Theoretical Background
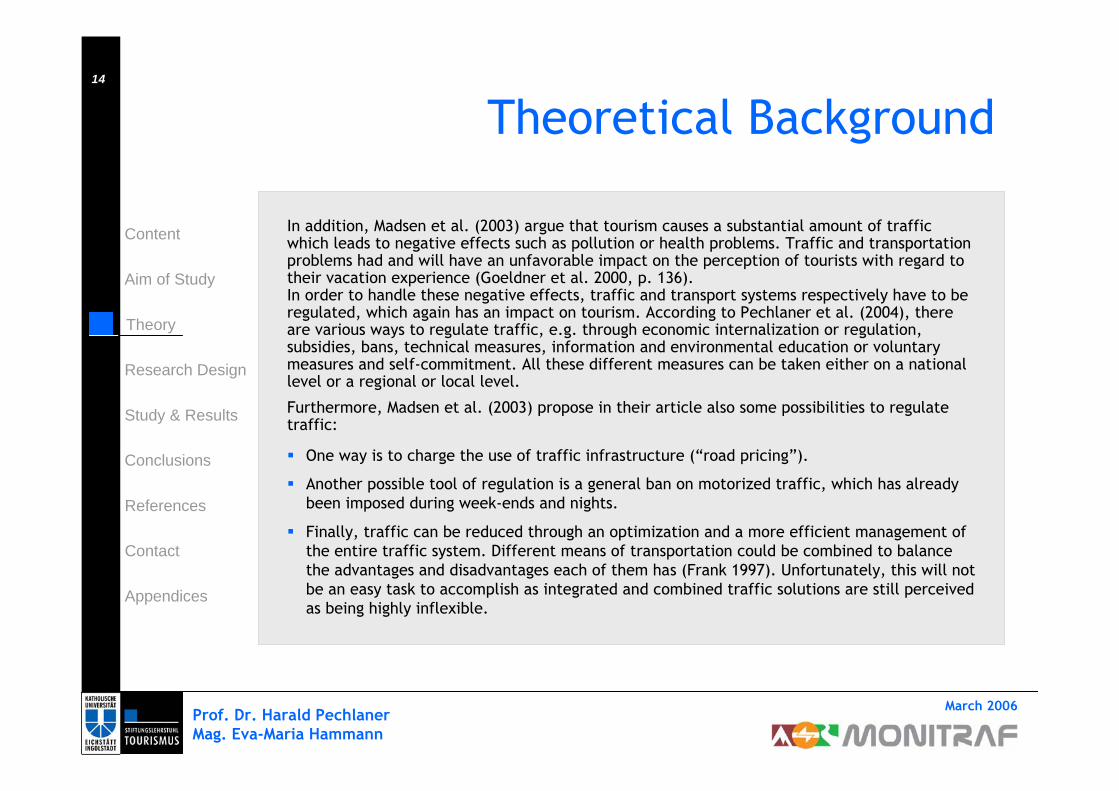
In addition, Madsen et al. (2003) argue that tourism causes a substantial amount of traffic which leads to negative effects such as pollution or health problems. Traffic and transportation problems had and will have an unfavorable impact on the perception of tourists with regard to their vacation experience (Goeldner et al. 2000, p. 136).In order to handle these negative effects, traffic and transport systems respectively have to be regulated, which again has an impact on tourism. According to Pechlaner et al. (2004), there are various ways to regulate traffic, e.g. through economic internalization or regulation, subsidies, bans, technical measures, information and environmental education or voluntary measures and self-commitment. All these different measures can be taken either on a national level or a regional or local level.
Furthermore, Madsen et al. (2003) propose in their article also some possibilities to regulate traffic:
One way is to charge the use of traffic infrastructure (“road pricing”).
Another possible tool of regulation is a general ban on motorized traffic, which has already been imposed during week-ends and nights.
Finally, traffic can be reduced through an optimization and a more efficient management of the entire traffic system. Different means of transportation could be combined to balance the advantages and disadvantages each of them has (Frank 1997). Unfortunately, this will not be an easy task to accomplish as integrated and combined traffic solutions are still perceived as being highly inflexible.
Prof. Dr. Harald PechlanerMag. Eva-Maria Hammann
March 2006
Content
Theory
Aim of Study
Research Design
Study & Results
Conclusions
Appendices
Contact
References
15
Theoretical Background
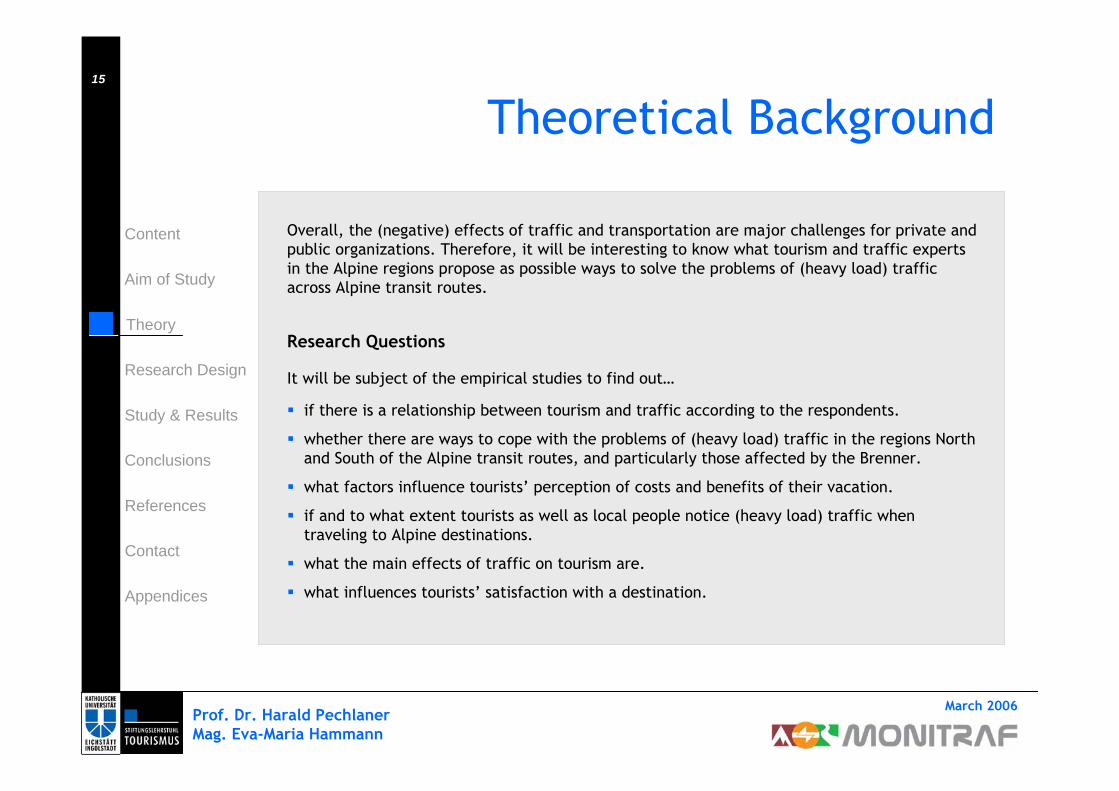
Overall, the (negative) effects of traffic and transportation are major challenges for private and public organizations. Therefore, it will be interesting to know what tourism and traffic experts in the Alpine regions propose as possible ways to solve the problems of (heavy load) traffic across Alpine transit routes.
Research Questions
It will be subject of the empirical studies to find out…
if there is a relationship between tourism and traffic according to the respondents.
whether there are ways to cope with the problems of (heavy load) traffic in the regions North and South of the Alpine transit routes, and particularly those affected by the Brenner.
what factors influence tourists’ perception of costs and benefits of their vacation.
if and to what extent tourists as well as local people notice (heavy load) traffic when traveling to Alpine destinations.
what the main effects of traffic on tourism are.
what influences tourists’ satisfaction with a destination.
Prof. Dr. Harald PechlanerMag. Eva-Maria Hammann
March 2006
Content
Theory
Aim of Study
Research Design
Study & Results
Conclusions
Appendices
Contact
References
16
Research Design
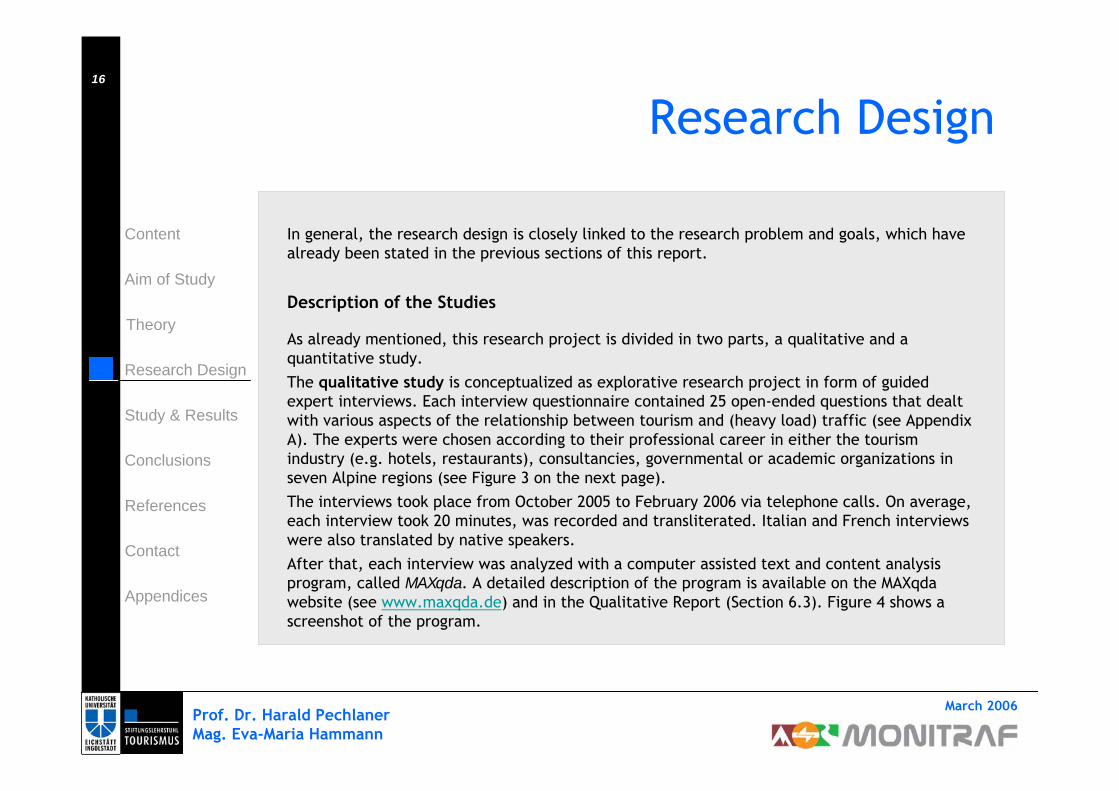
In general, the research design is closely linked to the research problem and goals, which have already been stated in the previous sections of this report.
Description of the Studies
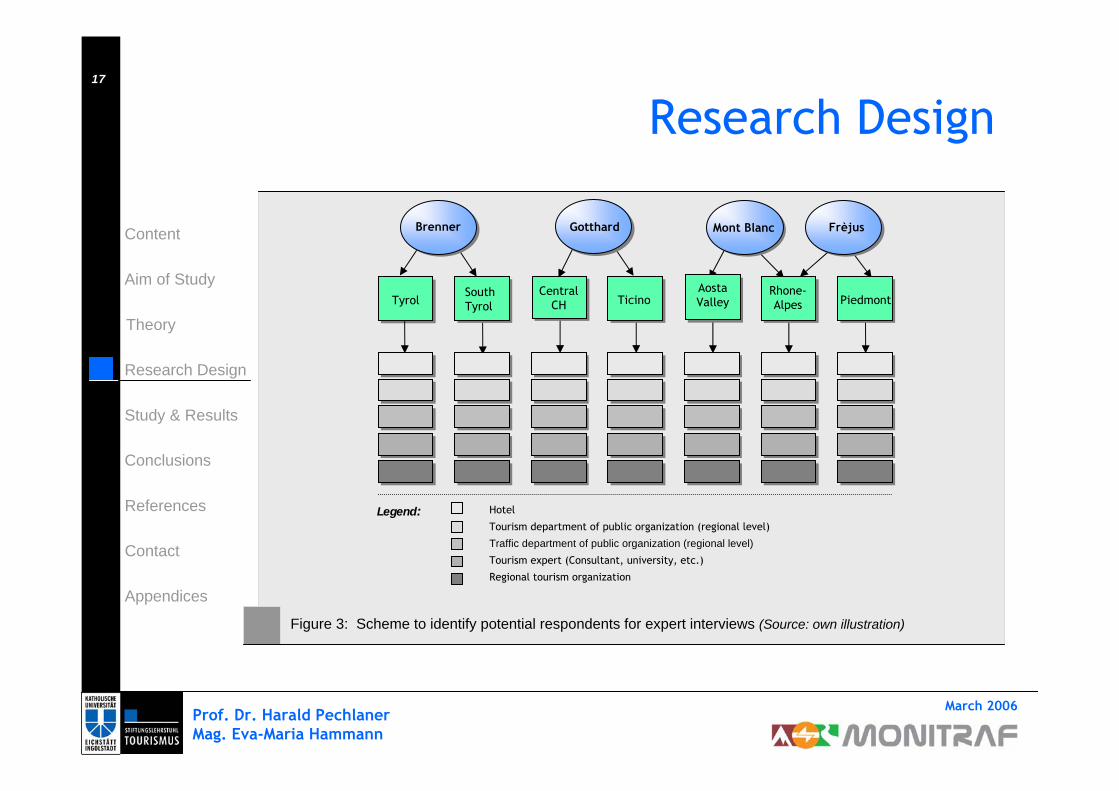
As already mentioned, this research project is divided in two parts, a qualitative and a quantitative study.The qualitative study is conceptualized as explorative research project in form of guided expert interviews. Each interview questionnaire contained 25 open-ended questions that dealt with various aspects of the relationship between tourism and (heavy load) traffic (see Appendix A). The experts were chosen according to their professional career in either the tourism industry (e.g. hotels, restaurants), consultancies, governmental or academic organizations in seven Alpine regions (see Figure 3 on the next page). The interviews took place from October 2005 to February 2006 via telephone calls. On average, each interview took 20 minutes, was recorded and transliterated. Italian and French interviews were also translated by native speakers.After that, each interview was analyzed with a computer assisted text and content analysis program, called MAXqda. A detailed description of the program is available on the MAXqdawebsite (see www.maxqda.de) and in the Qualitative Report (Section 6.3). Figure 4 shows a screenshot of the program.
Prof. Dr. Harald PechlanerMag. Eva-Maria Hammann
March 2006
Content
Theory
Aim of Study
Research Design
Study & Results
Conclusions
Appendices
Contact
References
17
Research Design
TyrolSouth Tyrol
CentralCH
Brenner Gotthard Mont Blanc Frèjus
Hotel
Tourism department of public organization (regional level)
Traffic department of public organization (regional level)Tourism expert (Consultant, university, etc.)
Regional tourism organization
Legend:
TicinoAostaValleyAostaValley
Rhone-Alpes Piedmont
Figure 3: Scheme to identify potential respondents for expert interviews (Source: own illustration)

Prof. Dr. Harald PechlanerMag. Eva-Maria Hammann
March 2006
Content
Theory
Aim of Study
Research Design
Study & Results
Conclusions
Appendices
Contact
References
18
Research Design
Figure 4: Screenshot of MAXqda (Source: MAXqda)
For the process of qualitative data analysis, the main screen of MAXqda is structured in 4 sections:
The complete set of data window (“Text groups”)
The code- or category system window (“Code system”)
The single text window (“Text Browser”)
The specific search results window for verifying the theoretical concepts (“Retrieved Segments”)

Prof. Dr. Harald PechlanerMag. Eva-Maria Hammann
March 2006
Content
Theory
Aim of Study
Research Design
Study & Results
Conclusions
Appendices
Contact
References
19
Research Design
The quantitative study was conducted in February 2006 via a fully-standardized questionnaire that was set online (Appendix B). The link to this online questionnaire was emailed to potential respondents in North and South Tyrol. The respondents who had been asked to participate in the quantitative study belonged to one of the following organizations either in North or South Tyrol:
Hotels (4**** star hotels)Regional tourism organizationsMunicipalities and citiesTransport and truckage companies
The following table shows the number of potential respondents for each type of organization:
1494905521∑
25515897Transport & truckage companies
1546391Tourism Organizations
691405286Hotels
394278116Cities & municipalities
∑North TyrolSouth Tyrol
Table 1: Potential respondents in North & South Tyrol (Source: Own Ilustration)

Prof. Dr. Harald PechlanerMag. Eva-Maria Hammann
March 2006
Content
Theory
Aim of Study
Research Design
Study & Results
Conclusions
Appendices
Contact
References
20
Research Design
Measuring tourists’ satisfaction
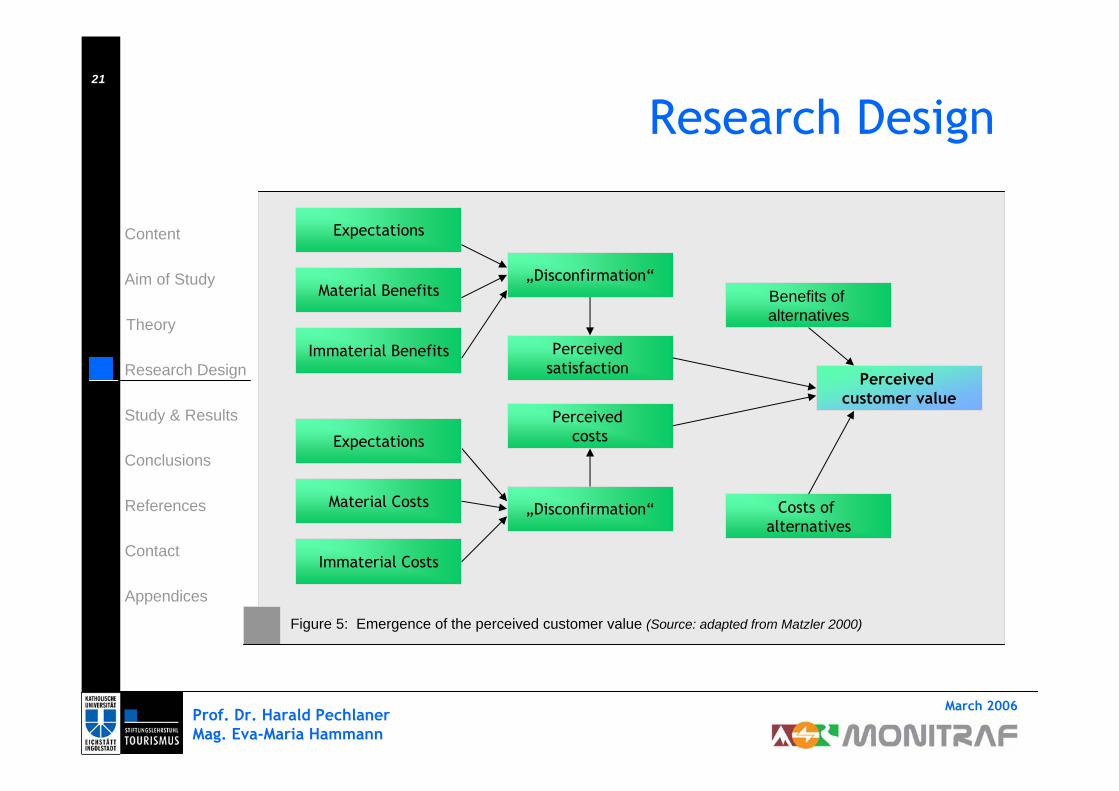
As already indicated, the questionnaire focuses on e.g. tourists’ satisfaction with various factors in the regions North and South of the Brenner transit route as well as with the perceived costs and benefits concerning their vacation.According to Matzler (2000) as well as Fischer & Pechlaner (2004), satisfaction of customers (as well as tourists) evolves over three phases. First, the customer/tourist compares different alternatives for solving a specific problem and finally picks one of these alternatives based on his/her previous experiences. Secondly, he/she observes the quality of the service consumed. Thirdly, he compares the perceived quality of the service with the expectations, which he/she has build before consuming the service. Three different outcomes are possible:
If the perceived quality is lower than expected, there is a negative disconfirmation and subsequently dissatisfaction. If the perceived quality is higher than expected, then the customer/tourist is satisfied.If expectation are met, there won’t be satisfaction nor dissatisfaction. The customer/tourist will just be neutral towards the service he consumed.
In general, customers or tourists respectively value services through the perceived customer value which is determined by various components such as the perceived material and immaterial benefits and costs (Figure 5 on the next page):
Prof. Dr. Harald PechlanerMag. Eva-Maria Hammann
March 2006
Content
Theory
Aim of Study
Research Design
Study & Results
Conclusions
Appendices
Contact
References
21
Research Design
Expectations
Material Benefits„Disconfirmation“
Perceived satisfaction
Benefits of alternatives
Material Costs
Immaterial Costs
Perceived costs
Perceived customer value
Costs of alternatives
Figure 5: Emergence of the perceived customer value (Source: adapted from Matzler 2000)
Expectations
Immaterial Benefits
„Disconfirmation“
Prof. Dr. Harald PechlanerMag. Eva-Maria Hammann
March 2006
Content
Theory
Aim of Study
Research Design
Study & Results
Conclusions
Appendices
Contact
References
22
Research Design
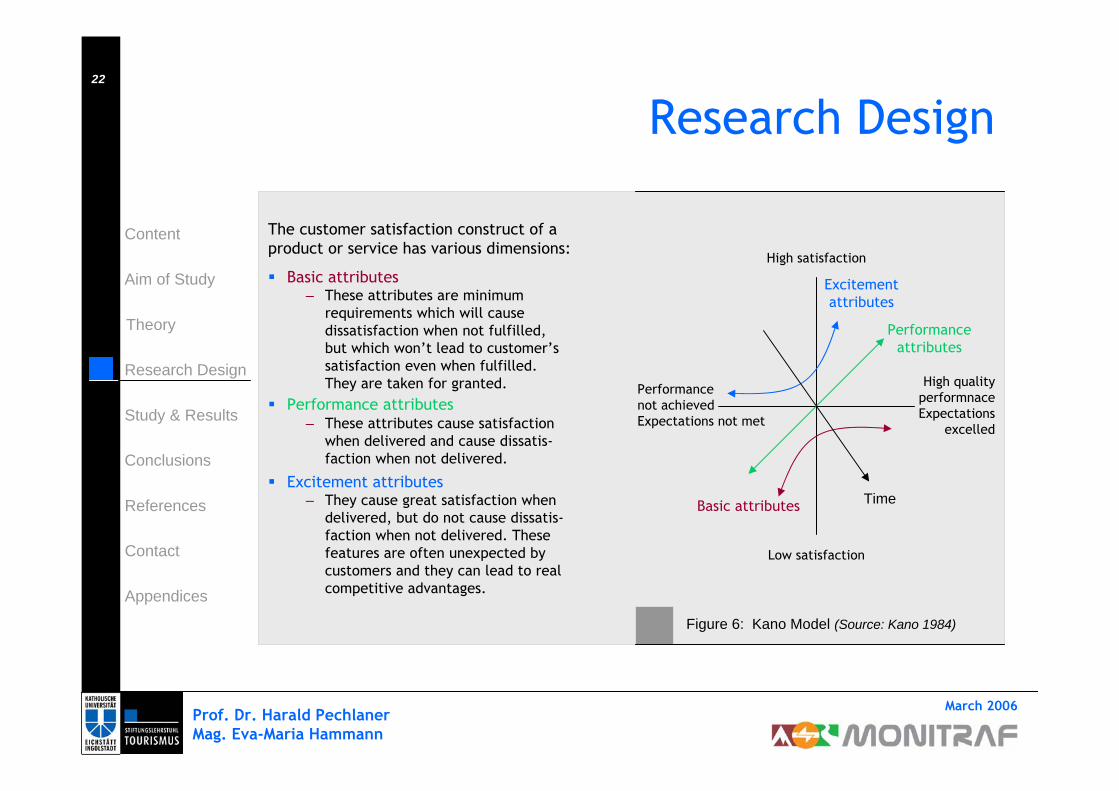
The customer satisfaction construct of a product or service has various dimensions:
Basic attributes– These attributes are minimum
requirements which will cause dissatisfaction when not fulfilled, but which won’t lead to customer’s satisfaction even when fulfilled. They are taken for granted.
Performance attributes– These attributes cause satisfaction
when delivered and cause dissatis-faction when not delivered.
Excitement attributes– They cause great satisfaction when
delivered, but do not cause dissatis-faction when not delivered. These features are often unexpected by customers and they can lead to real competitive advantages.
High satisfaction
Low satisfaction
High qualityperformnaceExpectations
excelled
Performance not achievedExpectations not met
Time
Performance attributes
Excitementattributes
Basic attributes
Figure 6: Kano Model (Source: Kano 1984)
Prof. Dr. Harald PechlanerMag. Eva-Maria Hammann
March 2006
Content
Theory
Aim of Study
Research Design
Study & Results
Conclusions
Appendices
Contact
References
23
Research Design
These three dimensions, namely the basic, performance and excitement attributes, have an impact on the emergence of customer satisfaction.
For customer satisfaction to come up, basic attributes have to be fulfilled even though the customer or tourist does not perceive these attributes as relevant for his/her purchase decision. Performance attributes represent the “gateway” to competition. The customer/tourist takes performance attributes as basis for the comparison of one product with another. Consequently, the respective product or service must at least be as good as the product or service competitors offer. Excitement attributes are not expected by customers/tourists and therefore lead to great delight. Excitement attributes increase the value of the product or service, and as such as have major impact on the satisfaction with the respective product or service.
It is important to note that the distinction between the three factors depends on the customer’s or tourist’s personal preferences. Therefore, basic factors for one customer group could be performance factors for another group.
Furthermore, the different factors are dynamic and change over time (Matzler et al. 2001, p. 448): Excitement factors become performance factors which in turn become basic factors.
Clearly, the three-factor-structure of customer satisfaction is important for management. The perceived customer value is determined by basic, performance and excitement factors and as such the different attributes have to be identified in order to be able to manage the customer value.
Prof. Dr. Harald PechlanerMag. Eva-Maria Hammann
March 2006
Content
Theory
Aim of Study
Research Design
Study & Results
Conclusions
Appendices
Contact
References
24
Research Design
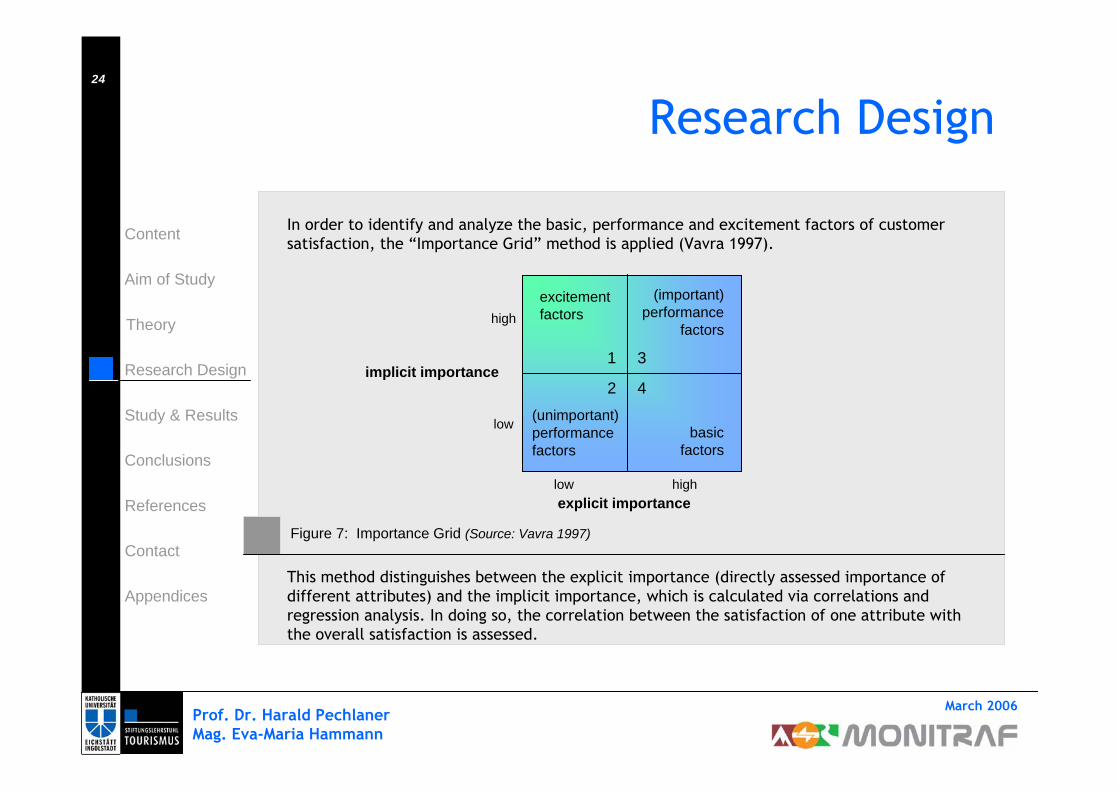
In order to identify and analyze the basic, performance and excitement factors of customer satisfaction, the “Importance Grid” method is applied (Vavra 1997).
This method distinguishes between the explicit importance (directly assessed importance of different attributes) and the implicit importance, which is calculated via correlations and regression analysis. In doing so, the correlation between the satisfaction of one attribute with the overall satisfaction is assessed.
excitementfactors
(unimportant) performancefactors
(important) performance
factors
basicfactors
low
low
high
high
implicit importance
explicit importance
Figure 7: Importance Grid (Source: Vavra 1997)
4
3
2
1
Prof. Dr. Harald PechlanerMag. Eva-Maria Hammann
March 2006
Content
Theory
Aim of Study
Research Design
Study & Results
Conclusions
Appendices
Contact
References
25
Research Design
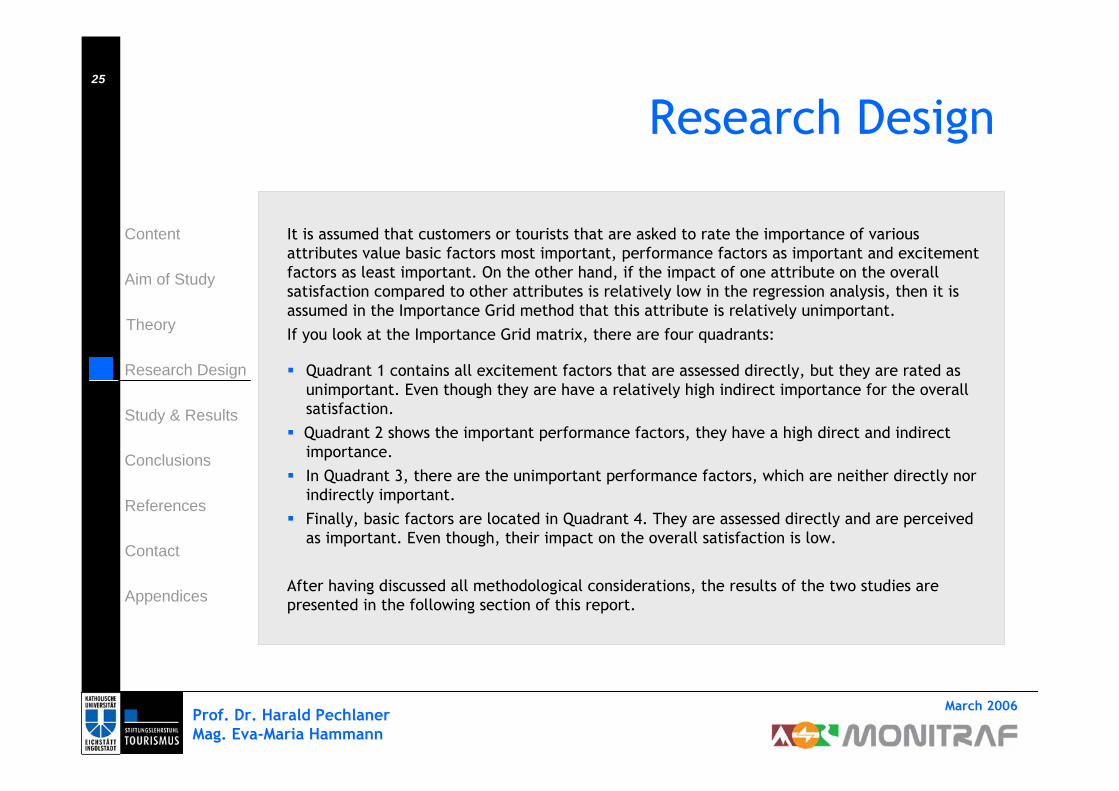
It is assumed that customers or tourists that are asked to rate the importance of various attributes value basic factors most important, performance factors as important and excitement factors as least important. On the other hand, if the impact of one attribute on the overall satisfaction compared to other attributes is relatively low in the regression analysis, then it is assumed in the Importance Grid method that this attribute is relatively unimportant. If you look at the Importance Grid matrix, there are four quadrants:
Quadrant 1 contains all excitement factors that are assessed directly, but they are rated as unimportant. Even though they are have a relatively high indirect importance for the overall satisfaction.Quadrant 2 shows the important performance factors, they have a high direct and indirect importance. In Quadrant 3, there are the unimportant performance factors, which are neither directly nor indirectly important.Finally, basic factors are located in Quadrant 4. They are assessed directly and are perceived as important. Even though, their impact on the overall satisfaction is low.
After having discussed all methodological considerations, the results of the two studies are presented in the following section of this report.

Prof. Dr. Harald PechlanerMag. Eva-Maria Hammann
March 2006
Content
Theory
Aim of Study
Research Design
Study & Results
Conclusions
Appendices
Contact
References
26
The Empirical Study
As already stated on page 19, the quantitative study was conducted via online questionnaire in North and South Tyrol. 1494 respondents in four sectors (i.e. business and public sector) had been identified in these two regions. For 4-star hotels, cities/municipalities and tourism organizations a complete inventory count was done, which means that all 4-star hotels, organizations and municipal offices in North and South Tyrol that provided an email address were addressed and asked to participate in the study. The addresses had been collected through internet search as well as datasets provided by the chambers of commerce.The complete inventory count was not possible for the truckage and transport companies. As these companies are not obliged to provide all their data (e.g. in the databases of the respective Chambers of Commerce), only those transport companies could be included in the sample that had published an email account. Consequently, the link to the online questionnaire was just sent to those firms accessible by email. From the 1494 potential respondents identified, 205 questionnaires have been filled out, which represents a response rate of 13,8 %.
Prof. Dr. Harald PechlanerMag. Eva-Maria Hammann
March 2006
Content
Theory
Aim of Study
Research Design
Study & Results
Conclusions
Appendices
Contact
References
27
Results
Description of the Sample
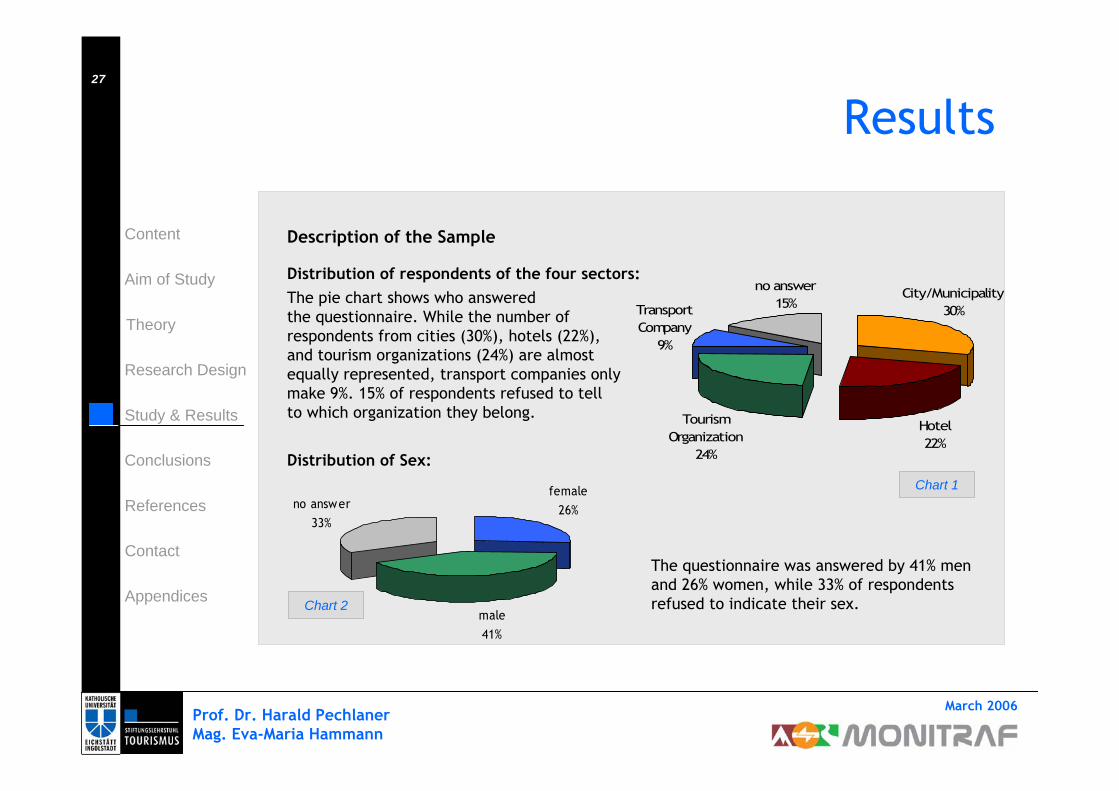
Distribution of respondents of the four sectors:The pie chart shows who answered the questionnaire. While the number of respondents from cities (30%), hotels (22%), and tourism organizations (24%) are almost equally represented, transport companies onlymake 9%. 15% of respondents refused to tell to which organization they belong.
Distribution of Sex:
The questionnaire was answered by 41% men and 26% women, while 33% of respondents refused to indicate their sex.
Hotel22%
Transport Company
9%
Tourism Organization
24%
no answer15%
City/Municipality30%
female26%
male41%
no answer33%
Chart 2
Chart 1
Prof. Dr. Harald PechlanerMag. Eva-Maria Hammann
March 2006
Content
Theory
Aim of Study
Research Design
Study & Results
Conclusions
Appendices
Contact
References
28
Results
Description of the Sample
Age Distribution:
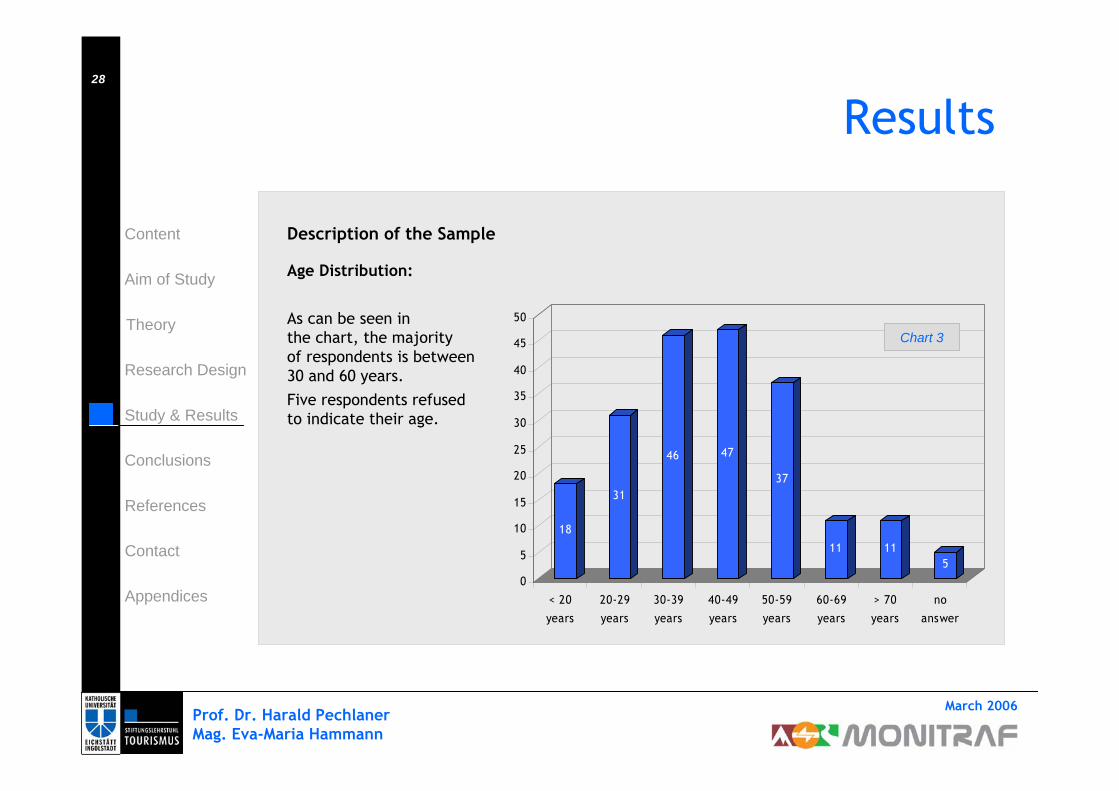
As can be seen inthe chart, the majority of respondents is between 30 and 60 years.Five respondents refused to indicate their age.
18
31
46 47
37
11 115
0
5
10
15
20
25
30
35
40
45
50
< 20
years
20-29
years
30-39
years
40-49
years
50-59
years
60-69
years
> 70
years
no
answer
Chart 3
Prof. Dr. Harald PechlanerMag. Eva-Maria Hammann
March 2006
Content
Theory
Aim of Study
Research Design
Study & Results
Conclusions
Appendices
Contact
References
29
Results
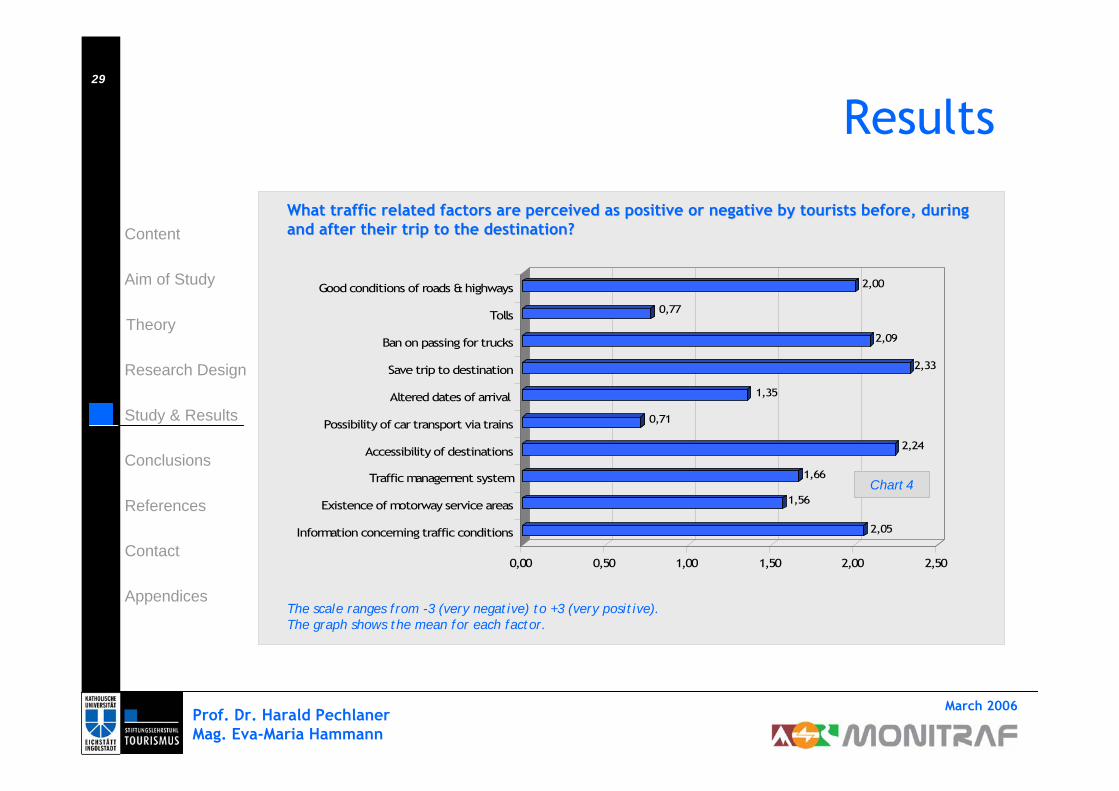
What traffic related factors are perceived as positive or negatiWhat traffic related factors are perceived as positive or negative by tourists before, during ve by tourists before, during and after their trip to the destination?and after their trip to the destination?
The scale ranges from -3 (very negative) to +3 (very positive). The graph shows the mean for each factor.
2,05
1,56
1,66
2,24
0,71
1,35
2,33
2,09
0,77
2,00
0,00 0,50 1,00 1,50 2,00 2,50
Information concerning traffic conditions
Existence of motorway service areas
Traffic management system
Accessibility of destinations
Possibility of car transport via trains
Altered dates of arrival
Save trip to destination
Ban on passing for trucks
Tolls
Good conditions of roads & highways
Chart 4
Prof. Dr. Harald PechlanerMag. Eva-Maria Hammann
March 2006
Content
Theory
Aim of Study
Research Design
Study & Results
Conclusions
Appendices
Contact
References
30
Results
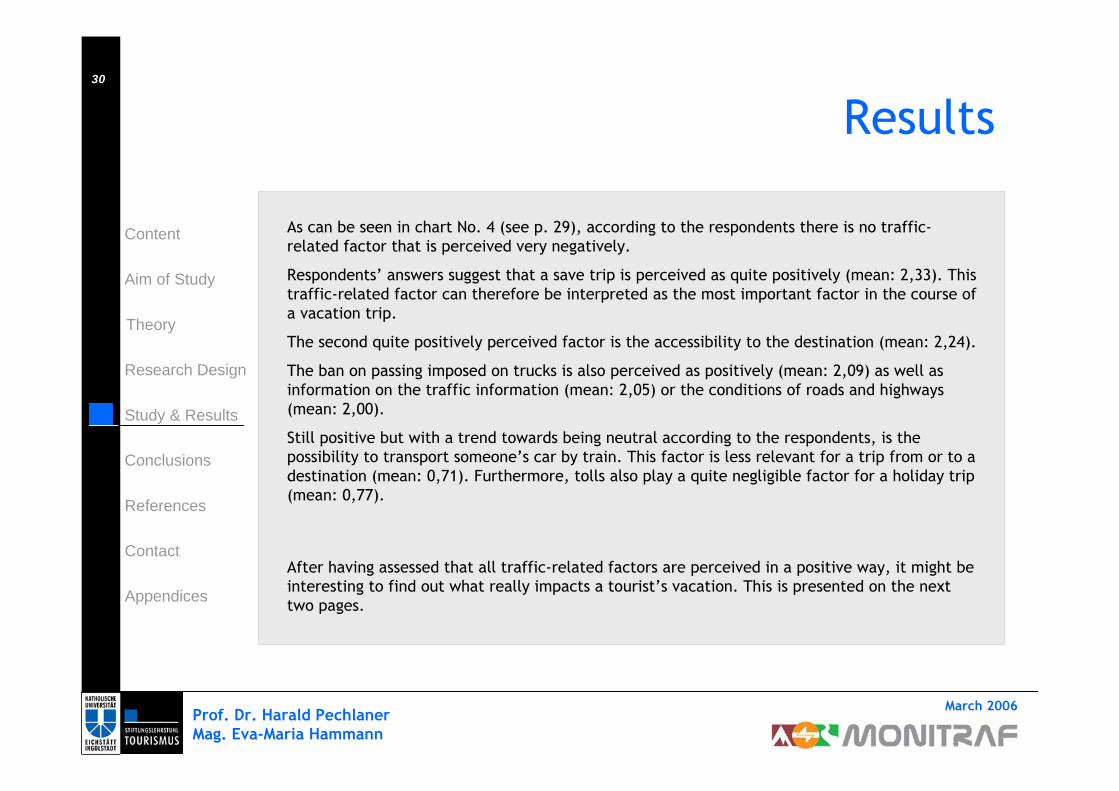
As can be seen in chart No. 4 (see p. 29), according to the respondents there is no traffic-related factor that is perceived very negatively.
Respondents’ answers suggest that a save trip is perceived as quite positively (mean: 2,33). This traffic-related factor can therefore be interpreted as the most important factor in the course of a vacation trip.
The second quite positively perceived factor is the accessibility to the destination (mean: 2,24).
The ban on passing imposed on trucks is also perceived as positively (mean: 2,09) as well as information on the traffic information (mean: 2,05) or the conditions of roads and highways (mean: 2,00).
Still positive but with a trend towards being neutral according to the respondents, is the possibility to transport someone’s car by train. This factor is less relevant for a trip from or to a destination (mean: 0,71). Furthermore, tolls also play a quite negligible factor for a holiday trip (mean: 0,77).
After having assessed that all traffic-related factors are perceived in a positive way, it might be interesting to find out what really impacts a tourist’s vacation. This is presented on the next two pages.
Prof. Dr. Harald PechlanerMag. Eva-Maria Hammann
March 2006
Content
Theory
Aim of Study
Research Design
Study & Results
Conclusions
Appendices
Contact
References
31
Results
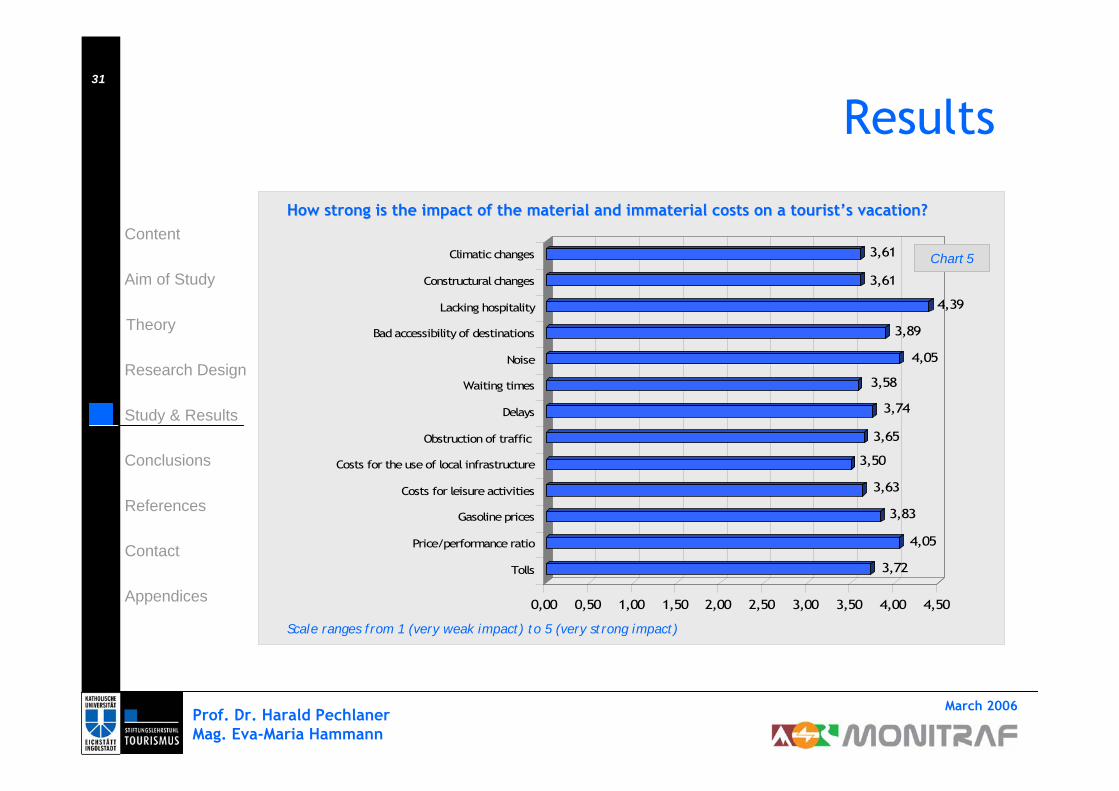
How strong is the impact of the material and immaterial costs onHow strong is the impact of the material and immaterial costs on a tourista tourist’’s vacation?s vacation?
Scale ranges from 1 (very weak impact) to 5 (very strong impact)
3,72
4,05
3,83
3,63
3,50
3,65
3,74
3,58
4,05
3,89
4,39
3,61
3,61
0,00 0,50 1,00 1,50 2,00 2,50 3,00 3,50 4,00 4,50
Tolls
Price/performance ratio
Gasoline prices
Costs for leisure activities
Costs for the use of local infrastructure
Obstruction of traffic
Delays
Waiting times
Noise
Bad accessibility of destinations
Lacking hospitality
Constructural changes
Climatic changes Chart 5
Prof. Dr. Harald PechlanerMag. Eva-Maria Hammann
March 2006
Content
Theory
Aim of Study
Research Design
Study & Results
Conclusions
Appendices
Contact
References
32
Results
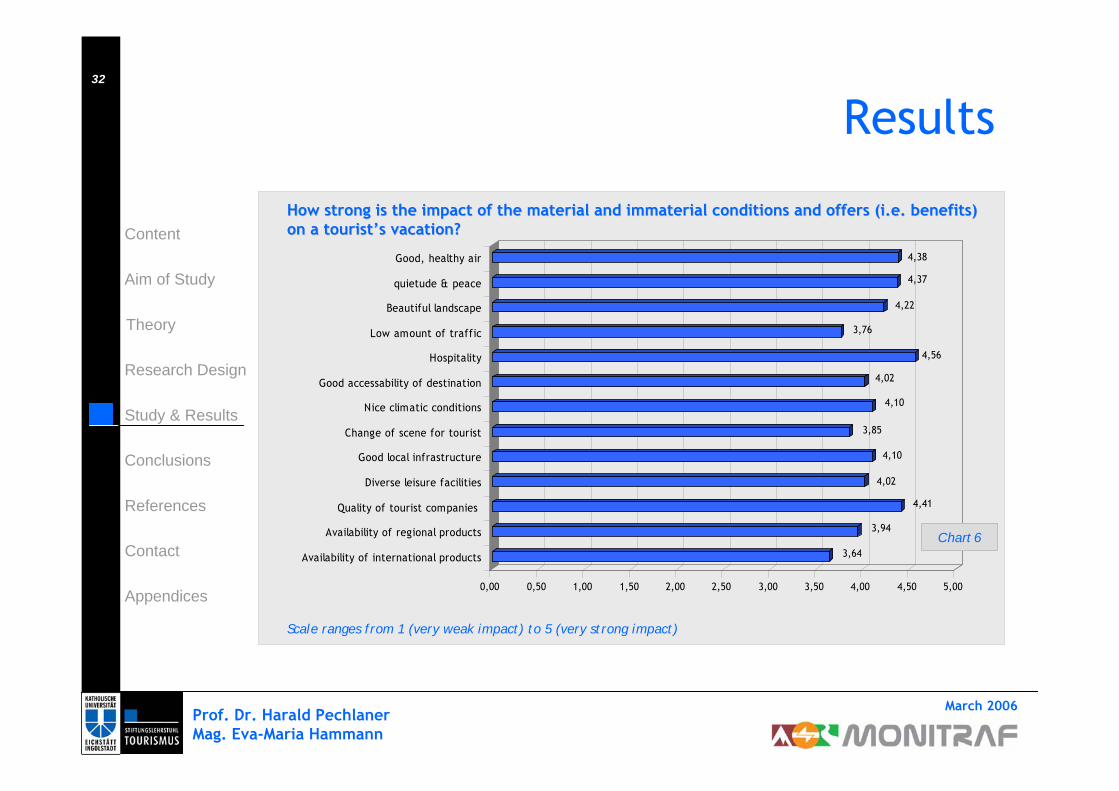
How strong is the impact of the material and immaterial conditioHow strong is the impact of the material and immaterial conditions and offers (i.e. benefits) ns and offers (i.e. benefits) on a touriston a tourist’’s vacation?s vacation?
3,64
3,94
4,41
4,02
4,10
3,85
4,10
4,02
4,56
3,76
4,22
4,37
4,38
0,00 0,50 1,00 1,50 2,00 2,50 3,00 3,50 4,00 4,50 5,00
Availability of international products
Availability of regional products
Quality of tourist companies
Diverse leisure facilities
Good local infrastructure
Change of scene for tourist
Nice climatic conditions
Good accessability of destination
Hospitality
Low amount of traffic
Beautiful landscape
quietude & peace
Good, healthy air
Scale ranges from 1 (very weak impact) to 5 (very strong impact)
Chart 6

Prof. Dr. Harald PechlanerMag. Eva-Maria Hammann
March 2006
Content
Theory
Aim of Study
Research Design
Study & Results
Conclusions
Appendices
Contact
References
33
Results
The Charts No. 5 and 6 (pp. 31 & 32) show how strong the impact of material and immaterial costs and benefits (i.e. offers, conditions) is on a vacation in North and South Tyrol.
Obviously, all of the cost-related factors mentioned in the questionnaire have a relatively strong impact on vacation (means ≥ 3,5). With a more detailed regard to potential costs, respondents stated that lacking hospitality has probably the strongest impact on a tourist’s vacation (mean: 4,39), followed by the price/performance ratio and noise (both with a mean of 4,05). Not a very strong impact do have costs for the use of local infrastructure (mean: 3,5), waiting times (mean: 3,58) and climatic and constructural changes in the region (both means of 3,61). Examples for the latter ones are e.g. construction of new highways or roads. Interestingly, two experts that had been asked in telephone interviews stated that parking fees or fees for ski buses, which fall under costs of infrastructure, lead to negative feelings of tourists.
Taking a look at the benefits and their impact on a tourist’s vacation time, again hospitality (mean: 4,56) and the quality of companies in tourism (mean: 4,41) have a quite strong impact. This can also be confirmed by the statements of telephone interview partners (8 entries for hospitality; 7 entries for quality of tourist firms). Quietude and peace (mean: 4,37) as well as good, healthy air (mean: 4,38) also have a considerable influence on the vacation of foreigners. These two factors have also been stated most often in the course of the qualitative interview (15 entries for each factor). Not that much impact have the availability of international products (mean: 3,64), even though 10 out of 35 interview partners mentioned this factor. A low amount of traffic (mean: 3,76) and the change of scene (mean: 3,85) also have a less strong impact compared to the other factors.
Prof. Dr. Harald PechlanerMag. Eva-Maria Hammann
March 2006
Content
Theory
Aim of Study
Research Design
Study & Results
Conclusions
Appendices
Contact
References
34
Results
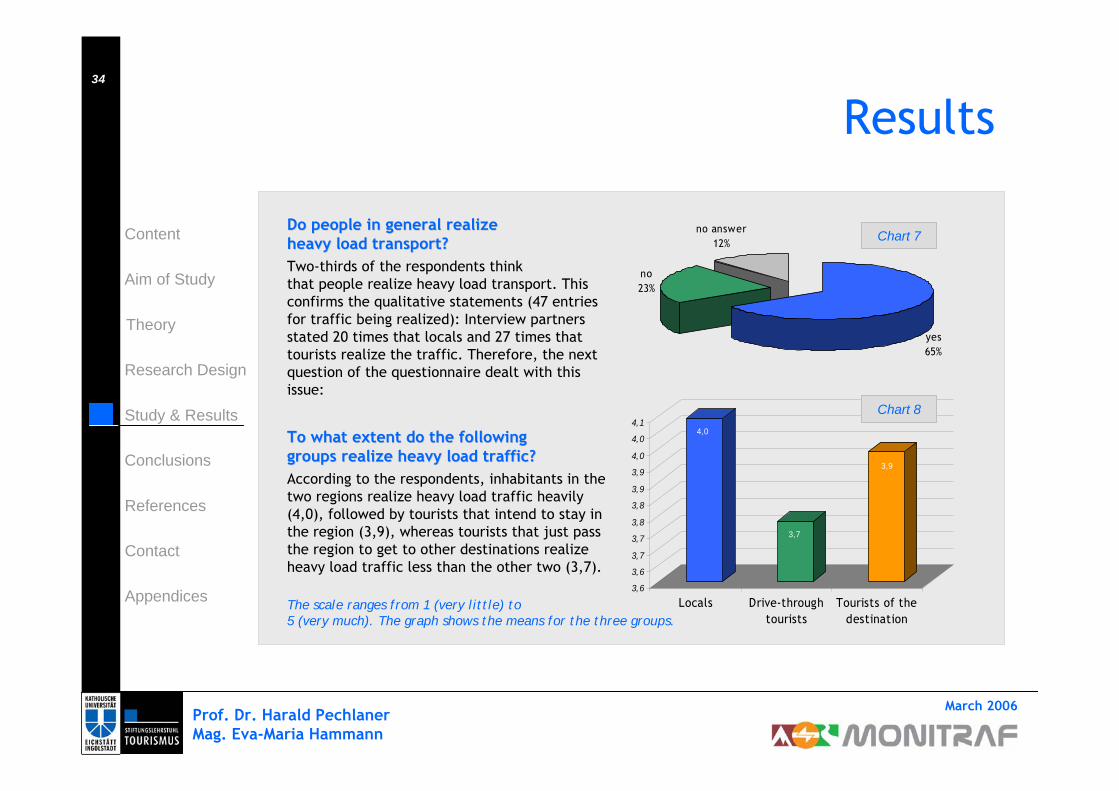
Do people in general realize Do people in general realize heavy load transport?heavy load transport?Two-thirds of the respondents thinkthat people realize heavy load transport. This confirms the qualitative statements (47 entries for traffic being realized): Interview partners stated 20 times that locals and 27 times that tourists realize the traffic. Therefore, the next question of the questionnaire dealt with this issue:
To what extent do the following To what extent do the following groups realize heavy load traffic?groups realize heavy load traffic?According to the respondents, inhabitants in the two regions realize heavy load traffic heavily (4,0), followed by tourists that intend to stay in the region (3,9), whereas tourists that just pass the region to get to other destinations realize heavy load traffic less than the other two (3,7).
yes65%
no23%
no answer12%
4,0
3,7
3,9
3,6
3,6
3,7
3,7
3,8
3,8
3,9
3,9
4,0
4,0
4,1
Locals Drive-throughtourists
Tourists of thedestination
The scale ranges from 1 (very little) to 5 (very much). The graph shows the means for the three groups.
Chart 8
Chart 7
Prof. Dr. Harald PechlanerMag. Eva-Maria Hammann
March 2006
Content
Theory
Aim of Study
Research Design
Study & Results
Conclusions
Appendices
Contact
References
35
Results
2,86
3,20 3,27 3,343,48
3,71
0,00
0,50
1,00
1,50
2,00
2,50
3,00
3,50
4,00
French Dutch Italian Swiss Austrian German
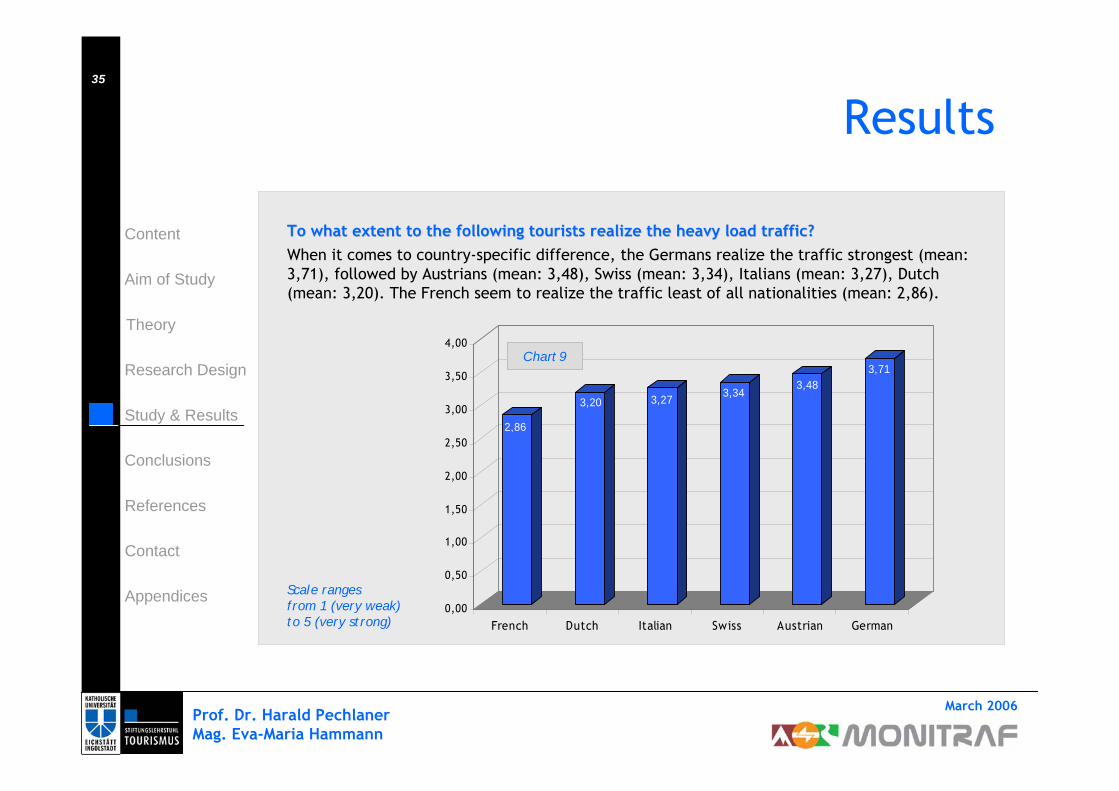
To what extent to the following tourists realize the heavy load To what extent to the following tourists realize the heavy load traffic?traffic?When it comes to country-specific difference, the Germans realize the traffic strongest (mean: 3,71), followed by Austrians (mean: 3,48), Swiss (mean: 3,34), Italians (mean: 3,27), Dutch (mean: 3,20). The French seem to realize the traffic least of all nationalities (mean: 2,86).
Scale ranges from 1 (very weak) to 5 (very strong)
Chart 9
Prof. Dr. Harald PechlanerMag. Eva-Maria Hammann
March 2006
Content
Theory
Aim of Study
Research Design
Study & Results
Conclusions
Appendices
Contact
References
36
Results
Is there a correlation between tourism and the volume of trafficIs there a correlation between tourism and the volume of traffic in general?in general?
Is there a correlation between tourism and heavy load traffic?Is there a correlation between tourism and heavy load traffic?
29
82
59
2
34
49
84
37
2
34
0
10
20
30
40
50
60
70
80
90
Correlation between tourism &
traffic
Correlation between tourism &
heavy load traffic
strongly agree
agree
neither nor
no answer
missing
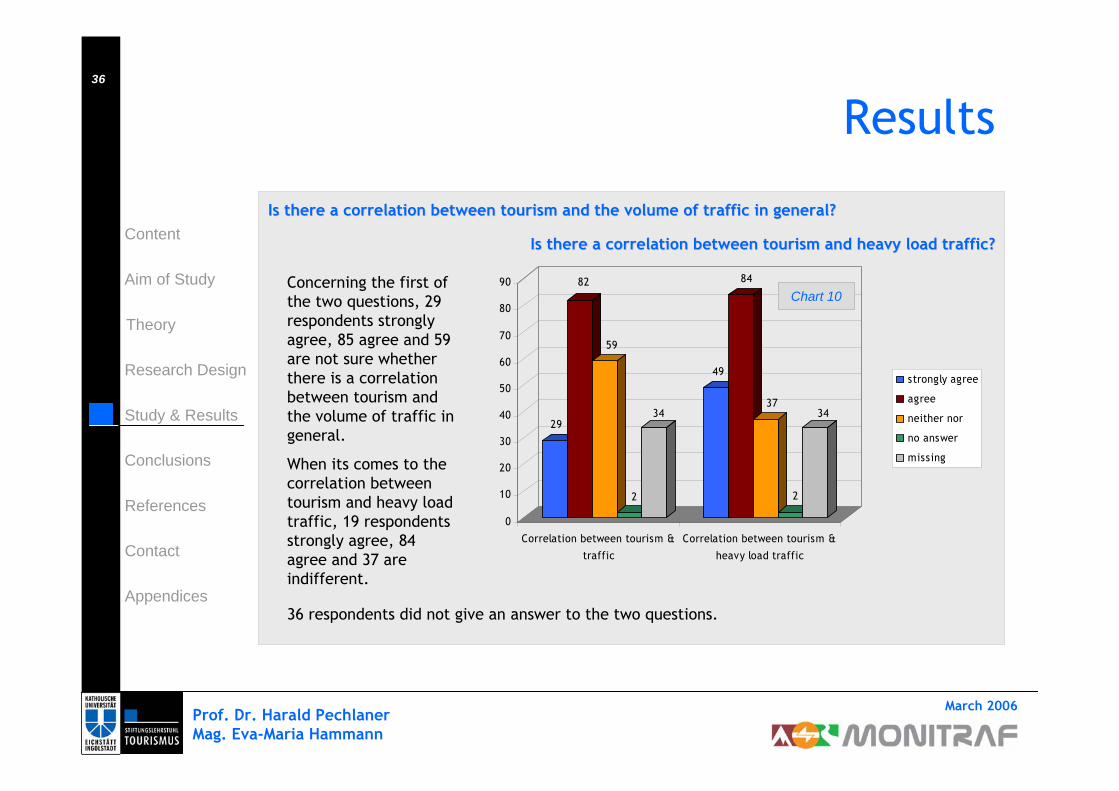
Concerning the first of the two questions, 29 respondents strongly agree, 85 agree and 59 are not sure whether there is a correlation between tourism and the volume of traffic in general.
When its comes to the correlation between tourism and heavy load traffic, 19 respondents strongly agree, 84 agree and 37 are indifferent.
36 respondents did not give an answer to the two questions.
Chart 10

Prof. Dr. Harald PechlanerMag. Eva-Maria Hammann
March 2006
Content
Theory
Aim of Study
Research Design
Study & Results
Conclusions
Appendices
Contact
References
37
4,093,85
4,113,88
4,093,85
4,113,83
4,133,88
3,65 3,70 3,75 3,80 3,85 3,90 3,95 4,00 4,05 4,10 4,15
Cities/communities
Tourism Organizations
Hotels
Transport companies
All
Correlation between tourism and heavyload traffic
Correlation between tourism and traffic ingeneral
Results
With regard to the two questions discussed on the previous page, it seemed interesting to find whether there are differences between the respondent groups. The following Chart No. 11 shows the results of this more detailed analysis. This time, the means are calculated.
Chart 11
The scale ranges from 1 (very little agreement) to 5 (very high agreement)
Prof. Dr. Harald PechlanerMag. Eva-Maria Hammann
March 2006
Content
Theory
Aim of Study
Research Design
Study & Results
Conclusions
Appendices
Contact
References
38
Results
Compared to Chart No. 10 which showed the quantity of respondents’ ratings concerning the two questions, the means in Chart No. 11 show a slightly different result.
As can be seen, the differences between the groups are not substantial.
Taking a look at each group, it becomes evident that transport companies and tourism organizations equally agree that there is a correlation between traffic in general and tourism (mean: 4,11) as do hotels and municipalities (mean: 4,09).
When it comes to the correlation between tourism and heavy load traffic, tourism organizations rate this relationship highest (mean: 3,88) in contrast to truckage and transport companies that rate this relationship lowest (mean: 3,83).
Finally, respondents overall agree that the correlation between tourism and traffic in general (mean: 4,13) is a little stronger than between tourism and heavy load traffic (mean: 3,88).
Prof. Dr. Harald PechlanerMag. Eva-Maria Hammann
March 2006
Content
Theory
Aim of Study
Research Design
Study & Results
Conclusions
Appendices
Contact
References
39
Results
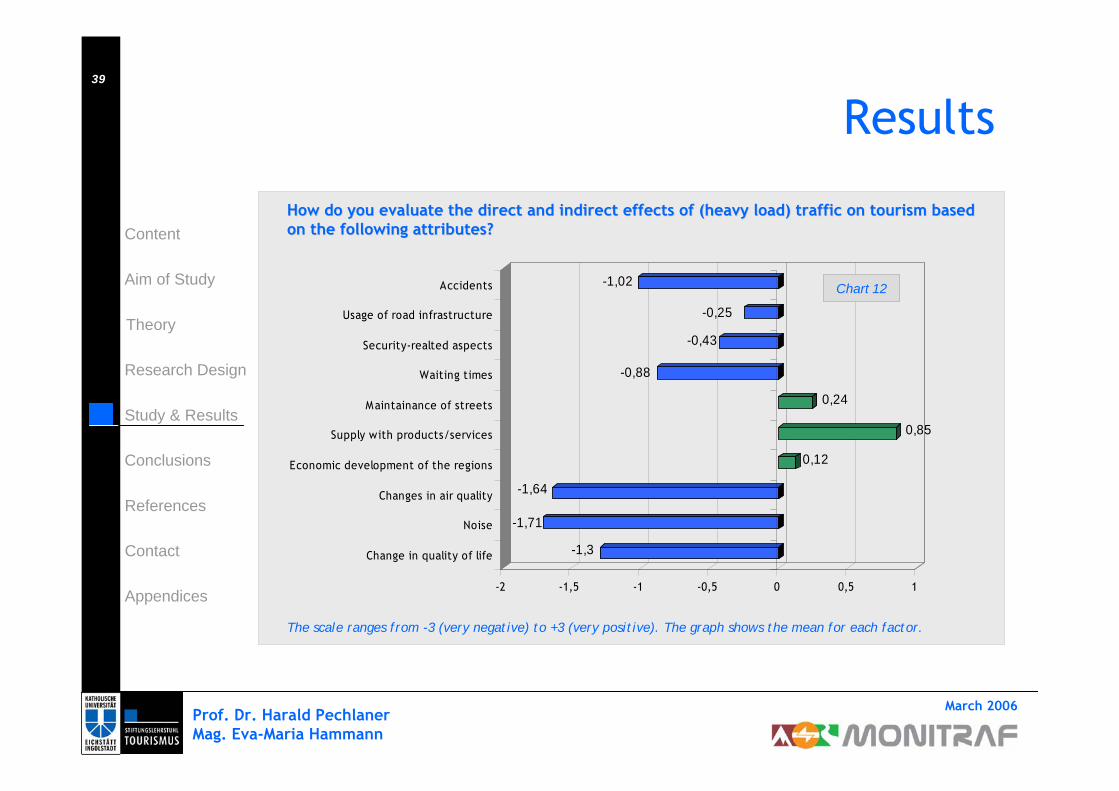
How do you evaluate the direct and indirect effects of (heavy loHow do you evaluate the direct and indirect effects of (heavy load) traffic on tourism based ad) traffic on tourism based on the following attributes?on the following attributes?
-1,3
-1,71
-1,64
0,12
0,85
0,24
-0,88
-0,43
-0,25
-1,02
-2 -1,5 -1 -0,5 0 0,5 1
Change in quality of life
Noise
Changes in air quality
Economic development of the regions
Supply with products/services
Maintainance of streets
Waiting times
Security-realted aspects
Usage of road infrastructure
Accidents
The scale ranges from -3 (very negative) to +3 (very positive). The graph shows the mean for each factor.
Chart 12
Prof. Dr. Harald PechlanerMag. Eva-Maria Hammann
March 2006
Content
Theory
Aim of Study
Research Design
Study & Results
Conclusions
Appendices
Contact
References
40
Results
Chart No. 12 relates to the question how respondents evaluate the direct and indirect effects of (heavy load) traffic on tourism.
Based in a scale from -3 (very negative) to +3 (very positive), the results show that all factors provided in the questionnaire are perceived to a have a negative or somewhat neutral effect on tourism.
According to respondents, the maintenance of roads (mean: 0,24) and the economic development of the respective regions (mean: 0,12) do not have an effect on tourism. It seems that these two topics are no longer an issue as the regions are already economically and structurally well developed. The supply of services (mean: 0,85) has a somewhat positive effect on tourism.
In contrary, all other factors have negative effects according to respondents. Major issues are e.g. changes in the air quality (mean: -1,64) and noise (-1,71), and a change in the quality of life (mean: -1,30). Accidents (mean: -1,02) and waiting times (-0,88) have a somewhat negative effect on tourism. Security aspects and the use of road infrastructure tend to being almost negligible with regard to the effects of traffic on tourism.
Prof. Dr. Harald PechlanerMag. Eva-Maria Hammann
March 2006
Content
Theory
Aim of Study
Research Design
Study & Results
Conclusions
Appendices
Contact
References
41
Results
4,10
3,99
3,87
3,59
3,74
4,00
4,13
4,09
3,54
3,61
3,85
3,65
3,54
4,16
3,20 3,30 3,40 3,50 3,60 3,70 3,80 3,90 4,00 4,10 4,20
Nature
Quietude
Air quality
Conditions of roads
Supply with products from other countries
Accessibility of destinations
Offers of tourist companies (e.g. hotels)
Quality of tourist offers
Volume of traffic at arrival & departure
Inner-city traffic situation
Leisure facilities (e.g. museums)
Infrastructure
Travel costs (e.g. tolls)
Hospitality
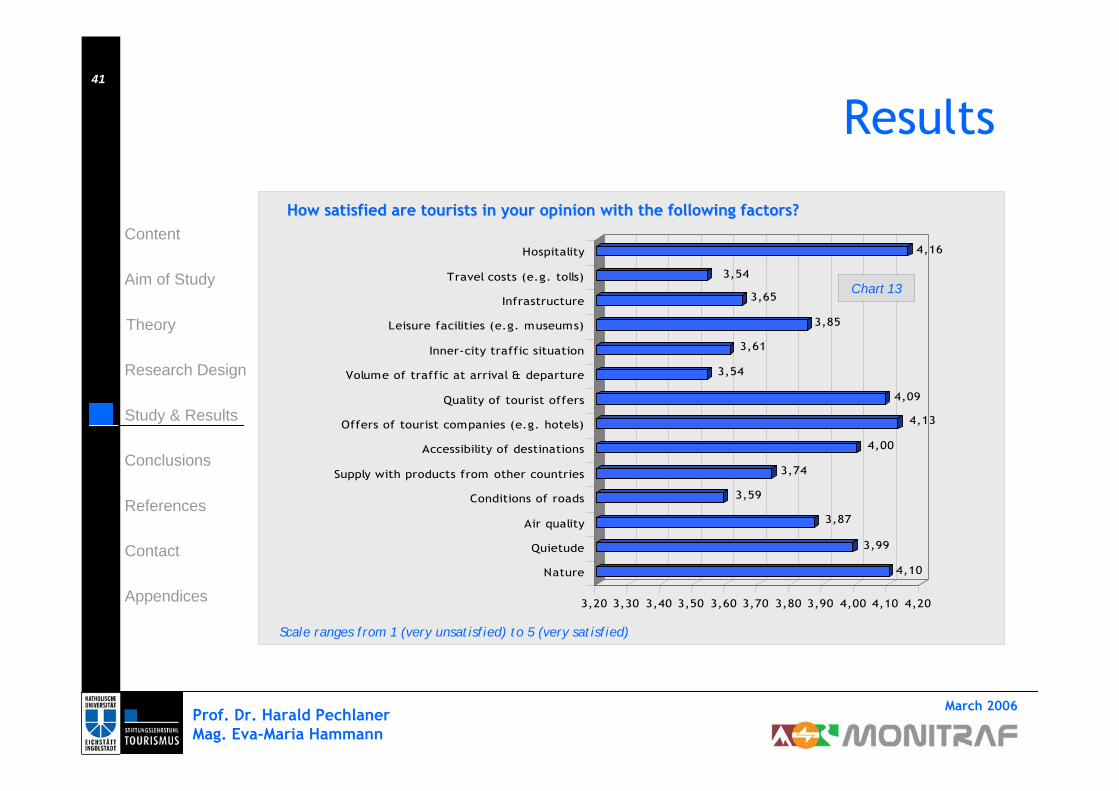
How satisfied are tourists in your opinion with the following faHow satisfied are tourists in your opinion with the following factors?ctors?
Scale ranges from 1 (very unsatisfied) to 5 (very satisfied)
Chart 13
Prof. Dr. Harald PechlanerMag. Eva-Maria Hammann
March 2006
Content
Theory
Aim of Study
Research Design
Study & Results
Conclusions
Appendices
Contact
References
42
Results
In another question (p. 41), respondents were asked to estimate the level of satisfaction of tourists on the basis of 14 attributes. These attributes should represent the most relevant factors that had already been addressed in the previous questions. Chart No. 13 shows that respondents indicated that tourists seem to be satisfied with hospitality (mean: 4,16), offers and their quality provided by tourist companies such as hotels, restaurants etc. (means of 4,13 and 4,09). Besides, nature is something that guests are satisfied with (mean: 4,10).
The factors tourists are least satisfied with according to the 206 respondents are costs for traveling in general as well as the volume of traffic during arrival and departure times, both showing a mean of 3,54. Still, this is not bad news as these counts still tend to satisfaction. The conditions of roads and highways and the traffic situation within the city or county boundaries are also seen as not being major satisfiers (means of 3,59 & 3,61) for tourists.
To summarize and interpret these findings, it has to be noted that the purely tourism related factors such as hospitality, quality of tourist products and services as well as the quality of environmental factors like air and landscape, are the real satisfiers according to respondents, while the potential impact on traffic related factors is less relevant for the satisfaction level of tourists. The means of traffic-related attributes all range in the second lower tier.
The next question investigates the importance of these 14 factors. This will give interesting insights into the importance of the different factors for tourists’ satisfaction.
Prof. Dr. Harald PechlanerMag. Eva-Maria Hammann
March 2006
Content
Theory
Aim of Study
Research Design
Study & Results
Conclusions
Appendices
Contact
References
43
Results
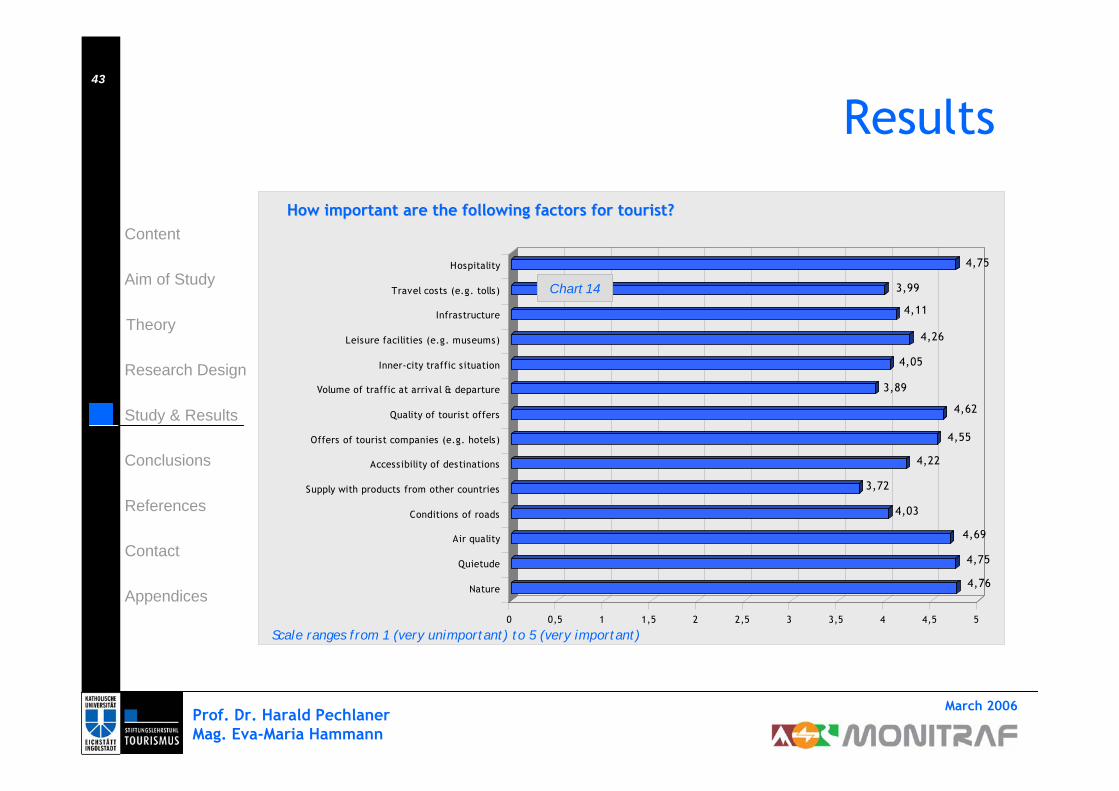
How important are the following factors for tourist? How important are the following factors for tourist?
4,76
4,75
4,69
4,03
3,72
4,22
4,55
4,62
3,89
4,05
4,26
4,11
3,99
4,75
0 0,5 1 1,5 2 2,5 3 3,5 4 4,5 5
Nature
Quietude
Air quality
Conditions of roads
Supply with products from other countries
Accessibility of destinations
Offers of tourist companies (e.g. hotels)
Quality of tourist offers
Volume of traffic at arrival & departure
Inner-city traffic situation
Leisure facilities (e.g. museums)
Infrastructure
Travel costs (e.g. tolls)
Hospitality
Scale ranges from 1 (very unimportant) to 5 (very important)
Chart 14
Prof. Dr. Harald PechlanerMag. Eva-Maria Hammann
March 2006
Content
Theory
Aim of Study
Research Design
Study & Results
Conclusions
Appendices
Contact
References
44
Results
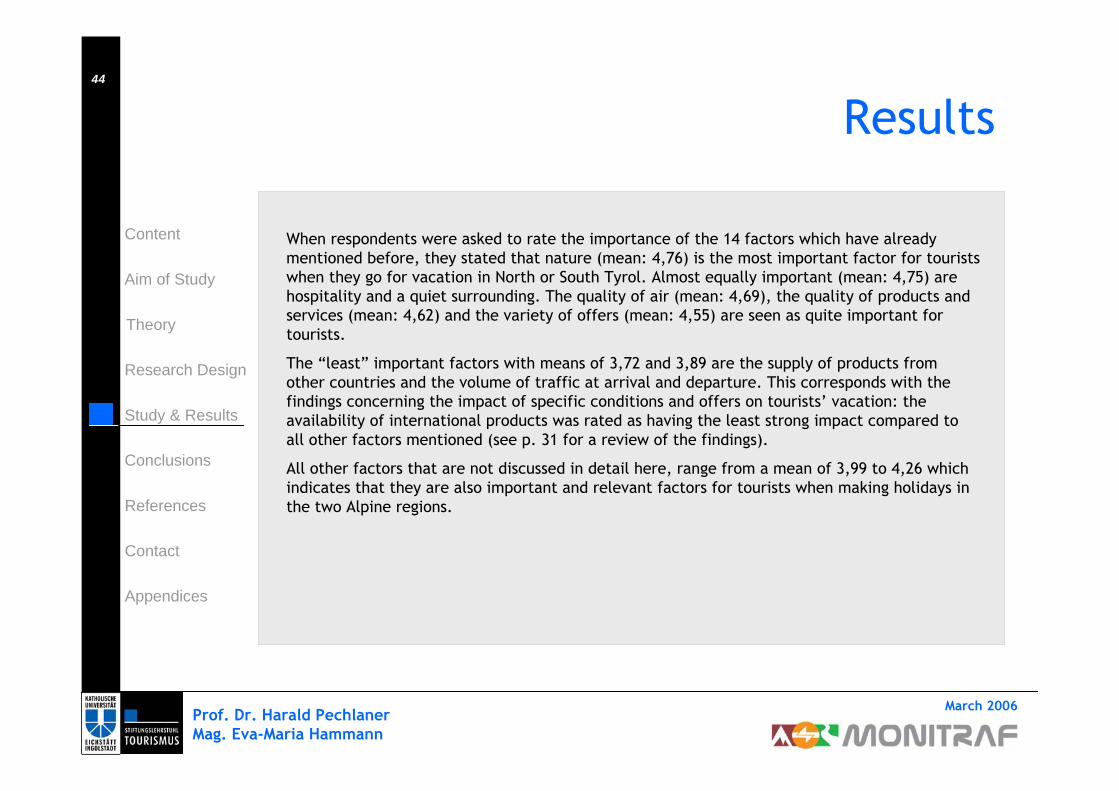
When respondents were asked to rate the importance of the 14 factors which have already mentioned before, they stated that nature (mean: 4,76) is the most important factor for tourists when they go for vacation in North or South Tyrol. Almost equally important (mean: 4,75) are hospitality and a quiet surrounding. The quality of air (mean: 4,69), the quality of products and services (mean: 4,62) and the variety of offers (mean: 4,55) are seen as quite important for tourists.
The “least” important factors with means of 3,72 and 3,89 are the supply of products from other countries and the volume of traffic at arrival and departure. This corresponds with the findings concerning the impact of specific conditions and offers on tourists’ vacation: the availability of international products was rated as having the least strong impact compared to all other factors mentioned (see p. 31 for a review of the findings).
All other factors that are not discussed in detail here, range from a mean of 3,99 to 4,26 which indicates that they are also important and relevant factors for tourists when making holidays in the two Alpine regions.

Prof. Dr. Harald PechlanerMag. Eva-Maria Hammann
March 2006
Content
Theory
Aim of Study
Research Design
Study & Results
Conclusions
Appendices
Contact
References
45
Results
What do you think is the overall satisfaction of tourists with tWhat do you think is the overall satisfaction of tourists with the factors mentioned before? he factors mentioned before?
The overall satisfaction of tourists with the situation in North and South Tyrol is shown in Chart No. 15. 8 % respondents think that of tourists are very satisfied, the majority of tourists (72%) are satisfied, only 3% are indifferent concerning the overall satisfaction level of tourists. 1% of the respondents think that tourists are unsatisfied.16% of respondents refused to answer this question.
satisfied
72%very satisfied
8%
missings
16%
neither…nor
3%
very unsatisfied
0% unsatisfied
1%
Chart 15

Prof. Dr. Harald PechlanerMag. Eva-Maria Hammann
March 2006
Content
Theory
Aim of Study
Research Design
Study & Results
Conclusions
Appendices
Contact
References
46
0,00
0,05
0,10
0,15
0,20
0,25
0,30
0 0,5 1 1,5 2 2,5 3 3,5 4 4,5 5
Quietude
Conditions of roads
Supply with products fromother countries
Results
Implicit importance
Chart 16
excitement attributes
unimportantperformance attributes
importantperformance
attributes
basic attributes
Explicit importance
The “Importance Grid” method which was explained in the ‘Theory’ section of the report, will give some interesting insights into the quality of the different factors.

Prof. Dr. Harald PechlanerMag. Eva-Maria Hammann
March 2006
Content
Theory
Aim of Study
Research Design
Study & Results
Conclusions
Appendices
Contact
References
47
Results
The “Importance Grid” shows which of the factors is a basic, a performance or an excitement factor. As already mentioned, the matrix shows the explicit and implicit importance of various factors.Out of the 14 factors, the following three factors are significant:
QuietudeThe condition of roads and highwaysThe supply with goods and products from other countries.
The matrix shows that the supply with products from other countries is an unimportant performance factor, which means that this factor has an implicit and explicit low importance for the satisfaction of tourists. Quietude is an important performance factor. They have a high implicit and explicit importance on the satisfaction of guests and tourists when they spend their holidays in either North or South Tyrol.The only excitement factor that was identified is the condition of roads. Results show that this factor has been rated as the fourth least important factor regarding the level of satisfaction. Calculations showed that this factor has a high implicit importance with regard to the perceived overall satisfaction of tourists. In this study, it was not tourists that were asked to state their level of satisfaction with the situation in the two regions. Instead employees of tourist service providers (i.e. hotels), cities & municipalities, tourist organizations and transport companies had been asked to tell their view about tourists and guests. Particularly employees of hotels and tourist organizations certainly have a very intense contact with guests and are therefore able to evaluate the potential perception of tourists.
Prof. Dr. Harald PechlanerMag. Eva-Maria Hammann
March 2006
Content
Theory
Aim of Study
Research Design
Study & Results
Conclusions
Appendices
Contact
References
48
Results
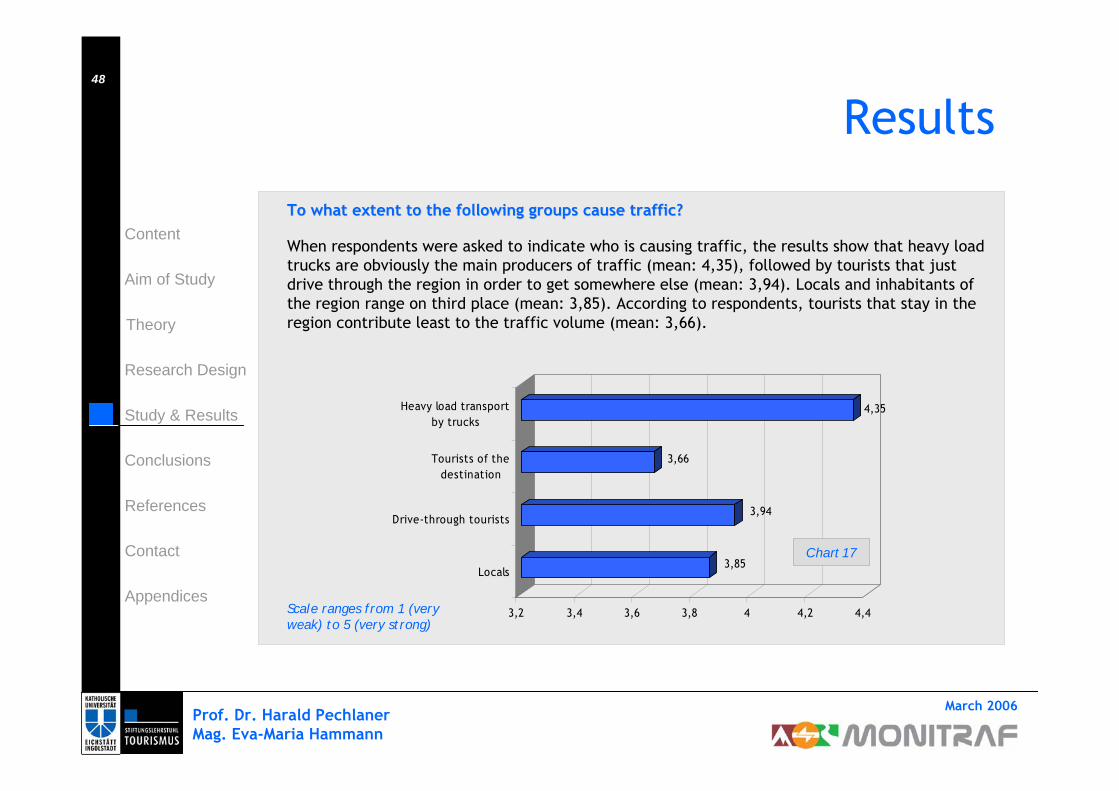
To what extent to the following groups cause traffic?To what extent to the following groups cause traffic?
When respondents were asked to indicate who is causing traffic, the results show that heavy load trucks are obviously the main producers of traffic (mean: 4,35), followed by tourists that just drive through the region in order to get somewhere else (mean: 3,94). Locals and inhabitants of the region range on third place (mean: 3,85). According to respondents, tourists that stay in the region contribute least to the traffic volume (mean: 3,66).
3,85
3,94
3,66
4,35
3,2 3,4 3,6 3,8 4 4,2 4,4
Locals
Drive-through tourists
Tourists of thedestination
Heavy load transportby trucks
Chart 17
Scale ranges from 1 (very weak) to 5 (very strong)
Prof. Dr. Harald PechlanerMag. Eva-Maria Hammann
March 2006
Content
Theory
Aim of Study
Research Design
Study & Results
Conclusions
Appendices
Contact
References
49
Results
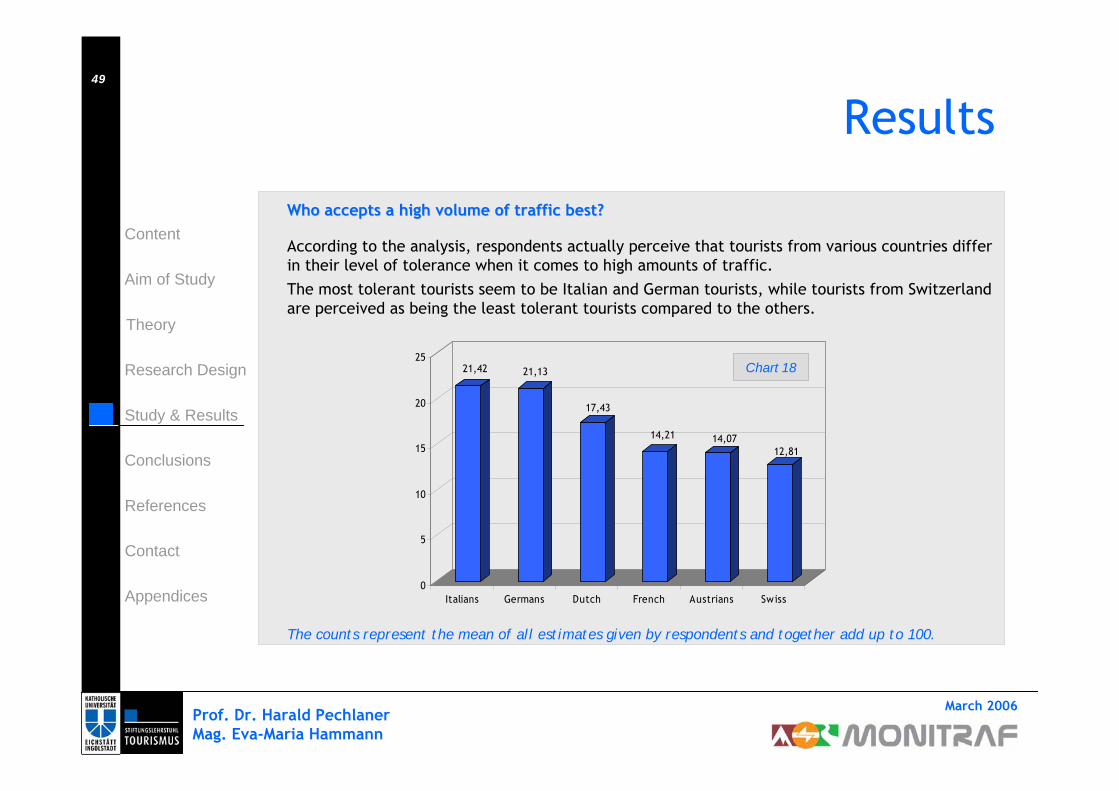
Who accepts a high volume of traffic best?Who accepts a high volume of traffic best?
According to the analysis, respondents actually perceive that tourists from various countries differ in their level of tolerance when it comes to high amounts of traffic.The most tolerant tourists seem to be Italian and German tourists, while tourists from Switzerland are perceived as being the least tolerant tourists compared to the others.
The counts represent the mean of all estimates given by respondents and together add up to 100.
21,42 21,13
17,43
14,21 14,0712,81
0
5
10
15
20
25
Italians Germans Dutch French Austrians Swiss
Chart 18
Prof. Dr. Harald PechlanerMag. Eva-Maria Hammann
March 2006
Content
Theory
Aim of Study
Research Design
Study & Results
Conclusions
Appendices
Contact
References
50
Results
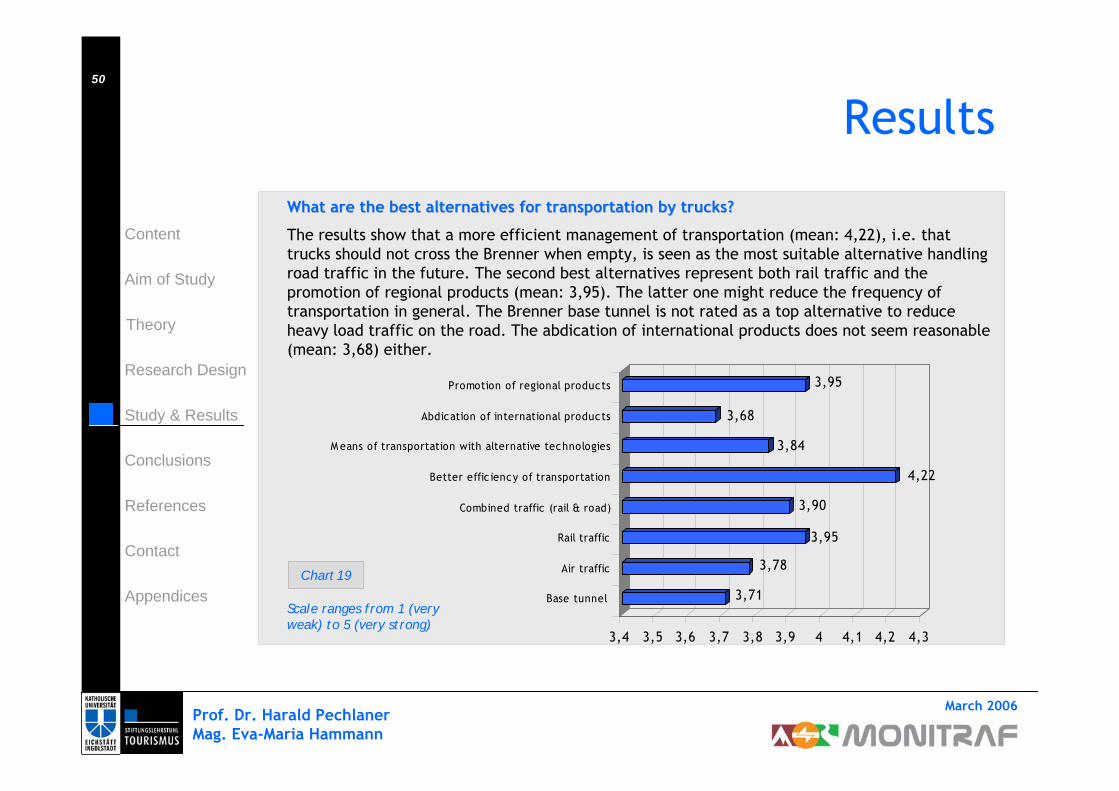
What are the best alternatives for transportation by trucks?What are the best alternatives for transportation by trucks?
The results show that a more efficient management of transportation (mean: 4,22), i.e. that trucks should not cross the Brenner when empty, is seen as the most suitable alternative handling road traffic in the future. The second best alternatives represent both rail traffic and the promotion of regional products (mean: 3,95). The latter one might reduce the frequency of transportation in general. The Brenner base tunnel is not rated as a top alternative to reduce heavy load traffic on the road. The abdication of international products does not seem reasonable (mean: 3,68) either.
Scale ranges from 1 (very weak) to 5 (very strong)
Chart 193,71
3,78
3,95
3,90
4,22
3,84
3,68
3,95
3,4 3,5 3,6 3,7 3,8 3,9 4 4,1 4,2 4,3
Base tunnel
Air traffic
Rail traffic
Combined traffic (rail & road)
Better effic iency of transportation
M eans of transportation with alternative technologies
Abdication of international products
Promotion of regional products
Prof. Dr. Harald PechlanerMag. Eva-Maria Hammann
March 2006
Content
Theory
Aim of Study
Research Design
Study & Results
Conclusions
Appendices
Contact
References
51
3,74
3,70
3,69 3,
72
3,78
3,78
3,76 3,
79
3,92
3,89 3,90 3,
93
3,84
3,82
3,82
3,87
4,16
4,14 4,15
4,17
3,81
3,78 3,
80 3,82
3,63
3,58
3,63
3,63
3,84 3,82 3,
87 3,87
3,20
3,30
3,40
3,50
3,60
3,70
3,80
3,90
4,00
4,10
4,20
Base tunnel Air traffic Rail traffic Combinedtraffic (rail &
road)
Betterefficiency of
transportation
Means oftransportation
withalternative
technologies
Abdication ofinternational
products
Promotion ofregionalproducts
City/municipality
Tourism organization
Hotels
Transport company
Results
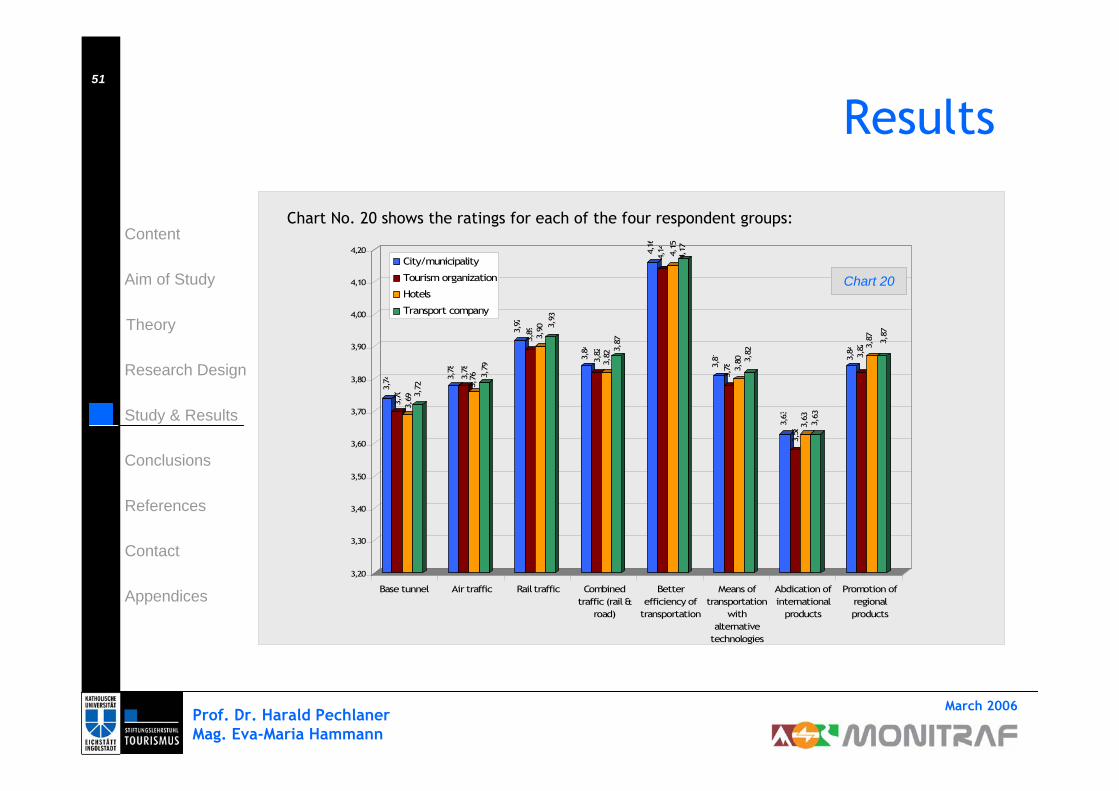
Chart No. 20 shows the ratings for each of the four respondent groups:
Chart 20
Prof. Dr. Harald PechlanerMag. Eva-Maria Hammann
March 2006
Content
Theory
Aim of Study
Research Design
Study & Results
Conclusions
Appendices
Contact
References
52
Results
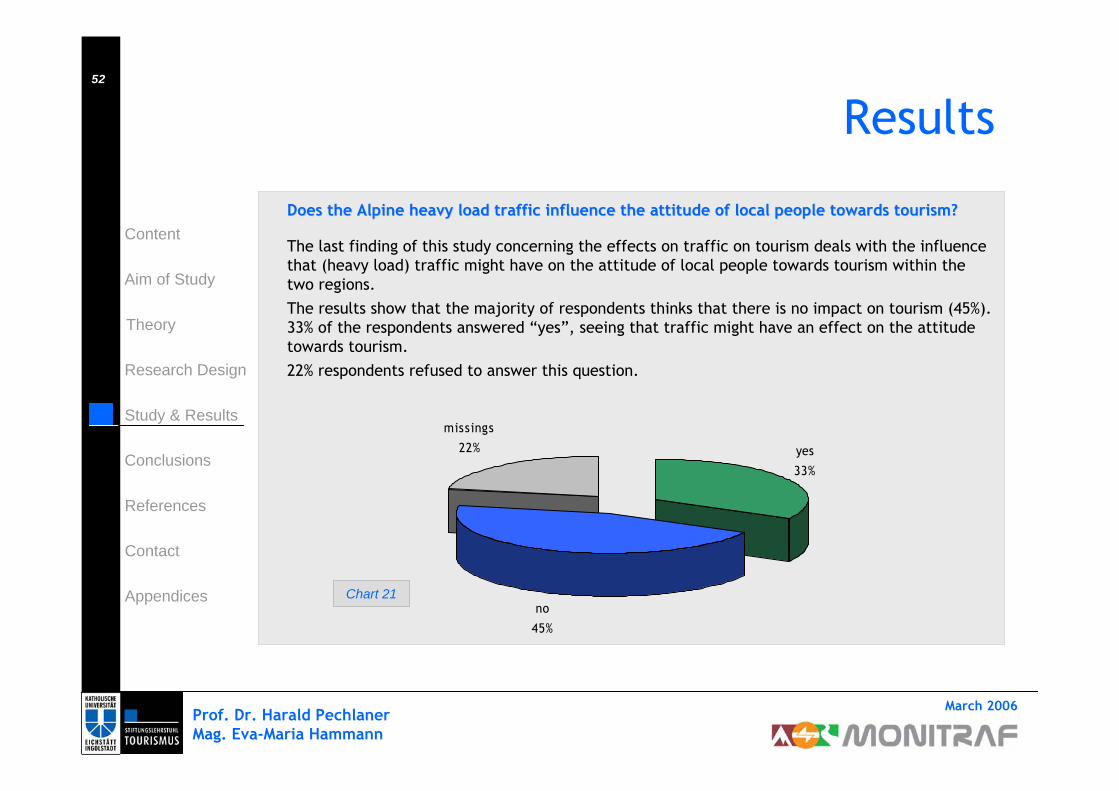
Does the Alpine heavy load traffic influence the attitude of locDoes the Alpine heavy load traffic influence the attitude of local people towards tourism?al people towards tourism?
The last finding of this study concerning the effects on traffic on tourism deals with the influence that (heavy load) traffic might have on the attitude of local people towards tourism within the two regions. The results show that the majority of respondents thinks that there is no impact on tourism (45%). 33% of the respondents answered “yes”, seeing that traffic might have an effect on the attitude towards tourism. 22% respondents refused to answer this question.
yes
33%
no
45%
missings
22%
Chart 21
Prof. Dr. Harald PechlanerMag. Eva-Maria Hammann
March 2006
Content
Theory
Aim of Study
Research Design
Study & Results
Conclusions
Appendices
Contact
References
53
Conclusions
The study provides some interesting insights into the relationship of (heavy load) traffic and tourism in North and South Tyrol which will help in finding and creating tourism related indicators which could be used in further research projects.
Overall, it became clear from email replies of respondents that this topic is of interest for the people in the two regions. Many of them, but particularly city & community officials, asked to get a summary of the study’s findings.
Theory suggests to view tourism as an highly interdependent system, where traffic plays an important role as people have to take some kind of means of transportation to get to their favorite holiday destination. In doing so, they cause traffic, but they are also affected by traffic that runs through the area, namely local people that commute between their home town and the location of their work place as well as truckage and transportation companies that carry goods from one place to another. The study showed that heavy load transportation is perceived as being the main producer of traffic, followed by drive-trough tourists and local commuters.
Thinking of the correlation between tourism and traffic both in general and with regard to heavy load traffic, it was found that the majority of respondents agreed that such a relationship exists. Obviously, tourists and inhabitants realized the traffic that runs through the regions. However, many respondents stated that this does not change people’s attitude towards tourism. This might be due to the fact, that the tourism industry is of one of the most important economic factors (see e.g. Land Tirol 2005).
When asked who accepts the traffic situation best, respondents presumed that Italians and Germans are most tolerant towards traffic compared to the Swiss who are perceived to be least indulgent.
Prof. Dr. Harald PechlanerMag. Eva-Maria Hammann
March 2006
Content
Theory
Aim of Study
Research Design
Study & Results
Conclusions
Appendices
Contact
References
54
Conclusions
Coming back to the traffic situation in the two regions, the study revealed that tourists seem to value a secure trip to their favorite destination which should be accessible easily via well-shaped highways and roads. Having roads and highways in good condition is important as tourists satisfaction can be best attained through the existence of this factor.
The question that comes up with regard to tourists’ satisfaction with their holidays bases on a couple of other factors that seem to be important. Hospitality and the quality and variety of tourist products and services offered by tourist service providers are the most relevant factors that increase the satisfaction of guests. Furthermore, tourists seek quietude, pure air and an intact, beautiful landscape when spending their vacation time in either North or South Tyrol. Apart from these obvious factors, the conditions of roads and highways could identified as excitement attributes in the course of the analysis. The supply with products from other countries which have to be carried to the destinations was identified as performance factor (even though it is not a very important one).
Even though (heavy load) traffic has negative effects on the quality of life and air or the level of quietude and peace in the regions, it is seen as necessary. Three interview partners stated that they do not think that there is a real alternative to road traffic due to its flexibility.
Still, there might be some substitutes for road traffic. Respondents rated a more efficient management of transportation as the best alternatives. This was also one of the most frequently mentioned alternatives in the course of the qualitative telephone interviews. The promotion of regional products or the use of railways to transport goods across Europe are also reasonable alternatives.
Prof. Dr. Harald PechlanerMag. Eva-Maria Hammann
March 2006
Content
Theory
Aim of Study
Research Design
Study & Results
Conclusions
Appendices
Contact
References
55
Conclusions
In particular the use of rail transport was the most stated alternative by interview partners in the seven regions. 30 out of 35 interview partners mentioned trains as substitute for trucks when it comes to the transportation of goods.
Combined traffic (i.e. rail and road transportation) is also seen as a good alternative for the traditional truck-based transportation. It seems that respondents think that the perceived inflexibility of the combined traffic may no longer be a severe issue.
Apart from heavy load traffic, some interview partners mentioned that the promotion of public transportation could be an alternative for commuters and tourists instead of using their private cars. Finally, an abdication of international products is again no relevant means of changing the unfavorable traffic situation in North and South Tyrol. The supply with products from other countries is expected by tourists and rather adds to the perceived quality of tourist destinations.
The comparison of answers by respondents sorted by professional status, i.e. being employed in any institution of the four sectors, did not lead to further information. The only interesting result with regard to this comparison was the fact that tourism organizations respondents rated the abdication of international products lower than the other three groups.
Prof. Dr. Harald PechlanerMag. Eva-Maria Hammann
March 2006
Content
Theory
Aim of Study
Research Design
Study & Results
Conclusions
Appendices
Contact
References
56
Conclusions
Overall, the quantitative study showed that people are well aware of and partly suffer from the problems due to the high volume of heavy load traffic, but they also think that it is an unavoidable evil. Three interview partners stated that from a noise-related perspective it doesn’t make a difference whether trucks or trains pass through the region in order to transport goods.
Besides, a lot of interview partners stated that finding a solution for the high amount of traffic through Alpine space should be of high priority for politics. According to some interview partners discussing the problems of (heavy load) traffic just is not enough. But the potential solutions definitely should be realistic as some regions do not have the infrastructure that is needed to shift traffic from one means of transportation to another.
However, the traffic situation does not severely harm tourism in North and South Tyrol as tourists generally know that there are seasonal traffic shortages. This will not keep them from going on vacation.
Prof. Dr. Harald PechlanerMag. Eva-Maria Hammann
March 2006
Content
Theory
Aim of Study
Research Design
Study & Results
Conclusions
Appendices
Contact
References
57
References
Bieger, T. (2004): "Tourismuslehre - Ein Grundriss, Bern/Stuttgart/Wien: Haupt Verlag.
Bieger, T. (2002): „Management von Destinationen“, 5. Auflage, München/Wien: Oldenbourg.
Bieger, T., and T. von Rohr (2000): "Tourismus - Wirtschaftsfaktor und Lebensbereich," Jugend und Wirtschaft, Lehrerinformation, 3.
eQuestionnaire, www.equestionnaire.de
Fischer, E. and H. Pechlaner (2004): „Faktoren der Kundenzufriedenheit in Industrieerlebniswelten – Eine empirische Erhebung“ in Hinterhuber, H.H., Pechlaner, H., Kaiser, M.-O. and K. Matzler [Hrsg.]: „ Kundenmanagement als Erfolgsfaktor – Grundlagen des Tourismusmarketing“, Schriften zu Tourismus und Freizeit, Band 1, Berlin: ESV, 459-492.
Frank, D. (1997): "Wer erzeugt hier eigentlich Verkehr? - Standpunkt: BMW-Forschungschef Detlef Frank mahnt Politiker zu verkehrspolitischer Konsequenz."
Goeldner, C.R., Ritchie, J.R, and R.W. McIntosh (2000): „Tourism – Principles, Practices, Philosophies“, 8th edition, New York: Wiley.
Hinterhuber, H. H., H. Pechlaner, and K. Matzler (2001): "IndustrieErlebnisWelten: Vom Standort zur Destination". Berlin: ESV.
Kaspar, C. (1996): "Die Tourismuslehre im Grundriss". Bern/Stuttgart/Wien: Haupt.
Land Tirol, www.tirol.gv.at/themen/wirtschaftundtourismus/wirtschaftspolitik/wirtschaftsleitbild/leitlinien-tourismus.shtml (retrieved March 5, 2005)
Leiper, N. (1995): "Tourism Management". Melbourne: RMIT Press.
Madsen, B., C. Jensen-Butler, and J. Zhang (2003): "Regional Economic Impacts of Traffic Regulation on Tourism: The Case of Denmark," RURDS, 15:2, 148-169.
Prof. Dr. Harald PechlanerMag. Eva-Maria Hammann
March 2006
Content
Theory
Aim of Study
Research Design
Study & Results
Conclusions
Appendices
Contact
References
58
References
Matzler, K. (2000): „Customer Value Management“, Die Unternehmung, 54. Jg., Heft 4, 289-307.
Matzler, K., Pechlaner, H. and Siller, H. (2001): Die Ermittlung von Basis-, Leistungs- und Begeisterungsfaktoren der Gästezufriedenheit, Tourismus Journal, Vol. 5 (4), pp. 445-469.
MONITRAF, www.monitraf.org
ÖVG – Österreichische Verkehrswissenschaftliche Gesellschaft, www.oevg.at
Pechlaner, H. (2003): "Tourismus-Destinationen im Wettbewerb". Wiesbaden: Gabler.
Pechlaner, H. and Tschurtschenthaler, P. (2003): “Tourism Policy, Tourism Organizations and Change Management in Alpine Regions and Destinations: A European Perspective“, CurrentIssues in Tourism, Vol. 6 (6), pp. 508-539.
Pechlaner, H., Laesser, C. and F. Raich (2004): „Verkehrsentlastung Dolomitenpässe“, Bozen/St. Gallen.
Roth, P. (2000): "Das Marketing der Reiseveranstalter," in Reiseveranstaltung, ed. by J. W. H. Mundt. München/Wien: Oldenbourg, S. 395-449.
Steinecke, A. (2000): "Erlebnis- und Konsumwelten". München: Oldenbourg.
Vavra, T.G. (1997): Improving your measurement of customer satisfaction: A guide to creating, conducting, analyzing and reporting customer satisfaction measurement program, Milwaukee.

Prof. Dr. Harald PechlanerMag. Eva-Maria Hammann
March 2006
Content
Theory
Aim of Study
Research Design
Study & Results
Conclusions
Appendices
Contact
References
59
Contact Information
Catholic University of Eichstätt-IngolstadtEndowed Chair for TourismProf. Dr. Harald PechlanerP.-Phil.-Jeningen-Platz 2D- 85072 Eichstätt
Phone: +49 (0) 8421 9311-85 / -88 Fax: +49 (0) 8421 9321-85 / -88Email: [email protected]
Website: www.ku-eichstaett.de/tourismus
Prof. Dr. Harald PechlanerMag. Eva-Maria Hammann
March 2006
Content
Theory
Aim of Study
Research Design
Study & Results
Conclusions
Appendices
Contact
References
60
Appendices
Table of Content of Appendices
Appendix A: Qualitative questionnairesAppendix B: Online questionnaireAppendix C: Sample for quantitative studyAppendix D: Interview partners in qualitative study

Appendix A
Prof. Dr. Harald PechlanerMag. Eva-Maria Hammann
March 2006
Content
Theory
Aim of Study
Research Design
Study & Results
Conclusions
Appendices
Contact
References
62
Appendix A
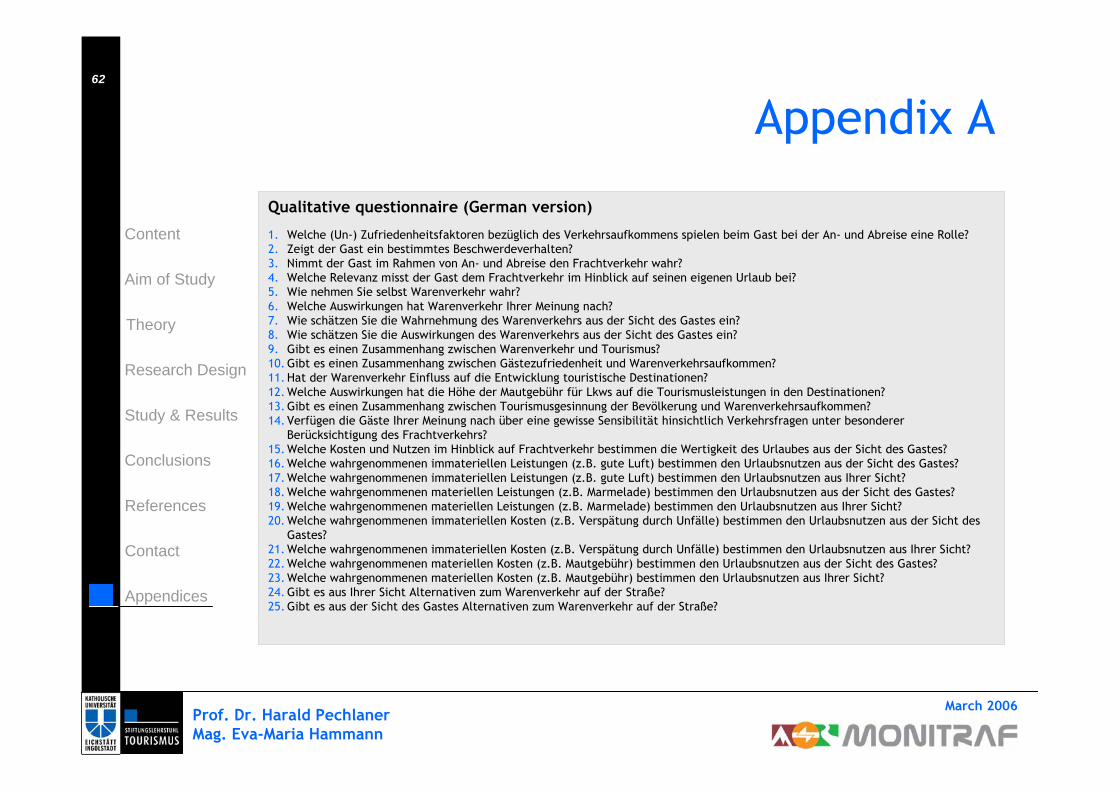
Qualitative questionnaire (German version)
1. Welche (Un-) Zufriedenheitsfaktoren bezüglich des Verkehrsaufkommens spielen beim Gast bei der An- und Abreise eine Rolle?2. Zeigt der Gast ein bestimmtes Beschwerdeverhalten?3. Nimmt der Gast im Rahmen von An- und Abreise den Frachtverkehr wahr?4. Welche Relevanz misst der Gast dem Frachtverkehr im Hinblick auf seinen eigenen Urlaub bei?5. Wie nehmen Sie selbst Warenverkehr wahr?6. Welche Auswirkungen hat Warenverkehr Ihrer Meinung nach?7. Wie schätzen Sie die Wahrnehmung des Warenverkehrs aus der Sicht des Gastes ein?8. Wie schätzen Sie die Auswirkungen des Warenverkehrs aus der Sicht des Gastes ein?9. Gibt es einen Zusammenhang zwischen Warenverkehr und Tourismus?10. Gibt es einen Zusammenhang zwischen Gästezufriedenheit und Warenverkehrsaufkommen?11. Hat der Warenverkehr Einfluss auf die Entwicklung touristische Destinationen?12. Welche Auswirkungen hat die Höhe der Mautgebühr für Lkws auf die Tourismusleistungen in den Destinationen?13. Gibt es einen Zusammenhang zwischen Tourismusgesinnung der Bevölkerung und Warenverkehrsaufkommen?14. Verfügen die Gäste Ihrer Meinung nach über eine gewisse Sensibilität hinsichtlich Verkehrsfragen unter besonderer
Berücksichtigung des Frachtverkehrs?15. Welche Kosten und Nutzen im Hinblick auf Frachtverkehr bestimmen die Wertigkeit des Urlaubes aus der Sicht des Gastes?16. Welche wahrgenommenen immateriellen Leistungen (z.B. gute Luft) bestimmen den Urlaubsnutzen aus der Sicht des Gastes?17. Welche wahrgenommenen immateriellen Leistungen (z.B. gute Luft) bestimmen den Urlaubsnutzen aus Ihrer Sicht?18. Welche wahrgenommenen materiellen Leistungen (z.B. Marmelade) bestimmen den Urlaubsnutzen aus der Sicht des Gastes?19. Welche wahrgenommenen materiellen Leistungen (z.B. Marmelade) bestimmen den Urlaubsnutzen aus Ihrer Sicht?20. Welche wahrgenommenen immateriellen Kosten (z.B. Verspätung durch Unfälle) bestimmen den Urlaubsnutzen aus der Sicht des
Gastes?21. Welche wahrgenommenen immateriellen Kosten (z.B. Verspätung durch Unfälle) bestimmen den Urlaubsnutzen aus Ihrer Sicht?22. Welche wahrgenommenen materiellen Kosten (z.B. Mautgebühr) bestimmen den Urlaubsnutzen aus der Sicht des Gastes?23. Welche wahrgenommenen materiellen Kosten (z.B. Mautgebühr) bestimmen den Urlaubsnutzen aus Ihrer Sicht?24. Gibt es aus Ihrer Sicht Alternativen zum Warenverkehr auf der Straße?25. Gibt es aus der Sicht des Gastes Alternativen zum Warenverkehr auf der Straße?
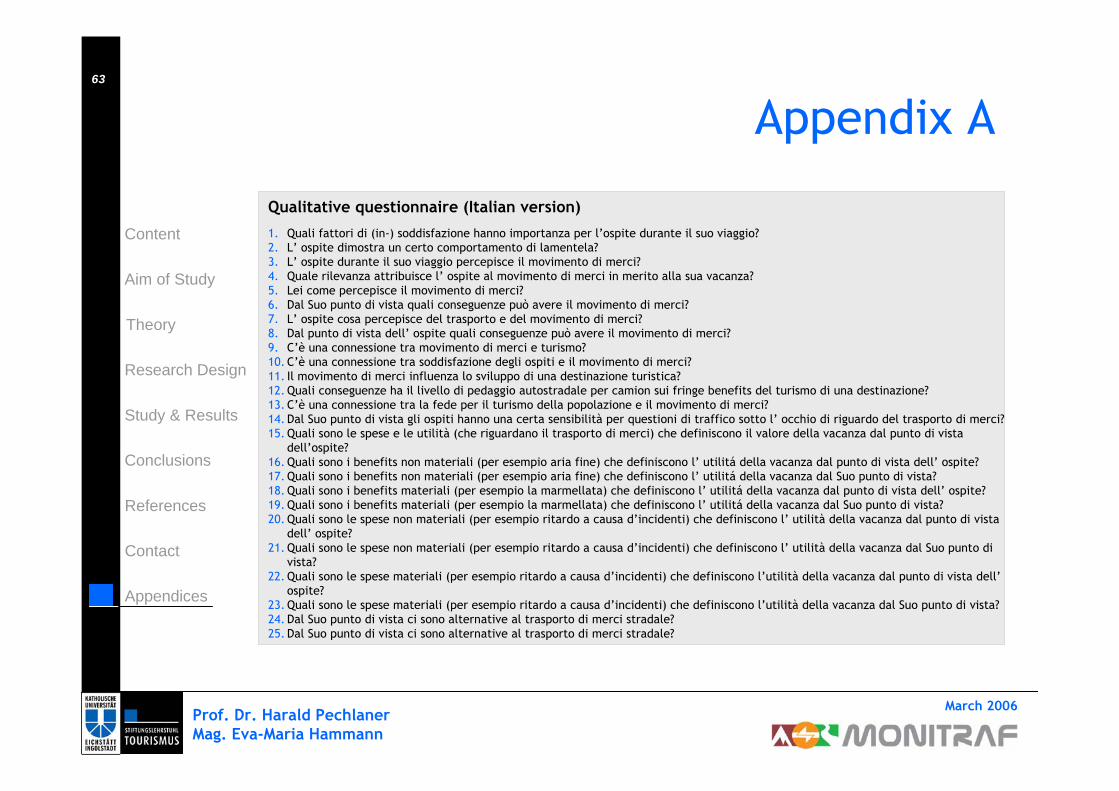
Prof. Dr. Harald PechlanerMag. Eva-Maria Hammann
March 2006
Content
Theory
Aim of Study
Research Design
Study & Results
Conclusions
Appendices
Contact
References
63
Appendix A
Qualitative questionnaire (Italian version)
1. Quali fattori di (in-) soddisfazione hanno importanza per l’ospite durante il suo viaggio? 2. L’ ospite dimostra un certo comportamento di lamentela? 3. L’ ospite durante il suo viaggio percepisce il movimento di merci?4. Quale rilevanza attribuisce l’ ospite al movimento di merci in merito alla sua vacanza?5. Lei come percepisce il movimento di merci?6. Dal Suo punto di vista quali conseguenze può avere il movimento di merci?7. L’ ospite cosa percepisce del trasporto e del movimento di merci?8. Dal punto di vista dell’ ospite quali conseguenze può avere il movimento di merci?9. C’è una connessione tra movimento di merci e turismo? 10. C’è una connessione tra soddisfazione degli ospiti e il movimento di merci?11. Il movimento di merci influenza lo sviluppo di una destinazione turistica?12. Quali conseguenze ha il livello di pedaggio autostradale per camion sui fringe benefits del turismo di una destinazione?13. C’è una connessione tra la fede per il turismo della popolazione e il movimento di merci?14. Dal Suo punto di vista gli ospiti hanno una certa sensibilità per questioni di traffico sotto l’ occhio di riguardo del trasporto di merci?15. Quali sono le spese e le utilità (che riguardano il trasporto di merci) che definiscono il valore della vacanza dal punto di vista
dell’ospite? 16. Quali sono i benefits non materiali (per esempio aria fine) che definiscono l’ utilitá della vacanza dal punto di vista dell’ ospite?17. Quali sono i benefits non materiali (per esempio aria fine) che definiscono l’ utilitá della vacanza dal Suo punto di vista?18. Quali sono i benefits materiali (per esempio la marmellata) che definiscono l’ utilitá della vacanza dal punto di vista dell’ ospite?19. Quali sono i benefits materiali (per esempio la marmellata) che definiscono l’ utilitá della vacanza dal Suo punto di vista?20. Quali sono le spese non materiali (per esempio ritardo a causa d’incidenti) che definiscono l’ utilità della vacanza dal punto di vista
dell’ ospite?21. Quali sono le spese non materiali (per esempio ritardo a causa d’incidenti) che definiscono l’ utilità della vacanza dal Suo punto di
vista?22. Quali sono le spese materiali (per esempio ritardo a causa d’incidenti) che definiscono l’utilità della vacanza dal punto di vista dell’
ospite?23. Quali sono le spese materiali (per esempio ritardo a causa d’incidenti) che definiscono l’utilità della vacanza dal Suo punto di vista?24. Dal Suo punto di vista ci sono alternative al trasporto di merci stradale?25. Dal Suo punto di vista ci sono alternative al trasporto di merci stradale?

Prof. Dr. Harald PechlanerMag. Eva-Maria Hammann
March 2006
Content
Theory
Aim of Study
Research Design
Study & Results
Conclusions
Appendices
Contact
References
64
Appendix A
Qualitative questionnaire (French version)
1. Quels facteurs de satisfaction ou de mécontentement concernant la circulation sont importants pour un touriste quand il arrive ou part d une destination touristique?
2. Les touristes ont-ils l habitude de se plaindre de la circulation dans la région ? (y prêtent ils attention ?)3. Les touristes remarquent-ils la circulation du transport de marchandises lorsqu ils arrivent ou partent d’une destination touristique?4. La circulation due au transport de marchandise affecte t elle les vacances de ces touristes ?5. Y prêtez vous vous-même attention ?6. Selon vous quels sont les effets du transport de marchandises (en général) ?7. Quelle est selon vous la perception du touriste en ce qui concerne le transport de marchandises ?8. Quelles sont les conséquences du transport de marchandises pour les touristes ?9. Y a-t-il un lien entre le transport de marchandises et le tourisme ?10. Y a-t-il un rapport entre la satisfaction des touristes et l essor du transport des marchandises ?11. Le transport de marchandises a-t-il une influence sur le développement des destinations touristiques ?12. Quelles sont les conséquences du prix du péage pour les poids lourds sur les activités touristiques de la région ?13. La circulation des marchandises a-t-elle une influence sur l attitude (perception) des habitants vis-à-vis des touristes ?14. Selon vous, les touristes ont-ils une certaine sensibilité quant aux questions de circulation, compte tenu de la circulation de
marchandises ?15. Selon vous, quelles sont les conséquences, positives et négatives, du transport de marchandises sur la qualité des vacances? 16. Quels sont les conséquences immatériels (par exemple sur l air pur) dues au transport des marchandises qui affectent la qualité des
vacances du point de vue d un touriste ?17. Et selon vous maintenant ?18. Quelles sont les conséquences matérielles dues au transport de marchandises qui affectent la qualité des vacances pour les touristes?19. Et selon vous maintenant ?20. Quels sont les inconvénients immatériels qui affectent la qualité des vacances du point de vue des touristes ?21. Et maintenant selon vous ?22. Quels sont les inconvénients matériels (par exemple les éventuels retards dus aux encombrements sur la route) qui affectent la
qualité des vacances du point de vue des touristes ?23. Et maintenant à votre avis ?24. Pensez-vous qu’il puisse y avoir des alternatives au transport routier de marchandises?25. Pensez-vous que les touristes voient des alternatives au transport routier de marchandises ?

Appendix B
Prof. Dr. Harald PechlanerMag. Eva-Maria Hammann
March 2006
Content
Theory
Aim of Study
Research Design
Study & Results
Conclusions
Appendices
Contact
References
66
Appendix B
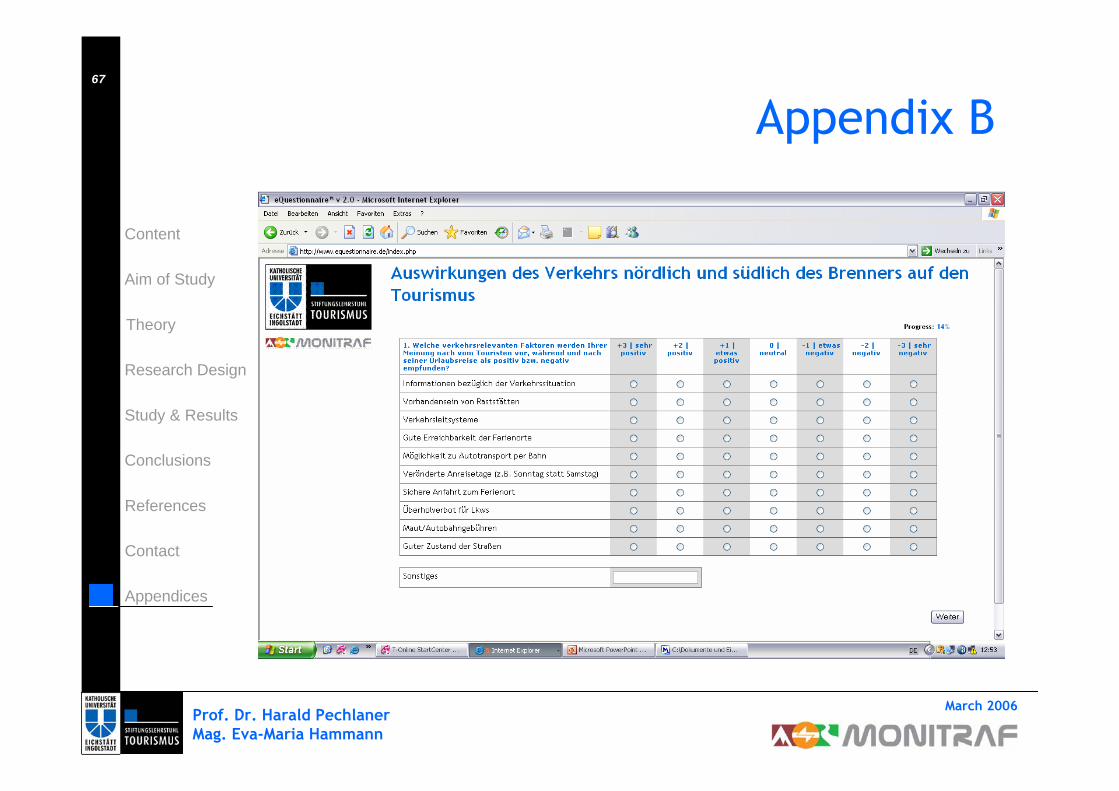
Prof. Dr. Harald PechlanerMag. Eva-Maria Hammann
March 2006
Content
Theory
Aim of Study
Research Design
Study & Results
Conclusions
Appendices
Contact
References
67
Appendix B
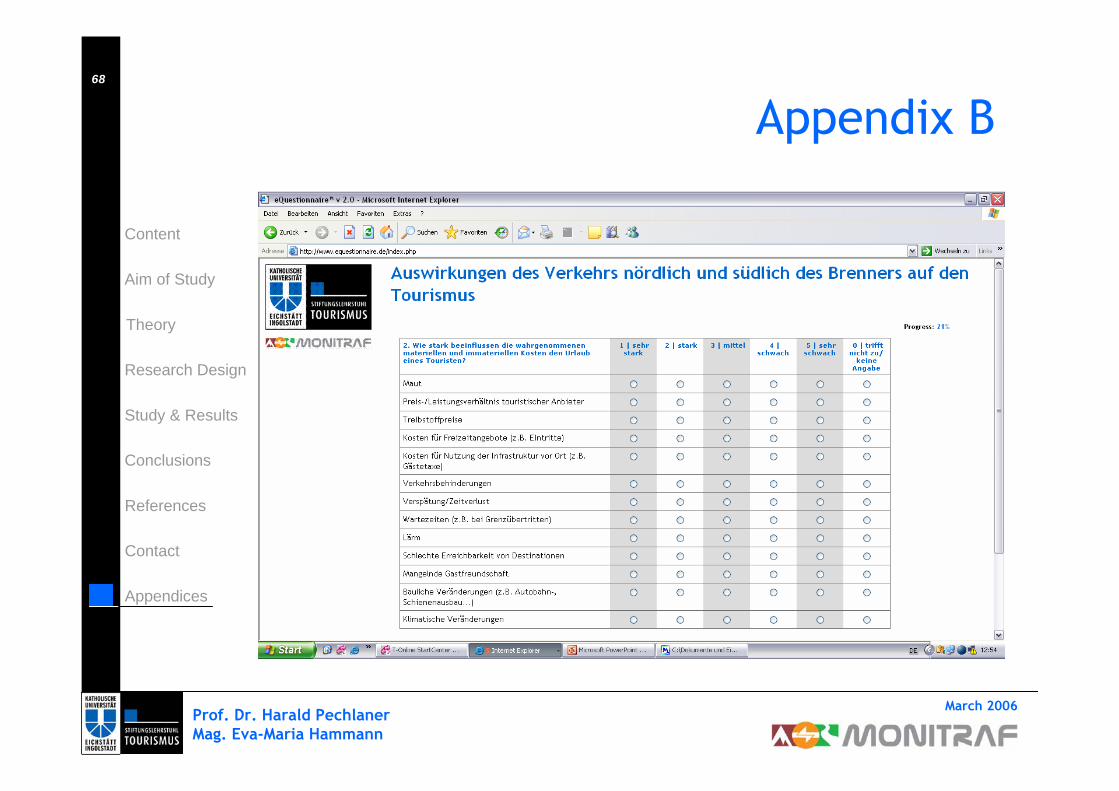
Prof. Dr. Harald PechlanerMag. Eva-Maria Hammann
March 2006
Content
Theory
Aim of Study
Research Design
Study & Results
Conclusions
Appendices
Contact
References
68
Appendix B
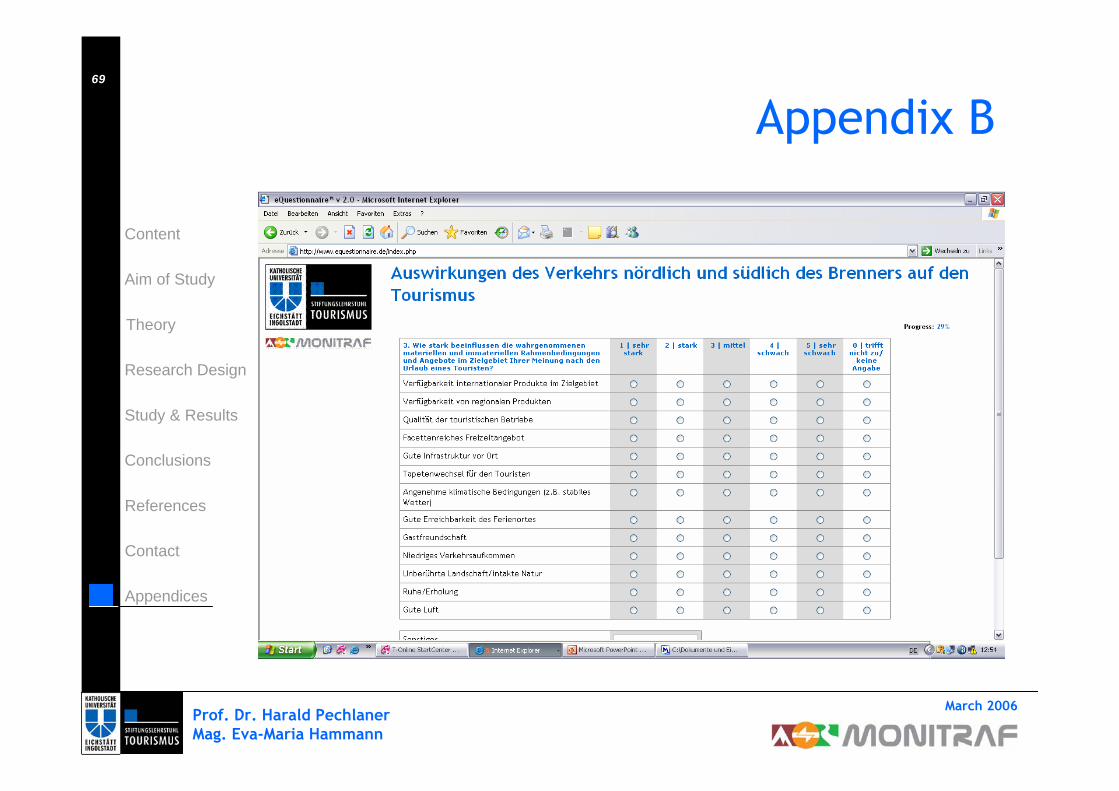
Prof. Dr. Harald PechlanerMag. Eva-Maria Hammann
March 2006
Content
Theory
Aim of Study
Research Design
Study & Results
Conclusions
Appendices
Contact
References
69
Appendix B
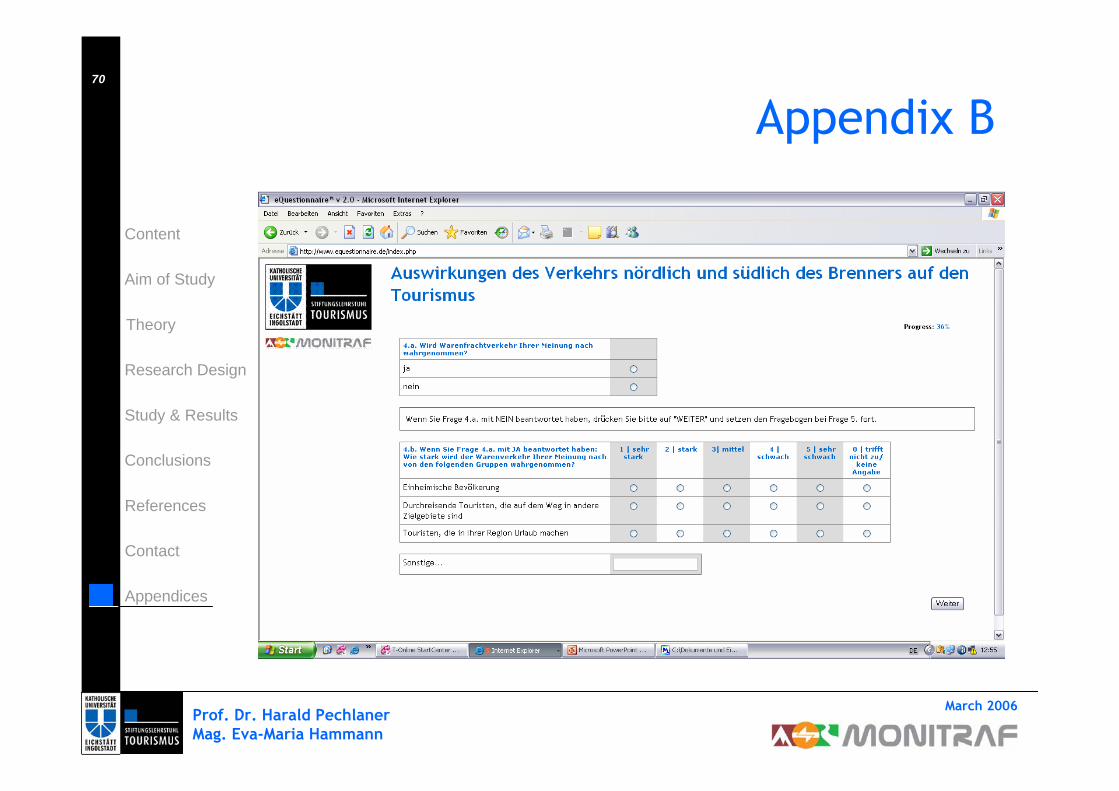
Prof. Dr. Harald PechlanerMag. Eva-Maria Hammann
March 2006
Content
Theory
Aim of Study
Research Design
Study & Results
Conclusions
Appendices
Contact
References
70
Appendix B

Prof. Dr. Harald PechlanerMag. Eva-Maria Hammann
March 2006
Content
Theory
Aim of Study
Research Design
Study & Results
Conclusions
Appendices
Contact
References
71
Appendix B
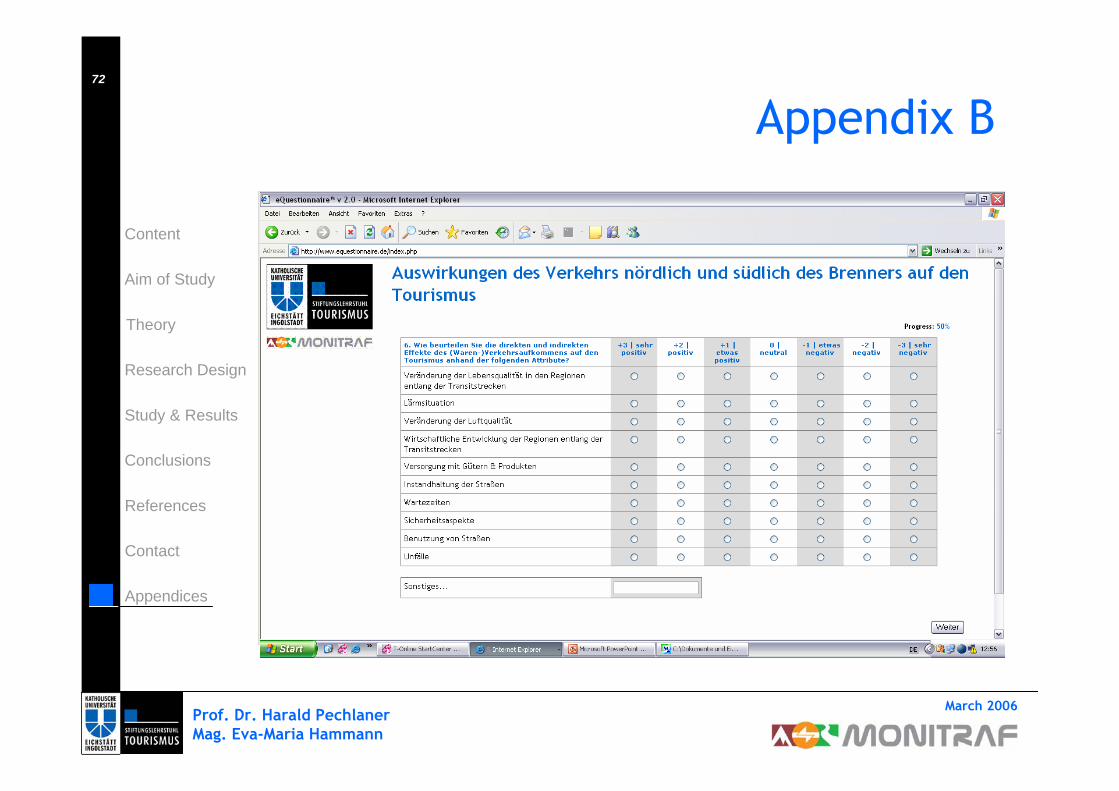
Prof. Dr. Harald PechlanerMag. Eva-Maria Hammann
March 2006
Content
Theory
Aim of Study
Research Design
Study & Results
Conclusions
Appendices
Contact
References
72
Appendix B
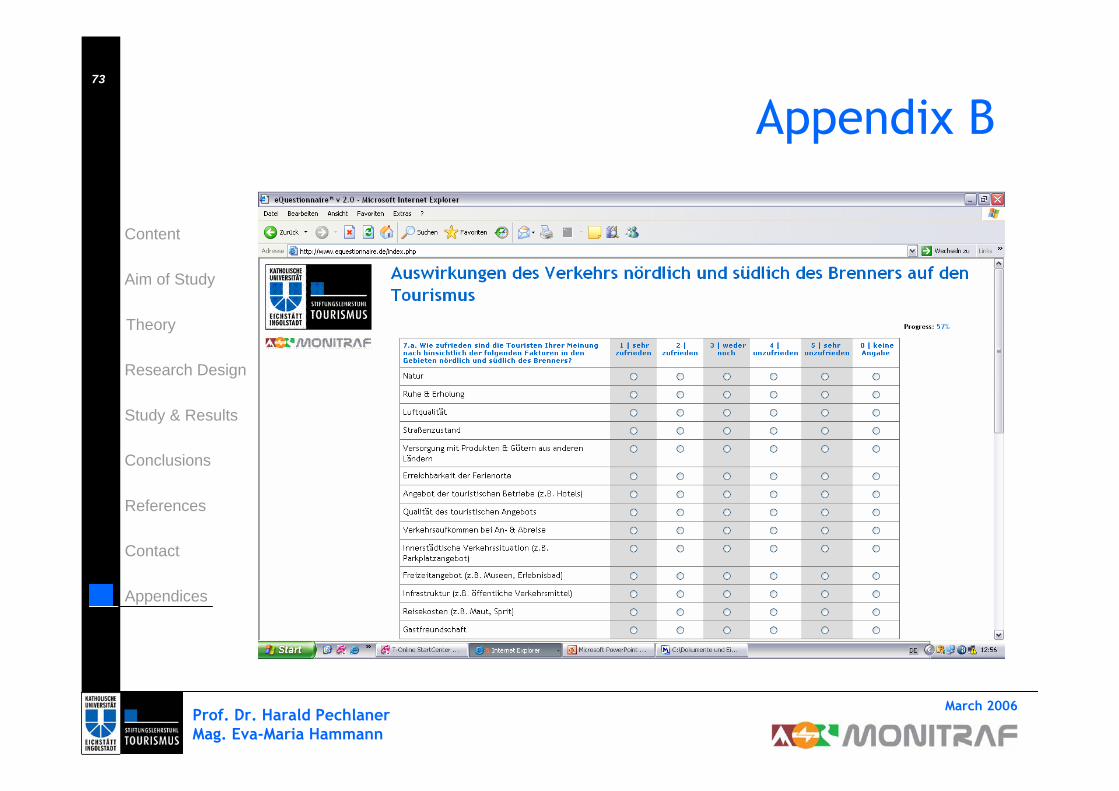
Prof. Dr. Harald PechlanerMag. Eva-Maria Hammann
March 2006
Content
Theory
Aim of Study
Research Design
Study & Results
Conclusions
Appendices
Contact
References
73
Appendix B
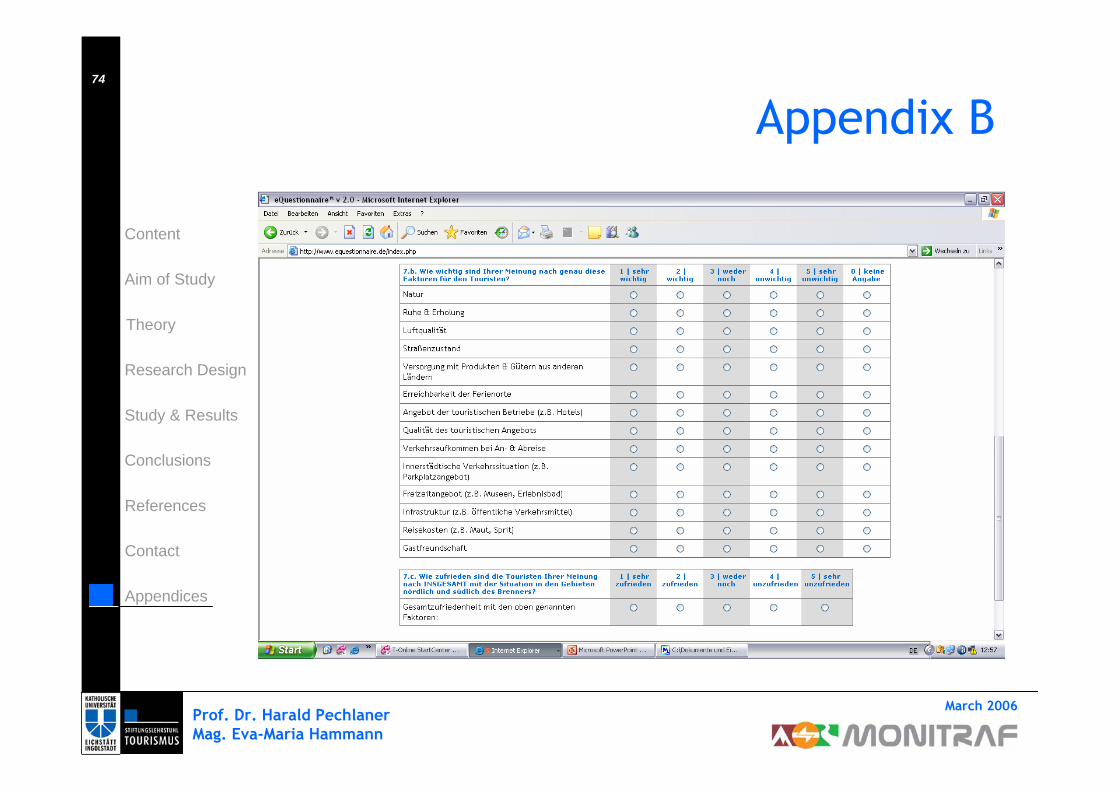
Prof. Dr. Harald PechlanerMag. Eva-Maria Hammann
March 2006
Content
Theory
Aim of Study
Research Design
Study & Results
Conclusions
Appendices
Contact
References
74
Appendix B
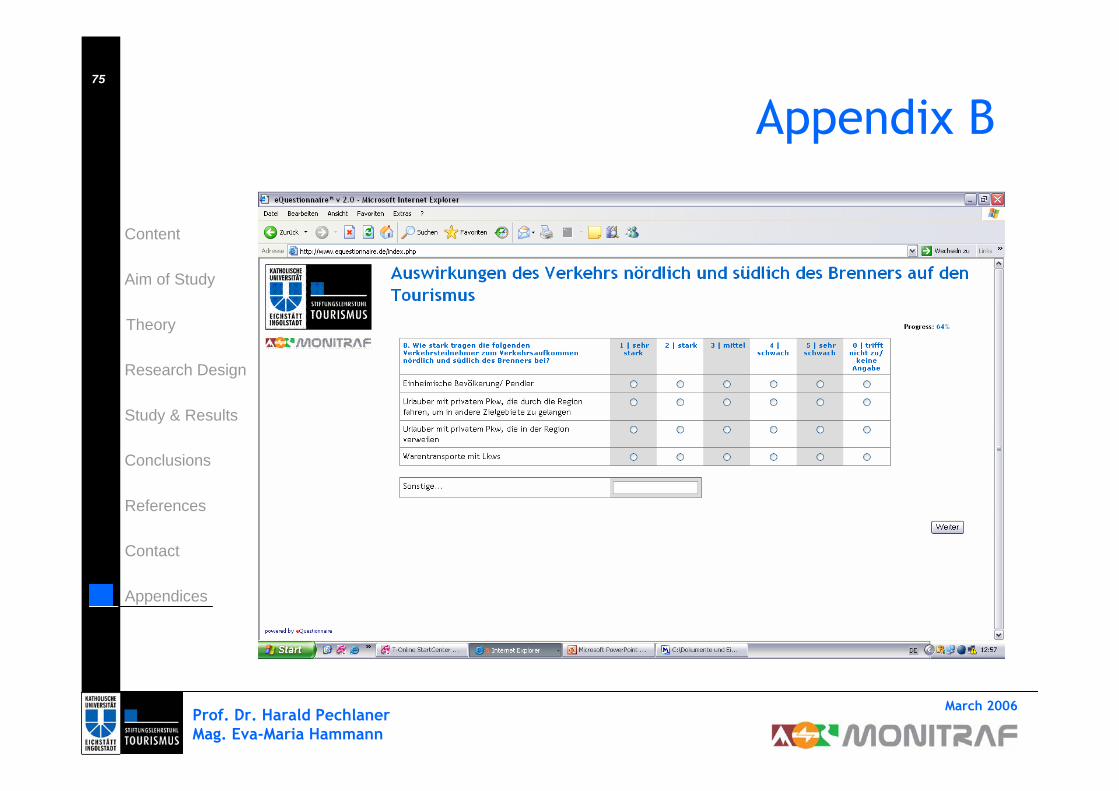
Prof. Dr. Harald PechlanerMag. Eva-Maria Hammann
March 2006
Content
Theory
Aim of Study
Research Design
Study & Results
Conclusions
Appendices
Contact
References
75
Appendix B

Prof. Dr. Harald PechlanerMag. Eva-Maria Hammann
March 2006
Content
Theory
Aim of Study
Research Design
Study & Results
Conclusions
Appendices
Contact
References
76
Appendix B
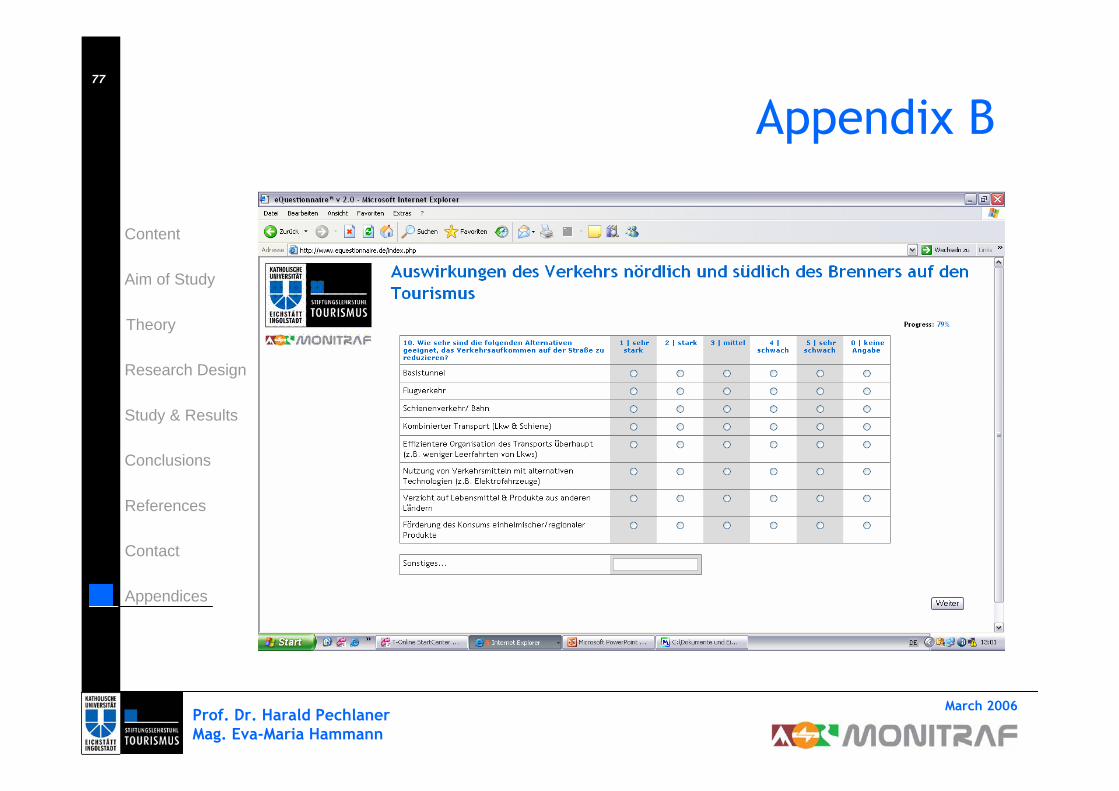
Prof. Dr. Harald PechlanerMag. Eva-Maria Hammann
March 2006
Content
Theory
Aim of Study
Research Design
Study & Results
Conclusions
Appendices
Contact
References
77
Appendix B

Prof. Dr. Harald PechlanerMag. Eva-Maria Hammann
March 2006
Content
Theory
Aim of Study
Research Design
Study & Results
Conclusions
Appendices
Contact
References
78
Appendix B
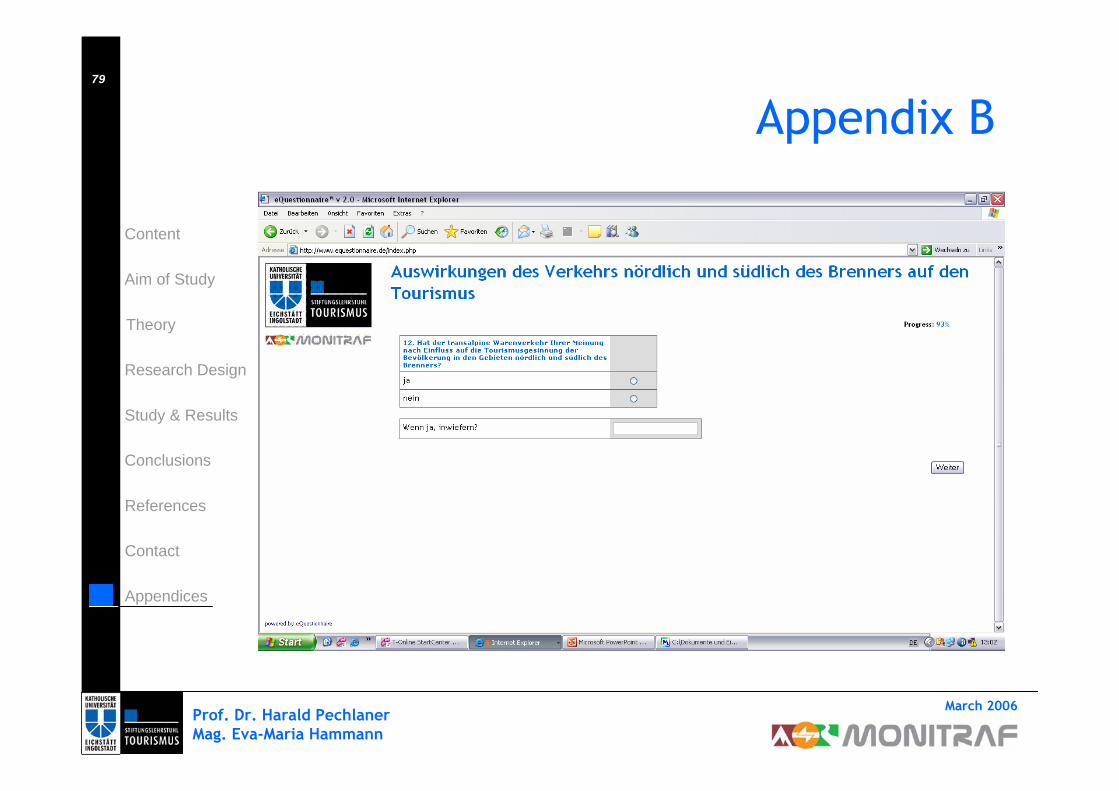
Prof. Dr. Harald PechlanerMag. Eva-Maria Hammann
March 2006
Content
Theory
Aim of Study
Research Design
Study & Results
Conclusions
Appendices
Contact
References
79
Appendix B
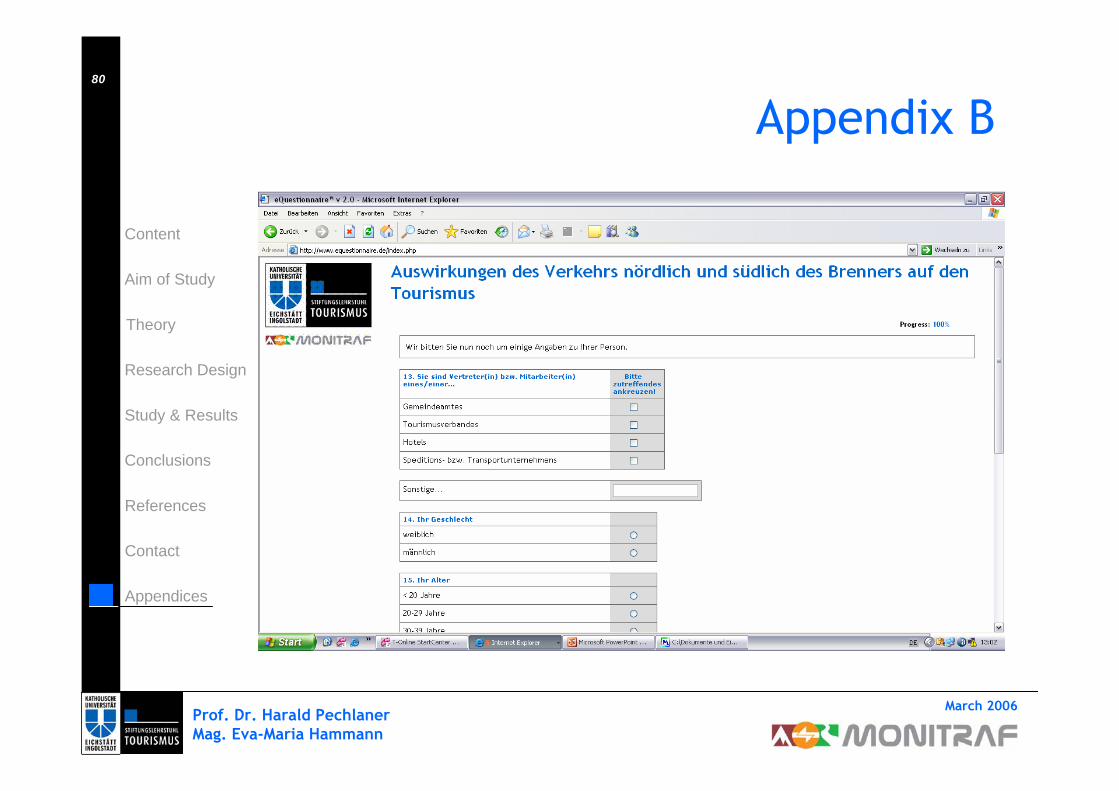
Prof. Dr. Harald PechlanerMag. Eva-Maria Hammann
March 2006
Content
Theory
Aim of Study
Research Design
Study & Results
Conclusions
Appendices
Contact
References
80
Appendix B

Appendix C