effects of soil–water characteristic curve and relative ... · effects of soil–water...
TRANSCRIPT
H O S T E D B Y The Japanese Geotechnical Society
Soils and Foundations
Soils and Foundations 2015;55(6):1400–1411
http://d0038-0
nCorPeer
x.doi.org/1806/& 201
respondinreview un
.sciencedirect.com: www.elsevier.com/locate/sandf
wwwjournal homepage
Effects of soil–water characteristic curve and relative permeability equationson estimation of unsaturated permeability function
Arezoo Rahimia, Harianto Rahardjob,n, Eng-Choon Leongc
aSchool of Civil & Environmental Engineering, Nanyang Technological University, Block N1, B4b-07, Nanyang Avenue, 639798, SingaporebSchool of Civil & Environmental Engineering, Nanyang Technological University, Block N1, 01b-36, Nanyang Avenue, 639798, SingaporecSchool of Civil & Environmental Engineering, Nanyang Technological University, Block N1, 01c-80, Nanyang Avenue, 639798, Singapore
Received 12 November 2014; received in revised form 21 May 2015; accepted 26 July 2015Available online 21 November 2015
Abstract
Unsaturated permeability function can be estimated by theoretical models from soil–water characteristic curve (SWCC). To date, there arenumerous estimation models that can be used to obtain the unsaturated permeability function from SWCC. However, each model results in adifferent estimation curve. The reason for this difference is not well understood.In this study, the available SWCC equations and the available relative permeability (kr) equations were combined to form a matrix of
unsaturated permeability estimation models. The matrix of unsaturated permeability estimation models was used to study the effect of SWCCequations and relative permeability (kr) equations as controlling factors in the estimation of unsaturated permeability function. The study wasconducted using twenty sets of published experimentally measured SWCC and unsaturated permeability data (kw). The effects of the SWCCequations and kr equations on a variation of estimated unsaturated permeability functions are presented in this paper. It was found that the SWCCequation has a more significant effect on the estimation of unsaturated permeability function than that of the kr equation.& 2015 The Japanese Geotechnical Society. Production and hosting by Elsevier B.V. All rights reserved.
Keywords: Unsaturated soil; Permeability function; Modeling; Soil–water characteristic curve; Estimation
1. Introduction
Flow through the unsaturated zone of soil contributes to avariety of geotechnical and geo-environmental problems. Theunsaturated permeability function is the most importanthydraulic property governing the flow process. Therefore,knowledge of the unsaturated permeability function is crucialin the analysis of the flow process in the unsaturated zone. Theunsaturated permeability function can be directly measured insoil laboratories; however, a reliable measurement of thepermeability function for an unsaturated soil is challengingdue to the time-consuming nature and high cost of taking
0.1016/j.sandf.2015.10.0065 The Japanese Geotechnical Society. Production and hosting by
g author.der responsibility of The Japanese Geotechnical Society.
direct measurements (van Genuchten, 1980; Agus et al., 2003;Chaminda et al., 2013). To overcome the high cost and theother challenges associated with taking direct measurements,the unsaturated permeability function can be estimated bytheoretical models derived from the soil–water characteristiccurve (SWCC). There are numerous estimation models thatcan be used to obtain the unsaturated permeability functionfrom the SWCC. However, each model results in a differentestimation curve for the unsaturated permeability function, andno unified model which can be used for all soil types has beenput forward to date (Mualem, 1986). The reason for thisdifference is not well understood.The objective of this study is to provide an understanding of
the underlying reasons behind this variation. In this study, the
Elsevier B.V. All rights reserved.
A. Rahimi et al. / Soils and Foundations 55 (2015) 1400–1411 1401
available SWCC equations and the available relative perme-ability (kr) equations were combined to form a matrix ofunsaturated permeability estimation models. The matrix ofunsaturated permeability estimation models was used to studythe effect of the SWCC equations and relative permeability (kr)equations as factors controlling the estimation of the unsatu-rated permeability function. The study was conducted ontwenty sets of published data which had experimentallymeasured SWCC and unsaturated permeability (kw) data.
2. Background
2.1. Combination of soil–water characteristic curve andrelative permeability equations
Unsaturated permeability estimation models usually com-bine knowledge of the soil–water characteristic curve (SWCC)with a flow equation and derive an equation to estimate theunsaturated permeability function. This procedure is in fact anintegration of the SWCC with a relative permeability (kr)equation. The outcome of this integration (or combination) isan unsaturated permeability estimation model. Researchershave proposed different unsaturated permeability estimationmodels by combining a specific SWCC equation with aspecific kr equation (Brooks and Corey, 1964; Brutsaert,1966; van Genuchten, 1980; Fredlund et al., 1994). However,there is significant variation between the estimated unsaturatedpermeability functions using these models. It appears that theSWCC and the kr equations are among the factors controllingthis variation and a standard procedure is required to investi-gate their effects.
2.2. Selection of relative permeability (kr) equations
Unsaturated permeability estimation models can be dividedinto uniform pore-size and parallel models, known as macro-scopic models, and series-parallel models, known as statisticalmodels. The uniform pore-size models (Kozeny, 1927; Carman,1937; Averjanov, 1950; Yuster, 1951; Irmay, 1954; Carman,1956) have been shown to have limited applicability (Wyllieand Spangler, 1952). Since the parallel models (Purcell, 1949;Burdine et al., 1950; Gates and Tempelaar Lietz, 1950; Fatt andDykstra, 1951; Wyllie and Spangler, 1952; Burdine, 1953;Wyllie and Gardner, 1958; Rowe, 1960) overestimated theunsaturated permeability at high suction values, the concept oftortuosity was introduced to compensate for the poor fit betweenthe measured and the predicted values (Burdine, 1953; Fatt andDykstra, 1951; Gates and Tempelaar Lietz, 1950; Wyllie andSpangler, 1952). The series-parallel models (Childs and Collis-George, 1950; Marshall, 1958; Millington and Quirk, 1959;Kunze et al., 1968; Mualem, 1976; Assouline, 2001) accountedfor the random distribution of pore-sizes in the direction of flowby introducing a “cutting and rejoining” concept. While thesemodels may underestimate the relative permeability at lowmoisture contents (Brutsaert, 1966), they do appear moretheoretical, and they are well-suited for practical use due tothe fewer empirical factors required.
Mualem and Dagan (1978) generalized Childs and Collis-George, Burdine and Mualem models as statistical models asfollows:Generalized Childs and Collis-George (C)
kr θð Þ ¼ Sn1e
Z θ
0
θ�ϑð Þψ2þb
dϑ
Z θs
0
θs�ϑð Þψ2þb
dϑ
�ð1Þ
Generalized Burdine (B)
kr θð Þ ¼ Sn1e
Z θ
0
dθ
ψ2þb
Z θs
0
dθ
ψ2þb
�ð2Þ
Generalized Mualem (M)
kr θð Þ ¼ Sn1e
Z θ
0
dθ
ψ1þb
Z θs
0
dθ
ψ1þb�2
:
,"ð3Þ
where kr is the relative permeability, ψ is suction, kPa, θ isthe effective volumetric water content defined as θ¼ θw�θr,θw is the actual volutric water content, θr is the residualvolumetric water content, θS is the saturated volumetric watercontent, ϑ is a dummy variable of integration, Se ¼ θw � θr
θS � θris
effective saturation and b and n1 are parameters accounting fortortuosity. It should be noted that the Burdine model wasconsidered as a statistical model (Mualem and Dagan, 1978)even though it is a parallel or macroscopic model whichincorporates the random distribution of pore-sizes by means ofa tortuosity factor. These equations (i.e., (1), (2) and (3)) wereselected as relative permeability equations (kr) in this study.
2.3. Selection of soil–water characteristic curve equations
The soil–water characteristic curve (SWCC), which is defined asthe relationship between the amount of water in the soil and soilsuction (Fredlund, 2002), is a key factor in the estimation ofunsaturated permeability function. The SWCC can be obtained inthe laboratory through measurements of the soil water content atdifferent suction values. A mathematical equation can be used tobest-fit the measured SWCC data. To date, there have beennumerous best-fit equations proposed for the soil–water character-istic curve of unsaturated soil (Brooks and Corey, 1964; Brutsaert,1966; Fredlund and Xing, 1994; Gardner, 1958; McKee andBumb, 1984; McKee and Bumb, 1987; van Genuchten, 1980).Among all the equations, those proposed by van Genuchten (1980)and Fredlund and Xing (1994) give more flexibility to the equationto best-fit the measured data (Leong and Rahardjo, 1997). Fredlundand Xing (1994) equation is expressed as:
θw ¼C ψð Þ θS
ln exp 1ð Þþ ψa
� �n� �� �m ð4Þ
where C ψð Þ ¼ 1� ln 1þ ψψr
� �ln 1þ 106
ψr
� � is a correction factor, ψ r is the
suction corresponding to the residual water content, a is thefitting parameter related to the air-entry value of the soil (kPa),n is the fitting parameter related to the slope of the SWCC, m isthe fitting parameter related to the residual water content of thesoil, e is the Euler number, 2.71828, ψ is soil suction or totalsuction, (kPa). Leong and Rahardjo (1997) concluded that
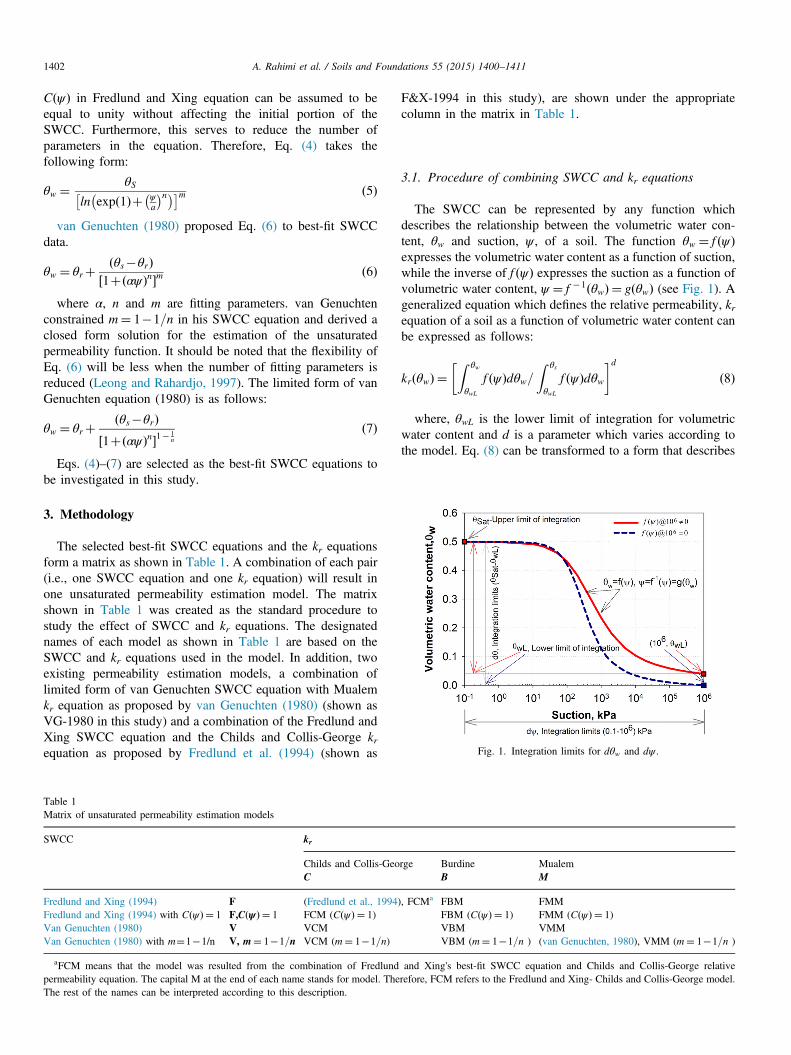
Fig. 1. Integration limits for dθw and dψ .
A. Rahimi et al. / Soils and Foundations 55 (2015) 1400–14111402
C ψð Þ in Fredlund and Xing equation can be assumed to beequal to unity without affecting the initial portion of theSWCC. Furthermore, this serves to reduce the number ofparameters in the equation. Therefore, Eq. (4) takes thefollowing form:
θw ¼ θS
ln exp 1ð Þþ ψa
� �n� �� �m ð5Þ
van Genuchten (1980) proposed Eq. (6) to best-fit SWCCdata.
θw ¼ θrþθs�θrð Þ
1þ αψð Þn½ �m ð6Þ
where α, n and m are fitting parameters. van Genuchtenconstrained m¼ 1�1=n in his SWCC equation and derived aclosed form solution for the estimation of the unsaturatedpermeability function. It should be noted that the flexibility ofEq. (6) will be less when the number of fitting parameters isreduced (Leong and Rahardjo, 1997). The limited form of vanGenuchten equation (1980) is as follows:
θw ¼ θrþθs�θrð Þ
1þ αψð Þn½ �1� 1n
ð7Þ
Eqs. (4)–(7) are selected as the best-fit SWCC equations tobe investigated in this study.
3. Methodology
The selected best-fit SWCC equations and the kr equationsform a matrix as shown in Table 1. A combination of each pair(i.e., one SWCC equation and one kr equation) will result inone unsaturated permeability estimation model. The matrixshown in Table 1 was created as the standard procedure tostudy the effect of SWCC and kr equations. The designatednames of each model as shown in Table 1 are based on theSWCC and kr equations used in the model. In addition, twoexisting permeability estimation models, a combination oflimited form of van Genuchten SWCC equation with Mualemkr equation as proposed by van Genuchten (1980) (shown asVG-1980 in this study) and a combination of the Fredlund andXing SWCC equation and the Childs and Collis-George krequation as proposed by Fredlund et al. (1994) (shown as
Table 1Matrix of unsaturated permeability estimation models
SWCC kr
Childs and Collis-GeoC
Fredlund and Xing (1994) F (Fredlund et al., 1994)Fredlund and Xing (1994) with C ψð Þ ¼ 1 F,C ψð Þ ¼ 1 FCM (C ψð Þ ¼ 1)Van Genuchten (1980) V VCMVan Genuchten (1980) with m¼1�1/n V, m¼ 1�1=n VCM (m¼ 1�1=n)
aFCM means that the model was resulted from the combination of Fredlundpermeability equation. The capital M at the end of each name stands for model. TheThe rest of the names can be interpreted according to this description.
F&X-1994 in this study), are shown under the appropriatecolumn in the matrix in Table 1.
3.1. Procedure of combining SWCC and kr equations
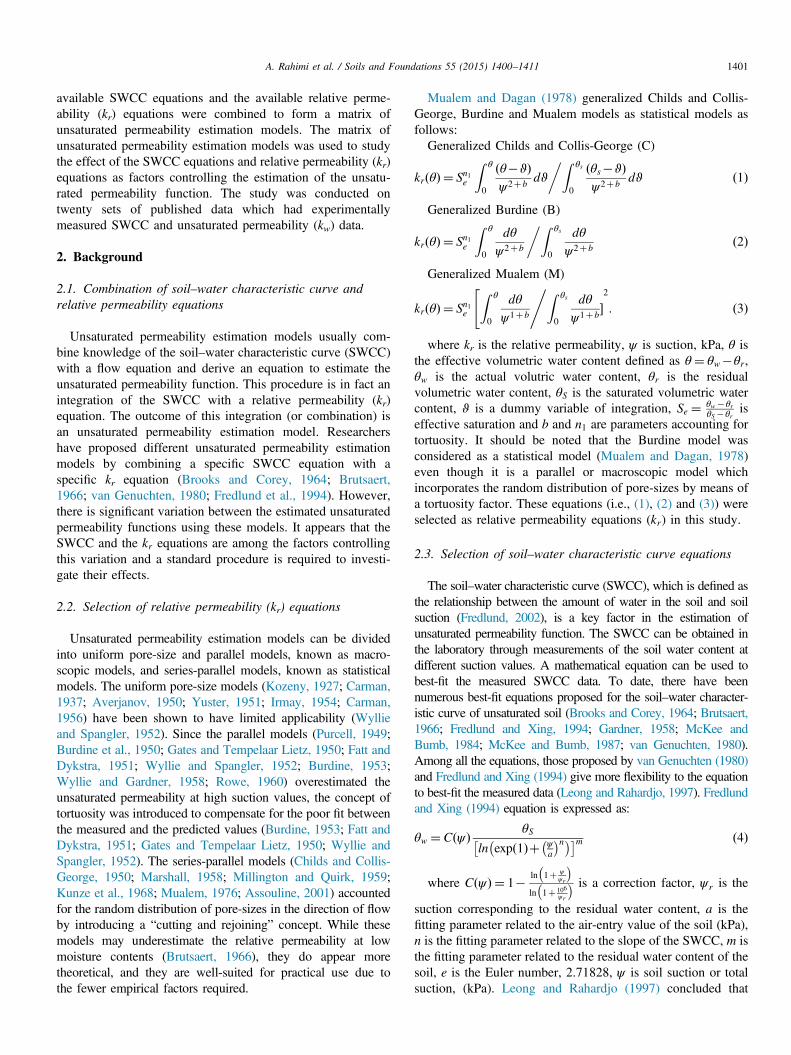
The SWCC can be represented by any function whichdescribes the relationship between the volumetric water con-tent, θw and suction, ψ , of a soil. The function θw ¼ f ψð Þexpresses the volumetric water content as a function of suction,while the inverse of f ψð Þ expresses the suction as a function ofvolumetric water content, ψ ¼ f �1 θwð Þ ¼ g θwð Þ (see Fig. 1). Ageneralized equation which defines the relative permeability, krequation of a soil as a function of volumetric water content canbe expressed as follows:
kr θwð Þ ¼Z θw
θwL
f ψð Þdθw=Z θs
θwL
f ψð Þdθw� �d
ð8Þ
where, θwL is the lower limit of integration for volumetricwater content and d is a parameter which varies according tothe model. Eq. (8) can be transformed to a form that describes
rge Burdine MualemB M
, FCMa FBM FMMFBM (C ψð Þ ¼ 1) FMM (C ψð Þ ¼ 1)VBM VMMVBM (m¼ 1�1=n ) (van Genuchten, 1980), VMM (m¼ 1�1=n )
and Xing's best-fit SWCC equation and Childs and Collis-George relativerefore, FCM refers to the Fredlund and Xing- Childs and Collis-George model.
A. Rahimi et al. / Soils and Foundations 55 (2015) 1400–1411 1403
the relative permeability equation as a function of suction:
kr ψð Þ ¼Z ψ θwð Þ
ψ θwLð Þf ψð Þf 0 ψð Þdψ=
Z ψ θsð Þ
ψ θwLð Þf ψð Þf 0 ψð Þdψ
� �dð9Þ
Fig. 1 shows the integration limits for both the kr θwð Þ andkr ψð Þ equations.
In general, SWCC can be divided into a finite number ofintervals along the volumetric water content or suction axis.The relationship between two subsequent points on the curvecan be described by a polygon or linear equation as follows:
θw ¼ f ψð Þ ¼ θwiþθwiþ1�θwið Þψ iþ1�ψ i
� � ψ�ψ i
� � ð10Þ
ψ ¼ g θwð Þ ¼ ψ iþψ iþ1�ψ i
� �θwiþ1�θwið Þ θw�θwið Þ ð11Þ
Fig. 2 shows the division of SWCC into a finite number ofintervals along the volumetric water content or suction axisand their respective equations. If Eq. (11) is substituted intoEq. (8) or Eq. (10) is substituted into Eq. (9) and theintegration is performed numerically, a series can be obtainedas an unsaturated permeability estimation model which can beexpressed as a function of the volumetric water content orsuction, respectively.
Fig. 2. Division of SWCC into finite number of points.
Table 2Resulted series from combination of SWCC and kr equations.
kr Series
Childs and Collis-George (C)
krðψÞ ¼PMi ¼ 0
θwθwiþ 1 � θwi
ψ iψ iþ 1� θwiþ 1
ψ i � ψ
�PN � 1
i ¼ 0
θSθwiþ 1 � θwi
ψ iψ iþ 1� θwiþ 1
ψ i � ψ
�Burdine (B)
kr ψð Þ ¼PMi ¼ 0
θwiþ 1 � θwiψ iψ iþ 1PN � 1
i ¼ 0
θwiþ 1 � θwiψ iψ iþ 1
Mualem (M)
krðψÞ ¼PMi ¼ 0
θwiþ 1 � θwiψ i � ψ iþ 1
ln
ψ iψ iþ 1
PN � 1
i ¼ 0
θwiþ 1 � θwiψ i � ψ iþ 1
ln
ψ iψ iþ 1
264
In order to obtain the θw ¼ f ψð Þ relationship, a SWCCequation (i.e., Eqs. (4)–(7)) was used to best-fit the experimen-tally measured SWCC data with the least square method. Thebest-fit curve was divided into a finite number of intervals alongthe suction axis. Eqs. (10) or (11) was then used to represent therelationship between two subsequent points on the curve andsubstituted into a kr equation (i.e., Eqs. (12)–(14)). Byperforming numerical integration along the respective axis,three general permeability estimation models are obtained.Table 2 shows the models based on their kr equations.
3.2. Assumptions made in the combined models
1) All the models considered in this study were developedbased on actual volumetric water content (θwÞ and not oneffective water content θ¼ θw�θr. The residual volumetricwater content, θr, is required in order to compute theeffective water content, θ¼ θw�θr. The residual volu-metric water content is defined qualitatively as the watercontent below which a large increase in suction is requiredto remove additional water (Fredlund et al., 1994). How-ever, there is no theoretical definition for this parameter.The common practice for determining the residual watercontent is by the graphical method (Fredlund and Xing,1994; Vanapalli et al., 1998) and there is no independentprocedure for determining the residual water content (vanGenuchten, 1980). If an effective volumetric water content(normalized) is used in estimating the unsaturated perme-ability of soil, the value of relative permeability, kr, atresidual volumetric water content, θr is zero (Fredlund etal., 1994). However, in soil physics, the unsaturatedpermeability at θr cannot be zero (Brutsaert, 1966). There-fore, the models presented in this study were based onactual volumetric water content and not on the normalizedvolumetric water content.
2) Parameters b and n1 were introduced into Eqs. (1)–(3) toprovide relative permeability models with more flexibility(Mualem and Dagan, 1978). However, these two para-meters need to be determined emperically from measureddata. Therefore, the value of these two parameters depends
Models name
� θwi
iþ 1
θwiþ 1ψ iþ 1
� θwiψ i
þ θwiþ 1 � θwi
ψ i � ψ iþ 1
2
lnψ i
ψ iþ 1
�� θwiiþ 1
θwiþ 1ψ iþ 1
� θwiψ i
þ θwiþ 1 � θwi
ψ i � ψ iþ 1
2
lnψ i
ψ iþ 1
�FCMFCM C ψð Þ ¼ 1VCMVCM m¼1�1/n.
FBMFBM C ψð Þ ¼ 1VBMVBM m¼1�1/n3
752 FMM
FMM C ψð Þ ¼ 1VMMVMM m¼1�1/n
A. Rahimi et al. / Soils and Foundations 55 (2015) 1400–14111404
on the soil database under consideration. For instance,values of 0, 2 and 0.5 were proposed for parameter n1 byChilds Collis-George (1950), Burdine (1953) and Mualem(1976), respectively, based on their soil database. As theobjective of this paper was to investigate the variationbetween the different models fairly independent from soildatabase, correction factor was not considered. Therefore,the value of zero was considered for parameter b and n1 inEqs. (1)–(3).
Therefore, Eqs. (1)–(3) take the following forms:Childs and Collis-George (C)
kr θwð Þ ¼Z θw
0
θw�ϑð Þψ2
dϑ=
Z θs
0
θs�ϑð Þψ2
dϑ ð12Þ
Burdine (B)
kr θwð Þ ¼Z θw
0
dθwψ2
=
Z θs
0
dθwψ2
ð13Þ
Mualem (M)
kr θwð Þ ¼Z θw
0
dθwψ
=
Z θs
0
dθwψ
� �2ð14Þ
3) Vapor permeability was assumed as a lower limit for theestimated relative permeabilities in the study. The vaporpermeability was computed based on modified form of Fick'slaw and it was normalized with respect to the saturatedpermeability of the soil (i.e., relative vapor permeability).The details on the lower limit of permeability can be found inEbrahimi et al. (2004) and Peters and Durner (2008).
Table 3Soil data base used in the study.
Soil number Reference Soil name
S1 Elrick and Bowman (1964) Guelph LoamS2 van Genuchten (1980) Beit Netofa ClayS3 Moore (1939) Yolo light clayS4 Brooks and Corey (1964) Touchet silt loamS5 Brooks and Corey (1964) Columbia Sandy loamS6 Brooks and Corey (1964) Hygiene SandstoneS7 Richards (1952) Superstition SandS8 van Genuchten (1980) Silt LoamS9 Meerdink and Benson (1996) Wenatchee Silty ClayS10 Meerdink and Benson (1996) Live Oak Red ClayS11 Ng and Leung (2011) CDTS12 Rassam and Williams (1999) Mine TailingsS13 Samingan et al. (2003) UP-1 (Residual soil)S14 Samingan et al. (2003) UP-2 (Residual soil)S15 Samingan et al. (2003) UP-3 (Residual soil)S16 Samingan et al. (2003) UP-4 (Residual soil)S17 Valiantzas (2011) Weld Silty ClayS18 Valiantzas (2011) Fine SandS19 Valiantzas (2011) Volcanic SandS20 Van Genuchten and Nielsen (1985) G.E. No.2 Sand
4. Results and discussions
4.1. General assessment
Twenty sets of published data which had experimentallymeasured SWCC and permeability data as shown in Table 3were selected from the literature. The measured SWCC data ofeach soil was best-fit by Eqs. (4)–(7) by the least square method.Table 4 shows the values of SWCC fitting parameters for Siltloam (S8) and Guelph loam (S1) soils. The unsaturated perme-ability functions were then estimated by the matrix of unsatu-rated permeability estimation models shown in Table 1.Therefore, fourteen unsaturated permeability functions (2 exist-ing models and 12 models combined in this study) wereestimated for each of the soils selected in the study. Fig. 3shows the results of best-fit SWCCs and the estimated unsatu-rated permeability functions (i.e., shown as relative permeability)of Silt loam. The root mean square error (RMSE) was used as astatistical measure to evaluate the fit of the estimation models tothe measured data for the soil database as presented in Table 5.The RMSE is defined according to Eq. (15).
RMSE¼
ffiffiffiffiffiffiffiffiffiffiffiffiffiffiffiffiffiffiffiffiffiffiffiffiffiffiffiffiffiffiffiffiffiffiffiffiffiffiffiffiffiffiffiffiffiffiffiffiffiffiffiffiffiffiffiffiffi∑i ¼ X
i ¼ 1 log krið Þ� log k̂ ri 2
X
vuutð15Þ
Where, kr is the measured unsaturated permeability value, k̂ ris the estimated unsaturated permeability value, X is thenumber of measured data points and i is a counter.The RMSE values show the deviation between the measured
unsaturated permeability and estimated values. An overallcomparison of the RMSE values for all 14 estimation models(matrix of unsaturated permeability estimation models) sug-gests that the VMM m¼1�1/n, VCM m¼1�1/n and F&X-1994 models resulted in the lowest average and standard
ks (m/s) θS Last measured suction value of SWCC (kPa)
3.917� 10�6 0.519 95.569.491� 10�9 0.447 1385.531.230� 10�7 0.373 63.383.507� 10�5 0.469 37.24N.A. 0.455 8.281.250� 10�5 0.250 18.911.830� 10�5 0.47 20.005.741� 10�7 0.396 96.322.200� 10�9 0.360 500.003.200� 10�8 0.520 249.272.52� 10�7 0.419 66.789.19� 10�7 0.391 500.001.21� 10�8 0.443 9275.146.65� 10�8 0.494 8955.866.25� 10�10 0.310 9361.889.48� 10�7 0.594 1000.005.671� 10�6 0.461 19.091.250� 10�5 0.360 11.938.102� 10�5 0.343 18.54N.A. 0.376 4.65
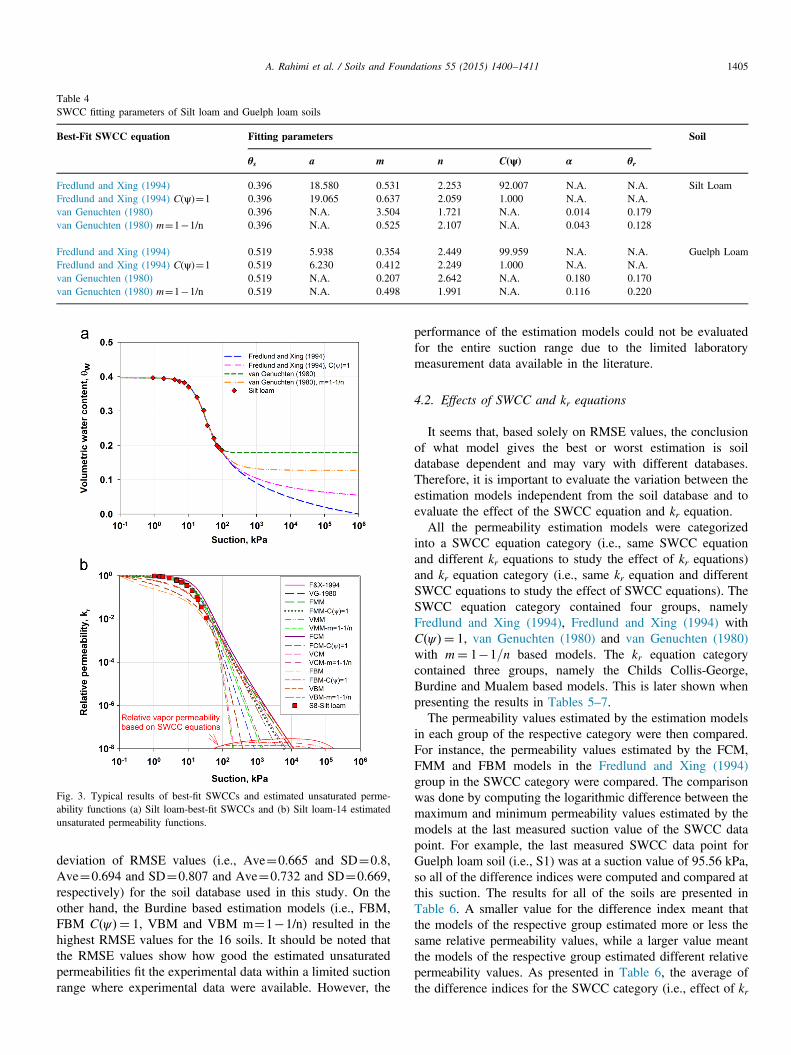
Table 4SWCC fitting parameters of Silt loam and Guelph loam soils
Best-Fit SWCC equation Fitting parameters Soil
θs a m n C(ψ) α θr
Fredlund and Xing (1994) 0.396 18.580 0.531 2.253 92.007 N.A. N.A. Silt LoamFredlund and Xing (1994) C(ψ)¼1 0.396 19.065 0.637 2.059 1.000 N.A. N.A.van Genuchten (1980) 0.396 N.A. 3.504 1.721 N.A. 0.014 0.179van Genuchten (1980) m¼1�1/n 0.396 N.A. 0.525 2.107 N.A. 0.043 0.128
Fredlund and Xing (1994) 0.519 5.938 0.354 2.449 99.959 N.A. N.A. Guelph LoamFredlund and Xing (1994) C(ψ)¼1 0.519 6.230 0.412 2.249 1.000 N.A. N.A.van Genuchten (1980) 0.519 N.A. 0.207 2.642 N.A. 0.180 0.170van Genuchten (1980) m¼1�1/n 0.519 N.A. 0.498 1.991 N.A. 0.116 0.220
Fig. 3. Typical results of best-fit SWCCs and estimated unsaturated perme-ability functions (a) Silt loam-best-fit SWCCs and (b) Silt loam-14 estimatedunsaturated permeability functions.
A. Rahimi et al. / Soils and Foundations 55 (2015) 1400–1411 1405
deviation of RMSE values (i.e., Ave¼0.665 and SD¼0.8,Ave¼0.694 and SD¼0.807 and Ave¼0.732 and SD¼0.669,respectively) for the soil database used in this study. On theother hand, the Burdine based estimation models (i.e., FBM,FBM C ψð Þ ¼ 1, VBM and VBM m¼1�1/n) resulted in thehighest RMSE values for the 16 soils. It should be noted thatthe RMSE values show how good the estimated unsaturatedpermeabilities fit the experimental data within a limited suctionrange where experimental data were available. However, the
performance of the estimation models could not be evaluatedfor the entire suction range due to the limited laboratorymeasurement data available in the literature.
4.2. Effects of SWCC and kr equations
It seems that, based solely on RMSE values, the conclusionof what model gives the best or worst estimation is soildatabase dependent and may vary with different databases.Therefore, it is important to evaluate the variation between theestimation models independent from the soil database and toevaluate the effect of the SWCC equation and kr equation.All the permeability estimation models were categorized
into a SWCC equation category (i.e., same SWCC equationand different kr equations to study the effect of kr equations)and kr equation category (i.e., same kr equation and differentSWCC equations to study the effect of SWCC equations). TheSWCC equation category contained four groups, namelyFredlund and Xing (1994), Fredlund and Xing (1994) withC ψð Þ ¼ 1, van Genuchten (1980) and van Genuchten (1980)with m¼ 1�1=n based models. The kr equation categorycontained three groups, namely the Childs Collis-George,Burdine and Mualem based models. This is later shown whenpresenting the results in Tables 5–7.The permeability values estimated by the estimation models
in each group of the respective category were then compared.For instance, the permeability values estimated by the FCM,FMM and FBM models in the Fredlund and Xing (1994)group in the SWCC category were compared. The comparisonwas done by computing the logarithmic difference between themaximum and minimum permeability values estimated by themodels at the last measured suction value of the SWCC datapoint. For example, the last measured SWCC data point forGuelph loam soil (i.e., S1) was at a suction value of 95.56 kPa,so all of the difference indices were computed and compared atthis suction. The results for all of the soils are presented inTable 6. A smaller value for the difference index meant thatthe models of the respective group estimated more or less thesame relative permeability values, while a larger value meantthe models of the respective group estimated different relativepermeability values. As presented in Table 6, the average ofthe difference indices for the SWCC category (i.e., effect of kr
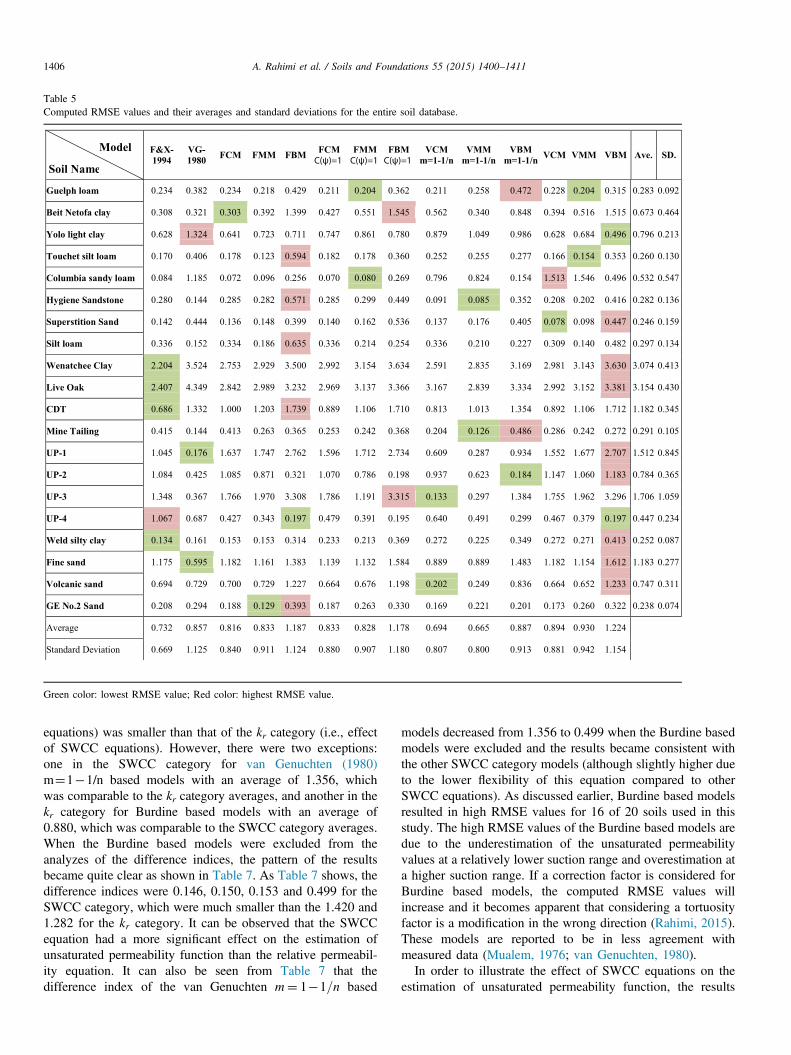
Table 5Computed RMSE values and their averages and standard deviations for the entire soil database.
F&X-1994
VG-1980 FCM FMM FBM FCM
C(ψ)=1FMM C(ψ)=1
FBM C(ψ)=1
VCM m=1-1/n
VMM m=1-1/n
VBM m=1-1/n VCM VMM VBM Ave. SD.
Guelph loam 0.234 0.382 0.234 0.218 0.429 0.211 0.204 0.362 0.211 0.258 0.472 0.228 0.204 0.315 0.283 0.092
Beit Netofa clay 0.308 0.321 0.303 0.392 1.399 0.427 0.551 1.545 0.562 0.340 0.848 0.394 0.516 1.515 0.673 0.464
Yolo light clay 0.628 1.324 0.641 0.723 0.711 0.747 0.861 0.780 0.879 1.049 0.986 0.628 0.684 0.496 0.796 0.213
Touchet silt loam 0.170 0.406 0.178 0.123 0.594 0.182 0.178 0.360 0.252 0.255 0.277 0.166 0.154 0.353 0.260 0.130
Columbia sandy loam 0.084 1.185 0.072 0.096 0.256 0.070 0.080 0.269 0.796 0.824 0.154 1.513 1.546 0.496 0.532 0.547
Hygiene Sandstone 0.280 0.144 0.285 0.282 0.571 0.285 0.299 0.449 0.091 0.085 0.352 0.208 0.202 0.416 0.282 0.136
Superstition Sand 0.142 0.444 0.136 0.148 0.399 0.140 0.162 0.536 0.137 0.176 0.405 0.078 0.098 0.447 0.246 0.159
Silt loam 0.336 0.152 0.334 0.186 0.635 0.336 0.214 0.254 0.336 0.210 0.227 0.309 0.140 0.482 0.297 0.134
Wenatchee Clay 2.204 3.524 2.753 2.929 3.500 2.992 3.154 3.634 2.591 2.835 3.169 2.981 3.143 3.630 3.074 0.413
Live Oak 2.407 4.349 2.842 2.989 3.232 2.969 3.137 3.366 3.167 2.839 3.334 2.992 3.152 3.381 3.154 0.430
CDT 0.686 1.332 1.000 1.203 1.739 0.889 1.106 1.710 0.813 1.013 1.354 0.892 1.106 1.712 1.182 0.345
Mine Tailing 0.415 0.144 0.413 0.263 0.365 0.253 0.242 0.368 0.204 0.126 0.486 0.286 0.242 0.272 0.291 0.105
UP-1 1.045 0.176 1.637 1.747 2.762 1.596 1.712 2.734 0.609 0.287 0.934 1.552 1.677 2.707 1.512 0.845
UP-2 1.084 0.425 1.085 0.871 0.321 1.070 0.786 0.198 0.937 0.623 0.184 1.147 1.060 1.183 0.784 0.365
UP-3 1.348 0.367 1.766 1.970 3.308 1.786 1.191 3.315 0.133 0.297 1.384 1.755 1.962 3.296 1.706 1.059
UP-4 1.067 0.687 0.427 0.343 0.197 0.479 0.391 0.195 0.640 0.491 0.299 0.467 0.379 0.197 0.447 0.234
Weld silty clay 0.134 0.161 0.153 0.153 0.314 0.233 0.213 0.369 0.272 0.225 0.349 0.272 0.271 0.413 0.252 0.087
Fine sand 1.175 0.595 1.182 1.161 1.383 1.139 1.132 1.584 0.889 0.889 1.483 1.182 1.154 1.612 1.183 0.277
Volcanic sand 0.694 0.729 0.700 0.729 1.227 0.664 0.676 1.198 0.202 0.249 0.836 0.664 0.652 1.233 0.747 0.311
GE No.2 Sand 0.208 0.294 0.188 0.129 0.393 0.187 0.263 0.330 0.169 0.221 0.201 0.173 0.260 0.322 0.238 0.074
Average 0.732 0.857 0.816 0.833 1.187 0.833 0.828 1.178 0.694 0.665 0.887 0.894 0.930 1.224
Standard Deviation 0.669 1.125 0.840 0.911 1.124 0.880 0.907 1.180 0.807 0.800 0.913 0.881 0.942 1.154
Model
Soil Name
Green color: lowest RMSE value; Red color: highest RMSE value.
A. Rahimi et al. / Soils and Foundations 55 (2015) 1400–14111406
equations) was smaller than that of the kr category (i.e., effectof SWCC equations). However, there were two exceptions:one in the SWCC category for van Genuchten (1980)m¼1�1/n based models with an average of 1.356, whichwas comparable to the kr category averages, and another in thekr category for Burdine based models with an average of0.880, which was comparable to the SWCC category averages.When the Burdine based models were excluded from theanalyzes of the difference indices, the pattern of the resultsbecame quite clear as shown in Table 7. As Table 7 shows, thedifference indices were 0.146, 0.150, 0.153 and 0.499 for theSWCC category, which were much smaller than the 1.420 and1.282 for the kr category. It can be observed that the SWCCequation had a more significant effect on the estimation ofunsaturated permeability function than the relative permeabil-ity equation. It can also be seen from Table 7 that thedifference index of the van Genuchten m¼ 1�1=n based
models decreased from 1.356 to 0.499 when the Burdine basedmodels were excluded and the results became consistent withthe other SWCC category models (although slightly higher dueto the lower flexibility of this equation compared to otherSWCC equations). As discussed earlier, Burdine based modelsresulted in high RMSE values for 16 of 20 soils used in thisstudy. The high RMSE values of the Burdine based models aredue to the underestimation of the unsaturated permeabilityvalues at a relatively lower suction range and overestimation ata higher suction range. If a correction factor is considered forBurdine based models, the computed RMSE values willincrease and it becomes apparent that considering a tortuosityfactor is a modification in the wrong direction (Rahimi, 2015).These models are reported to be in less agreement withmeasured data (Mualem, 1976; van Genuchten, 1980).In order to illustrate the effect of SWCC equations on the
estimation of unsaturated permeability function, the results
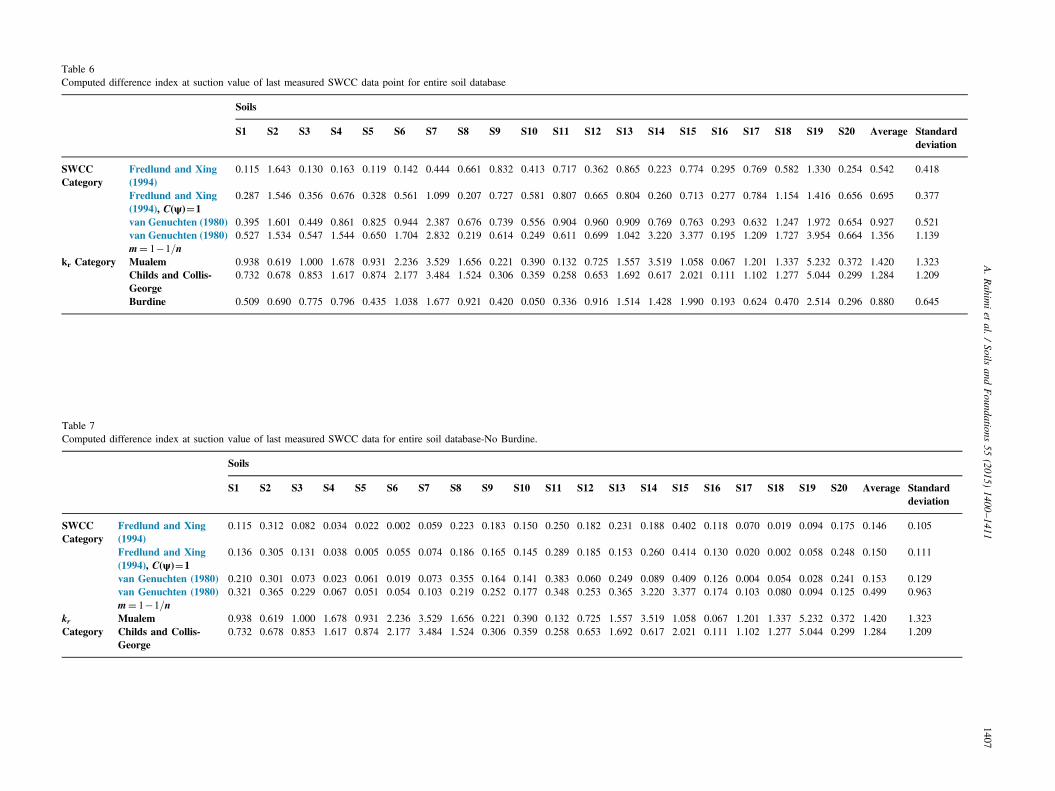
Table 6Computed difference index at suction value of last measured SWCC data point for entire soil database
Soils
S1 S2 S3 S4 S5 S6 S7 S8 S9 S10 S11 S12 S13 S14 S15 S16 S17 S18 S19 S20 Average Standarddeviation
SWCCCategory
Fredlund and Xing(1994)
0.115 1.643 0.130 0.163 0.119 0.142 0.444 0.661 0.832 0.413 0.717 0.362 0.865 0.223 0.774 0.295 0.769 0.582 1.330 0.254 0.542 0.418
Fredlund and Xing(1994), C(ψ)¼1
0.287 1.546 0.356 0.676 0.328 0.561 1.099 0.207 0.727 0.581 0.807 0.665 0.804 0.260 0.713 0.277 0.784 1.154 1.416 0.656 0.695 0.377
van Genuchten (1980) 0.395 1.601 0.449 0.861 0.825 0.944 2.387 0.676 0.739 0.556 0.904 0.960 0.909 0.769 0.763 0.293 0.632 1.247 1.972 0.654 0.927 0.521van Genuchten (1980)m¼ 1�1=n
0.527 1.534 0.547 1.544 0.650 1.704 2.832 0.219 0.614 0.249 0.611 0.699 1.042 3.220 3.377 0.195 1.209 1.727 3.954 0.664 1.356 1.139
kr Category Mualem 0.938 0.619 1.000 1.678 0.931 2.236 3.529 1.656 0.221 0.390 0.132 0.725 1.557 3.519 1.058 0.067 1.201 1.337 5.232 0.372 1.420 1.323Childs and Collis-George
0.732 0.678 0.853 1.617 0.874 2.177 3.484 1.524 0.306 0.359 0.258 0.653 1.692 0.617 2.021 0.111 1.102 1.277 5.044 0.299 1.284 1.209
Burdine 0.509 0.690 0.775 0.796 0.435 1.038 1.677 0.921 0.420 0.050 0.336 0.916 1.514 1.428 1.990 0.193 0.624 0.470 2.514 0.296 0.880 0.645
Table 7Computed difference index at suction value of last measured SWCC data for entire soil database-No Burdine.
Soils
S1 S2 S3 S4 S5 S6 S7 S8 S9 S10 S11 S12 S13 S14 S15 S16 S17 S18 S19 S20 Average Standarddeviation
SWCCCategory
Fredlund and Xing(1994)
0.115 0.312 0.082 0.034 0.022 0.002 0.059 0.223 0.183 0.150 0.250 0.182 0.231 0.188 0.402 0.118 0.070 0.019 0.094 0.175 0.146 0.105
Fredlund and Xing(1994), C(ψ)¼1
0.136 0.305 0.131 0.038 0.005 0.055 0.074 0.186 0.165 0.145 0.289 0.185 0.153 0.260 0.414 0.130 0.020 0.002 0.058 0.248 0.150 0.111
van Genuchten (1980) 0.210 0.301 0.073 0.023 0.061 0.019 0.073 0.355 0.164 0.141 0.383 0.060 0.249 0.089 0.409 0.126 0.004 0.054 0.028 0.241 0.153 0.129van Genuchten (1980)m¼ 1�1=n
0.321 0.365 0.229 0.067 0.051 0.054 0.103 0.219 0.252 0.177 0.348 0.253 0.365 3.220 3.377 0.174 0.103 0.080 0.094 0.125 0.499 0.963
krCategory
Mualem 0.938 0.619 1.000 1.678 0.931 2.236 3.529 1.656 0.221 0.390 0.132 0.725 1.557 3.519 1.058 0.067 1.201 1.337 5.232 0.372 1.420 1.323Childs and Collis-George
0.732 0.678 0.853 1.617 0.874 2.177 3.484 1.524 0.306 0.359 0.258 0.653 1.692 0.617 2.021 0.111 1.102 1.277 5.044 0.299 1.284 1.209
A.Rahim
iet
al./Soils
andFoundations
55(2015)
1400–1411
1407
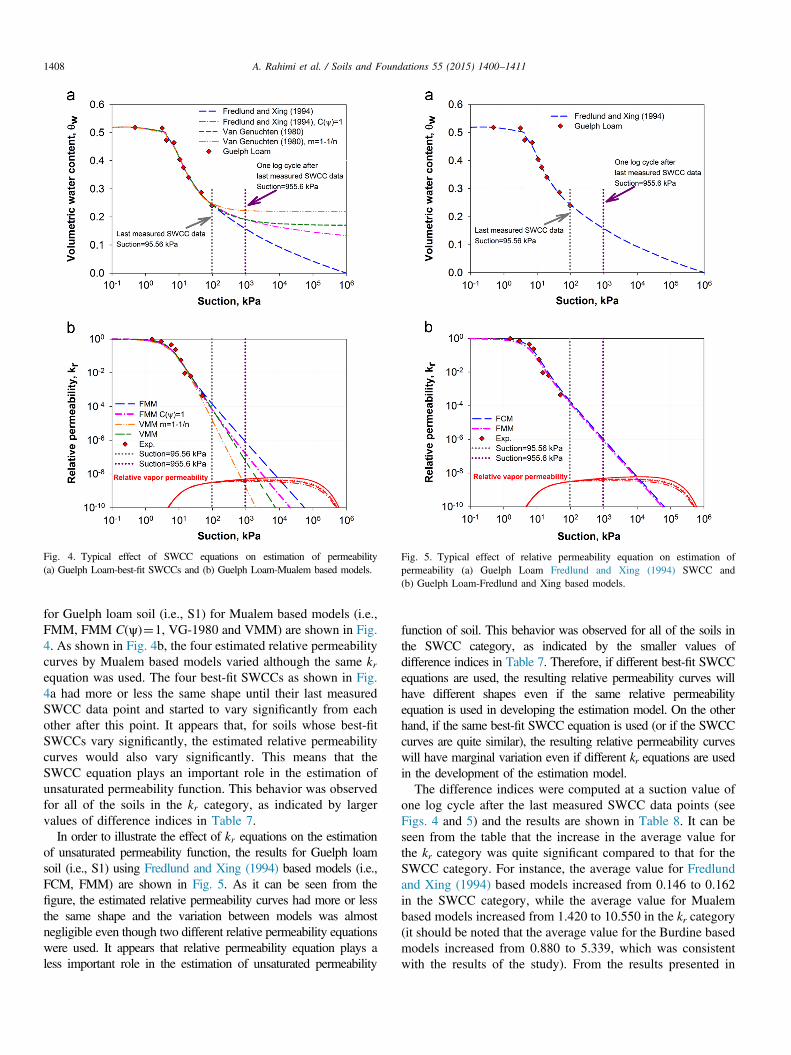
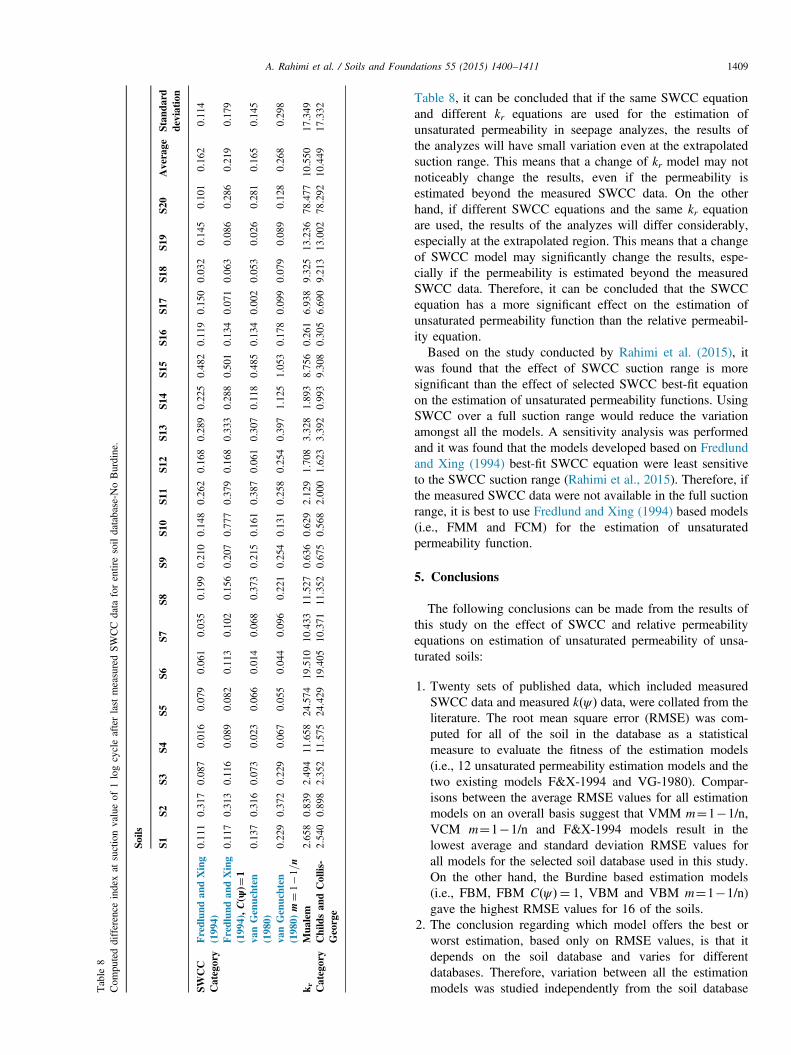
Fig. 5. Typical effect of relative permeability equation on estimation ofpermeability (a) Guelph Loam Fredlund and Xing (1994) SWCC and(b) Guelph Loam-Fredlund and Xing based models.
Fig. 4. Typical effect of SWCC equations on estimation of permeability(a) Guelph Loam-best-fit SWCCs and (b) Guelph Loam-Mualem based models.
A. Rahimi et al. / Soils and Foundations 55 (2015) 1400–14111408
for Guelph loam soil (i.e., S1) for Mualem based models (i.e.,FMM, FMM C(ψ)¼1, VG-1980 and VMM) are shown in Fig.4. As shown in Fig. 4b, the four estimated relative permeabilitycurves by Mualem based models varied although the same krequation was used. The four best-fit SWCCs as shown in Fig.4a had more or less the same shape until their last measuredSWCC data point and started to vary significantly from eachother after this point. It appears that, for soils whose best-fitSWCCs vary significantly, the estimated relative permeabilitycurves would also vary significantly. This means that theSWCC equation plays an important role in the estimation ofunsaturated permeability function. This behavior was observedfor all of the soils in the kr category, as indicated by largervalues of difference indices in Table 7.
In order to illustrate the effect of kr equations on the estimationof unsaturated permeability function, the results for Guelph loamsoil (i.e., S1) using Fredlund and Xing (1994) based models (i.e.,FCM, FMM) are shown in Fig. 5. As it can be seen from thefigure, the estimated relative permeability curves had more or lessthe same shape and the variation between models was almostnegligible even though two different relative permeability equationswere used. It appears that relative permeability equation plays aless important role in the estimation of unsaturated permeability
function of soil. This behavior was observed for all of the soils inthe SWCC category, as indicated by the smaller values ofdifference indices in Table 7. Therefore, if different best-fit SWCCequations are used, the resulting relative permeability curves willhave different shapes even if the same relative permeabilityequation is used in developing the estimation model. On the otherhand, if the same best-fit SWCC equation is used (or if the SWCCcurves are quite similar), the resulting relative permeability curveswill have marginal variation even if different kr equations are usedin the development of the estimation model.The difference indices were computed at a suction value of
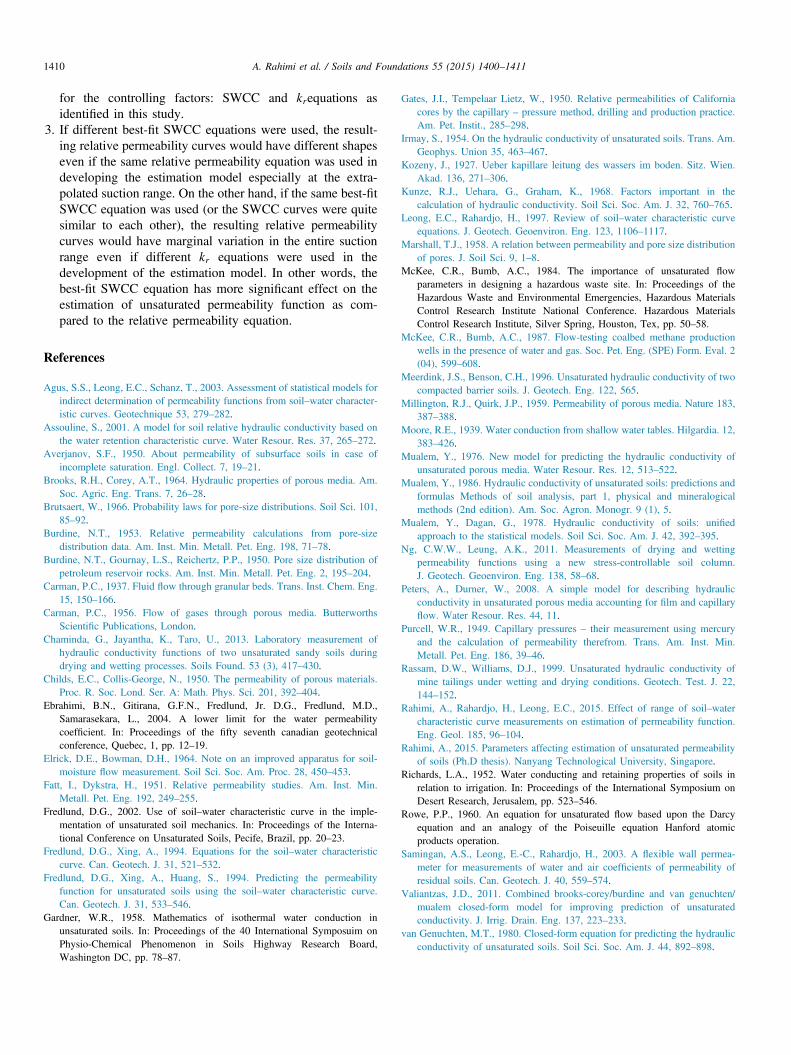
one log cycle after the last measured SWCC data points (seeFigs. 4 and 5) and the results are shown in Table 8. It can beseen from the table that the increase in the average value forthe kr category was quite significant compared to that for theSWCC category. For instance, the average value for Fredlundand Xing (1994) based models increased from 0.146 to 0.162in the SWCC category, while the average value for Mualembased models increased from 1.420 to 10.550 in the kr category(it should be noted that the average value for the Burdine basedmodels increased from 0.880 to 5.339, which was consistentwith the results of the study). From the results presented in
Table
8Com
puteddifference
indexat
suctionvalueof
1logcycleafterlast
measuredSWCC
data
forentiresoildatabase-N
oBurdine.
Soils
S1S2
S3S4
S5S6
S7S8
S9S1
0S1
1S1
2S1
3S1
4S1
5S1
6S1
7S1
8S1
9S2
0Average
Stan
dard
deviation
SWCC
Category
Fredlun
dan
dXing
(1994)
0.11
10.31
70.087
0.016
0.079
0.061
0.035
0.199
0.210
0.14
80.26
20.168
0.289
0.225
0.482
0.119
0.15
00.03
20.14
50.101
0.162
0.114
Fredlun
dan
dXing
(1994),C(ψ
)¼1
0.11
70.31
30.116
0.089
0.082
0.113
0.102
0.156
0.207
0.77
70.37
90.168
0.333
0.288
0.501
0.134
0.07
10.06
30.08
60.286
0.219
0.179
vanGenuchten
(1980)
0.13
70.31
60.073
0.023
0.066
0.014
0.068
0.373
0.215
0.16
10.38
70.061
0.307
0.118
0.485
0.134
0.00
20.05
30.02
60.281
0.165
0.145
vanGenuchten
(1980)
m¼1�1=n
0.22
90.37
20.229
0.067
0.055
0.044
0.096
0.221
0.254
0.13
10.25
80.254
0.397
1.125
1.053
0.178
0.09
90.07
90.08
90.128
0.268
0.298
k r Category
Mua
lem
2.65
80.83
92.494
11.658
24.574
19.510
10.433
11.527
0.636
0.62
92.12
91.708
3.328
1.893
8.756
0.261
6.93
89.32
513
.236
78.477
10.550
17.349
Childsan
dCollis-
George
2.54
00.89
82.352
11.575
24.429
19.405
10.371
11.352
0.675
0.56
82.00
01.623
3.392
0.993
9.308
0.305
6.69
09.21
313
.002
78.292
10.449
17.332
A. Rahimi et al. / Soils and Foundations 55 (2015) 1400–1411 1409
Table 8, it can be concluded that if the same SWCC equationand different kr equations are used for the estimation ofunsaturated permeability in seepage analyzes, the results ofthe analyzes will have small variation even at the extrapolatedsuction range. This means that a change of kr model may notnoticeably change the results, even if the permeability isestimated beyond the measured SWCC data. On the otherhand, if different SWCC equations and the same kr equationare used, the results of the analyzes will differ considerably,especially at the extrapolated region. This means that a changeof SWCC model may significantly change the results, espe-cially if the permeability is estimated beyond the measuredSWCC data. Therefore, it can be concluded that the SWCCequation has a more significant effect on the estimation ofunsaturated permeability function than the relative permeabil-ity equation.Based on the study conducted by Rahimi et al. (2015), it
was found that the effect of SWCC suction range is moresignificant than the effect of selected SWCC best-fit equationon the estimation of unsaturated permeability functions. UsingSWCC over a full suction range would reduce the variationamongst all the models. A sensitivity analysis was performedand it was found that the models developed based on Fredlundand Xing (1994) best-fit SWCC equation were least sensitiveto the SWCC suction range (Rahimi et al., 2015). Therefore, ifthe measured SWCC data were not available in the full suctionrange, it is best to use Fredlund and Xing (1994) based models(i.e., FMM and FCM) for the estimation of unsaturatedpermeability function.
5. Conclusions
The following conclusions can be made from the results ofthis study on the effect of SWCC and relative permeabilityequations on estimation of unsaturated permeability of unsa-turated soils:
1. Twenty sets of published data, which included measuredSWCC data and measured k ψð Þ data, were collated from theliterature. The root mean square error (RMSE) was com-puted for all of the soil in the database as a statisticalmeasure to evaluate the fitness of the estimation models(i.e., 12 unsaturated permeability estimation models and thetwo existing models F&X-1994 and VG-1980). Compar-isons between the average RMSE values for all estimationmodels on an overall basis suggest that VMM m¼1�1/n,VCM m¼1�1/n and F&X-1994 models result in thelowest average and standard deviation RMSE values forall models for the selected soil database used in this study.On the other hand, the Burdine based estimation models(i.e., FBM, FBM C ψð Þ ¼ 1, VBM and VBM m¼1�1/n)gave the highest RMSE values for 16 of the soils.
2. The conclusion regarding which model offers the best orworst estimation, based only on RMSE values, is that itdepends on the soil database and varies for differentdatabases. Therefore, variation between all the estimationmodels was studied independently from the soil database
A. Rahimi et al. / Soils and Foundations 55 (2015) 1400–14111410
for the controlling factors: SWCC and krequations asidentified in this study.
3. If different best-fit SWCC equations were used, the result-ing relative permeability curves would have different shapeseven if the same relative permeability equation was used indeveloping the estimation model especially at the extra-polated suction range. On the other hand, if the same best-fitSWCC equation was used (or the SWCC curves were quitesimilar to each other), the resulting relative permeabilitycurves would have marginal variation in the entire suctionrange even if different kr equations were used in thedevelopment of the estimation model. In other words, thebest-fit SWCC equation has more significant effect on theestimation of unsaturated permeability function as com-pared to the relative permeability equation.
References
Agus, S.S., Leong, E.C., Schanz, T., 2003. Assessment of statistical models forindirect determination of permeability functions from soil–water character-istic curves. Geotechnique 53, 279–282.
Assouline, S., 2001. A model for soil relative hydraulic conductivity based onthe water retention characteristic curve. Water Resour. Res. 37, 265–272.
Averjanov, S.F., 1950. About permeability of subsurface soils in case ofincomplete saturation. Engl. Collect. 7, 19–21.
Brooks, R.H., Corey, A.T., 1964. Hydraulic properties of porous media. Am.Soc. Agric. Eng. Trans. 7, 26–28.
Brutsaert, W., 1966. Probability laws for pore-size distributions. Soil Sci. 101,85–92.
Burdine, N.T., 1953. Relative permeability calculations from pore-sizedistribution data. Am. Inst. Min. Metall. Pet. Eng. 198, 71–78.
Burdine, N.T., Gournay, L.S., Reichertz, P.P., 1950. Pore size distribution ofpetroleum reservoir rocks. Am. Inst. Min. Metall. Pet. Eng. 2, 195–204.
Carman, P.C., 1937. Fluid flow through granular beds. Trans. Inst. Chem. Eng.15, 150–166.
Carman, P.C., 1956. Flow of gases through porous media. ButterworthsScientific Publications, London.
Chaminda, G., Jayantha, K., Taro, U., 2013. Laboratory measurement ofhydraulic conductivity functions of two unsaturated sandy soils duringdrying and wetting processes. Soils Found. 53 (3), 417–430.
Childs, E.C., Collis-George, N., 1950. The permeability of porous materials.Proc. R. Soc. Lond. Ser. A: Math. Phys. Sci. 201, 392–404.
Ebrahimi, B.N., Gitirana, G.F.N., Fredlund, Jr. D.G., Fredlund, M.D.,Samarasekara, L., 2004. A lower limit for the water permeabilitycoefficient. In: Proceedings of the fifty seventh canadian geotechnicalconference, Quebec, 1, pp. 12–19.
Elrick, D.E., Bowman, D.H., 1964. Note on an improved apparatus for soil-moisture flow measurement. Soil Sci. Soc. Am. Proc. 28, 450–453.
Fatt, I., Dykstra, H., 1951. Relative permeability studies. Am. Inst. Min.Metall. Pet. Eng. 192, 249–255.
Fredlund, D.G., 2002. Use of soil–water characteristic curve in the imple-mentation of unsaturated soil mechanics. In: Proceedings of the Interna-tional Conference on Unsaturated Soils, Pecife, Brazil, pp. 20–23.
Fredlund, D.G., Xing, A., 1994. Equations for the soil–water characteristiccurve. Can. Geotech. J. 31, 521–532.
Fredlund, D.G., Xing, A., Huang, S., 1994. Predicting the permeabilityfunction for unsaturated soils using the soil–water characteristic curve.Can. Geotech. J. 31, 533–546.
Gardner, W.R., 1958. Mathematics of isothermal water conduction inunsaturated soils. In: Proceedings of the 40 International Symposuim onPhysio-Chemical Phenomenon in Soils Highway Research Board,Washington DC, pp. 78–87.
Gates, J.I., Tempelaar Lietz, W., 1950. Relative permeabilities of Californiacores by the capillary – pressure method, drilling and production practice.Am. Pet. Instit., 285–298.
Irmay, S., 1954. On the hydraulic conductivity of unsaturated soils. Trans. Am.Geophys. Union 35, 463–467.
Kozeny, J., 1927. Ueber kapillare leitung des wassers im boden. Sitz. Wien.Akad. 136, 271–306.
Kunze, R.J., Uehara, G., Graham, K., 1968. Factors important in thecalculation of hydraulic conductivity. Soil Sci. Soc. Am. J. 32, 760–765.
Leong, E.C., Rahardjo, H., 1997. Review of soil–water characteristic curveequations. J. Geotech. Geoenviron. Eng. 123, 1106–1117.
Marshall, T.J., 1958. A relation between permeability and pore size distributionof pores. J. Soil Sci. 9, 1–8.
McKee, C.R., Bumb, A.C., 1984. The importance of unsaturated flowparameters in designing a hazardous waste site. In: Proceedings of theHazardous Waste and Environmental Emergencies, Hazardous MaterialsControl Research Institute National Conference. Hazardous MaterialsControl Research Institute, Silver Spring, Houston, Tex, pp. 50–58.
McKee, C.R., Bumb, A.C., 1987. Flow-testing coalbed methane productionwells in the presence of water and gas. Soc. Pet. Eng. (SPE) Form. Eval. 2(04), 599–608.
Meerdink, J.S., Benson, C.H., 1996. Unsaturated hydraulic conductivity of twocompacted barrier soils. J. Geotech. Eng. 122, 565.
Millington, R.J., Quirk, J.P., 1959. Permeability of porous media. Nature 183,387–388.
Moore, R.E., 1939. Water conduction from shallow water tables. Hilgardia. 12,383–426.
Mualem, Y., 1976. New model for predicting the hydraulic conductivity ofunsaturated porous media. Water Resour. Res. 12, 513–522.
Mualem, Y., 1986. Hydraulic conductivity of unsaturated soils: predictions andformulas Methods of soil analysis, part 1, physical and mineralogicalmethods (2nd edition). Am. Soc. Agron. Monogr. 9 (1), 5.
Mualem, Y., Dagan, G., 1978. Hydraulic conductivity of soils: unifiedapproach to the statistical models. Soil Sci. Soc. Am. J. 42, 392–395.
Ng, C.W.W., Leung, A.K., 2011. Measurements of drying and wettingpermeability functions using a new stress-controllable soil column.J. Geotech. Geoenviron. Eng. 138, 58–68.
Peters, A., Durner, W., 2008. A simple model for describing hydraulicconductivity in unsaturated porous media accounting for film and capillaryflow. Water Resour. Res. 44, 11.
Purcell, W.R., 1949. Capillary pressures – their measurement using mercuryand the calculation of permeability therefrom. Trans. Am. Inst. Min.Metall. Pet. Eng. 186, 39–46.
Rassam, D.W., Williams, D.J., 1999. Unsaturated hydraulic conductivity ofmine tailings under wetting and drying conditions. Geotech. Test. J. 22,144–152.
Rahimi, A., Rahardjo, H., Leong, E.C., 2015. Effect of range of soil–watercharacteristic curve measurements on estimation of permeability function.Eng. Geol. 185, 96–104.
Rahimi, A., 2015. Parameters affecting estimation of unsaturated permeabilityof soils (Ph.D thesis). Nanyang Technological University, Singapore.
Richards, L.A., 1952. Water conducting and retaining properties of soils inrelation to irrigation. In: Proceedings of the International Symposium onDesert Research, Jerusalem, pp. 523–546.
Rowe, P.P., 1960. An equation for unsaturated flow based upon the Darcyequation and an analogy of the Poiseuille equation Hanford atomicproducts operation.
Samingan, A.S., Leong, E.-C., Rahardjo, H., 2003. A flexible wall permea-meter for measurements of water and air coefficients of permeability ofresidual soils. Can. Geotech. J. 40, 559–574.
Valiantzas, J.D., 2011. Combined brooks-corey/burdine and van genuchten/mualem closed-form model for improving prediction of unsaturatedconductivity. J. Irrig. Drain. Eng. 137, 223–233.
van Genuchten, M.T., 1980. Closed-form equation for predicting the hydraulicconductivity of unsaturated soils. Soil Sci. Soc. Am. J. 44, 892–898.

A. Rahimi et al. / Soils and Foundations 55 (2015) 1400–1411 1411
van Genuchten, M.T., Nielsen, D., 1985. On describing and predicting thehydraulic properties of unsaturated soils. Ann. Geophys. 3, 615–628.
Vanapalli, S., Sillers, W., Fredlund, M., 1998. The meaning and relevance ofresidual state to unsaturated soils. In: Proceedings of the 51st CanadianGeotechnical Conference, pp. 4–7.
Wyllie, M.R.J., Gardner, G.H.F., 1958. The generalized Kozeny-Carmanequation. World Oil 146, 121–128.
Wyllie, M.R.J., Spangler, M.B., 1952. Application of electrical resistivitymeasurements to problem of fluid flow in porous media. Am. Assoc. Pet.Geol. Bull. 36, 359–403.
Yuster, S.T., 1951. Theoretical considerations of multiphase flow in idealizedcapillary systems. In: Proceedings of the 3rd World Petroleum Congress,pp. 437–445.