effects of plant density on progress of phymatotrichum ... · pdf fileeffects of plant density...
TRANSCRIPT
Ecology and Epidemiology
Effects of Plant Density on Progress of Phymatotrichum Root Rot in Cotton
D. 0. Koch, M. J. Jeger, T. J. Gerik, and C. M. Kenerley
First, second, and fourth authors, Department of Plant Pathology and Microbiology, Texas Agricultural Experiment Station, CollegeStation 77843; third author, Blackland Research Center, Texas Agricultural Experiment Station, Temple 76503-6112. Present address ofsecond author: Tropical Development and Research Institute, London WCIX 8LU, UK.
Accepted for publication 11 May 1987 (submitted for electronic processing).
ABSTRACT
Koch, D. 0., Jeger, M. J., Gerik, T. J., and Kenerley, C. M. 1987. Effects of plant density on progress of Phymatotrichum root rot in cotton. Phytopathology77:1657-1662.
An experiment was conducted at the Blackland Research Center, the disease progress curve (Z). The rate of disease progress (r) was higher inTemple, TX, to determine the effects of plant density on the increase of plots with five plants per meter because of the initial delay inPhymatotrichum root rot, caused by Phymatotrichum omnivorum, in Phymatotrichum root rot progress in these plots. A within-row density ofcotton. Disease was assessed on 15 occasions beginning 18 June and ending one plant per meter reduced yo, M, and Z. Initial disease incidence and Z20 August 1985 in 32 plots (7 X 8 m) of four replicates of eight plot density increased linearly with plot density (overall plant density within plots) andtreatments: two between-row spacings, 69 and 138 cm, and four within-row within-row density. The asymptotic disease value (M) was exponentiallyplant densities, 1, 5, 9, and 13 plants per meter. A logistic model was fitted related to plot density and indicated a threshold plant density of about oneto disease progress data in each plot. Between-row spacing had no effect on or two plants per meter above which M was unaffected. There were nothe rate or other parameters of disease progress. A within-row density of consistent relationships between r and plot density or within-row density.five plants per meter reduced initial disease incidence (yo) and delayed the The between-plant spacing that inhibited plant-to-plant spread of P.buildup of Phymatotrichum root rot compared with nine and 13 plants per omnivorum in the experiment was estimated to be between 0.20 and 0.69meter but had no effect on asymptotic disease incidence (M) or area under cm.
Additional key words: disease progress curves, nonlinear regression, quantitative epidemiology.
Phymalotrichum omnivorum (Shear) Duggar (Phymato- the plots throughout the season; analyses of disease progresstrichopsis omnivora (Duggar) Hennebert) is a soilborne pathogen curves were made as a basis for treatment comparison.of more than 2,000 dicotyledonous plants in the southwesternUnited States and Mexico. The fungus survives as sclerotia and MATERIALS AND METHODSstrands and is capable of growth through soil as strands (3,18). Thespread of Phymatotrichum root rot within a field over several Field experiment. A 0.4-ha field (83 X 47 m) at the Blacklandseasons has been studied extensively (7,13,14). McNamara and Research Center, Temple, TX, was planted with cottonHooton (14) kept detailed records of the location and distribution (Gossypium hirsutum L. cv. GP3774) in rows spaced 69 cm apartof cotton root rot in several fields over an 8-yr period. They on 15 April 1985. Two weeks after planting, the field was dividedconcluded that P. omnivorum spreads radially (13), the rate of into four equal blocks, which were each divided into eightspread between rows being the same as within rows (14). These treatment plots. Each plot originally contained 10 8-m rows.conclusions refer to annual rates of spread, however, as they were Adjacent plots were isolated by 3-m alleys, which were kept free ofbased on the observed pattern of the disease at one assessment per weeds and host plants by cultivating throughout the growingseason over several years. Since these early studies, little has been season. The soil type at this site is classified as a Houston black claydone to study the spatial increase of Phymatotrichum root rot in (Udic Pellusterts [fine, montmorrillonitic, thermic]). The field wasrelation to row geometry. naturally infested with P. omnivorum and had been planted with
There is little doubt that the fungus spreads radially in regularly cotton in previous years. Disease incidence (proportion of plantsspaced crops such as alfalfa (6), and in these crops, the rate of killed by P. omnivorum) had exceeded 90% in years with favorablespread appears to be similar in all directions. Whether this is the environmental conditions.case in row crops such as cotton, where the distance between rows Eight treatment combinations consisted of two between-rowis greater than the distance between plants within rows, has not spacings of 69 cm (10 rows per plot) and 138 cm (five rows per plot)been tested experimentally. Observations in field plots of cotton and four within-row plant densities of 1, 5, 9, and 13 plants perand soybean indicated that within-row spread was a major meter. The experimental design was a 2 X 4 factorial, completelycomponent of disease increase (4,5). The fungus has been observed randomized block design. Row spacings were achieved by roguingto move over distances of 3.2 m under experimental conditions alternate rows, postemergence, for the 138-cm between-row(7,8), but there may be a limit on the distance it can move from spacing treatment and retaining all 10 rows for the 69-cmdiseased to healthy plants under field conditions. There is also treatment. Within-row densities were achieved by marking offcontroversy over whether the fungus grows through soil ahead of eight contiguous 1-m lengths in each row with wood stakes anddiseased plants or whether growth directly from diseased to hand thinning each meter to the desired number of plants perhealthy roots is the primary means of disease increase (7,19). meter. Although most analyses were based on the intended within-
The purpose of this study was to determine whether the spacing row densities treatment levels, the actual densities at the time of thebetween plants in plots had any effects on disease progress of first assessment ranged 0.9-1.0, 4.6-4.9, 7.7-8.6, and 10.7-12.4Phymatotrichum root rot; this was done by varying the within-row plants per meter for the 1, 5, 9, and 13 plants per meter treatments,plant density and the between-row spacings. The progress of respectively.Phymatotrichum root rot was monitored at frequent intervals in Plots were monitored at least twice a week from emergence until
the first symptoms of Phymatotrichum root rot were observed, andassessments made on 18 June. Disease assessments were then made
© 1987 The American Phytopathological Society on 22, 25, and 28 June; 2, 6, 10, 13, 17, 26, and 29 July; and 2, 9, 12,
Vol. 77, No. 12, 1987 1657
and 20 August. Plants were considered diseased if they showed the against within-row density and plot density, which is the totaltypical first symptoms of Phymatotrichum root rot: wilting and a number of plants in a plot divided by the area of the plot. The initialslight bronzing of the upper leaves followed by wilting of the whole disease incidence (yo) was transformed to ln(yo) and regressedplant and rapid death. All plants in each plot were assessed, and the against plot density and within-row density. Rate of diseaselocation of each diseased plant within-rows was recorded. Disease increase (r) and area under the curve (Z) were weighted accordingincidence on each assessment date was calculated as the total to the inverse of the variances of the four replicates. M wasnumber of dead plants in a plot divided by the total number of regressed against plot density and within-row density by fitting theplants in that plot at the first assessment. Soil cores (about 8 cm model M Mmax [1 - exp(-bd)], constraining M= 0 when d= 0,diameter X 60 cm) were taken on 5 August at positions within and using the NLIN procedure, where Mmax is maximum diseasebetween rows with a tractor-mounted hydraulic rig, taken to the asymptote, d is density, and b is a constant coefficient. Except forlaboratory, wet-sieved, and the total length of root in the core M, no attempt was made to constrain the parameters to 0, at d= 0.estimated using a modified line intersect method (20).
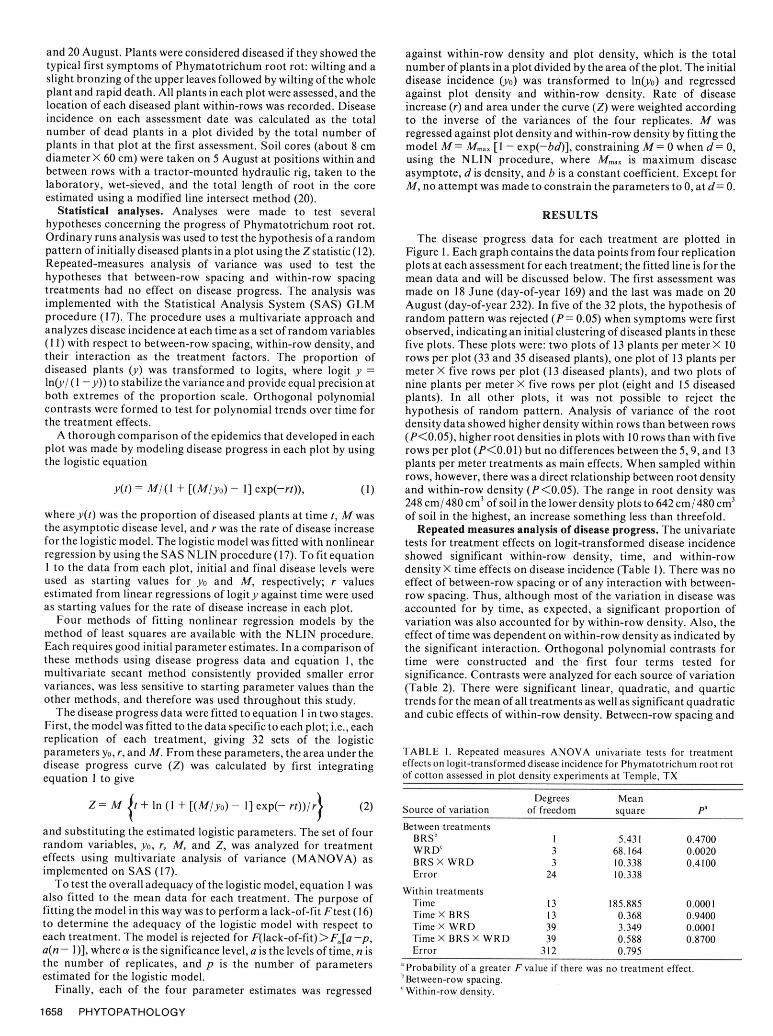
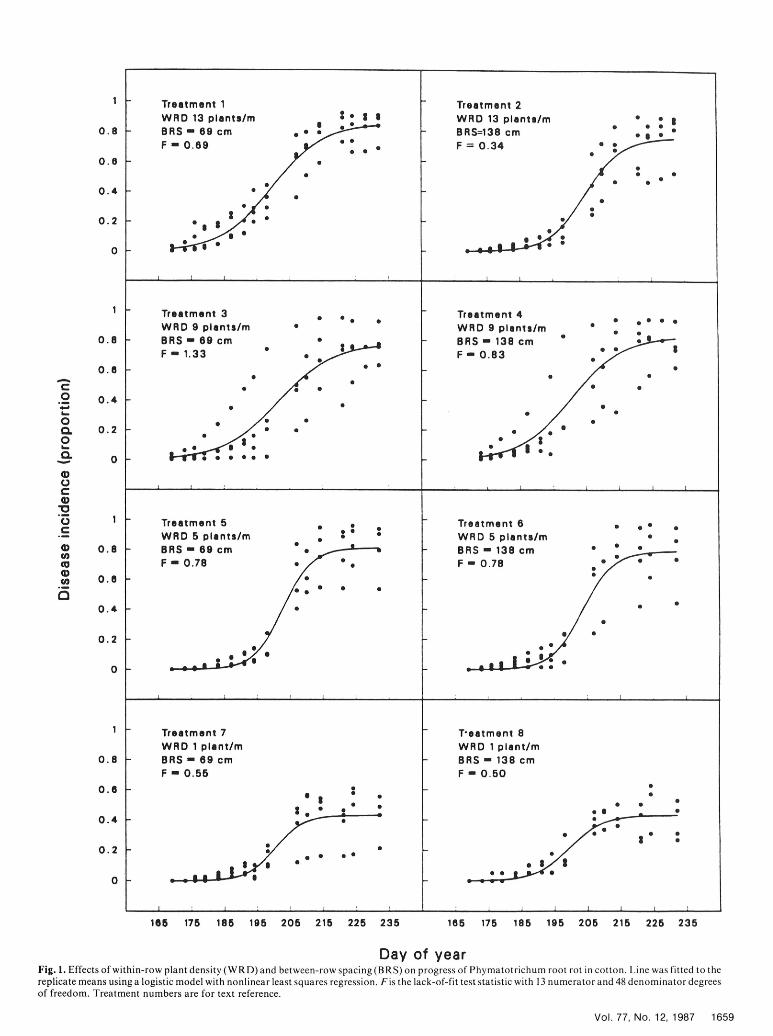
Statistical analyses. Analyses were made to test several RESULTShypotheses concerning the progress of Phymatotrichum root rot.Ordinary runs analysis was used to test the hypothesis of a random The disease progress data for each treatment are plotted inpattern of initially diseased plants in a plot using the Z statistic (12). Figure 1. Each graph contains the data points from four replicationRepeated-measures analysis of variance was used to test the plots at each assessment for each treatment; the fitted line is for thehypotheses that between-row spacing and within-row spacing mean data and will be discussed below. The first assessment wastreatments had no effect on disease progress. The analysis was made on 18 June (day-of-year 169) and the last was made on 20implemented with the Statistical Analysis System (SAS) GLM August (day-of-year 232). In five of the 32 plots, the hypothesis ofprocedure (17). The procedure uses a multivariate approach and random pattern was rejected (P= 0.05) when symptoms were firstanalyzes disease incidence at each time as a set of random variables observed, indicating an initial clustering of diseased plants in these(1I) with respect to between-row spacing, within-row density, and five plots. These plots were: two plots of 13 plants per meter X 10their interaction as the treatment factors. The proportion of rows per plot (33 and 35 diseased plants), one plot of 13 plants perdiseased plants (y) was transformed to logits, where logit y = meter X five rows per plot (13 diseased plants), and two plots ofln(y/ (1 -y)) to stabilize the variance and provide equal precision at nine plants per meter X five rows per plot (eight and 15 diseasedboth extremes of the proportion scale. Orthogonal polynomial plants). In all other plots, it was not possible to reject thecontrasts were formed to test for polynomial trends over time for hypothesis of random pattern. Analysis of variance of the rootthe treatment effects. density data showed higher density within rows than between rows
A thorough comparison of the epidemics that developed in each (P<0.05), higher root densities in plots with 10 rows than with fiveplot was made by modeling disease progress in each plot by using rows per plot (P<0.0 l) but no differences between the 5, 9, and 13the logistic equation plants per meter treatments as main effects. When sampled within
rows, however, there was a direct relationship between root densityy(t) = M/(1 + [(M/yo) - I] exp(-rt)), (I) and within-row density (P<0.05). The range in root density was
248 cm/ 480 cm3 of soil in the lower density plots to 642 cm/ 480 cm3
where y(t) was the proportion of diseased plants at time t, M was of soil in the highest, an increase something less than threefold.the asymptotic disease level, and r was the rate of disease increase Repeated measures analysis of disease progress. The univariatefor the logistic model. The logistic model was fitted with nonlinear tests for treatment effects on logit-transformed disease incidenceregression by using the SAS NLIN procedure (17). To fit equation showed significant within-row density, time, and within-row1 to the data from each plot, initial and final disease levels were density X time effects on disease incidence (Table 1). There was noused as starting values for yo and M, respectively; r values effect of between-row spacing or of any interaction with between-estimated from linear regressions of logit y against time were used row spacing. Thus, although most of the variation in disease wasas starting values for the rate of disease increase in each plot. accounted for by time, as expected, a significant proportion of
Four methods of fitting nonlinear regression models by the variation was also accounted for by within-row density. Also, themethod of least squares are available with the NLIN procedure. effect of time was dependent on within-row density as indicated byEach requires good initial parameter estimates. In a comparison of the significant interaction. Orthogonal polynomial contrasts forthese methods using disease progress data and equation 1, the time were constructed and the first four terms tested formultivariate secant method consistently provided smaller error significance. Contrasts were analyzed for each source of variationvariances, was less sensitive to starting parameter values than the (Table 2). There were significant linear, quadratic, and quarticother methods, and therefore was used throughout this study. trends for the mean of all treatments as well as significant quadratic
The disease progress data were fitted to equation 1 in two stages. and cubic effects of within-row density. Between-row spacing andFirst, the model was fitted to the data specific to each plot; i.e., eachreplication of each treatment, giving 32 sets of the logisticparameters yo, r, and M. From these parameters, the area under the TABLE 1. Repeated measures ANOVA univariate tests for treatmentdisease progress curve (Z) was calculated by first integrating effects on logit-transformed disease incidence for Phymatotrichum root rotequation 1 to give of cotton assessed in plot density experiments at Temple, TX
} Degrees MeanZ = M .t + In (I + [(M/yo) - 1] exp(- rt))/rj (2) Source of variation of freedom square pa
and substituting the estimated logistic parameters. The set of four Between treatmentsBRSb 1 5.43 ! 0.4700random variables, yo, r, M, and Z, was analyzed for treatment WRDC 3 68.164 0.0020effects using multivariate analysis of variance (MANOVA) as BRS x WRD 3 10.338 0.4100implemented on SAS (17). Error 24 10.338
To test the overall adequacy of the logistic model, equation 1 was Within treatmentsalso fitted to the mean data for each treatment. The purpose of Time 13 185.885 0.0001fitting the model in this way was to perform a lack-of-fit Ftest (16) Time X BRS 13 0.368 0.9400to determine the adequacy of the logistic model with respect to Time X WRD 39 3.349 0.0001each treatment. The model is rejected for F(lack-of-fit)>F,,[a-p, Time X BRS X WRD 39 0.588 0.8700a(n - 1)], where a is the significance level, a is the levels of time, n is Error 312 0.795the number of replicates, and p is the number of parameters Probability of a greater F value if there was no treatment effect.estimated for the logistic model. bBetween-row spacing.
Finally, each of the four parameter estimates was regressed 'Within-row density.
1658 PHYTOPATHOLOGY
Treatment 1 Treatment 2
WRD 13 plants/m * • WRD 13 plants/m * 0g
0.8 BRS- 69 cm 0 * BRS=138 cmF-0.69 F F0.34*
0.a
0.4 •
0.2 -e *0
0 *** 0:9c
I I I
Treatment 3 * 0 Treatment 4
WRD 9 plants/m * WRD 9 plants/m *
0.8 BBRS- 69 Cm BRS - 138 cm 0F 1.33 F0.83 00 -0.6 o
0.4
0a 0.4 20o• *
--. 0
0
4) I ., i i I I
"0
"O 1 Treatment 5 : Treatment 6* . *
WRAD 5 plants/m * * WRD 5 plants/mr0.8 o BRS S- cm . BRS-138cm"
CO F 0.78 F " 0.78 * 0
0 .
0.4 0
0.2 '0
1 Treatment 7 T-eatment 8
WRD 1 plant/m WRD 1 plant/m0.8 BRS- 69 cm BRS-- 138 cm
F - 0.55 F - 0.500.0
0.60.4
02
0. 5 175 185 195 205 215 225 235 165 175 185 195 205 215 225 235
Day of yearFig. 1. Effects of within-row plant density (WRD) and between-row spacing (BRS) on progress of Phymatotrichum root rot in cotton. Line was fitted to thereplicate means using a logistic model with nonlinear least squares regression. Fis the lack-of-fit test statistic with 13 numerator and 48 denominator degreesof freedom. Treatment numbers are for text reference.
Vol. 77, No. 12, 1987 1659
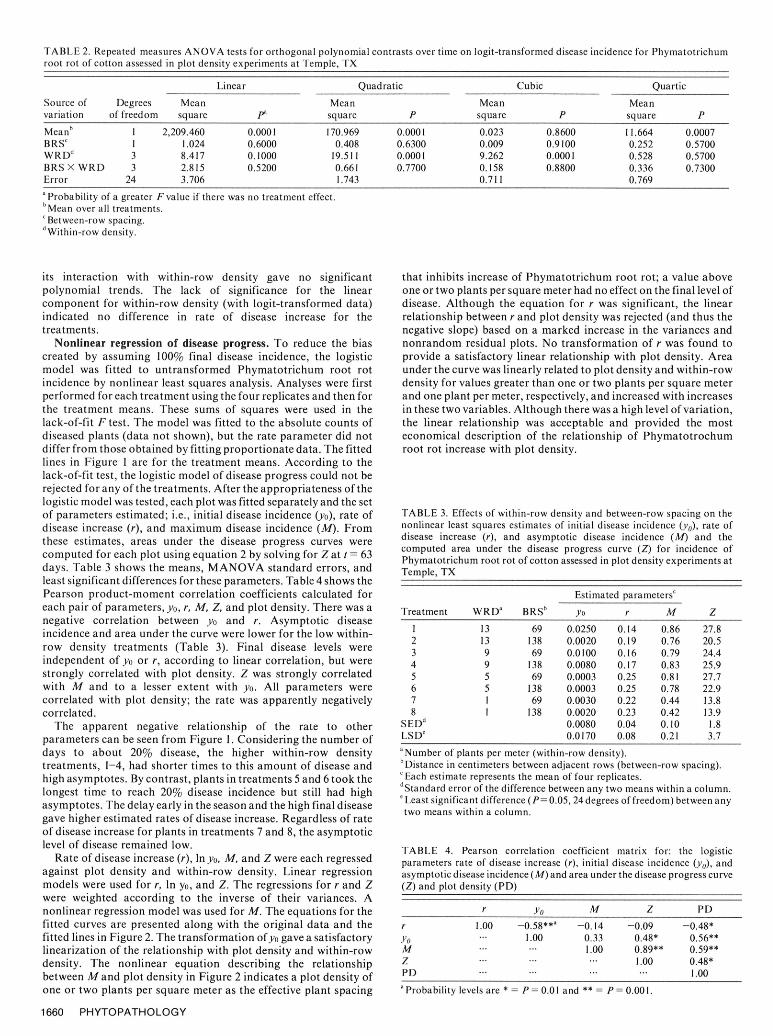
TABLE 2. Repeated measures ANOVA tests for orthogonal polynomial contrasts over time on logit-transformed disease incidence for Phymatotrichum
root rot of cotton assessed in plot density experiments at Temple, TX
Linear Quadratic Cubic QuarticSource of Degrees Mean Mean Mean Meanvariation of freedom square pa square P square P square PMeanb 1 2,209.460 0.0001 170.969 0.0001 0.023 0.8600 11.664 0.0007BRSc 1 1.024 0.6000 0.408 0.6300 0.009 0.9100 0.252 0.5700WRD d 3 8.417 0.1000 19.511 0.0001 9.262 0.0001 0.528 0.5700BRS X WRD 3 2.815 0.5200 0.661 0.7700 0.158 0.8800 0.336 0.7300Error 24 3.706 1.743 0.711 0.769a Probability of a greater F value if there was no treatment effect.bMean over all treatments.Between-row spacing.
dWithin-row density.
its interaction with within-row density gave no significant that inhibits increase of Phymatotrichum root rot; a value abovepolynomial trends. The lack of significance for the linear one or two plants per square meter had no effect on the final level ofcomponent for within-row density (with logit-transformed data) disease. Although the equation for r was significant, the linearindicated no difference in rate of disease increase for the relationship between r and plot density was rejected (and thus thetreatments. negative slope) based on a marked increase in the variances and
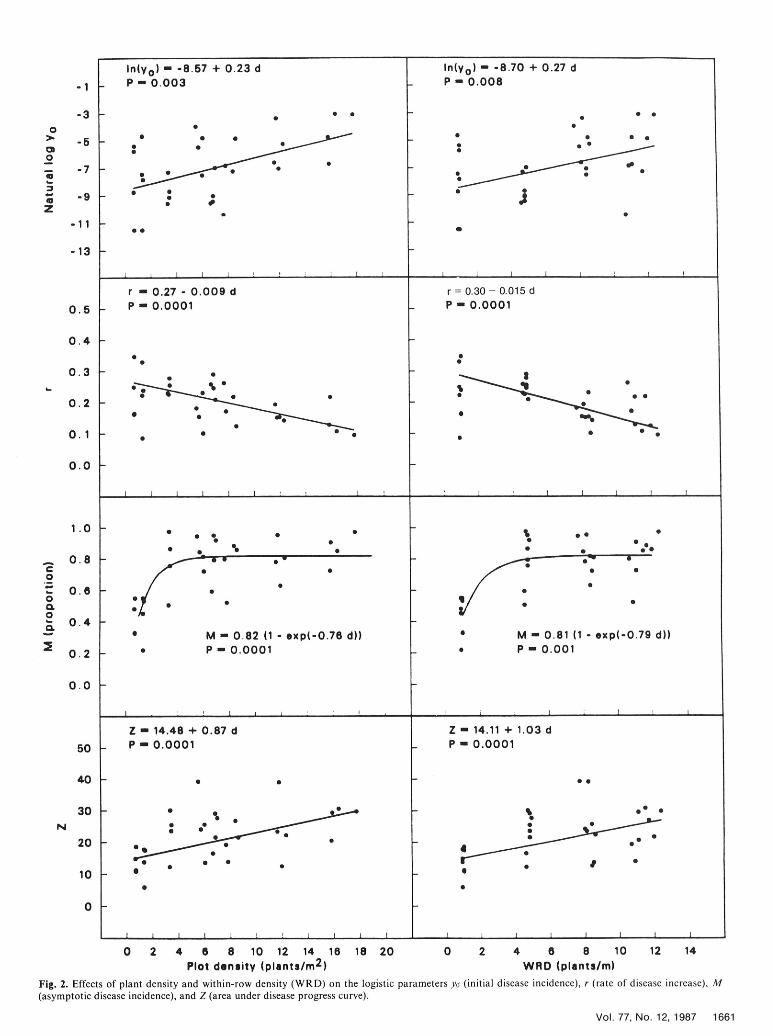
Nonlinear regression of disease progress. To reduce the bias nonrandom residual plots. No transformation of r was found tocreated by assuming 100% final disease incidence, the logistic provide a satisfactory linear relationship with plot density. Areamodel was fitted to untransformed Phymatotrichum root rot under the curve was linearly related to plot density and within-rowincidence by nonlinear least squares analysis. Analyses were first density for values greater than one or two plants per square meterperformed for each treatment using the four replicates and then for and one plant per meter, respectively, and increased with increasesthe treatment means. These sums of squares were used in the in these two variables. Although there was a high level of variation,lack-of-fit F test. The model was fitted to the absolute counts of the linear relationship was acceptable and provided the mostdiseased plants (data not shown), but the rate parameter did not economical description of the relationship of Phymatotrochumdiffer from those obtained by fitting proportionate data. The fitted root rot increase with plot density.lines in Figure 1 are for the treatment means. According to thelack-of-fit test, the logistic model of disease progress could not berejected for any of the treatments. After the appropriateness of thelogistic model was tested, each plot was fitted separately and the setof parameters estimated; i.e., initial disease incidence (yo), rate of TABLE 3. Effects of within-row density and between-row spacing on thedisease increase (r), and maximum disease incidence (AM). From nonlinear least squares estimates of initial disease incidence (Y0), rate ofthese estimates, areas under the disease progress curves were disease increase (r), and asymptotic disease incidence (M) and the
g =63 computed area under the disease progress curve (Z) for incidence ofcomputed for each plot using equation 2 by solving for 7 at t Phymatotrichum root rot of cotton assessed in plot density experiments atdays. Table 3 shows the means, MANOVA standard errors, and Temple, TXleast significant differences for these parameters. Table 4 shows thePearson product-moment correlation coefficients calculated for Estimated parametersceach pair of parameters, yo, r, M, 4, and plot density. There was a Treatment WRDa BRSb yO r M Znegative correlation between yo and r. Asymptotic diseaseincidence and area under the curve were lower for the low within- 2 13 138 0.0020 0.19 0.76 20.5row density treatments (Table 3). Final disease levels were 3 9 69 0.0100 0.16 0.79 24.4independent of yo or r, according to linear correlation, but were 4 9 138 0.0080 0.17 0.83 25.9strongly correlated with plot density. Z was strongly correlated 5 5 69 0.0003 0.25 0.81 27.7with M and to a lesser extent with yo. All parameters were 6 5 138 0.0003 0.25 0.78 22.9correlated with plot density; the rate was apparently negatively 7 1 69 0.0030 0.22 0.44 13.8correlated. 8 ! 138 0.0020 0.23 0.42 13.9
The apparent negative relationship of the rate to other SEDd 0.0080 0.04 0.10 1.8parameters can be seen from Figure 1. Considering the number of LSDe 0.0170 0.08 0.21 3.7days to about 20% disease, the higher within-row density a Number of plants per meter (within-row density).treatments, 1-4, had shorter times to this amount of disease and 'Distance in centimeters between adjacent rows (between-row spacing).high asymptotes. By contrast, plants in treatments 5 and 6 took the 'Each estimate represents the mean of four replicates.longest time to reach 20% disease incidence but still had high dStandard error of the difference between any two means within a column.asymptotes. The delay early in the season and the high final disease e Least significant difference (P= 0.05, 24 degrees of freedom) between any
two means within a column.gave higher estimated rates of disease increase. Regardless of rate
of disease increase for plants in treatments 7 and 8, the asymptoticlevel of disease remained low. TABLE 4. Pearson correlation coefficient matrix for: the logistic
Rate of disease increase (r), In yo, M, and Z were each regressed parameters rate of disease increase (r), initial disease incidence (yo), andagainst plot density and within-row density. Linear regression asymptotic disease incidence (M) and area under the disease progress curvemodels were used for r, In yo, and Z. The regressions for r and Z (Z) and plot density (PD)were weighted according to the inverse of their variances. Anonlinear regression model was used for M. The equations for the r YO M Z PDfitted curves are presented along with the original data and the r 1.00 -0.58**a -0.14 -0.09 -0.48*fitted lines in Figure 2. The transformation of yo gave a satisfactory YO ... 1.00 0.33 0.48* 0.56**linearization of the relationship with plot density and within-row M ... ... 1.00 0.89** 0.59**density. The nonlinear equation describing the relationship Z ... ...... 1.00 0.48*between M and plot density in Figure 2 indicates a plot density of PD ... ...... ... 1.00one or two plants per square meter as the effective plant spacing a Probability levels are * = P = 0.01 and ** = P 0.001.
1660 PHYTOPATHOLOGY
In(yo) - -8.57 + 0.23 d ln(yo) - -8.70 + 0.27 d-1 P-0.003 P 0.008
-3 0 00 0 0
o 0 000
- 2 - . 0
0.4 -
0.3 -
-I 0I 0 0 1 '
00 00
10
0 2 -
05 P-0001 P•- 0.0001
0.40
0
,0. - 0 0 0 e . • ,od•
0.2 Z* 44 0.8 d Z S41 .
40
30 0- 0. 0
0.1 0
0.0
I I II I I I I
50 2 P 0 000 4 " 0.0001
00 - •0
Vol 77 No. 12 198 1661
20 -0 5 0-
100 0 6
0
0 0 S2 1 6 1 00 2 4 8 8 1 2 1
Vo. 7,No 1, 98 06
DISCUSSION and M, as in treatments 1-4, r values were lower because of highearly disease levels. Treatments 7 and 8 had lowyo and low Mwith
The disease cycle of P. omnivorum, as it relates to spread of intermediate r values. A more flexible growth model such as thePhymatotrichum root rot, can be divided into two parts: primary Richards or Weibull models (10) may account for the moreinfection, which is the result of root contact with overwintering pronounced curvature in disease progress for treatments 5 and 6,strands or sclerotia, and plant-to-plant spread from initial foci by but as the logistic model could not be rejected as an adequateroot contact with strands or mycelium from diseased plants or by model, there was little justification for adding additionalgrowth of the fungus through soil. In the present study, initial parameters when considering all eight treatments.disease incidence decreased logarithmically as plant density Plant density is a valuable and often overlooked variable whendecreased. The reduction in initial disease incidence was studying plant disease epidemics (1,2). The purpose of this studymanifested as lower levels of disease early in the season in the was to manipulate plant density to study the increase ofwithin-row density treatments with one and five plants per meter Phymatotrichum root rot within a field population. In thisand was expressed further by the longer time to reach 20% disease experiment, we found that a distance of 20-69 cm between plantsin these plots. Regular monitoring of the plots had been limited increase of Phymatotrichum root rot. Furthermore, earlyundertaken before symptoms first were observed, and it is in the growing season, disease progress (to about 20% incidence)reasonably certain that no plant-to-plant spread had occurred by was inhibited when plants were spaced 20 cm apart. Our18 June. The small number of plots in which nonrandom patterns knowledge of the epidemiology of Phymatotrichum root rot is stillof diseased plants were observed indicated that in some plots, at incomplete, and density studies can provide some of the necessaryleast, there was a clustered pattern of overwintering structures. information to fill in the gaps.These plots were at higher plant densities, but there was nodiscernible difference between disease progress in plots withrandom or nonrandom patterns of initially diseased plants within a LITERATURE CITEDtreatment. Although primary infection may occur throughout theseason, once foci are established, plant-to-plant spread appears to 1. Burdon, J. J. 1982. Host density as a factor in plant disease ecology.be responsible for increase of Phymatotrichum root rot and final Annu. Rev. Phytopathol. 20:143-66.levels of disease (4,5). 2. Burdon, J. J., and Chilvers, G. A. 1975. Epidemiology of damping-off
Root contact is not necessary for plant-to-plant spread (9) as was disease (Pythium irregulare) in relation to density of Lepidium sativumseedlings. Ann. Appi. Biol. 81:135-143.once thought. Strands have been observed to grow up to 3.2 msedig.An plBo.81354.oncer thought.i Stnditions hahe b ree serveo ad cttonw up ot 32 m 3. Ezekiel, W. N., and Taubenhaus, J. J. 1932. Variation and dissociation
under sterile conditions in the presence of dead cotton roots in within Phymatotrichum omnivorum. Annu. Rep. Tex. Agric. Exp.moist sand (8). Also, from crude field observations on excavated Stn. 45:64-65.cotton plants (15), it was estimated that Phymatotrichum root rot 4. Gerik, T. J., Rush, C. M., and Jeger, M. J. 1985. Optimizing plot sizemay extend at least 1.1 m beyond the last dead plant of a disease for field studies of Phymatotrichum root rot of cotton.front. We found that the progress of Phymatotrichum root rot was Phytopathology 75:240-243.limited in plots with a within-row density of one plant per meter, an 5. Jeger, M. J., Kenerley, C. M., and Gerik, T. J. 1985. Spatial dynamicsaverage of 100 cm between plants within a row. A within-row of Phymatotrichum root rot in cotton. (Abstr.) Phytopathologydensity of five plants per meter, an average of 20 cm between plants 75:500.densithin arow, dide pnotslimitdiseas peroaerages, en 2 b theren plas 6. King, C. J. 1924. Habits of the cotton root rot fungus. J. Agric. Res.within a row, did not limit disease progress, even though there was 26:405-418.an initial delay early in the season. Because 100-cm spacing 7. King, C.J.,and Loomis, H. F. 1929. Furtherstudies of cotton root rotbetween plants limited Phymatotrichum root rot and there was no in Arizona with a description of a sclerotium stage of the fungus. J.difference between the between-row spacing treatments of 138 and Agric. Res. 39:641-676.69 cm, the minimum distance that did limit Phymatotrichum root 8. King, C. J., Loomis, H. F., and Hope, C. 1931. Studies on sclerotia androt in this study was 69 cm. We concluded, therefore, that the mycelial strands of the cotton root rot fungus. J. Agric. Res.distance between adjacent plants in a field that inhibited increase of 42:827-840.Phymatotrichum root rot by plant-to-plant spread was between 20 9. Lyda, S. D. 1978. Ecology of Phymatotrichum omnivorum. Annu.and 69 cm. This distance will be dependent on environment, Rev. Phytopathol. 16:193-208.
edaphic factors, and cultivar and thus will vary with season and 10. Madden, L. V. 1980. Quantification of disease progression. Prot. Ecol.location. 2:159-176.
Thcasy c d e i11. Madden, L. V. 1986. Statistical analysis and comparison of diseaseThe asymptotic disease incidence estimated from th~e logistic progress curves. Pages 55-84 in: Plant Disease Epidemiology. Vol. 1.
model was most useful when analyzing the effect of plant density Population Dynamics and Management. K. J. Leonard and W. E. Fry,on increase of Phymatotrichum root rot. Asymptotic disease eds. Macmillan, New York. 372 pp.values can be explained in terms of plant-to-plant spread. High 12. Madden, L. V., Louie, R., Abt, J. J., and Knoke, J. K. 1982. Evaluationplant densities facilitate plant-to-plant spread by increasing the of tests for randomness of infected plants. Phytopathology 72:195-198.probability of pathogen-host encounter and lead to greater levels 13. McNamara, H. C. 1928. Behavior of cotton root rot at Greenville,of Phymatotrichum root rot. It should be noted, however, that Texas, including an experiment with clean fallows. J. Agric. Res.
root densities did not vary to the same extent as the plant densities 132:17-24.14. McNamara, H. C., and Hooton, D. R. 1929. Studies of cotton root rotimposed in this study. We found by visual interpolation of Figure at Greenville, Texas. U.S. Dep. Agric. Circ. 85. 16 pp.
2, that plant densities greater than one or two plants per square 15. McNamara, H. C., Hooton, D. R., and Proter, D. D. 1931. Cycles ofmeter did little to further increase M. At densities of less than this, growth in cotton root rot at Greenville, Texas. U.S. Dep. Agric. Circ.values of M were much reduced. Burdon and Chilvers (2) observed 173. 17 pp.a similar leveling-off in incidence of damping-off caused by 16. Neter, J., Wasserman, W., and Kunter, M. H. 1983. Applied LinearPythium irregulare with increasing densities of garden cress. Regression Models. Richard D. Irwin Inc., Homewood, IL.
We could find no acceptable linear relationship between r and 17. Statistical Analysis System, Inc. 1985. SAS User's Guide: Statistics.plant density in this study. Because the rate depends on yo and M, 5th ed. SAS Institute, Cary, NC.plantdensity inbtecause these twoparamete erate n retends in ts sudy, 18. Streets, R. B., and Bloss, H. E. 1973. Phymatotrichum root rot.and because these two parameters were not correlated in this study, Monograph 8. Am. Phytopathol. Soc., St. Paul, MN. 38 pp.each unique combination of yo and M gave a unique r, thus 19. Taubenhaus, J. J., and Killough, D.T. 1923. Texas root rot of cottonconfounding trends in r with respect to plant density. For example, and methods of its control. Tex. Agric. Exp. Stn. Bull. 307. 98 pp.when yo was low and M was high, as in treatments 5 and 6, r was 20. Tennant, D. 1975. A test of a modified line intersect method ofhigh even though disease increase was slow at first. With high yo estimating root length. J. Ecol. 63:995-1001.
1662 PHYTOPATHOLOGY