effects of piping irrigation laterals on selenium and salt ... · effects of piping irrigation...
TRANSCRIPT

U.S. GEOLOGICAL SURVEY
Water-Resources Investigations Report
Effects of Piping Irrigation Laterals on Selenium and Salt Loads, Montrose Arroyo Basin, Western Colorado
By David L. Butler
Denver, Colorado2001
01–4204
Prepared in cooperation with theBUREAU OF RECLAMATION

U.S. DEPARTMENT OF THE INTERIOR
GALE A. NORTON, Secretary
U.S. GEOLOGICAL SURVEY
Charles G. Groat, Director
The use of firm, trade, and brand names in this report is for identification purposes only and doesnot constitute endorsement by the U.S. Geological Survey.
For additional information write to: Copies of this report can be purchased
U.S. Geological SurveyInformation ServicesBox 25286Federal CenterDenver, CO 80225
from:
District ChiefU.S. Geological SurveyBox 25046, Mail Stop 415Denver Federal CenterDenver, CO 80225–0046

CONTENTS iii
CONTENTS
Abstract.................................................................................................................................................................................. 1Introduction............................................................................................................................................................................ 1
Montrose Arroyo Demonstration Project .................................................................................................................... 4Monitoring Program and Method of Analysis ............................................................................................................. 4
Effects of Project on Selenium and Salt Loads...................................................................................................................... 9Factors Affecting Selenium and Salt Loads........................................................................................................................... 12Summary................................................................................................................................................................................ 13References Cited .................................................................................................................................................................... 14
FIGURES
1–2. Maps showing:1. Location of the lower Gunnison River Basin and study area ............................................................................ 22. Study area and sampling sites ........................................................................................................................... 5
3–5. Graphs showing:3. Comparison of selenium loads in Montrose Arroyo Basin before and after the lateral project........................ 94. Selenium loads in Montrose Arroyo at Niagara Street (MA2), 1993–2000 ..................................................... 105. Comparison of salt loads in Montrose Arroyo Basin before and after the lateral project................................. 11
TABLES
1. Mean streamflow, selenium concentrations, and salinity concentrations for irrigation-season (April through October) and nonirrigation-season (November through March) samples at the five monitoring sites ................................................................................................................................................ 6
2. Mean selenium and salinity concentrations in irrigation water from the AM lateral and Loutzenhizer Canal, 1999–2000............................................................................................................................................................... 7
3. Mean selenium and salt loads for irrigation-season (April through October) and nonirrigation-season (November through March) samples at the five monitoring sites ........................................................................... 7
4. Selenium loads for the Montrose Arroyo demonstration project ............................................................................ 85. Salt loads for the Montrose Arroyo demonstration project ..................................................................................... 8
iv CONTENTS
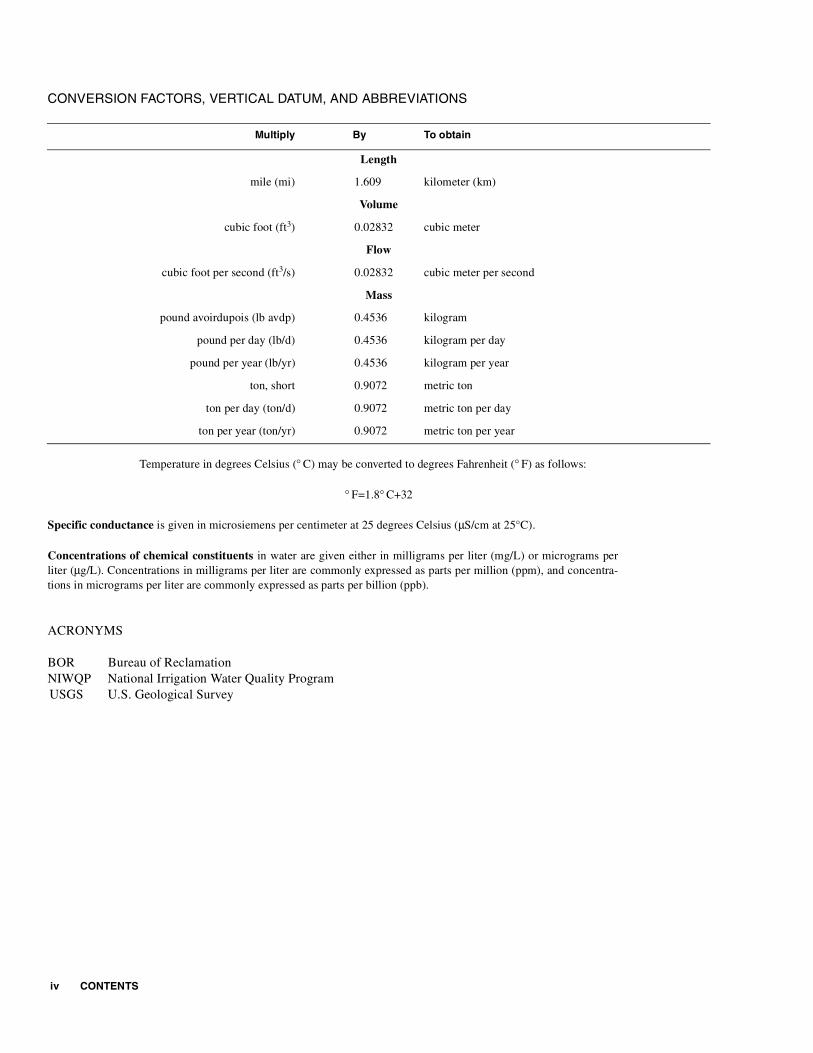
CONVERSION FACTORS, VERTICAL DATUM, AND ABBREVIATIONS
Temperature in degrees Celsius (° C) may be converted to degrees Fahrenheit (° F) as follows:
° F=1.8° C+32
Specific conductance is given in microsiemens per centimeter at 25 degrees Celsius (µS/cm at 25°C).
Concentrations of chemical constituents in water are given either in milligrams per liter (mg/L) or micrograms perliter (µg/L). Concentrations in milligrams per liter are commonly expressed as parts per million (ppm), and concentra-tions in micrograms per liter are commonly expressed as parts per billion (ppb).
ACRONYMS
BOR Bureau of ReclamationNIWQP National Irrigation Water Quality ProgramUSGS U.S. Geological Survey
Multiply By To obtain
Length
mile (mi) 1.609 kilometer (km)
Volume
cubic foot (ft3) 0.02832 cubic meter
Flow
cubic foot per second (ft3/s) 0.02832 cubic meter per second
Mass
pound avoirdupois (lb avdp) 0.4536 kilogram
pound per day (lb/d) 0.4536 kilogram per day
pound per year (lb/yr) 0.4536 kilogram per year
ton, short 0.9072 metric ton
ton per day (ton/d) 0.9072 metric ton per day
ton per year (ton/yr) 0.9072 metric ton per year

INTRODUCTION 1
AbstractSelenium and salinity are water-quality
issues in the Upper Colorado River Basin. Certain water bodies in the lower Gunnison River Basin, including the lower Gunnison River and the Uncompahgre River, exceed the State standard for selenium of 5 micrograms per liter. Remediation methods to reduce selenium and salt loading in the lower Gunnison River Basin were examined. A demonstration project in Montrose Arroyo, located in the Uncompahgre River Basin near Montrose, was done during 1998–2000 to deter-mine the effects on selenium and salt loads in Montrose Arroyo from replacing 8.5 miles of open-ditch irrigation laterals with 7.5 miles of pipe. The participants in the project were the National Irrigation Water Quality Program, the Colorado River Basin Salinity Control Program, the Uncompahgre Valley Water Users Associa-tion, and the U.S. Geological Survey.
The placing of five laterals in pipe signifi-cantly decreased selenium loads in Montrose Arroyo. The selenium load at the outflow moni-toring site was about 194 pounds per year less(28-percent decrease) in the period after the laterals were placed in pipe. More than 90 percent of the decrease in selenium load was attributed to a decrease in ground-water load.
Salt loads also decreased because of the lateral project, but by a smaller percentage than the selenium loads. The salt load at the outflow site on Montrose Arroyo was about 1,980 tons per
year less in the post-project period than in the pre-project period.
All of the effects of the demonstration project on selenium and salt loads probably were not measured by this study because some of the lateral leakage that was eliminated had not neces-sarily discharged to Montrose Arroyo upstream from the monitoring sites. A greater decrease in selenium loads relative to salt loads may have been partially the result of decreases in selenium concentrations in ground water in some areas.
INTRODUCTION
Salinity (or the dissolved-solids concentration) is a concern in the Colorado River Basin in the United States and Mexico because of its adverse effects on agricultural, municipal, and industrial users (U.S. Department of the Interior, 1999). The Salinity Control Act of 1974 (Public Law 93–320) created the Colorado River Basin Salinity Control Program to investigate, plan, and construct projects to reduce salt loading to the Colorado River. Some salinity-control projects constructed by the Bureau of Reclamation (BOR) include lining or replacing open canals and laterals with pipe for the purpose of decreasing salt loading caused by leakage from irrigation-distribution systems. In the lower Gunnison River Basin, canal and lateral leakage provides recharge to shallow ground water. In areas containing soils and outcrops with high salt content, such as the Mancos Shale on the east side of the Uncompahgre Valley, considerable salt loading occurs from canal and lateral leakage (Bureau of
Effects of Piping Irrigation Laterals on Selenium and Salt Loads, Montrose Arroyo Basin, Western Colorado
By David L. Butler

2 Effects of Piping Irrigation Laterals on Selenium and Salt Loads, Montrose Arroyo Basin, Western Colorado
LowerGunnison River
Basin
Delta
Montrose
Ridgway
Sweitzer Lake
Gunnison River
Gunnison River
Gunniso
n River
North Fork
Ridgway Reservoir
Uncom
pahgre
River
Whitewater
Montrose Arroyo
Cedar Creek
LOCATION MAP
DENVER
C O L O R A D O
Grand Junction
25 MILES0 5 10 15 20
0 5 10 15 20 25 KILOMETERS
Colora do
River
108°27'30"
39°12'30"
107°47'30"
107°22'30"
38°57'30"
38°42'30"
38°27'30"
38°12'30"
108°02'30"
Reclamation, 1982). Ground water moving through the shale or shale-derived soils dissolves salts. The ground water discharges to drainage ditches or natural drainages that ultimately discharge to the Gunnison River and then to the Colorado River.
Selenium concerns in the Colorado River Basin are more recent than the concerns raised about salinity in the 1970’s. Since 1985, a multiagency program within the Department of the Interior, the National Irri-gation Water Quality Program (NIWQP), has done investigations at various irrigation projects in the Western United States to determine if irrigation drainage was having adverse effects on water quality,
fish, and wildlife. Beginning in 1988, NIWQP studies have been done in the Uncompahgre Valley and Grand Valley in west-central Colorado. High levels of sele-nium were reported in some water, sediment, and biota samples in both valleys (Butler and others, 1996). Because selenium concentrations in some fish- and bird-tissue samples were at levels of concern, in late 1994 the NIWQP initiated the planning phase (phase IV) for remediation. One of the objectives of the NIWQP planning phase was to determine what, if any, remediation methods could be used to reduce selenium loading from irrigation sources to the Uncompahgre and Gunnison Rivers (fig. 1).
Figure 1. Location of the lower Gunnison River Basin and study area.

INTRODUCTION 3
More attention to the selenium issue came in 1997, when the Colorado State Water Quality Control Commission revised chronic aquatic-life criterion for dissolved selenium from 17 µg/L to 5 µg/L. Imple-mentation of the 5-µg/L standard for the Gunnison River Basin meant that the Uncompahgre River and the lower Gunnison River (downstream from the Uncompahgre River to the mouth), along with some other water bodies in the lower Gunnison River Basin, were out of compliance for selenium. Temporary modifications were put in place for the affected water bodies to allow time for measures to be taken at the local level to address the selenium issue. A local initia-tive began in 1998, with formation of the Gunnison Basin Selenium Task Force (Task Force). The Task Force is a group of private, local, State, and Federal interests who examined numerous projects, methods, and ideas for feasibility for reducing selenium levels in the Uncompahgre and Gunnison Rivers.
One participant in the Task Force is the NIWQP because of a common interest in searching for ways to reduce selenium concentrations in the Uncompahgre and Gunnison Rivers. A public meeting was held by the Task Force in November 1999 to obtain input from the local community about what could be done to reduce selenium. The Task Force and the NIWQP analyzed more than 40 remediation alternatives to identify feasible methods for reducing selenium in the Uncompahgre and Gunnison Rivers to meet the State standard of 5 µg/L. The remediation alternatives will be evaluated for their effectiveness on reducing sele-nium concentrations in the main-stem rivers, their cost effectiveness, and their possible negative effects on the local economy and lifestyle.
A number of remediation alternatives were considered by the NIWQP prior to formation of the Task Force. Some alternatives involved improving irri-gation-distribution systems or improving on-farm irri-gation; these are the type of projects that have been used by the Salinity Control Program to reduce salinity. Because the Mancos Shale has been identified as the major source of selenium and salt in the lower Gunnison River Basin, it was logical to assume that a salinity-control type project such as canal and lateral lining might provide dual benefits of reducing sele-nium and salt loading. For many years, numerous studies were done by government and university researchers on salt-loading mechanisms and methods to estimate salinity reductions attributable to canal and
lateral lining (for example, Duke and others, 1976; Bureau of Reclamation, 1978, 1982).
In general, there is a correlation between sele-nium load and salt load (Butler and others, 1996) in the Grand and Uncompahgre Valleys; however, the accuracy of estimating selenium reductions for a canal or lateral-lining project based on the salt load is not known. A demonstration project to measure directly how lateral lining or piping affected selenium loads was proposed by the NIWQP. Such a project would require a small basin in a high-selenium area, where monitoring could be done rather easily, and where there were a few miles of open laterals that were assumed to be contributing a significant selenium load (from leakage) that was measurable in that basin. Such an area exists southeast of Montrose in an area drained by Montrose Arroyo (fig. 1). Because there would be salinity reductions from such a project, the Salinity Control Program was approached along with the NIWQP to provide funds for a demonstration project. Amendments to the Salinity Control Act in 1995 allowed the Salinity Control Program to share costs on a project. Thus, with funds provided by the Bureau of Reclamation (BOR) through the Salinity Control Program and the NIWQP and with construction labor and machinery supplied by the Uncompahgre Valley Water Users Association (UVWUA), the Montrose Arroyo demonstration project was initiated in 1998. The U.S. Geological Survey (USGS) collected sele-nium and salinity data from June 1998 through October 2000 to document the effects of the project.
The Montrose Arroyo demonstration project had two objectives:
1. For the Salinity Control Program, to prevent an esti-mated 2,300 tons per year of salt from entering the Colorado River.
2. For the NIWQP, to demonstrate the effect of a salinity-control type project, such as lateral lining, on selenium loads.
This report describes the Montrose Arroyo demonstration project and its effect on selenium and salt loads in the Montrose Arroyo Basin. The report also describes the monitoring plan and the method of analysis used for determining the effect of the project on selenium and salt loads in Montrose Arroyo.

4 Effects of Piping Irrigation Laterals on Selenium and Salt Loads, Montrose Arroyo Basin, Western Colorado
Montrose Arroyo Demonstration Project
Montrose Arroyo is a tributary of Cedar Creek, which is tributary to the Uncompahgre River in the Montrose area (fig. 1). Montrose Arroyo drains mixed land uses of urban, suburban, agricultural, and unde-veloped desert areas. The study area (fig. 2) occupies about the middle one-third of the basin southeast of Montrose. Historically, the study area was primarily agricultural and rural, but as population has increased, some of the area has been developed with residential areas ranging from higher density subdivisions to small acreages. Also, a golf course development began about 1997–98 in the area between sites MA3 and MA2 (fig. 2).
One reason Montrose Arroyo was selected for a demonstration project was because the area included several laterals of moderate size that could be lined or placed in pipe at a cost that was acceptable to the Salinity Control Program and the NIWQP. Five open-ditch laterals in the Montrose Arroyo Basin were part of the project: the AME, AMF, AMD, AMB, and D1.60 (fig. 2). The UVWUA replaced 8.5 miles of open laterals with about 7.5 miles of PVC pipe. The PVC pipe was placed in trenches and buried, and the original laterals were filled in. About 80 percent of the lateral construction was done in the winter of 1998–99, and the remainder was completed in December 1999.
Monitoring Program and Method of Analysis
Three sites on the main stem of Montrose Arroyo (MA4, MA3, and MA2) and two sites on drainage ditches (D2MA and D1MA) (fig. 2) were used to monitor the effects on selenium and salt loads from replacing the open laterals with pipe. A control site was needed to monitor inflow loads upstream from the project area. Site MA4 was upgradient from suspected ground-water inflow that could be caused by lateral leakage and was used as the control site. Site MA3 at 6700 Road was selected primarily because it was upstream from new golf course development and also to document changes in the upper part of the project. Site MA2 at Niagara Street was the outflow site and was assumed to be downstream from all or nearly all of the surface and subsurface inflows related to the five laterals. A substantial amount of pre-project
selenium and salinity data (31 samples) was available for site MA2. Those samples had been collected by the USGS as part of the NIWQP studies and monitoring in the Uncompahgre Valley in 1993–97. Monitoring for the lateral demonstration project began in June 1998 to collect pre-project data. Water samples were collected biweekly at the five sites for selenium and major-ion analysis. Salinity concentrations were determined using the sum of constituents method, which computes the salinity (dissolved solids) concentration by summing the major-ion concentrations. Stream discharge was measured with every sample collected to enable computation of loads. The biweekly sampling was continued through October 2000. Monthly samples were collected from April through September in 1999 and 2000 at two sites on the AM lateral (sites AM1 and AM3 in fig. 2) and one site on the Loutzenhizer Canal (site LZC). Data from the AM lateral and Loutzenhizer Canal were used to determine selenium and salinity concentrations in the irrigation water for use in the loading analysis. Water-quality data collected by the USGS in the Montrose Arroyo Basin before 1998 are published in Butler and Osmundson (2000). Water-quality data collected in 1998–2000 are unpublished but are on file at the USGS office in Grand Junction, Colorado. All water-quality data for the Montrose Arroyo area also can be obtained from the USGS National Water Information System.
Selenium and salt loads for each sample were computed using the selenium and salinity concentra-tions from the chemical analysis and the streamflow that was measured at the time samples were collected. Instantaneous load is computed by multiplying the streamflow times the concentration times a conversion factor. Selenium loads are in pounds per day, and salt loads are in tons per day. The lateral construction was done during the nonirrigation season, when there is no water in the laterals, and began in November 1998. Because about 80 percent of the lateral work was completed in winter 1998–99, the first effects from the lateral project were expected to occur once the irriga-tion water was turned back into these laterals about April 1, 1999, and all data collected before April 1999 would be pre-project data. For the loading analysis, samples for each site were separated into a pre-project period (all data prior to April 1999) and a post-project period (April 1999–October 2000). It would seem that a simple before-and-after comparison of average loads

INT
RO
DU
CT
ION
5
Figure 2. Study area and sampling sites.
US H
wy 550
Montrose
Dry C
edar
Creek
Montrose Arroyo South
Canal
Loutzenhizer
Canal
AM
Lateral
AME
AMF
AMD
AMB
E. Niagara StreetMainstem Site (MA2)
DrainageDitch Site (D1MA)
LZC
D1.60
6700 RoadMainstem Site (MA3)
DrainageDitch Site (D2MA)
UpperMainstem Site (MA4)
AM1
AM3
Fairview Reservoir
0 1 2 MILES
0 1 2 KILOMETERS
EXPLANATION
Laterals piped by projectOther South Canal LateralsMajor canalsCanal or lateral siteMonitoring site
Approximate areal extent of golf course development
Montrose city boundary
Base From U.S. Geological Survey1:24,000 Digital Line Graph1927 North American Datum, UTM Zone 13
107°50' 107°47'30"107°52'30"38°28'44"
38°27'30"
38°26'16"

6 Effects of Piping Irrigation Laterals on Selenium and Salt Loads, Montrose Arroyo Basin, Western Colorado
would be sufficient to determine effects of the project; however, placing open laterals in pipe eliminated lateral waste flows that previously discharged into Montrose Arroyo or tributary ditches. Lateral waste flows are the excess, or unused part of the water in a lateral that is not diverted to on-farm use. Often, a greater quantity of flow than what is required for on-farm use is diverted into a lateral to maintain sufficient head and depth at all the headgates on that lateral. The excess water from the lateral is usually discharged into the nearest drainage ditch or natural drainage. There-fore, streamflow during the irrigation season in Montrose Arroyo and tributary drainage ditches is a mixture of a surface-water component composed of irrigation tailwater from fields and suburban areas and waste flows from canals and laterals and a ground-water component. Elimination of waste flows from the five laterals caused lower streamflow during the irriga-tion season in the arroyo and the two drainage ditches (table 1). For example, at site MA2, the mean irriga-tion-season streamflow decreased from 19.4 ft3/s for the pre-project samples to 12.4 ft3/s for the post-project samples. Because there were no waste flows from the piped laterals in the post-project period, what previously was wastewater from the laterals remained in the AM lateral or Loutzenhizer Canal, and much of
that water flowed out of the basin. The lateral waste flows had a selenium and salt load associated with it; therefore, the question could be asked, “How much of the selenium and salt reductions in Montrose Arroyo were caused simply by a reduction in lateral waste water?” To address that question, the irrigation-season loads were separated into ground-water and surface-water components.
The analysis of irrigation-season loads was done using concentration (C) data and discharge (Q) data. The method involves solving two equations:
Qi = Qsw +Qgw (1)
(Qi)(Ci) = (Qsw)(Csw) + (Qgw)(Cgw) (2)
The i terms are the irrigation-season streamflow and sample concentrations; the sw terms are the surface-water component, and the gw terms are the ground-water component. The Qi and Ci terms are the means of the measured streamflow and sample concentrations for the irrigation season at each site. The mean irrigation-season selenium and salinity concentrations are listed in table 1. The surface-water concentrations (Csw) were estimated as the mean of
Table 1. Mean streamflow, selenium concentrations, and salinity concentrations for irrigation-season (April through October) and nonirrigation-season (November through March) samples at the five monitoring sites
[Pre, pre-project period; Post, post-project period; the U.S. Geological Survey site identification numbers for the monitoring sites: site MA4 is 382702107493701; site D2MA is 382704107493801; site MA3 is 382711107500501; site D1MA is 382726107505802; site MA2 is 382802107513301]
Site(fig. 2)
Streamflow(cubic feet per second)
Selenium(micrograms per liter)
Salinity(milligrams per liter)
Pre Post Pre Post Pre Post
Irrigation season
MA41 0.91 1.01 18 18 2,996 3,732
D2MA 2.93 1.96 32 23 1,510 1,797
MA3 4.76 3.89 27 20 1,924 1,963
D1MA 4.54 3.58 26 27 1,398 1,778
MA2 19.4 12.4 25 27 1,277 1,703Nonirrigation season
MA4 0.45 0.43 77 85 6,621 6,851
D2MA .49 .24 149 89 7,107 6,702
MA3 .96 .70 106 86 6,455 6,573
D1MA .63 .60 65 69 4,579 4,592
MA2 2.55 2.22 98 82 4,830 4,8711Control site.

INTRODUCTION 7
the selenium and salinity concentrations (table 2) in monthly samples collected from April to October in 1999–2000 from two sites on the AM lateral and one site on the Loutzenhizer Canal (fig. 2). The ground-water concentrations (Cgw) were the mean concentra-tions of the samples collected in November through March at each site (table 1) and were assumed to approximate selenium and salinity concentrations in the ground-water component during the irrigation season. The Qsw and Qgw variables are unknowns. Equation (1) was solved for Qsw; Qsw = Qi – Qgw, and after substituting that expression for Qsw into equation (2), there was only one unknown, Qgw, remaining in equation (2). Once Qgw was calculated,
Qsw was computed as Qi – Qgw. After computing Qsw and Qgw, the mean selenium and salt loads in the surface-water and ground-water components for the irrigation season were computed. Load equals flow times concentration times a conversion factor (0.00539 for selenium; 0.0027 for salinity). For example, the mean selenium load in surface water equals Qsw times Csw times 0.00539. This process was done for the pre-project and post-project periods for all sites except MA4, the control site. The mean loads derived by this method for the irrigation season (sum of mean surface-water load and mean ground-water load) and the nonirrigation season are listed in table 3. The mean loads for site MA4 were computed using the periodic samples collected at that site for each season. Readers are advised not to use the data in table 1 to compute the mean loads shown in table 3. A mean load computed using the mean streamflow and concentration data from table 1 may or may not equal the loads in table 3 because computing mean loads by that method is not equivalent to the method used to compute the mean loads listed in table 3.
Once the irrigation-season analyses were done, the mean surface-water and ground-water loads were converted to annual loads. The means of the surface-water and ground-water loads for the irrigation season (April through October) were extrapolated to loads for
Table 2. Mean selenium and salinity concentrationsin irrigation water from the AM lateral and Loutzenhizer Canal, 1999–2000
[<, less than]
Site(fig. 2)
Selenium(micrograms
per liter)
Salinity(milligrams
per liter)
1999 2000 1999 2000
AM1 2.2 1.5 209 188
AM3 3.6 2.4 262 246
LZC <1 0.9 261 250
Table 3. Mean selenium and salt loads for irrigation-season (April through October) and nonirrigation-season (November through March) samples at the five monitoring sites
[Pre, pre-project period; Post, post-project period]
Site(fig. 2)
Selenium load(pounds per day)
Salt load(tons per day)
Pre Post Pre Post
Irrigation season
MA4 0.09 0.07 7.3 8.3
D2MA .38 .21 9.4 7.8
MA3 .57 .38 21.2 18.7
D1MA .60 .43 16.1 14.3
MA2 2.30 1.65 62.1 52.8
Nonirrigation season
MA4 .19 .19 8.0 7.9
D2MA .41 .12 9.2 4.2
MA3 .55 .32 16.5 12.2
D1MA .23 .22 7.7 7.3
MA2 1.31 .95 32.6 26.9

8 Effects of Piping Irrigation Laterals on Selenium and Salt Loads, Montrose Arroyo Basin, Western Colorado
the entire irrigation season by multiplying the esti-mated mean loads times 214 days. The means of the individual sample loads collected in the nonirrigation season (November through March) were multiplied by 151.25 days (allowing for leap years) to estimate the nonirrigation season loads. The nonirrigation season loads were assumed to be derived primarily from ground-water sources in the Montrose Arroyo Basin, so the sum of the nonirrigation-season load and the estimated ground-water load in the irrigation season is the annual ground-water load. The total annual sele-nium and salt loads are the sum of the surface-water load and the ground-water load (tables 4 and 5). The pre-project selenium and salt loads were compared to the post-project loads to examine the effects of the lateral improvements. The change in the ground-water load between the pre-project and post-project periods should reflect changes caused by the lateral work.
The total loads shown in tables 4 and 5 can be approximated by using the data in table 3; the total loads are equal to the sum of the mean irrigation-season load times 214 and the mean nonirrigation season load times 151.25. The loading analysis was done by using a computerized spreadsheet program, and the computations were done using unrounded numbers. The mean loads in table 3 are rounded values. Slight differences in the total loads computed using the values in table 3 when compared to the total loads listed in tables 4 and 5 may be obtained because of rounding. However, computing total loads using data in table 3 does not separate the total load into surface-water and ground-water load. The component analysis of the irrigation-season loads was done because of the need to know the effects of the lateral project on ground-water loads.
Table 4. Selenium loads for the Montrose Arroyo demonstration project
[Loads are annual loads, in pounds; Pre, pre-project period; Post, post-project period; Change, the post-project load minus the pre-project load; Percent, percent change; --, not calculated]
Site(fig. 2)
Total load Ground-water load Surface-water load
Pre Post Change Percent Pre Post Change Percent Pre Post Change Percent
MA41 48 45 –3 –6 -- -- -- -- -- -- -- --
D2MA 144 64 –80 –56 135 58 –77 –57 9 6 –3 –33
MA3 206 130 –76 –37 195 121 –74 –38 11 9 –2 –18
D1MA 163 125 –38 –23 158 121 –37 –23 5 4 –1 –20
MA2 690 496 –194 –28 653 475 –178 –27 37 21 –16 –431Control site.
Table 5. Salt loads for the Montrose Arroyo demonstration project
[Loads are annual loads, in tons; Pre, pre-project period; Post, post-project period; Change, the post-project load minus the pre-project load; Percent, percent change; --, not calculated; the sum of ground-water and surface-water loads may not equal total loads in some cases because of rounding]
Site(fig. 2)
Total load Ground-water load Surface-water load
Pre Post Change Percent Pre Post Change Percent Pre Post Change Percent
MA41 2,780 2,960 180 6 -- -- -- -- -- -- -- --
D2MA 3,400 2,300 –1,100 –32 3,030 2,070 –960 –32 370 230 –140 –38
MA3 7,030 5,850 –1,180 –17 6,550 5,460 –1,090 –17 480 390 –90 –19
D1MA 4,610 4,170 –440 –10 4,170 3,840 –330 –8 440 330 –110 –25
MA2 18,200 15,300 –2,900 –16 15,700 13,900 –1,800 –11 2,490 1,420 –1,070 –431Control site.

EFFECTS OF PROJECT ON SELENIUM AND SALT LOADS 9
MA4 D2MA MA3 D1MA MA2SITE
0
800
100
200
300
400
500
600
700
AN
NU
AL
SE
LEN
IUM
LO
AD
, IN
PO
UN
DS
Pre-project load
Post-project load
EFFECTS OF PROJECT ON SELENIUM AND SALT LOADS
The placing of five laterals in pipe in the Montrose Arroyo Basin significantly reduced sele-nium loading and, to a lesser degree, reduced salt loading. Results are summarized in tables 4 and 5.
More than 90 percent of the decrease in total-selenium load at the four sites downgradient from the lateral work (all sites in table 4 except site MA4) was attributed to decreases in the ground-water component. Because of the low selenium concentrations in the incoming irrigation water (table 2), the selenium load in the irrigation wastewater and tailwater was a small part of the total selenium load (table 4). At the outflow site at Niagara Street (site MA2), the total-selenium load decreased about 194 lb/yr, or 28 percent (table 4; fig. 3). Site MA2 was the only site in the Montrose Arroyo Basin with selenium data prior to 1998 (fig. 4); therefore, the pre-project loads for this site may be subject to less uncertainty than loads at the other four sites, where sampling did not begin until June 1998. Also noteworthy is the greater than 50-percent
decrease in selenium load in drainage ditch D2MA (table 4; fig. 3), apparently the result of placing the AME lateral in pipe (fig. 2). At control site MA4, sele-nium loads essentially did not change (table 4; fig. 3).
From an inspection of figure 4, it appears that the post-project selenium loads for individual samples collected at site MA2 were less than the pre-project loads. However, because of the variation in the loads, it is difficult to know if the differences in loads between periods are statistically significant. To deter-mine if the loads were significantly different, the two-sample t-test (Helsel and Hirsch, 1992) was used on concentration and load data to compare the pre- and post-project periods. Because some of the data sets do not have a normal distribution, the t-tests were done on the ranks of the data rather than on the original data. The tests were done to compare the individual sample concentrations and loads between the pre- and post-project periods for selenium and salt. A significance level of 0.05 was used to accept or reject the null hypothesis that concentrations or loads between two data sets are equal. The data for each period are sepa-rated into irrigation-season (April–October) and
Figure 3. Comparison of selenium loads in Montrose Arroyo Basin before and after the lateral project.

10 Effects of Piping Irrigation Laterals on Selenium and Salt Loads, Montrose Arroyo Basin, Western Colorado
1993 1994 1995 1996 1997 1998 1999 2000
SE
LEN
IUM
LO
AD
, IN
PO
UN
DS
PE
R D
AY
PRE-PROJECT PERIOD POST-PROJECTPERIOD
3.5
3.0
2.5
2.0
1.5
1.0
0.5
0
nonirrigation-season data sets (table 3) for the statis-tical test. The selenium loads for the post-project samples were significantly less than the pre-project loads for both seasons (p values 0.001 for both seasons). Mean selenium concentrations and loads in the nonirrigation-season samples at site MA2 (tables 1 and 3) were significantly less in the post-project period than in the pre-project period (p values 0.005 and 0.010).
Salt loads also decreased at all sites except at the control site (table 5; fig. 5). However, the relative percentage of change in total salt loads was consider-ably less than the percentage of change in total sele-nium loads. The maximum percentage of change in salt load was the 32-percent decrease in drainage ditch D2MA. A greater percentage of the decrease in salt load was caused by reduced lateral waste discharges (the change in the surface-water component) compared to selenium load decreases; and at the outflow site (MA2), about 37 percent of the salt-load decrease (1,070 divided by 2,900) was in the surface-water component (table 5). By comparison, only 8 percent of the decrease in selenium load at site MA2 was in the surface-water component (16 divided by 194, table 4). Based on the loading analysis in tables 4 and 5, a greater percentage of the total salt load is in
the surface-water component compared to the total selenium loads. For example, for the pre-project period at site MA2, the surface-water component is 5 percent of the total selenium load but 14 percent of the total salt load. Therefore, the elimination of the waste-water flows from the laterals that were piped had a proportionately greater effect on the salt loads than on selenium loads.
Statistical tests indicate that the post-project salt loads are significantly less than pre-project loads, especially during the irrigation season. The mean irri-gation-season salt load decreased from 62.1 tons/d to 52.8 tons/d (p value 0.001). Although irrigation-season salt loads were significantly less in the post-project period, salt concentrations in the irrigation season (table 1) were significantly higher in the post-project period than in the pre-project period (p value 0.001). The increase in salt concentrations in the irri-gation season was caused by the elimination of waste-water flows from the laterals that were piped, which results in less dilution of the much higher salt concen-trations (about 4,800–4,900 mg/L based on nonirriga-tion salinity concentrations for site MA2, table 1) in ground-water inflow into Montrose Arroyo upstream from site MA2.
Figure 4. Selenium loads in Montrose Arroyo at Niagara Street (MA2), 1993–2000.

EFFECTS OF PROJECT ON SELENIUM AND SALT LOADS 11
MA4 D2MA MA3 D1MA MA2SITE
20,000
0
2,000
4,000
6,000
8,000
10,000
12,000
14,000
16,000
18,000
AN
NU
AL
SA
LT L
OA
D, I
N T
ON
SPre-project load
Post-project load
Before the demonstration project began, the projected salinity reduction from the lateral project was about 2,300 tons/yr (Michael Baker, Bureau of Reclamation, written commun., 1998). That projection was based on some general canal and lateral seepage rates for the Uncompahgre Valley that were estimated for previous salinity studies (Bureau of Reclamation, 1982), the size of the laterals, and the length of time water was in the laterals. The annual ground-water load at site MA2 decreased about 1,800 tons (table 5), which is the part of the salt-load change that is assumed to be directly attributable to eliminating ground-water recharge from laterals that were previ-ously open ditches. At the control site, salt load increased about 180 tons/yr in the post-project period (table 5). If that increase in salt load into the study basin is accounted for, then the salt-load decrease attributable to the lateral piping was about 1,980 tons/yr (1,800 plus 180), which is about 86 percent of the projected salt reduction.
Data from the demonstration project provided the NIWQP with information on whether a lateral improvement project has the same effect on selenium loads as it does on salt loads. In remediation planning,
some simplifying assumptions previously have been made that use ratios of selenium and salt loads to esti-mate selenium reductions that might occur for salinity-control type projects. Ratios of selenium load to salt load were computed using samples collected in November through March that were assumed to be composed solely of ground-water discharge, and those ratios were used to calculate a selenium reduction based on the estimated salinity reduction for a partic-ular project. For Montrose Arroyo at site MA2, the load ratio was 0.041 (using only pre-demonstration project data), which implies that 0.041 pound of sele-nium is proportional to 1 ton of salt. If the original 2,300-ton salt-reduction estimate is used, then the lateral project should have produced about a 94-pound reduction in selenium at site MA2 (2,300 times 0.041). However, the selenium load (in the ground-water component) decreased 178 pounds (table 4) at site MA2, almost double what was predicted using the load ratio. The ratio for the selenium and salt load reductions measured for this study (tables 4 and 5) is about 0.10 (178 pounds of selenium divided by 1,800 tons of salt). It is not known how applicable the results of the demonstration project are to other areas
Figure 5. Comparison of salt loads in Montrose Arroyo Basin before and after the lateral project.

12 Effects of Piping Irrigation Laterals on Selenium and Salt Loads, Montrose Arroyo Basin, Western Colorado
in the lower Gunnison River Basin, but the results might indicate that canal and lateral improvements have a greater effect on selenium loads than on salt loads in the Mancos Shale areas of the lower Gunnison River Basin.
All of the decreases in selenium and salt loads that might have resulted from the demonstration project probably were not measured at site MA2. The AMB lateral is on a ridge between the Dry Cedar Creek and Montrose Arroyo Basins (fig. 2); therefore, not all ground water resulting from leakage from the AMB lateral would have necessarily discharged to Montrose Arroyo. For the other four laterals that were piped, it was assumed that all subsurface flow resulting from lateral leakage eventually discharged to Montrose Arroyo or tributary drainage ditches upstream from site MA2. Because of a lack of detailed information about the shallow ground-water flow paths in this area, that assumption might not be entirely valid. Because of the extensive pre-project data for site MA2, that site was used as the outflow site instead of a location farther downstream where no sampling had previously been done. Using the load reductions at site MA2 determined by this study and an estimate of the volume of lateral leakage that was not accounted for at site MA2, the BOR has estimated the project’s total selenium-load reduction at about 210 lb/yr and the total salt-load reduction at about 2,500 tons/yr (Michael Baker, Bureau of Reclamation, written commun., 2001).
FACTORS AFFECTING SELENIUM AND SALT LOADS
The goal of lining a canal or lateral, or removing open-ditch laterals and placing them in PVC pipe as was done in the Montrose Arroyo project, is to reduce or eliminate canal and lateral leakage into shallow ground water. Canal or lateral improvements would have the effect of reducing the volume of shallow ground-water discharge, which should directly reduce selenium and salt loads because load is a function of concentration and discharge. The decreases in the salt loads in the ground-water component for the Montrose Arroyo area (table 5) are assumed to be related to the amount of ground-water recharge that was caused by leakage from the five laterals that were piped. Except for a small decrease at site D2MA (table 1), the salinity concentrations in shallow ground-water
discharge (the nonirrigation season, or November through March samples) in the study area did not change significantly from the pre-project to the post-project period; therefore, decreases in ground-water discharge must be the primary reason for decreases in salt loads. However, changes in discharge cannot explain all of the decreases in the selenium loads. As discussed in the previous section and shown in tables 1 and 2, the relative decreases in selenium loads were considerably greater than the decreases in salt loads, which implies that selenium concentrations, at least in some areas, must also have decreased along with decreases in discharge. At three sites, selenium concentrations in the nonirrigation-season samples were lower in the post-project period than in the pre-project period (table 1). At site D2MA, the mean sele-nium concentration in the nonirrigation-season samples decreased from 149 µg/L in the pre-project period to 89 µg/L in the post-project period. In some areas, such as the area drained by ditch D2MA, the decrease in ground-water flow might have affected the geochemical environment in the shallow ground water, which could cause changes in selenium concentra-tions.
It was assumed that the decreases in selenium and salt loads described in this report were solely attributed to the lateral project. Home construction was an ongoing activity in the study area, and work at the golf course between sites MA3 and MA2 (fig. 2) also was done during the study period. Because no large tracts of land were removed from irrigation, it does not seem likely that development would have caused lower selenium and salt loads in Montrose Arroyo in 1999–2000. Work at the golf course area proceeded slowly in 1998–99 and the area was not irri-gated. The only potential effect at the golf course in 1999 was the filling of a pond in June with water from Montrose Arroyo, which may have leached some sele-nium and salt from salt crusts that were inundated. Limited sprinkler irrigation began on a few of the fair-ways in late summer in 2000, but it is unlikely that the new irrigation had much effect on the post-project loads, which were computed through October 2000.
In addition to human activities, there could be other factors that could have affected the results of this study. One factor that raised some concern was the unusually high rainfall in July and August 1999 in the Montrose area. At Montrose, the total precipitation in July and August 1999 was 6.07 inches, which is 288 percent above the 1961 to 1990 normal rainfall of

SUMMARY 13
2.11 inches for July and August (data obtained from the Western Regional Climate Center in Reno, Nevada, at http://www.wrcc.dri.edu/accessed November 2001). The rain may have caused an unusual amount of flushing of soluble salts from the soil that could increase selenium and salt loading the Montrose Arroyo area during the post-project period. If that happened, then some of the load reduc-tions resulting from the lateral project could be offset by increased loads caused by the excess rainfall. Comparison of the individual samples collected during this period to samples from the summer of 2000 does not indicate any unusual changes in loads during July–September 1999.
A potential effect on selenium and salt loads in the Montrose area is conversion of agricultural land to residential and commercial development. However, the effect of land-use changes on selenium and salt loads has not been documented for the study area. Concerns have been expressed by members of the Task Force and at public meetings that new development, especially on previously nonirrigated land in shale areas, might contribute new selenium and salt loading to the Uncompahgre and Gunnison Rivers. New loading sources could partly offset some of the load reductions that result from remediation projects such as the Montrose Arroyo demonstration project. In November 2000, the USGS began collecting monthly samples at sites MA3 and MA2 for the NIWQP to monitor long-term changes in selenium and salt loads in Montrose Arroyo.
SUMMARY
Selenium and salinity are water-quality issues in the Upper Colorado River Basin. The east side of the Uncompahgre Valley in west-central Colorado contains soils and bedrock with high salt and selenium concentrations. Irrigation in the area has increased salt and selenium loads to the Gunnison River. The National Irrigation Water Quality Program (NIWQP) and the Gunnison Basin Selenium Task Force were examining remediation methods to reduce selenium loading in the lower Gunnison River Basin because some water bodies in the basin have selenium concen-trations that exceed the State water-quality standard (5 µg/L). Lining or placing irrigation canals and laterals in pipe to eliminate canal and lateral leakage has been used to reduce salt loads in the Colorado
River Basin. A demonstration project was initiated in 1998 to replace 8.5 miles of open-ditch laterals (five different laterals) with pipe and determine the effects on selenium and salt loads in the Montrose Arroyo Basin. Montrose Arroyo has high selenium and salinity concentrations and is significantly affected by irrigation drainage.
Biweekly samples were collected from June 1998 through October 2000 by the U.S. Geological Survey (USGS) to monitor selenium and salt loads at five sites in the Montrose Arroyo Basin. Data were separated into pre-project and post-project data sets for each site to determine the effects of the lateral project on selenium and salt loads. Water-quality data were analyzed to estimate surface-water and ground-water loads. Changes in ground-water loads were used to estimate the effects of the lateral demonstration project.
The placing of five laterals in pipe caused a significant reduction in selenium loads in the post-project period at all monitoring sites except at the control site, where selenium loads did not change. At the outflow monitoring site on Montrose Arroyo (MA2), the selenium load decreased about 194 lb/yr, or 28 percent of the pre-project load, and more than 90 percent of that decrease was in the ground-water load. The selenium load decreased more than 50 percent in a tributary drainage ditch (site D2MA).
Salt load also decreased in the post-project period at all monitoring sites except the control site. The percent decreases in salt loads were smaller than the percent decreases in selenium loads. The decrease in salt load at the outflow site on Montrose Arroyo (MA2) was about 1,800 tons/yr (ground-water portion of the total load). If a small increase in salt load at the control site is accounted for, the estimated salt-load decrease in Montrose Arroyo was about 1,980 tons/yr.
All of the potential effects of the lateral demon-stration project on selenium and salt loads might not have been measured at the monitoring sites. Part of the leakage from some of the laterals prior to their being placed in pipe did not necessarily discharge into Montrose Arroyo upstream from Niagara Street. The lateral project had a greater affect on selenium loads than on salt loads. The greater decrease in selenium loads relative to salt loads may have been partially the result of decreases in selenium concentrations in the ground water in some areas of the demonstration-study area in addition to the decreases in loads caused by decreases in ground-water discharge.

14 Effects of Piping Irrigation Laterals on Selenium and Salt Loads, Montrose Arroyo Basin, Western Colorado
It was assumed that the measured changes in selenium and salt loads during the period of this study were solely attributed to the lateral project. Housing and golf-course development were occurring in the study area during 1998–2000. The long-term effects of new development on selenium and salt loads, espe-cially the conversion of agricultural land to residential or commercial uses or development on previously nonirrigated land in shale areas, is unknown. In November 2000, the USGS began monthly sampling at two of the sampling sites on Montrose Arroyo to monitor long-term changes in selenium and salt loads.
REFERENCES CITED
Bureau of Reclamation, 1978, Stage One development, Grand Valley Unit, definite plan report—Appendix A, hydrosalinity, land resource, economics: Salt Lake City, Bureau of Reclamation, five numbered sections plus attachments.
———1982, Lower Gunnison Basin Unit_Feasibility report—Appendix B, hydrosalinity: Salt Lake City, Utah, Bureau of Reclamation, 86 p.
Butler, D.L., Wright, W.G., Stewart, K.C., Osmundson, B.C., Krueger, R.P., and Crabtree, D.W., 1996, Detailed study of selenium and other constituents in water, bottom sediment, soil, alfalfa, and biota associ-ated with irrigation drainage in the Uncompahgre Project area and in the Grand Valley, west-central Colorado, 1991–93: U.S. Geological Survey Water-Resources Investigations Report 96–4138, 136 p.
Butler, D.L., and Osmundson, B.C., 2000, Physical, chem-ical, and biological data for the Uncompahgre Project area and the Grand Valley, west-central Colorado, 1993–98: U.S. Geological Survey Open-File Report 99–453, 216 p.
Duke, H.R., Kruse, E.G., Olsen, S.R., Champion, D.F., and Kincaid, D.C., 1976, Irrigation return flow water quality as affected by irrigation water management in the Grand Valley of Colorado: Fort Collins, Colo., U.S. Department of Agriculture, 123 p.
Helsel, D.R., and Hirsch, R.M., 1992, Statistical methods in water resources: Amsterdam, Elsevier Science Publishers, 529 p.
U.S. Department of the Interior, 1999, Quality of water—Colorado River Basin: Salt Lake City, Utah, Bureau of Reclamation, Upper Colorado Region, Progress report no. 19, 93 p. plus appendix.