effects of olive mill wastewater on soil carbon and nitrogen cycling
TRANSCRIPT

ENVIRONMENTAL BIOTECHNOLOGY
Effects of olive mill wastewater on soil carbon and nitrogencycling
Myrto Tsiknia & Vasileios A. Tzanakakis & Dimitris Oikonomidis &Nikolaos V. Paranychianakis & Nikolaos P. Nikolaidis
Received: 9 August 2013 /Revised: 13 September 2013 /Accepted: 16 September 2013# Springer-Verlag Berlin Heidelberg 2013
Abstract This study investigated the cycling of C and Nfollowing application of olive mill wastewater (OMW) atvarious rates (0, 42, 84, and 168 m3/ha). OMW stimulatedrespiration rate throughout the study period, but an in-crease in soil organic matter was observed only at thehighest rate. Soil phenol content decreased rapidly within2 weeks following application but neither phenol oxidaseand peroxidase activity nor laccase gene copies couldexplain this response. Soil NH4
+-N content increased inresponse to OMWapplication rate, while an opposite trendobserved for NO3
−-N, which attributed to immobilization.This decrease was in accordance with amoA gene copies ofarchaeal and bacterial ammonia oxidizers in the first daysfollowing OMW application. Afterwards, although amoAgene copies and potential nitrification rates recovered tovalues similar to or higher than those in the non-treatedsoils, NO3
−-N content did not change among the treat-ments. A corresponding increase in denitrifying gene cop-ies (nirK , nirS , nosZ ) during that period indicates thatdenitrification, stimulated by OMW application rate, wasresponsible for this effect; a hypothesis consistent with thedecrease in total Kjeldahl nitrogen content late in theseason. The findings suggest that land application ofOMW is a promising practice for OMW management, evenat rates approaching the soil water holding capacity.
Keywords Denitrification . Nitrification . Phenols .
Respiration . Soil organic matter
Introduction
The management of olive mill wastewater (OMW) remains achallenge in olive oil-producing countries. Attempts to devel-op efficient management practices extent to different disci-plines including physico-chemical methods, biotechnologicalapproaches, and natural treatment systems (Kapellakis et al.2012; Mantzavinos and Kalogerakis 2005; Ntougias et al.2012). During the last years, emphasis has been given to landapplication of OMW due to the advantages of the aforemen-tioned practice, including the low operation and managementcosts and the beneficial nutrient recycling (Montemurro et al.2011; Saadi et al. 2007; Sierra et al. 2007). Land application ofOMW has already been regulated in Italy, Portugal, andCatalonia (Casa et al. 2003; Sierra et al. 2007), but onlyrelatively low application rates are allowed to avoid any toxiceffects to crops and soils.
Lysimeter and field studies have shown almost completeremoval of organic and inorganic constituents of OMW,even at application rates up to 1,000 mm/year (Cabreraet al. 1996; Montemurro et al. 2011; Sierra et al. 2007).However, concerns have been raised with regard to poten-tially adverse effects of OMW on soil microbial communi-ty and its functioning. OMW has been reported to inducechanges in the composition and structure of soil microbialcommunity attributed to potentially toxic effects of OMW(Bodini et al. 2011; Mahmoud et al. 2010; Mekki et al.2006; Saadi et al. 2007), substrate availability and compo-sition (Karpouzas et al. 2009), environmental conditions(pH, redox potential, O2 diffusion, nutrient availability),and/or soil texture (Karpouzas et al. 2010).
Nevertheless, there is a dearth of information on howchanges in microbial community, induced by OMW applica-tion, affect critical processes linked to ecosystem function andservices, and particularly to the biogeochemical cycles of Cand N. Changes in the structure and the abundance of
M. Tsiknia :V. A. Tzanakakis :D. Oikonomidis :N. V. Paranychianakis (*) :N. P. NikolaidisDepartment of Environmental Engineering, Technical Universityof Crete, Polytechnioupolis, 73100 Chania, Greecee-mail: [email protected]
Appl Microbiol BiotechnolDOI 10.1007/s00253-013-5272-4
microorganisms involved in “narrow” processes, as the Ncycling (Schimel and Schaeffer 2012), have been successfullyemployed to understand the factors regulating N cycling andlink them with process rates (Petersen et al. 2012; Prosser2011). The existing knowledge has provided evidence fornitrification disruption, but it has not become clear if thiseffect is due to N immobilization or a toxic effect of OMWto ammonia oxidizers (Sierra et al. 2007). High rates of OMWapplication resulted in a slight decline of ammonia oxidizingbacteria population (AOB), while it stimulated the abundanceof denitrifiers (Di Serio et al. 2008). A decline in the abun-dance of AOBwas also reported in soil treated with 400 m3/haOMW (Mekki et al. 2006). However, culture-dependentmethods do not provide a representative overview of func-tional microbial community. Moreover, the involvement ofammonia oxidizing archaea (AOA) in ammonia oxidation,following OMW application to the soil, has not been investi-gated so far, although AOA have been reported to have animportant role once NH4
+-N is released from organic sub-strates (Levicnik-Hofferle et al. 2012; Stopnisek et al. 2010;Yamamoto et al. 2011).
Several studies have confirmed shifts in the compositionand the structure of microorganisms involved in C cyclingfollowing OMW application to the soil (Bodini et al. 2011;Karpouzas et al. 2009, 2010). Land application of OMWstimulated respiration (Piotrowska et al. 2006, 2011; Sierraet al. 2007) and activity of enzymes involved in C cyclingincluding dehydrogenase, urease, β-glucosidase, anddiphenol (Piotrowska et al. 2006); however, limited informa-tion is available for the activity of enzymes regulating theturnover of phenols. To our knowledge, no information existsas to the response of laccase genes following OMWapplica-tion to the soil. Laccase genes have an important role inphenol cycling in the soil (Sinsabaugh 2010), although theircontribution in the degradation of phenols found in OMW hasnot been investigated so far.
The objective of this study is to investigate the short-termeffect of OMW, applied at different rates, on the processesregulating C and N cycling. To achieve these targets, we haveadopted a multi-disciplinary approach, including monitoringof N-forms, nitrification rate, respiration rate, enzyme activi-ties, and functional genes abundance. The findings of thepresent study are expected to contribute on optimization ofOMW management, to maximize benefits to soils and crops,and support policy initiatives.
Material and methods
Experimental design
Pots of 0.75 l volume were filled in with 500 g of dry soil,previously passed through a 2-mm sieve. The soil used was
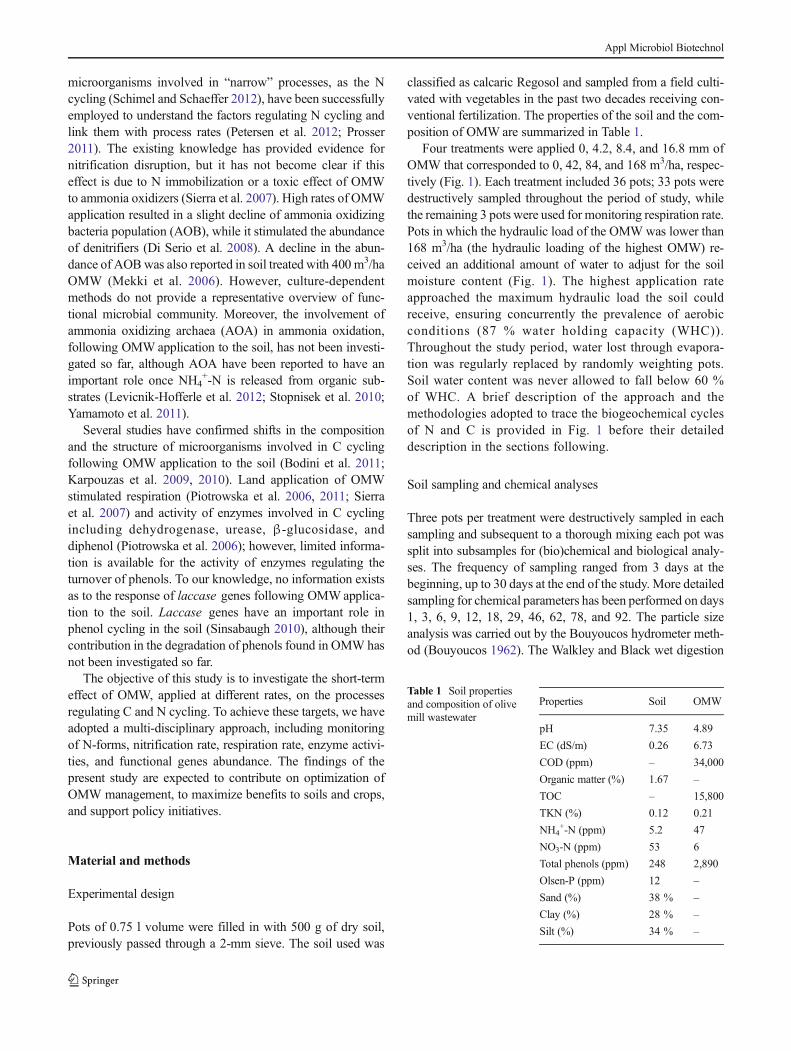
classified as calcaric Regosol and sampled from a field culti-vated with vegetables in the past two decades receiving con-ventional fertilization. The properties of the soil and the com-position of OMWare summarized in Table 1.
Four treatments were applied 0, 4.2, 8.4, and 16.8 mm ofOMW that corresponded to 0, 42, 84, and 168 m3/ha, respec-tively (Fig. 1). Each treatment included 36 pots; 33 pots weredestructively sampled throughout the period of study, whilethe remaining 3 pots were used for monitoring respiration rate.Pots in which the hydraulic load of the OMW was lower than168 m3/ha (the hydraulic loading of the highest OMW) re-ceived an additional amount of water to adjust for the soilmoisture content (Fig. 1). The highest application rateapproached the maximum hydraulic load the soil couldreceive, ensuring concurrently the prevalence of aerobicconditions (87 % water holding capacity (WHC)).Throughout the study period, water lost through evapora-tion was regularly replaced by randomly weighting pots.Soil water content was never allowed to fall below 60 %of WHC. A brief description of the approach and themethodologies adopted to trace the biogeochemical cyclesof N and C is provided in Fig. 1 before their detaileddescription in the sections following.
Soil sampling and chemical analyses
Three pots per treatment were destructively sampled in eachsampling and subsequent to a thorough mixing each pot wassplit into subsamples for (bio)chemical and biological analy-ses. The frequency of sampling ranged from 3 days at thebeginning, up to 30 days at the end of the study. More detailedsampling for chemical parameters has been performed on days1, 3, 6, 9, 12, 18, 29, 46, 62, 78, and 92. The particle sizeanalysis was carried out by the Bouyoucos hydrometer meth-od (Bouyoucos 1962). The Walkley and Black wet digestion
Table 1 Soil propertiesand composition of olivemill wastewater
Properties Soil OMW
pH 7.35 4.89
EC (dS/m) 0.26 6.73
COD (ppm) – 34,000
Organic matter (%) 1.67 –
TOC – 15,800
TKN (%) 0.12 0.21
NΗ4+-Ν (ppm) 5.2 47
NO3-N (ppm) 53 6
Total phenols (ppm) 248 2,890
Olsen-P (ppm) 12 –
Sand (%) 38 % –
Clay (%) 28 % –
Silt (%) 34 % –
Appl Microbiol Biotechnol

method was used for SOM determination. Total Kjeldahlnitrogen (TKN) was measured by a macro-Kjeldahl device.Ammonium and nitrates were extracted with 2 M KCl byshaking the samples for 30 min and measured colorimetricallyin a PerkinElmer Lambda 25 spectrophotometer with theNessler and the Cd reduction method, respectively. Totalsoluble phenolic compounds were extracted with sodiumpyrophosphate 0.4 N/sodium hydroxide 0.1 N, 1:1) and
quantified with the Folin–Ciocalteu method. This methodextracts the soluble, the anionically adsorbed, and the weaklybonded phenols to SOM (Sierra et al. 2007).
Respiration rate
Respiration rate was assessed according to the method ofZibilske (1994). Three pots per treatment were placed in 1-l
Fig. 1 Description of thetreatments imposed and themethodological approaches usedin order to study the effect ofOMWon the biogeochemicalcycles of C and N. Abbreviations:AOA ammonia oxidizing archaea;AOB ammonia oxidizingbaccteria; amoA ammoniamonooxygenase encoding gene;nirK Cu-nitrite reductaseencoding gene; nirS cd1-typenitrite reductase encoding gene;nosZ nitrous oxide reductaseencoding gene; PNR potentialnitrification rate; SOM soilorganic mater
Appl Microbiol Biotechnol

jars sealed by a gas-tight screw lid. The CO2 emitted from thepots was trapped in a plastic vial containing 10 ml of 1 MNaOH, placed inside the jar. CO2 was determined by adding1 ml of 1 M BaCl2 into CO2 traps and titrating to neutral pHwith 1 M HCl. Jars with dry soil (105 °C) were also includedto compensate for the effect of atmospheric CO2. Measure-ments were taken daily during the first week, every alternateday in the following 2 weeks and afterwards two times perweek.
Potential nitrification rate
Potential nitrification rate (PNR) was measured in triplicatesamples immediately after sampling according to the method-ology developed by Smolders et al. (2001), with slight mod-ifications. Soil samples (10 g d.w.) were transferred into 50 mlplastic tubes, covered with parafilm, to allow gas exchangeand minimize water losses, and pre-incubated for 3 days.Then, soils were amended with 100 mg NH4
+-N per kg ofsoil (d.w.) through a stock solution containing 4.7 mg(NH4)2SO4/ml. Distilled water was added to adjust soil mois-ture to 60 % of WHC. Soil NO3
−-N content was measuredimmediately after NH4
+-N addition, as well as 3 days after theaddition. Extraction and measurement of soil NO3
−-N contentwas performed as previously described. Nitrification rateswere calculated by linear regression of NO3
−-N concentrationversus time (in milligram N per kilogram hour).
Enzyme activity
Protease activity assays (EC 3.4.2.21-24) were performedaccording to the method of Ladd and Butller (1972) andexpressed as microgram tyrosine/gram soil 2 h. Urease activ-ity (EC 3.5.1.5) was assessed according to the protocol ofKandeler and Gerber (1988). The concentration of NH4
+-N
was measured colorimetrically as described in the previoussection. The same procedure was also followed for controls, inwhich distilled water was added instead of urea. Urease activ-ity expressed as milligram NH4
+-N per gram soil 2 h. β-Glucosaminidase activity assays (EC 3.2.1.30) wereperformed according to the method of Parham and Deng(2000). β-Glucosaminidase activity was expressed as milli-gram per litre p -nitrophenol/gram soil hour. Phenol oxidaseactivity assays (EC 1.10.3.2) were performed according to theprotocol developed by Li et al. (2010). The activity expressedas mcomolar L-DOPA oxidized/gram soil (d.w.) hour. Perox-idase assays (EC 1.11.1.7) were carried out according toSinsabaugh et al. (2003).
DNA extraction and qRT-PCR analyses
Genomic DNA was extracted from 0.5 g of soil, frozen be-forehand and homogenized with a mortar, using theUltraClean Soil DNA Isolation Kit (MOBIO Laboratories,Inc. Carlsbad, CA, USA) according to the manufacturer’sinstructions. DNA quality was checked in 1 % agarose gel,quantified in a Lambda 25 spectrophotometer and stored at−80 °C.
All the primers used for PCR amplification are summarizedat Table 2. More detailed, for AOB and AOA, amoA genecopies was carried out with 250 nM primer concentration; thecycling conditions of AOB and AOA amoA genes were 3 minat 95 °C, followed by 35 cycles of 30 s at 95 °C, 35 s at57.5 °C (55 °C for AOA) and a data acquisition step at 84 and81 °C, respectivel,y for 15 s. The thermal protocol for thenirK , nirS , and nosZ primers included an initial step of 95 °Cfor 3 min; 35 cycles 95 °C for 15 s, 60 °C for 60 s, followed bya data acquisition data step at 87.5, 84.5, and 84.5 °C, respec-tively, for 15 s. The cycling protocol for laccase gene includedan initial step of 95 °C for 4 min; 40 cycles at 95 °C for 15 s,
Table 2 Primers used in the present study and their annealing temperature
Target Primers Sequence (5–3) Annealing T (°C) Reference
Nitrifiers
AOA amoA amoAFamoAR
5′-STAATGGTCTGGCTTAGACG-3′5′-GCG GCCATCCAT CTGTATGT-3′
55 Francis et al. (2005)
AOB amoA amoA-1F amoA-2R 5′-GGGGTTTCTACTGGTGGT-3′5′-CCCCTCKGSAAAGCCTTCTTC-3′
57.5 Rotthauwe et al. (1997)
Denitrifiers
nirK nirK876 nirK1040 5′-ATYGGCGGVCAYGGCGA-3′5′-GCCTCGATCAGRTTRTGGTT-3′
60 Henry et al. (2004)
nirS nirSCd3aF nirSR3cd 5′-GTSAACGTSAAGGARACSGG-3′5′-GASTTCGGRTGSGTCTTGA-3′
60 Throbäck et al. (2004)
norZ nosZ2F nosZ2R 5′-CGCRACGGCAASAAGGTSMSSGT-3′5′-CAKRTGCAKSGCRTGGCAGAA-3′
60 Henry et al. (2006)
Laccase Cu1FCu2R
5′-CA(T/C)TGGCA(T/C)GGNTT(T/C)TT (T/C) CA-3′5′-GG(A)CTGTGGTACCAGAANGTNCC-3′
50.5 (Lauber et al. 2009)
Appl Microbiol Biotechnol

50.5 °C for 40 s, and 72 °C for 8 s followed by a dataacquisition data step at 80 °C for 15 s. Data acquisitiontemperatures were assessed by running trial qRT-PCRs, in-cluding the standards as well as some “unknown” samples.
Quantification of gene copy numbers was performed withthe StepOnePlus™ Real-Time PCR System (AppliedBiosystems) in 20 μl reactions using the KAPA SYBR FastMaster Mix (2×) qRT-PCR Kit (KAPA Biosystems) and 1 μlof 1/20 diluted soil DNA. All reactions were completed with amelting curve starting at 60 °C with an increase of 0.5 °C up to95 °C to verify amplicon specificity. Standard curves wereobtained using serial dilutions, 103–108 for ammonia oxidiz-ing organisms and 102–107 for denitrifiers, of linearized plas-mids (pGEM-T, Promega) containing cloned amoA , nirK ,nirS , nosZ , and laccase genes amplified from the soil of thisstudy. Controls without templates resulted in undetectablesignal in all the runnings, while no inhibitory effects weredetected at the adopted dilution. The amplification efficiencieswere 83 % for AOB, 90 % for AOA, 87 % for nirK , 78 % fornirS , 88 % for nosZ , and 99 % for laccase genes; the R2
values of the standard curves ranged from 0.997 to 0.999.Monitoring of gene copy numbers was performed on selectedsamplings (days: 3, 9, 18, 46 78, 92) based on the patterns ofthe corresponding chemical parameters.
Statistical analysis
One-way analysis of variance combined with post hoc Tuckeytest was employed to estimate the effect of treatments on soilchemical and biological parameters. The Pearson’s test wasapplied to check the significance of the correlations amongdifferent genes and chemical parameters.
Results
Respiration rate, SOM, and enzyme activity
Application of OMW to the land stimulated respiration ratewith the highest rates to prevail in the first 10 days (Fig. 2a).The total amounts of CO2-C emitted from the pots at day 85,when the respiration measurements were completed, were212, 341, 445, and 571 mg CO2-C per pot (Fig. 2b) for 0,42, 84, and 168 m3/ha OMW treatments. Soil organic matterfollowed strictly the pattern of CO2-C emission (Fig. 3), and atthe completion of the study, the amounts of C emitted were inagreement with the SOM content measured in the correspond-ing treatments. SOM in pots treated with 42 and 84 m3/ha didnot differ from that in the non-treated soils (Fig. 3). In contrast,SOM content remained higher in pots which received thehighest rate of OMW.
Protease activity decreased immediately after OMWappli-cation (day 1) in all OMW treatments and approached its
lowest values on day 6 (Fig. 4a). After that, protease activityrecovered slightly, especially in the highest application rates(84 and 168 m3/ha), while on day 29 pots treated with 84 and168 m3/ha OMWexceeded the value of non-treated soil by 56and 67 %, respectively (Fig. 4a). The activity of β-glucosaminidase was lower at day 6 in the treatments receiv-ing 84 and 168 m3/ha OMW (Fig. 4b). In the following
0 10 20 30 40 50 60 70 80 900
10
20
30
40
50
60
70
80
0 10 20 30 40 50 60 70 80 900
200
400
600
800
1000
1200
1400
CO
2 em
issi
on
rat
e (m
g C
kg
-1 s
oil
day
-1)
Control 42 m3ha-1
84 m3ha-1
168 m3ha-1
Cu
mm
ula
tive
CO
2(m
g C
kg
-1 s
oil)
Days
Fig. 2 Effect of OMW hydraulic loading on a soil respiration rate and bcummulative emission of CO2-C (±SE; n =3). Differences among everytwo treatments were significant in all sampling dates (p <0.001)
0 10 20 30 40 50 60 70 80 90 1001.5
1.6
1.7
1.8
1.9
2.0
2.1
2.2
b
a
b
a
c
b
a
d
c
b
a Control
42 m3ha-1
84 m3ha-1
168 m3ha-1
SOM
(%
soi
l d.w
.)
Days
Fig. 3 Effect of OMW hydraulic loading on soil organic matter (SOM)content (±SE; n =3). Different letters denote significant differencesamong means (p <0.05)
Appl Microbiol Biotechnol

sampling (day 18), however, it recovered to values similar tothese of control pots, while it exceeded the activity of controlpots on day 29 (Fig. 4b). OMW stimulated urease activityimmediately after OMW application, but shortly (day 6 up today 29) it decreased at levels lower than the non-amendedtreatments (Fig. 4c). Thereafter, differences among treatmentsdisappeared (data not shown).
Phenols content, phenol oxidase and peroxidase activity,and laccase gene copies
On day 1, soils treated with 42, 84, and 168 m3/ha of OMWhad 54, 93, and 211 % higher phenol content, respectively,compared to the non-treated soils. Soil phenol contentremained relatively constant up to day 3, when a rapid
decrease took place for the OMW-treated soils which contin-ued until day 18 (Fig. 5a). Thereafter, phenol contentremained relatively constant until the end of the study, being17.3, 35.3, and 65.8 % higher than the non-amended soil, at42, 84, and 168 m3/ha OMW application rates, respectively(Fig. 5a).
With regard to the laccase gene copy numbers, OMWdepressed laccase gene copy numbers at the highest applica-tion rate on day 3, while no differences between treatmentswere observed on days 9 and 18 (Fig. 5b). Then, on day 46,greater numbers of laccase gene copies were quantified inpots treated with the highest OMW application rate. On day78, laccase gene copies increased in all the treatments and thehighest numbers were assessed in soils treated with 84 and168 m3/ha of OMW. A similar influence was also evident onday 92, while laccase gene copies slightly declined (Fig. 5b).
OMW stimulated phenol oxidase activity immediately af-ter its application to the soil (Fig. 6a). The activity of phenoloxidase peaked off on days 3 and 6, while a gradual decreasetook place from day 9 and onwards (Fig. 6a). By contrast,OMW did not affect peroxidase activity on day 1; neverthe-less, it increased and, similarly to phenol oxidase, peaked off
Day 1 Day 6 Day 18 Day 290
5
10
15
20
25
30
35
b
cc
a
aa
bb
c
bb
a
Control
42 m 3ha-1
84 m 3ha-1
168 m 3ha-1
Pro
teas
e (m
g ty
rosi
ne g
-1 s
oil 2
h-1)
(a)
Day 1 Day 6 Day 18 Day 290.0
0.5
1.0
1.5
2.0
2.5
3.0
3.5
bb
aba
b-gl
ucos
amin
idas
e (g
p-n
itro
phen
ol g-1
soi
l h-1)
(b)
Day 1 Day 6 Day 18 Day 290.0
0.2
0.4
0.6
0.8
1.0
1.2
1.4
cbcb
a
bbb
a
bb
aa
dc
b
a
Ure
ase (
mg
NH
+ 4-N g
-1 s
oil 2
h-1)
(c)
Fig. 4 Effect of OMW hydraulic loading on soil enzyme activities; aprotease activity; b β-glucosaminidase activity; and c urease activity(±SE; n=3).Different letters denote significant differences among means(p <0.05)
0 10 20 30 40 50 60 70 80 900
100
200
300
400
500
600
700
800
d
c
b
a
d
cb
a
c
b
a
a
cdd
b
a
cc
bb
(a)
Ph
eno
ls (
mg
gal
lic a
cid
kg
-1 s
oil
d.w
.)
Days
Control 42 m3 ha-1
84 m3 ha-1
168 m3 ha-1
Day 3 Day 9 Day 18 Day 46 Day 78 Day 92104
105
106
107
108
(b)
bababa b
bb
a
b
aba a
cbc
ab
Lac
case
gen
e co
pie
s g
-1so
il d
.w.
Control42 m3ha-1
84 m3ha-1
168 m3ha-1
a
Fig. 5 Effect of OMW hydraulic loading on a soil phenol content and bon the laccase gene copies (±SE; n =3) throughout the study period.Different letters denote significant differences among means (p<0.05)
Appl Microbiol Biotechnol

on days 3 and 6, especially in the treatments received thehigher rates of OMW (Fig. 6b). Subsequently, the activity ofperoxidase declined at levels similar to those of the non-treated soil. Increased activity of peroxidase was again mea-sured in pots treated with the highest rate of OMWon day 78(Fig. 6b).
Soil TKN, NH4+-N and NO3
−-N content, and PNR
Application of OMW increased soil TKN content, whichremained constant until day 78 (Fig. 7), when a gradualdecline started in OMW-treated soils. This decline resultedeventually in lower TKN content in OMW-treated soils at theend of the study compared to their initial values. The observeddecline was proportional to the OMWapplication rate (Fig. 7).
Application of OMW resulted in a dose-response increasein soil NH4
+-N content (Fig. 8a). Soil NH4+-N content con-
tinued to increase in OMW-treated pots until day 9, the pointin time that approached its highest values (Fig. 8a). Then, soilNH4
+-N content decreased sharply and maintained more orless constant until day 46 when a slight, but statisticallysignificant, increase took place in all the treatments exceptthat treated with the highest load of OMW (Fig. 8a). Anopposite trend was observed for soil NO3
−-N which decreased
immediately after OMWapplication in a dose–response man-ner (Fig. 8b). The decrease of NO3
−-N content continued in allthe treatments up to day 13 and then remained relativelyconstant till the end of the study (Fig. 8b).
PNR were higher in pots treated with 42 and 84 m3/haOMW than the non-amended soil on days 3, 6, 18, and 48(Fig. 9). By contrast, PNR decreased up to 50 % in soilstreated with the highest OMW dose on day 3. Then, it recov-ered to levels similar to those of the non-amended soil and
1 days 3 days 6 days 9 days 18 days 46 days 78 days0.00
0.05
0.10
0.15
0.20
0.25
0.30
c
b
a
d
d
c
b
c
c
b
aa
a
b
c
cd
c
b
aa
b
c
dc
b
aa
Ph
eno
l Oxi
das
e ac
tivi
ty (
mo
l g-1 h
-1)
Control
42 m3/ha
84 m3/ha
168 m3/ha
1 days 3 days 6 days 9 days 18 days 46 days 78 days0.000
0.025
0.050
0.075
0.100
0.125
0.150
cc
b
a
c
bb
a
b
b
b
a
Per
oxi
ade
acti
vity
(m
ol g
-1 h
-1)
µµ
Fig. 6 Effect of OMW hydraulic loading on a soil phenol oxidase and bon the peroxidase activity (±SE; n =3) throughout the study period.Different letters denote significant differences among means (p<0.05)
Day 1 Day 6 Day 29 Day 78 Day 920.00
0.02
0.04
0.06
0.08
0.10
0.12
0.14
0.16
0.18
0.20
0.22
b b aa
ab
bcc
bcb
a
cb
aba
cc
a
b
So
il T
KN
co
nte
nt
(% d
.w.)
Control
42 m3
/ha
84 m3
/ha
168 m3
/ha
bc
Fig. 7 TKN content (±SE; n =3) in soils treated with different OMWapplication rates and in control soil throughout the study period.Differentletters denote significant differences among means (p<0.05)
0 10 20 30 40 50 60 70 80 90 1000
2
4
6
8
10
12
14
16
0 10 20 30 40 50 60 70 80 90 1000
20
40
60
80
100
120
140
d
c
b
a
c
b
d
c
b
a
b
cb
a
a
c
b
a
a
b
a
a
b
c
c
c
b
a
NH
4+ -N (
mg
kg
-1d
ry s
oil
)
Control
42 m3ha-1
84 m3ha-1
168 m3ha-1
(a)
bc bc
b
c
c
b
b
a
a
cbcbb
cc
b
c
bc
d
b
b
b
aaa
aa
aa
(b)
NO
- 3-N
(m
g k
g-1
dry
so
il)
Days
Fig. 8 Inorganic N contents in soils treated with the different OMWapplication rates and in control soil; a variations of NH4
+-N and bvariations of NO3-N (±SE; n =3) throughout the study period. Differentletters denote significant differences among means (p<0.05)
Appl Microbiol Biotechnol

maintained relatively constant until day 18. A further increasein the PNR occurred in this treatment, which eventuallyexceeded the increase of the non-treated soils in the followingsamplings (Fig. 9). In the last two samplings (days 78 and 92)however, PNR declined in all the treatments compared to thevalues prevailed early in the application period. Especially onday 78, lower PNR were measured in soils treated with 84 and168 m3/ha of OMW compared to the non-amended soils andthose amended with the lowest OMW dose (Fig. 9).
Ammonia oxidizing and denitrifying gene copy numbers
amoA gene copies of AOA and AOB decreased immedi-ately after OMW application to the soil (day 3) (Fig. 10a,b). Then, amoA gene copies in OMW-treated soils recov-ered to levels similar to these of the non-treated soil (day18) (Fig. 10a, b). On days 46 and 78, higher amoA genecopy numbers of AOA and AOB amoA gene copies wereassessed in the OMW-treated soils compared to the non-treated (Fig. 10a, b). Pearson analysis revealed a positiverelationship (r , 0.765; p <0.001) between AOB and AOAamoA gene copies (Table 3). Furthermore, both AOA andAOB showed a weak relationship with soil NH4
+-N con-tent (r , 0.313; p , 0.041 for AOB and r , 0.301; p , 0.048 forAOA). No relationships were found between either groupof ammonia oxidizers and soil NO3
−-N content or PNR.Overall, denitrifying genes (nirK , nirS , nosZ ) followed apattern quite similar to that of amoA genes, but significantdifferences between OMW-treated and non-treated soilswere detected earlier (day 18) (Fig. 11). Gene copies ofnirK were approximately 1 order of magnitude greater thanthese of nirS and nosZ (Fig. 11). Strong correlations wereestablished between AOA and AOB, ammonia oxidizers(AOA and AOB) and denitrifying genes (nirS , nirK ,nosZ ), and among denitrifying genes (Table 3).
Discussion
Application of OMW stimulated respiration consistent withearlier studies (Piotrowska et al. 2006; Sierra et al. 2007).Following the application of organic amendments to the soil,respiration rates were among the highest reported in the liter-ature (Busby et al. 2007; Khalil et al. 2005), an effect attributedto the presence of high concentrations of labile organic-C inOMW (Niaounakis and Halvadakis 2006). Although the in-crease in respiration rate was not proportional to hydraulicloading (Fig. 2a), this response does not imply a toxic effect,since it is a typical response to the increasing rate of substrate(Huang and Chen 2009; Sierra et al. 2007). Issues related to theaccessibility of organic compounds by microorganisms, soilproperties, and/or the diffusion of O2 have been suggested tocontribute to this effect (Busby et al. 2007; Khalil et al. 2005).In addition, the low N availability induced by N-immobilizationmay have contributed (Huang andChen 2009).
Cumulative respiration from OMW-treated pots was con-sistent with the pattern of SOM decline. SOM remainedconstant in the pots treated with 42 and 84 m3/ha OMWafterday 29 at levels similar to those of the non-amended soil.
Day 3 Day 6 Day 9 Day 18 Day 46 Day 78 Day 920.0
0.5
1.0
1.5
2.0
2.5
3.0
bb
aba
c
a
bb
b
ab
a
b
b
a
a
b
c
ba
PN
R (
mg
N k
g-1dr
y so
il h-1
) Control
42 m3ha-1
84 m3ha-1
168 m3ha-1a
Fig. 9 Potential nitrification rates (±SE; n =3) in OMW treated andcontrol soils throughout the study period. Different letters denote signif-icant differences among means (p <0.05)
Day 3 Day 9 Day 18 Day 46 Day 78 Day 92106
107
108
109
cbc
b
a
aba a
b
c
b
aa
b
Control
42 m3ha-1
84 m3ha-1
168 m3ha-1
AO
B a
mo
A g
ene
cop
ies
g-1
soil
d.w
.
Day 3 Day 9 Day 18 Day 46 Day 78 Day 92106
107
108
109
c
bab a
cb a
a
abbba
cb
aba
bba
(a)
AO
A a
mo
A g
ene
cop
ies
g-1
soil
d.w
.
(b)
Fig. 10 Variation of amoA gene copies of: a AOB and b AOA (±SE; n =3) in OMW treated and control soil throughout the study period.Differentletters denote significant differences among means (p<0.05)
Appl Microbiol Biotechnol

Taking into account the longer turnover time of recalci-trant organic compounds found in OMW, for instancecellulose and lignin, and the presence of a significantportion of phenolic compounds (=50 %; Fig. 5a), the
findings of the present study provide evidence thatOMW, especially at the rates of 42 and 84 m3/ha, stim-ulated a priming effect. The increase in the activity ofenzymes involved in the degradation of recalcitrant or-ganic compounds, akin to proteases and β-glycosidaselate in the application period, provides further support.
Phenolic compounds decreased rapidly, up to 50 %, in thefirst 2 weeks following OMW application, but afterwardsremained constant (Fig. 5) suggesting their adsorption to thesoil matrix and/or SOM. A similar removal pattern of solublephenols has been reported (Sierra et al. 2007). Similarly,phenolic compounds decreased up to 45 % within 3 weeksafter OMW application (Saadi et al. 2007). These findingssuggest that biodegradation and adsorption contributed ap-proximately equally to phenol removal independently of theapplication rate (Fig. 5a). Various enzymes regulate theturnover of phenols, with phenol oxidases and peroxidasesto have a dominant role (Sinsabaugh 2010). Although agreater activity of phenol oxidases and peroxidases wasmeasured on days 3 and 6, a time that the decrease of soilphenol content started, enzyme activities could not fullyexplain the removal pattern of phenols (Fig 5a). Likewise,the abundance of laccase gene copies, which encode for thelargest class of phenol oxidases in the soil (Sinsabaugh2010), did not change during the period of phenol decrease(day 3 to 18). No correlation between laccase gene abun-dance and phenol oxidase activity has been also reported inprevious studies (Lauber et al. 2009). Laccases are involvedin the transformation of a wide range of substrates, includingmono-, oligo-, and poly-phenols and aromatic amines, mak-ing the association of abundance patterns with their functiona challenging task. The increase in laccase gene abundancelate in the study period may be linked to lignin degradationthat started when the labile C reserves were depleted, or itmight be the result of competition between microbes for theavailable resources, for instance N. Previous work has pro-vided evidence for an increase in the fungi/bacteria ratio withOMW application that was linked to the biodegradation ofrecalcitrant compounds found in OMW (Mekki et al. 2006).A stimulation of fungi growth, especially of basidiomycetes,which contain multiple laccase gene copies (Theuerl andBuscot 2010) may be responsible for this increase.
Table 3 Correlations betweendenitrifying (nirK , nirS , andnosZ), amoA (AOA, AOB), andlaccase gene copy numbers
Asterisks indicate significantdifferences *p<0.05; **p<0.01;***p<0.001
amoA AOA amoA AOB nirK nirS nosZ Gene Laccase
amoA AOA 1 0.765** 0.620** 0.609** 0.631** 0.873**
amoA AOB 0.765** 1 0.842** 0.894** 0.902** 0.801**
nirK 0.620** 0.842** 1 0.940** 0.954** 0.686**
nirS 0.609** 0.894** 0.940** 1 0.992** 0.593**
nosZ 0.631** 0.902** 0.954** 0.992** 1 0.628**
laccase 0.873** 0.801** 0.686** 0.593** 0.628** 1
Day 3 Day 9 Day 18 Day 46 Day 78 Day 92104
105
106
107
108
109
a a
cbcab
a
b
aa
bbaaa
cbc
aba
Control
42 m3ha-1
84 m3ha-1
168 m3ha-1
nir
K g
ene
cop
ies
g-1
soil
d.w
. (a)
Day 3 Day 9 Day 18 Day 46 Day 78 Day 92104
105
106
107
108
bab
aab
cbaaa
bbbaa
(b)
nir
S g
ene
cop
ies
g-1
soil
d.w
.
Day 3 Day 9 Day 18 Day 46 Day 78 Day 92104
105
106
107
108
bab a a
ab ba a
abb
abbb a
b
aaaa b
no
sZ g
ene
cop
ies
g-1
soil
d.w
. (c)
Fig. 11 Variation of: a nirK ; b nirS; and c nosZ gene copies (±SE; n =3)throughout the study period in OMW treated and control soil throughoutthe study period. Different letters denote significant differences amongmeans (p <0.05)
Appl Microbiol Biotechnol

Soil NH4+-N increased immediately after OMW applica-
tion, mainly due to the mineralization of easily degradedorganic compounds; this effect is consistent with the greateractivity of urease during this period. Thereafter, although soilNH4
+-N content decreased sharply and was not followed by acorresponding increase of NO3
−-N indicating N immobiliza-tion stimulated by the supply of organic substrate and its highC/N ratio (Niaounakis and Halvadakis 2006). The negative Nmineralization rates measured on day 3 and the lower miner-alization rates compared to the non-amended soil measured ondays 9 and 18 (data not shown) provided further support forthe occurrence of N immobilization. On day 46, the slightincrease in soil NH4
+-N in the soils treated with 42 and84 m3/ha OMW provides evidence that N immobilizationhas been, at least partially, reversed. This hypothesis is consis-tent with the recovery of amoA gene copies of AOA and AOBwith OMW application rate (Fig. 10). Thus, the repressedamoA gene copies by day 46 could be attributed to the antag-onism between ammonia oxidizers and heterotrophs ratherthan to a toxic effect of OMW.
After day 46, both AOA and AOB amoA gene copynumbers increased providing evidence that both groups areinvolved in ammonia oxidation. This finding agrees withobservations which indicate that AOA have a great contribu-tion in ammonia oxidation, when it is released by organicsubstrates (Levicnik-Hofferle et al. 2012; Stopnisek et al.2010). The slow release of NH4
+-N in this study, due to thecombined effect of N mineralization and immobilization, mayhave stimulated the response of AOA.
Soil NO3−-N content decreased rapidly with the increase of
the OMW application rate, in agreement with previous find-ings (Sierra et al. 2007), an effect attributed to N immobiliza-tion. However, the recovery of amoA gene copy numbers wasnot accompanied by a corresponding increase in soil NO3
−-Ncontent (Fig. 8); an influence that could be attributed to lossesby denitrification. Amending soil with organic substrates hasbeen found to stimulate denitrification (Ishikawa et al. 2013).Such a hypothesis is in agreement with the TKN pattern whichsupports losses of N from day 78 onwards proportional toOMWapplication rate (Fig. 7) and the increase in denitrifyinggenes. Accordingly, it can be concluded that the repressednumbers of denitrifiers early in study were attributed to thelow NO3
−-N availability rather than to a toxic effect of OMW.Pearson correlations support this assumption by revealingstrong relationships between amoA gene copies of AOA andAOB and denitrifying genes (Table 3) consistent with previ-ous findings (Paranychianakis et al. 2013).
The findings of the present study suggest that application ofOMW to the soil, even at rates approaching soil’s maximumWHC does not cause toxicity on soil functional communityregulating the C and N cycling. Soil was characterized bygreat potential for C assimilation and phenols removal due tothe degradation and adsorption. OMW, however, strongly
disrupted N cycling. Of particular importance were (1) theshort-term immobilization of N that retarded nitrification thefirst days following OMWapplication and (2) the losses of Nthrough denitrification which increased with application rate.These findings necessitate the need for further research tooptimize N availability to the crops and to mitigate environ-mental effects that may arise from potential N2O emissions.Metagenomic approaches coupled with stable isotope probingwill provide insights on the functional microbial communityinvolved in the C and N cycling, as well as on the processrates. Land application of OMW can be considered as a low-cost and efficient treatment alternative to conventional treat-ment methods and consistent with the agro-ecological princi-ple of nutrient recycling.
References
Bodini SF, Cicalini AR, Santori F (2011) Rhizosphere dynamics duringphytoremediation of olive mill wastewater. Bioresour Technol 102:4383–4389
Bouyoucos GJ (1962) Hydrometer method improved for making particleand size analysis of soils. Agron J 54:464–465
Busby RR, Allen Torbert H, Gebhart DL (2007) Carbon and nitrogenmineralization of non-composted and composted municipal solidwaste in sandy soils. nirS, nirK and nosZ genes for communitysurveys of denitrifying bacteria. Soil Biol Biochem 39:1277–1283
Cabrera F, López R, Martinez-Bordiú A, De Dupuy LE, Murillo JM(1996) Land treatment of olive oil mill wastewater. Int BiodeterBiodegrad 38:215–225
Casa R, D’Annibale A, Pieruccetti F, Stazi SR, Giovannozzi SermanniG, Lo Cascio B (2003) Reduction of the phenolic components inolive-mill wastewater by an enzymatic treatment and its impact ondurum wheat (Triticum durum Desf.) germinability. Chemosphere50:959–966
Di Serio MG, Lanza B, Mucciarella MR, Russi F, Iannucci E, Marfisi P,Madeo A (2008) Effects of olive mill wastewater spreading on thephysico-chemical and microbiological characteristics of soil. IntBiodeter Biodegrad 62:403–407
Francis CA, Roberts KJ, Beman JM, Santoro AE, Oakley BB (2005)Ubiquity and diversity of ammonia-oxidizing archaea in water col-umns and sediments of the ocean. Proc Natl Acad Sci USA 102:14683–14688
Henry S, Baudoin E, López-Gutiérrez JC, Martin-Laurent F, BraumanA, Philippot L (2004) Quantification of denitrifying bacteria insoils by nirK gene targeted real-time PCR. J Microbiol Meth 59:327–335
Henry S, Bru D, Stres B, Hallet S, Philippot L (2006) Quantitativedetection of the nosZ gene, encoding nitrous oxide reductase, andcomparison of the abundances of 16S rRNA, narG, nirK, and nosZgenes in soils. Appl Environ Microbiol 72:5181–5189
Huang C-C, Chen Z-S (2009) Carbon and nitrogen mineralization ofsewage sludge compost in soils with a different initial pH. Soil SciPlant Nutr 55:715–724
Ishikawa K, Ohmori T, Miyamoto H, Ito T, Kumagai Y, Sonoda M,Matsumoto J, Miyamoto H, Kodama H (2013) Denitrification insoil amended with thermophile-fermented compost suppressesnitrate accumulation in plants. Appl Microbiol Biotechnol 97:1349–1359
Appl Microbiol Biotechnol

Kandeler E, GerberH (1988) Short-term assay of soil urease activity usingcolorimetric determination of ammonium. Biol Fertil Soils 6:68–72
Kapellakis IE, Paranychianakis NV, Tsagarakis KP, Angelakis AN (2012)Treatment of olivemill wastewater with constructedwetlands.Water4:260–271
Karpouzas DG, Rousidou C, Papadopoulou KK, Bekris F, Zervakis GI,Singh BK, Ehaliotis C (2009) Effect of continuous olive mill waste-water applications, in the presence and absence of nitrogen fertili-zation, on the structure of rhizosphere-soil fungal communities.FEMS Microbiol Ecol 70:388–401
Karpouzas DG, Ntougias S, Iskidou E, Rousidou C, Papadopoulou KK,Zervakis GI, Ehaliotis C (2010) Olive mill wastewater affects thestructure of soil bacterial communities. Appl Soil Ecol 45:101–111
Khalil MI, Hossain MB, Schmidhalter U (2005) Carbon and nitrogenmineralization in different upland soils of the subtropics treated withorganic materials. Soil Biol Biochem 37:1507–1518
Ladd JN, Butler JHA (1972) Short-term assays of soil proteolytic enzymeactivities using proteins and dipeptide derivatives as substrates. SoilBiol Biochem 4:19–30
Lauber CL, Sinsabaugh RL, Zak DR (2009) Laccase gene compositionand relative abundance in oak forest soil is not affected by short-termnitrogen fertilization. Microb Ecol 57:50–57
Levicnik-Hofferle S, Nicol GW, Ausec L, Mandic-Mulec I, Prosser JI(2012) Stimulation of thaumarchaeal ammonia oxidation by ammo-nia derived from organic nitrogen but not added inorganic nitrogen.FEMS Microbiol Ecol 80:114–123
Li X, Han S, Guo Z, Shao D, Xin L (2010) Changes in soil microbialbiomass carbon and enzyme activities under elevated CO2 affectfine root decomposition processes in a Mongolian oak ecosystem.Soil Biol Biochem 42:1101–1107
Mahmoud M, Janssen M, Haboub N, Nassour A, Lennartz B (2010) Theimpact of olive mill wastewater application on flow and transportproperties in soils. Soil Till Res 107:36–41
Mantzavinos D, Kalogerakis N (2005) Treatment of olive mill effluents:Part I. Organic matter degradation by chemical and biological pro-cesses—an overview. Environ Int 31:289–295
Mekki A, Dhouib A, Sayadi S (2006) Changes in microbial and soilproperties following amendment with treated and untreated olivemill wastewater. Microbiol Res 161:93–101
Montemurro F, Mariangela D, Vitti C, Ferri D (2011) Potential use ofolive mill wastewater as amendment: crops yield and soil propertiesassessment. Commun Soil Sci Plant Anal 42:2594–2603
Niaounakis M, Halvadakis CP (2006) Olive processing waste manage-ment, volume 5, (2nd edn) Literature Review and Patent Survey,Elsevier, Oxford. ISBN: 9780080448510, p 514
Ntougias S, Baldrian P, Ehaliotis C, Nerud F, Antoniou T, Merhautová V,Zervakis GI (2012) Biodegradation and detoxification of olive millwastewater by selected strains of the mushroom generaGanodermaand Pleurotus. Chemosphere 88:620–626
Paranychianakis NV, Tsiknia M, Giannakis G, Nikolaidis NP,Kalogerakis N (2013) Nitrogen cycling and relationships betweenammonia oxidizers and denitrifiers in a clay–loam soil. ApplMicrobiol Biotechnol 97:5507–5515
Parham JA, Deng SP (2000) Detection, quantification and characteriza-tion of β-glucosaminidase activity in soil. Soil Biol Biochem 32:1183–1190
Petersen DG, Blazewicz SJ, Firestone M, Herman DJ, Turetsky M,Waldrop M (2012) Abundance of microbial genes associatedwith nitrogen cycling as indices of biogeochemical process ratesacross a vegetation gradient in Alaska. Environ Microbiol 14:993–1008
Piotrowska A, Iamarino G, Rao MA, Gianfreda L (2006) Short-termeffects of olive mill waste water (OMW) on chemical and biochem-ical properties of a semiarid Mediterranean soil. Soil Biol Biochem38:600–610
Piotrowska A, Rao MA, Scotti R, Gianfreda L (2011) Changes in soilchemical and biochemical properties following amendment withcrude and dephenolized olive mill waste water (OMW). Geoderma161:8–17
Prosser JI (2011) Soil nitrifiers and nitrification. In: Ward et al. (eds)Nitrification. ASM, Washington, DC, pp. 347–381
Rotthauwe JH, Witzel KP, Liesack W (1997) The ammoniamonooxygenase structural gene amoA as a functional marker: mo-lecular fine-scale analysis of natural ammonia-oxidizing popula-tions. Appl Environ Microbiol 63:4704–4712
Saadi I, Laor Y, Raviv M, Medina S (2007) Land spreading of olive millwastewater: effects on soil microbial activity and potential phyto-toxicity. Chemosphere 66:75–83
Schimel J, Schaeffer SM (2012) Microbial control over carbon cycling insoil. Front Microbiol 3:348
Sierra J, Martí E, Garau MA, Cruañas R (2007) Effects of the agronomicuse of olive oil mill wastewater: field experiment. Sci Total Environ378:90–94
Sinsabaugh RL (2010) Phenol oxidase, peroxidase and organic matterdynamics of soil. Soil Biol Biochem 42:391–404
Sinsabaugh RL, Saiya-Cork K, Long T, OsgoodMP, Neher DA, Zak DR,Norby RJ (2003) Soil microbial activity in a Liquidambar plantationunresponsive to CO2-driven increases in primary production. ApplSoil Ecol 24:263–271
Smolders E, Brans K, Coppens F, Merckx R (2001) Potential nitrificationrate as a tool for screening toxicity in metal-contaminated soils.Environl Toxicol Chem 20:2469–2474
Stopnisek N, Gubry-Rangin C, Hofferle S, Nicol GW, Mandic-Mulec I,Prosser JI (2010) Thaumarchaeal ammonia oxidation in an acidicforest peat soil is not influenced by ammonium amendment. ApplEnviron Microbiol 76:7626–7634
Theuerl S, Buscot F (2010) Laccases: toward disentangling their diversityand functions in relation to soil organic matter cycling. Biol FertSoils 46:215–225
Throbäck IN, Enwall K, Jarvis Å, Hallin S (2004) Reassessing PCRprimers targeting nirS, nirK and nosZ genes for communitysurveys of denitrifying bacteria with DGGE. FEMS MicrobiolEcol 49:401–417
Yamamoto N, Asano R, Yoshii H, Otawa K, Nakai Y (2011) Archaealcommunity dynamics and detection of ammonia-oxidizing ar-chaea during composting of cattle manure using culture-independent DNA analysis. Appl Microbiol Biotechnol 90:1501–1510
Zibilske LM (1994) Carbon mineralization. In: Weaver RW, Angle S,Bottomley P, Bezdicek D, Smith S (eds) Methods of soil analysis:microbiological and biochemical properties. Soil Science Society ofAmerica, Madison, pp 835–859
Appl Microbiol Biotechnol