effects of long-term soil acidification due to nitrogen fertilizer inputs in wisconsin
TRANSCRIPT
Plant and Soil 197: 61–69, 1997. 61c 1997 Kluwer Academic Publishers. Printed in the Netherlands.
Effects of long-term soil acidification due to nitrogen fertilizer inputsin Wisconsin
Phillip Barak1, Babou O. Jobe2, Armand R. Krueger3, Lloyd A. Peterson3 and David A. Laird4
1Dep. of Soil Science, Univ. of Wisconsin-Madison, 1525 Observatory Dr., Madison, WI 53706-1299, USA�,2National Agricultural Research Institute, Yundum, The Gambia, 3Dep. of Horiculture, Univ. of Wisconsin-Madison, 1575 Linden Dr., Madison, WI 53706-1299, USA and 4USDA-National Soil Tilth Laboratory, Ames, IA,USA
Received 6 January 1997. Accepted in revised form 28 August 1997
Key words: acidity, cation exchange capacity, exchangeable acidity, N fertilizers, organic anions
Abstract
Agroecosystems are domesticated ecosystems intermediate between natural ecosystems and fabricated ecosystems,and occupy nearly one-third of the land areas of the earth. Chemical perturbations as a result of human activityare particularly likely in agroecosystems because of the intensity of that activity, which include nutrient inputsintended to supplement native nutrient pools and to support greater biomass production and removal. At a long-termfertility trial in South-Central Wisconsin, USA, significant increases in exchangeable acidity were accompanied bydecreases in cation exchange capacity (CEC), base saturation, and exchangeable Ca2+ and Mg2+ with application ofammoniacal N fertilizer. Plant analysis shows that a considerable portion of the alkalinity generated by assimilationof N (and to a lesser extent by S) is sequestered in the above-ground plant parts as organic anions and is not returnedto the soil if harvested. Elemental analysis of Ca-saturated soil clays indicates an loss of 16% of the CEC of the soilclay and minor increases in Fe and Al. The reversibility of these changes due to prolonged acidification is doubtfulif the changes are due to soil weathering.
Introduction
Agricultural activities have become the dominant eco-logical force over nearly one-third of the land areas ofthe earth (Cox and Atkins, 1979). Agroecosystems dif-fer from natural systems in the auxiliary energy sourcesto enhance productivity, leading to high fluxes of inputsand outputs, and in the external, goal-oriented controlrather than internal control via subsystem feedback(Odum, 1984). Key to the modern agroecosystem isnutrient inputs intended to supplement native nutrientpools and to support greater biomass production andremoval.
Almost none of the fertilizer materials in commonusage is acidic, with the exception of sulfuric and phos-phoric acids, which are a very small part of total fer-tilizer consumption in the USA (Meister, 1995). Many
� FAX No: 6082652595. E-mail:[email protected]
nutrient inputs, however, are themselves acid-forming,a fact recognized by the pioneering work of the soil sci-entist W H Pierre in 1933 and codified in the Associa-tion of Official Analytical Chemists (AOAC) Method936.01 for determining the acid-forming or non-acidforming quality of fertilizers. The most important acid-forming reaction for fertilizers is microbial oxidationof ammoniacal fertilizers, which may themselves bestrong bases, by the following reactions:
NH3 + 2O2 = H+ +NO�
3 +H2O
(nitrification of ammonia) (1)
NH4NO3 + 2O2 = 2H+ + 2NO�
3 +H2O
(nitrification of ammonium) (2)
CO(NH2)2 + 4O2 = 2H+ + 2NO�
3 +H2O + CO2
(hydrolysis of urea and nitrification of products) (3)
JS: PIPS No. 148995 BIO2KAP
*148995* plso7005.tex; 24/11/1997; 9:29; v.7; p.1
62
The materials above are the most common syntheticN inputs to agroecosystems, either as single or mixedNPK fertilizers, and will oxidize to the equivalent ofnitric acid under the well-drained, aerobic conditionsof most dryland agricultural soils.
Interestingly, the assimilation of nitrate-N andsulfate-S to their organic forms (Norg and Sorg, respec-tively), both consume protons, i.e., generate alkalinity,by the reactions:
R �OH +NO�
3 +H+ = R �NH2 + 2O2 (4)
R �OH + SO2�4 + 2H+ = R � SH + 2O2 +H2O
(5)
Although uptake and assimilation of nitrate and sulfatecause release of alkalinity from the root, some of thealkalinity generated is retained in the shoot as organicanions. The total concentration of organic anions inplant tissue may either be measured as ash alkalinityor excess base (Pierre and Banwart, 1973) or calculat-ed from chemical analysis of plant tissue, with eithermeasurements or assumptions regarding the concen-trations of NO3–N and SO4–S in the plant tissue (vanBeusichem et al., 1988).
Uptake and assimilation of nitrate by biota, bothplants and microorganisms, is, from a redox and protonproduction point of view, opposite in direction and isthe reverse of the process of nitrification, althoughseparated temporally and spatially. The net reaction ofammoniacal N addition, nitrification, and subsequentnitrate uptake and assimilation by biota is acid/baseneutral:
[NH4NO3; 2NH3; CO(NH2)2] + 2R � OH
= 2R �NH2 +H2O(+2O2)(+CO2) (6)
From this perspective, soil acidification due to nitrifi-cation of N inputs is not directly caused by N inputsthemselves but rather: (i) N inputs greater than thoseassimilated by biota and stored either in biota or soilorganic matter, and (ii) incomplete return to soil of thealkalinity of organic anions.
Other acid/base reactions involving the N cycle aredenitrification, which consumes protons, and ammo-nia volatilization, which generates one proton for eachcation reacting. It should be noted that reactions caus-ing soil acidification and alkalinization, other thannitrification and assimilation of N, are known (VanBreeman et al., 1983). The most significant of theseare redox changes, most notably with metals such as
Fe and Mn. However, these processes will generally beof small magnitude in well-drained, well-aerated soilscompared to redox reactions of N added as fertilizers.
Materials and methods
Site and experimental design
A long-term fertility experiment was laid out in 1962by Dr Lloyd A Peterson at the Arlington AgriculturalResearch Station, located in south central Wisconsin(43�180 N, 89�210 W, 791 mm annual precipitation).The soil is classified as Plano silt loam (formally knownas Parr silt loam), a fine, silty, mixed, mesic Typ-ic Argiuoll. The soil formed under prairie grasses inloess and is level and well-drained to moderately well-drained at the experimental site. The fine silt fractioncontains moderate amounts of feldspar, quartz, andmica. The clay fraction is predominantly interstrati-fied smectite-illite in the fine <0.06 �m fraction, withinterstratified smectite-illite, kaolinite, quartz and illitein the 0.06 �m to 2 �m fraction (Liu, 1995). In 1962,the soils at the site had pH values (in water) from 6.5to 7.0 and 3.0 to 3.5% organic matter (Peterson andKrueger, 1980).
The fertilizer treatments were: (1) four levels ofN (0, 56, 112, and 168 kg N ha�1) as either ureaor ammonium nitrate, (2) four levels of K (0, 84,168, and 252 kg K ha�1) as either KCl or K2SO4,and (3) four levels of P (0, 45, 90, and 135 kg Pha�1) as triple superphosphate (20% P). The designwas a 4�4�4 duplicated split-strip factorial arrange-ment with N assigned to main plots, K to subplots,and P to 6.4 m � 10.8 m sub-subplots. The originalintent was to evaluate the response of crops to differentsoil fertility levels established and maintained by var-ious fertilizer application rates. The original fertilizertreatments were maintained annually from 1962 until1982, with plots planted to various horticultural crops.After 1982, P and K fertilization was terminated andonly N was applied at the original rates. Between 1982and 1987, the plots were planted to tobacco (Nicotianatabacum L.) and soybean (Glycine max (L.) Merr.),and from 1987 to 1993, sweet corn (Zea mays L.) wasthe test crop. For the 30-yr duration of the experiment,conventional tillage to a depth of 20 cm and removalof above-ground crop residues after harvest was con-tinued.
plso7005.tex; 24/11/1997; 9:29; v.7; p.2
63
Soil and clay analyses
In 1993, soil samples from each of the 128 6.4 m �
10.8 m plots in the experiment were collected as nine2.5-cm soil cores to a depth of 20 cm, composited, andhomogenized. One set of subsamples was maintainedat field-moist conditions under 4 �C storage for anal-ysis. The chemical properties measured included pHin a 1:1 soil:water slurry, exchangeable Ca, Mg, Na,and K by displacement with 1 M ammonium acetate(pH 7) and measurement by atomic absorption spec-troscopy (Ca and Mg) and by flame photometry (Kand Na), exchangeable acidity by displacement by 1M KCl (McLean, 1982) followed by automatic titra-tion to pH 8.2 by the procedure of Barak et al. (1996),and exchangeable ammonium by displacement by 2 MKCl and Kjeldahl distillation (Liu et al., 1997). In addi-tion, pH was measured in the 1 M KCl extracts beforetitration. Soil concentrations of C and N and isotopicabundances of 13C and 15N were measured with a CarloErba NA 1500 series II carbon/nitrogen analyzer andEuropa mass spectrometer. Cation exchange capacity(CEC) was determined by summation of exchangeablebase cations (including ammonium, i.e., Ca2+, Mg2+,Na+, K+, and NH+4 ) and exchangeable acidity (Sumn-er and Miller, 1996). Soil chemistry data was subjectedto analysis of variance (ANOVA) by SAS using a strip-split model (Steel and Torrie, 1980). Following meancomparison tests, differences greater than least signif-icant differences (LSD) at the 5% level were reportedas significant.
A detailed chemical analysis of the clay fraction(<2 �m) of two adjacent plots, one of which receivedno N fertilizer and the other 168 kg N ha�1 yr�1
for 30 yr, was conducted. The clay fraction was dis-persed by the method of Edwards and Bremner (1965)using a Na-saturated cation exchange membrane (CR67 HMR-412, Ionics, Inc; Watertown, MA) and sepa-rated by sedimentation and decantation. The clay frac-tions were rinsed free of excess salt with deionizedwater and centrifugation, saturated three times with0.1 M Ca(NO3)2 for a total fiftyfold excess of Ca2+,freeze-dried, and analyzed using suspension nebuliza-tion ICP-AES (Laird et al., 1991b). Calcium concen-trations by this method are interpreted as equivalent toCEC determined using Ca2+ as the index cation. Clayextractions were performed in duplicate and reportedelemental analyses were replicates of four determina-tions.
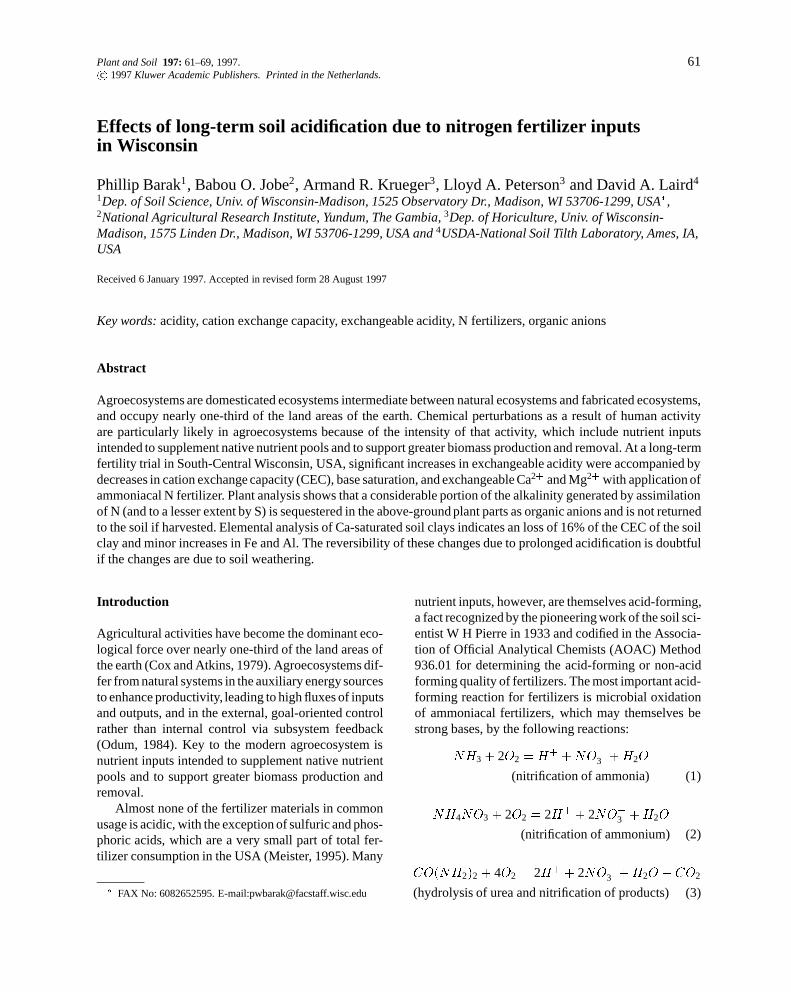
Figure 1. Relationship between pH measured in water (1:1) andin 1 M KCl for samples from 30-yr fertility plots and mean pHvalues for N fertilizer treatments. Ellipse shows standard deviationsof the treatment means. All correlations are highly significant (P <0.0001).
Plant analyses
In 1991, the above-ground biomass of a sweet corncrop in the center row of each plot was harvested 14days past horticultural maturity, leaving 2.3-m marginsat either end. The plant material was chopped, homog-enized, subsampled, dried at 60 �C, ground to pass40-mesh, and analyzed for N by Kjeldahl digestionand distillation and for Ca, Mg, K, P, and S by ICP-AES. Organic anion accumulation, equal to the excessof non-metabolized cations minus the non-metabolizedanions (i.e., the excess positive charge that must be bal-anced by organic anion charge within the plant), wascalculated from plant analyses by the method of vanBeusichem et al. (1988), with the assumptions thatall plant N was organic N derived from nitrate andthe molar ratio of Sorg/Norg was 0.032 (Dijkshoorn andWijk, 1967). Net alkalinity generated during the assim-ilation of nitrate and sulfate was calculated from plantanalyses using Equations (4) and (5) using the sameassumptions. Net alkalinity excreted from the roots,calculated as the total anion absorption minus the totalcation absorption on the basis that charge balance wasmaintained across the root-soil interface, must equalnet alkalinity generated minus organic anion accumu-lation.
plso7005.tex; 24/11/1997; 9:29; v.7; p.3

64
Figure 2. Relationship between exchangeable acidity and N fer-tilizer rates in long-term fertility plots. Error bars indicate standarddeviation of the mean. Means indicated by the same letter are not sig-nificantly different at the 5% level by ANOVA. Cubic spline drawnthrough treatment means.
Results
Effect of N fertilizer on pH and exchangeable acidity
A significant effect of application of ammonium nitrateand urea N fertilizers at the long-term fertility trial atArlington, Wisconsin, was soil acidification. Valuesof pH measured in water and 1 M KCl (Figure 1) aresignificantly correlated with each other and with the Nfertilizer rates applied for 30 yr. Mean treatment valuesof pH ranged from 5.6 to 4.8 when measured in waterand from 5.5 to 4.1 when measured in 1 M KCl for 0to 156 kg N ha�1 yr�1 treatments, respectively.
Exchangeable acidity of the Plano soil plots wasstrongly dependent upon the rate of N fertilizationapplied during the course of the 30-yr fertility trials(Figure 2) but in a nonlinear manner. In the absence ofapplied N fertilizer, exchangeable acidity ranged from0.05 to 0.30 cmolc kg�1, averaging 0.12 cmolc kg�1.The difference between the control plots (0 N) and56 kg N ha�1 yr�1 is not statistically significant butexchangeable acidity of the 112 and 168 kg N ha�1
yr�1 treatments averaged 0.48 and 1.58 cmolc kg�1
greater than the control, respectively.Assuming an average bulk density of 1.25 T m�3,
the top 20 cm of soil of the 112 and 168 kg N ha�1
yr�1 treatments contained 12 and 40 kmol(+) ha�1
exchangeableacidity, respectively, which may be com-pared to the 240 and 360 kmol N ha�1 added over thecourse of 30 years. This comparison indicates that 5and 11% of the potential acidity added as ammoniacal
Figure 3. Relationship between exchangeable Ca2+, Mg2+, andK++Na++NH+4 and N fertilizer rate in long-term fertility plots.Mean comparisons are valid for the same measure across treatments.Means indicated by the same letter are not significantly different atthe 5% level by ANOVA.
N fertilizers remained in the top 20-cm as exchange-able acidity.
Effect of N fertilizer on exchangeable base cations,cation exchange capacity and base saturation
The increase in exchangeable acidity associated withN fertilization was not unexpectedly accompanied bya decline in exchangeable base cations (Figure 3). Thedecline was most significant in exchangeable Ca2+,which ranged between 7.40 and 5.11 cmolc kg�1, adecline of 31% associated with the high N fertiliza-tion rate. A similar decline in exchangeable Mg2+,from 3.01 to 1.94 cmolc kg�1, or 36%, was signifi-cant. Individual monovalent cations show statisticallysignificant trends in response to N fertilizer rates, suchas higher exchangeable K in the 0 N treatment, pre-sumably due to reduced biomass removal, and statis-tically higher NH+4 in the 168 kg N ha�1 yr�1 treat-ments, probably due to inhibition of nitrification in themore acidified plots (Liu et al., 1997). However, forthe purposes of this discussion of exchangeable bases,exchangeable K+, Na+ and NH+4 , have been summedand together represent a relatively small fraction of thetotal exchangeable bases, with no statistically signifi-cant response by their sum to N fertilizer levels.
Although exchangeable acidity increased most inthose treatments in which exchangeable base cationswere most depleted, the losses of exchangeable baseswere not entirely offset by the addition of exchange-able acidity. The cation exchange capacity (CEC) of
plso7005.tex; 24/11/1997; 9:29; v.7; p.4

65
Figure 4. Correlation between effective CEC, the sum of exchange-able bases and exchangeable acidity, and N fertilizer rates in 30-yrfertility plots. Error bars indicate standard deviation of the mean.Means indicated by the same letter are not significantly different atthe 5% level by ANOVA.
Figure 5. Relationship between base saturation and N fertilizer ratesin long-term fertility plots. Error bars indicate standard deviation ofthe mean. Means indicated by the same letter are not significantlydifferent at the 5% level by ANOVA. Cubic spline drawn throughtreatment means.
the long-term fertility plots, determined here as the sumof exchangeable base cations and exchangeable acid-ity and sometimes termed effective cation exchangecapacity (ECEC), showed a strong correlation to therate of N fertilizer (Figure 4). Base saturation fell fromnearly 100 to 80% (Figure 5), and would have fallento yet smaller values but for the concomitant declinein CEC.
The mean CEC reduction in this study was 0.015cmolc kg�1 per (kg N ha�1 yr�1
� 30 yr), or 5�10�4
cmolc kg�1 per kg N ha�1 applied over the 30-yr dura-tion of the experiment. The rate of CEC reduction
is therefore below practical detection in a single-yearfield study, but other long-term fertility plots have sim-ilar findings. For example, Blevins et al. (1977) foundthat a Kentucky silt loam (Paleudalf) planted to no-tilland conventional tillage corn lost as much as 4.3 cmolc
kg�1 exchangeable bases, and gained 1.0 cmolc kg�1
exchangeable acidity (and 0.7 cmolc kg�1 Mn) in the0 to 5 cm soil depth, upon fertilization with 336 kg Nha�1 yr�1 as NH4NO3 for 5 yr. The effective CEC wastherefore reduced from 8.9 to 6.13 cmolc kg�1. At afertilizer application rate of 168 kg N ha�1 yr�1, CECwas reduced to 7.1 cmolc kg�1 over 5 yr. This is a 31and 20% reduction in CEC, respectively, over 5 years,similar to the results obtained in this study.
In other work, Schwab et al. (1989) reported that fora Kansas silt loam (Pachic Argiustoll) in bromegrasswith up to 224 kg N ha�1 yr�1 for 40 yr, CEC measuredby neutral salt (CaCl2) decreased from 19.1 to 12.8cmolc kg�1, compared to 0 N treatments. This is a 33%reduction in CEC over 40 yr. The results of Boumanet al. (1995) show that a loamy Saskatchewan soilfertilized with up to 180 kg N ha�1 yr�1 as urea for9 yr lost 1.8 cmolc kg�1 exchangeable cations (basesand acids) in the 0 to 15 cm soil depth, compared to a0 N control. The increase in exchangeable acidity anddecline in cation exchange capacity due to applicationof acid-forming N fertilizers observed in the Plano siltloam at the long-term fertility plots must therefore beseen as fitting into the context of long-term fertility
Table 1. Elemental analysis of Ca2+-saturated <2 �m clay fromadjacent plots receiving either 0 or 168 kg ammoniacal N ha�1 yr�1
for 30 yr. Oxygen completes analysis to 100%. Element-by-elementrelative standard deviations (RSD) are pooled for 4 measurements ofeach of four samples
No N (#74) 168 kg N ha�1 yr�1 (#72)Rep 1. Rep. 2 Rep 1. Rep. 2 RSD (%)
Si (g/100 g) 26.94 26.88 26.85 26.76 0.28Al 12.25 12.26 12.40 12.43 0.34Fe 7.48 7.51 7.64 7.69 0.29Mg 1.16 1.18 1.19 1.21 1.67K 2.25 2.25 2.11 2.16 6.45Ti 0.61 0.62 0.61 0.61 1.38P 0.27 0.27 0.27 0.27 1.20Mn 0.28 0.29 0.26 0.27 0.27Zn 0.06 0.06 0.11 0.05 0.32Ca 1.11 1.10 0.92 0.94 1.29
CEC (cmolc kg�1)a 55.5 55.0 46.0 47.0 1.29
Clay Yield (%) 17.4 17.2 15.7 16.4
a Determined by Ca-saturation.
plso7005.tex; 24/11/1997; 9:29; v.7; p.5
66
studies in North America that demonstrate the samephenomena and similar rates of change.
Effect of N fertilizer inputs on clay analyses
Clay analysis shows a 16% decline in CEC, deter-mined by Ca2+ as the index cation, associated withlong term N application (Table 1). Analyses of Si, Mg,Ti, P, and Mn are almost identical among the duplicateextractions and the two samples, indicating that theclays were likely identical before alteration by acidi-ty. A small increase in Al and Fe concentrations mayindicate with accumulation of Al and Fe from othersize fractions, either as oxides or hydroxy-interlayerednonexchangeable cations. The significance of the dif-ference in K concentrations between the two samples isuncertain but may represent some weathering of illiticor micaeous minerals in the clay due to prolonged acid-ification.
Effect of plant growth and crop removal onexchangeable base cations and acidity
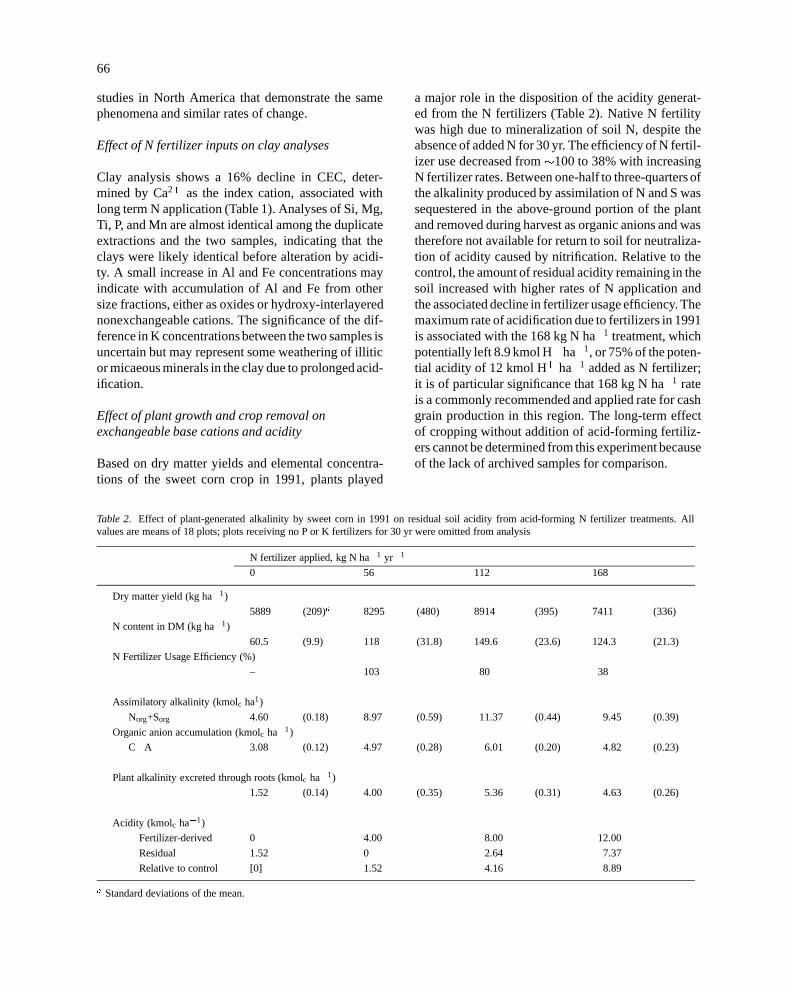
Based on dry matter yields and elemental concentra-tions of the sweet corn crop in 1991, plants played
Table 2. Effect of plant-generated alkalinity by sweet corn in 1991 on residual soil acidity from acid-forming N fertilizer treatments. Allvalues are means of 18 plots; plots receiving no P or K fertilizers for 30 yr were omitted from analysis
N fertilizer applied, kg N ha�1 yr�1
0 56 112 168
Dry matter yield (kg ha�1)
5889 (209)a 8295 (480) 8914 (395) 7411 (336)
N content in DM (kg ha�1)
60.5 (9.9) 118 (31.8) 149.6 (23.6) 124.3 (21.3)
N Fertilizer Usage Efficiency (%)
– 103 80 38
Assimilatory alkalinity (kmolc ha1)
Norg+Sorg 4.60 (0.18) 8.97 (0.59) 11.37 (0.44) 9.45 (0.39)
Organic anion accumulation (kmolc ha�1)
C�A 3.08 (0.12) 4.97 (0.28) 6.01 (0.20) 4.82 (0.23)
Plant alkalinity excreted through roots (kmolc ha�1)
1.52 (0.14) 4.00 (0.35) 5.36 (0.31) 4.63 (0.26)
Acidity (kmolc ha�1)
Fertilizer-derived 0 4.00 8.00 12.00
Residual �1.52 0 2.64 7.37
Relative to control [0] 1.52 4.16 8.89
a Standard deviations of the mean.
a major role in the disposition of the acidity generat-ed from the N fertilizers (Table 2). Native N fertilitywas high due to mineralization of soil N, despite theabsence of added N for 30 yr. The efficiency of N fertil-izer use decreased from �100 to 38% with increasingN fertilizer rates. Between one-half to three-quarters ofthe alkalinity produced by assimilation of N and S wassequestered in the above-ground portion of the plantand removed during harvest as organic anions and wastherefore not available for return to soil for neutraliza-tion of acidity caused by nitrification. Relative to thecontrol, the amount of residual acidity remaining in thesoil increased with higher rates of N application andthe associated decline in fertilizer usage efficiency. Themaximum rate of acidification due to fertilizers in 1991is associated with the 168 kg N ha�1 treatment, whichpotentially left 8.9 kmol H+ ha�1, or 75% of the poten-tial acidity of 12 kmol H+ ha�1 added as N fertilizer;it is of particular significance that 168 kg N ha�1 rateis a commonly recommended and applied rate for cashgrain production in this region. The long-term effectof cropping without addition of acid-forming fertiliz-ers cannot be determined from this experiment becauseof the lack of archived samples for comparison.
plso7005.tex; 24/11/1997; 9:29; v.7; p.6
67
The potential rates of acidification calculated fromthis long-term fertility experiment compare well withother studies in which rates of net acidification in var-ious agricultural systems on the order of 3–5 kmolH+ ha�1, and as much as 10–20 kmol H+ ha�1 inexploitative systems, have been previously noted (Posset al., 1995). Rates of removal of assimilatory alkalini-ty as harvested organic anions depends upon both cropspecies and plant part; for example, grain of corn,sorghum, barley, and oat will contain almost no organ-ic anions while leaves of corn, barley, soybean, cotton,beet, and carrot will contain organic anions stoichio-metrically equal to or in excess of the N content (Pierreand Banwart, 1973). Consequently, differences in cropmanagement will affect acidification rates not onlybecause of differences in N fertilizer usage efficiencybut also because of differences in return of assimilatoryalkalinity stored as organic anions: Crops harvested forgrain, with residues either returned as litter or burnedin the field, would be expected to return more alkalini-ty to soil and therefore have less acidifying effect fromacid-forming nutrients than crops removed in toto forforage or fuel.
Changes in soil C and N associated with N fertilizerinputs
Evidence of subtle changes in the soil organic mat-ter was sought, even though no above-ground cropresidues had been returned for 30 yr. No significanttrend was discernable individually for either quan-tity or isotopic ratio of C (1.64�0.20% C, 13C/12C= 1.0924�0.0005) or N (0.15�0.02% N, 15N/14N =0.3692�0.0006) in response to N treatment.
Discussion
Changes in CEC
The fate of the missing cation exchange capacity in thisstudy and others (Blevins et al., 1977; Bouman et al.,1995; Schwab et al., 1989) is not known based on anydirect evidence for these soils. Many soils have mixedconstant and variable charge components (McBride,1989) and CEC is pH-dependent. However, the manysoils that are recognized as variable charge soils usual-ly have a high sesquioxide content (free oxides of Fe,Al, and Si) or are kaolinitic, and are typically moreweathered soils from more humid climates than thisfertility study site (Uehara and Gillman, 1981). The
Plano silt loam at the Arlington, Wisconsin trials wasformerly a prairie soil and has a smectitic/illitic miner-alogy that is quite unlike that of typical variable chargesoils. Humic substances in the soil organic matter con-tain weakly acidic and very weakly acidic moieties andmay therefore be regarded as variable charge compo-nents of soil that also exhibit charge dependence inresponse to pH and to electrolyte concentration (Barakand Chen, 1992) and cannot be eliminated out of handas a cause of pH-dependent CEC. A rough calculationof the expected amount of organic charge reductioncan be made using values from the often-cited studyof 60 Wisconsin soils by Helling et al. (1964) whichapportioned pH-dependent CEC by statistical corre-lation into clay and organic matter fractions. For anaverage difference of 0.86 pH units in water between0 and highest N treatments at the Arlington, WI site,containing 1.6% C and 12% clay, the expected chargereduction is 0.71 cmolc kg�1 attributable to 1.6% Cand 0.64 cmolc kg�1 attributable to 17% clay content.The total predicted pH-dependence of CEC is there-fore 1.35 cmolc kg�1, which is less than half of theobserved drop in CEC between these N treatments.
Other possible explanations for CEC reductionsdue to prolong soil acidification include both miner-al weathering, including weathering of the clay min-erals themselves, and formation of nonexchangeablehydroxy-Al complexes in the interlayer region of theclays. Acid dissolution studies conducted under labora-tory conditions have shown that the rate of dissolutionof montmorillonite clay minerals is correlated to thedegree of substitution in the clay lattice (Shainberg etal., 1974). Work by Laird et al. (1991a) has shown thatthe smectitic mineral in the fine clay fraction from aMinnesota soil (similar in parent material, climate, andvegetation to that at Arlington, WI) is a high-charge,Fe-rich montmorillonite with octahedral substitutionin the soil clay exceeding that of the reference claysanalyzed by Shainberg et al. (1974). This suggests thatthe soil clays at the Arlington site and elsewhere in theloess-derived soils of the Upper Midwest may be par-ticularly prone to dissolution upon soil acidification.On the other hand, although all permanent negativecharge in the phyllosilicate clays must be balancedwith cations, not all of the cationic charge is necessaryexchangeable. Formation of polynuclear hydroxy-Alinterlayers in the 2:1 expansible clay minerals, eithersmectite or vermiculite, is associated with reductionin cation exchange capacity because the polynuclearhydroxy-Al material forms nonexchangeable ‘atolls’or ‘pillars’ in the interlayer (Barnhisel and Bertsch,
plso7005.tex; 24/11/1997; 9:29; v.7; p.7
68
1989). The process of formation of hydroxy-Al inter-layers is a recognized form of soil weathering, oftentermed ‘chloritization’ because of its tendency to formaluminous chlorite as an end product (Sposito, 1989).
The extent of reversibility of the charge reductionassociated with soil acidity at this site is unknown.Of the three explanations for CEC reduction, claymineral dissolution and chloritization are almost cer-tainly not reversible processes within a soil environ-ment, and certainly not reversible with aglime amend-ment. If the cation exchange capacity reduction is dueto variable charge considerations, then the reductionmay be reversible by pH amelioration and base supplywith agliming, although hysteresis cannot be ruled out.Without studying the mechanism of charge reductionin this soil and the extent of the reversibility of thephenomenon, the extent to which soils have been per-manently altered by common agronomic fertilizationpractices will be unresolved.
Comparison of acidification due to fertilizer inputwith acid deposition
The consequences of this and related studies of acid-ification due to agricultural nutrient inputs are greaterthan agroecosystems since N-saturation, i.e., acidify-ing N inputs greater than the ability of the biota and soilorganic matter to sequester, is implicated as a cause ofacidification and continued decline of natural ecosys-tem (Aber et al., 1989; Driscoll and van Dreason, 1992;Stoddard, 1994). Processes occurring in agriculturalsettings due to inefficiencies in N utilization of fer-tilizer N inputs may therefore present an acceleratedview of the consequences of atmospheric N deposi-tion under conditions of N saturation. For example, atthe Arlington, Wisconsin site, precipitation-weightedmean atmospheric deposition includes 2.61 kg NH4–Nand 0.19 kg H+ (pH 4.63) ha�1 yr�1 (NADP, 1993),indicating an acid input of�0.5 kmol ha�1 yr�1. Com-pared to agricultural inputs of 12 kmol ha�1 yr�1 inthis study and cash-grain agriculture in this region, therate of acidification due to fertilizer is underway at arate that is �25 times faster than the rate induced byacid rain. In such a case, the 30-yr records establishedby long-term fertility plots might represent the effectsof 750 yr of soil weathering by acid rain and perhapsthousands of years by pristine rain on fertile soils ofthe Upper Midwest region.
Evidence of CEC reduction due to N inputs, and itspotential for reversibility, might be more widespreadif repeated measurements of CEC of agricultural fields
were made routinely or well-documented soil sampleswere more commonly archived. Instead, CEC is rarelymeasured in evaluation of soil fertility, let alone mea-sured repeatedly on the same field or plot. Instead, evi-dence for CEC reduction comes only from long-termfertility studies, as noted in the studies above, and thenonly by side-by-side comparison with controls receiv-ing no fertilizer N input rather than comparison witharchived soil samples.
Conclusions
Side-by-side comparison of soils that received acid-forming N fertilizers for 30 yr reveals reduction of pHmeasured in water and strong salt, accumulation ofexchangeable acidity, decrease in exchangeable Ca2+
and Mg2+, and reduction of CEC associated with therate of N fertilization. Clay analysis showed that theCEC losses of 15% were not recoverable by saturatingwith 50-fold excess of Ca2+ under laboratory condi-tions. Analysis of above-ground plant material showsthat increasing N fertilization rates cause decreasingN fertilizer efficiency, leaving a larger portion of theacidity generated by nitrification in the soil. Plantssequestered between one-half and three-quarters of thealkalinity generated by N and S assimilation in the har-vestable plant material, although harvesting grain onlyand returning plant residue to the soil would decreasethe acidifying effect of fertilization.
Acknowledgements
Thanks are due to Mauricio Avila for assistance inpreparing yield data and clay analyses. Financial sup-port by the National Agricultural Research Institute ofthe Gambia and the Graduate School of the Universityof Wisconsin-Madison is gratefully acknowledged.
References
Aber J D, Nadelhoffer K J, Steudler P and Melillo J M 1989 Nitrogensaturation in Northern forest ecosystems. BioSci. 39, 378–386.
Barak P and Chen Y 1992 Equivalent radii of humic macromoleculesfrom acid-base titration. Soil Sci. 152, 184–195.
Barak P, Sherman L A and Jobe B O 1996 Comments on “Design andconstruction of a personal-computer-based automatic titrator”.Soil Sci. Soc. Am. J. 60, 630.
Barnhisel R I and Bertsch P M 1989 Chlorites and hydroxy-interlayered vermiculite and smectites. In Minerals in Soil Envi-ronments, 2nd ed. Eds. J B Dixon and S B Weed. pp 729–788.Soil Sci. Soc. Am., Madison, WI.
plso7005.tex; 24/11/1997; 9:29; v.7; p.8
69
Blevins R L, Thomas G W and Cornelius P L 1977 Influence of no-tillage and nitrogen fertilization on certain soil properties after5 years of continuous corn. Agron. J. 69, 383–386.
Bouman O T, Curtin D, Campbell C A, Biederbeck V O andUkrainetz H 1995 Soil acidification from long-term use of anhy-drous ammonia and urea. Soil Sci. Soc. Am. J. 59, 1488–1494.
Brimhall G H, Lewis C J, Ford C, Bratt J, Taylor G, Warin O 1991Quantitative geochemical approach to pedogenesis: importanceof parent material reduction, volumetric expansion, and eolianinflux in laterization. Geoderma 51, 51–91.
Cox G W and Atkins M D 1979 Agricultural ecology. W H Freeman,San Francisco.
Dijkshoorn W and van Wijk A L 1967 The sulphur requirement ofplants as evidenced by the sulphur–nitrogen ratio in the organicmatter. A review of the published data. Plant Soil 26, 129–157.
Dise N B and Wright R F 1995 Nitrogen leaching from Europeanforests in relation to nitrogen deposition. For. Ecol. Manag. 71,153–161.
Driscoll C T and van Dreason R 1992 Seasonal and long-term tem-poral patterns in the chemistry of Adirondack lakes. Water AirSoil Pollut. 67, 319–344.
Edwards A P and Bremner J M 1965 Dispersion of mineral colloidsin soils using cation exchange resins. Nature (London) 205,208–209.
Helling C S, Chesters G and Corey R B 1964 Contribution of organicmatter and clay to soil cation-exchange capacity as affected bythe pH of the saturating solution. Soil Sci. Soc. Am. Proc. 28,517–520.
Laird D A, Barak P, Nater E A and Dowdy R H 1991a Chemistryof smectitic and illitic phases in interlayered soil smectite. SoilSci. Soc. Am. J. 55, 1499–1504.
Laird D A, Dowdy R H and Munter R C 1991b Suspension nebu-lization analysis of clays by inductively coupled plasma-atomicemission spectroscopy. Soil Sci. Soc. Am. J. 55, 274–278.
Liu Y 1995 Fixation and release of NH4 and K in long-term fertilityplots. MSc. thesis, Iowa St. Univ. Ames, IA.
Liu Y, Laird D A and Barak P 1997 Dynamics of fixed and exchange-able NH4 and K in soils under long-term fertility management.Soil Sci. Soc. Am. J. 61, 310–314.
McBride M B 1989 Surface chemistry of soil minerals. In Mineralsin Soil Environments, 2nd ed. Eds. J B Dixon and S B Weed. pp35–88. Soil Sci. Soc. Am., Madison, WI.
Meister R T (Ed.) 1995 Farm chemicals handbook ’95, Vol. 81.Meister Publ. Co., Willowby, OH.
National Atmospheric Deposition Program 1993 NADP/NTN Annu-al Data Summary. Precipitation Chemistry in the United States.1992. National Resource Ecology Laboratory, Colorado StateUniv., Fort Collins, CO. 480 pp.
Odum E P 1984 Properties of agroecosystems. In AgriculturalEcosystems: Unifying Concepts. Ed. R Lowrance, B R Stin-ner and G J House. pp 5–11. J Wiley, New York.
Peterson L A and Krueger A R 1980 Variation in content of availableP and K (Bray I) in soil samples from a cropped N, P, and Kfertility experiment over 8 years. Commun. Soil Sci. Plant Anal.11, 993–1004.
Pierre W H and Banwart W L 1973 Excess-base and excess-base/nitrogen ratio of various crop species and parts of plants.Agron. J. 65, 91–96.
Poss R, Smith C J, Dunin F X and Angus J F 1995 Rate of soilacidification under wheat in a semi-arid environment. Plant Soil177, 85–100.
Schwab A P, Ransom M D and Owensby C E 1989 Exchange prop-erties of an argiustoll: effects of long-term ammonium nitratefertilization. Soil Sci. Soc. Am. J. 53, 1412–1417.
Shainberg I, Low P F and Kafkafi U 1974 Electrochemistry ofsodium-montmorillonite suspensions: I. Chemical stability ofmontmorillonite. Soil Sci. Soc. Am. Proc. 38, 751–756.
Sposito G 1989 The Chemistry of Soils. Oxford Univ. Press, NewYork.
Steel R G D and Torrie J H 1980 Principles and Procedures ofStatistics: A Biometrical Approach. McGraw-Hill Inc., NewYork.
Stoddard J 1994 Long-term changes in watershed retention of nitro-gen: Its causes and consequences. In Environmental Chemistryof Lakes and Reservoirs. Ed. L A Baker. pp 223–284. Am.Chem. Soc.
Sumner M E and Miller W P 1996 Cation exchange capacity andexchange coefficients. In Methods of Soil Analysis. Part 3:Chemical Methods. Ed. J M Bigham. pp 1201–1229. Soil Sci.Soc. Am. Inc., Madison.
Uehara G and Gillman G 1981 The mineralogy, chemistry, andphysics of tropical soils with variable charge clays. WestviewPress, Boulder, CO.
Van Breemen N, Mulder J and Driscoll C T 1983 Acidification andalkalinization of soils. Plant Soil 75, 283–308.
Van Beusichem M L, Kirkby E A and Baas R 1988 Influence ofnitrate and ammonium nutrition on the uptake, assimilation, anddistribution of nutrients in Ricinus communis. Plant Physiol. 86,914–921.
Section editor: E Delhaize
plso7005.tex; 24/11/1997; 9:29; v.7; p.9