effects of irrigation management on the quality of irrigation return flow in ashley valley, utah1
TRANSCRIPT

DIVISION S-6—SOIL AND WATER MANAGEMENT ANDCONSERVATION
Effects of Irrigation Management on the Quality of Irrigation Return Flow in Ashley Valley, Utah1
RON D. BLIESNER, R. J. HANKS, L. G. KING, AND L. S. WiLLARDSON2
ABSTRACTThe relationship between leaching fractions obtained under field
conditions and soil water salinity profiles on mature alfalfa was studiedby applying three qualities of water at three leaching fractions to areasof an alfalfa field (Medicago saliva L.) having three depths to watertable. The electrical conductivity of the irrigation water and of the soilsolution extract at various depths was measured for each irrigation.ET measurements from several lysimeters located in the field wereused to determine depths of irrigation water to apply. A sprinkler irri-gation system was used for application of the irrigation water to theplots, and the depth applied was determined by measuring the depthof water caught in cans placed in a sample plot during each irrigation.
The electrical conductivity of the irrigation waters applied averaged0.98 mmhos/cm, 2.22 mmhos/cm, and 2.80 mmhos/cm for the season.Leaching fractions for the low leaching treatment of each water quali-ty averaged 0.003. The other leaching treatments ranged from 0.082 to0.343. Assuming an inert soil with no precipitation or dissolving ofsalts, there should have been increases in average soil profile salinityranging from 1.81 mmhos/cm to 5.45 mmhos/cm during the seasondepending on the treatment. The largest increase measured on anytreatment was 0.32 mmhos/cm. Some treatments actually caused adecrease in salinity where an increase was expected. For the conditionof this study it appears that soil profile salinity is relatively insensitiveto leaching fraction for short periods of time (1 or 2 years). This is at-tributed to the high relative concentrations of calcium and sulfate inthe irrigation water and soil solution. Bearing these factors in mind, itappears that the quantity of salt removed in the drainage water variesdirectly with the quantity of drainage water since the concentration isrelatively constant.
Additional Index Words: leaching requirements, salinity, soil salin-ity, water quality.
MUCH EMPHASIS has been placed on reducing salt loadsin river system in recent years. Since irrigation return
flow is a large contributor to this salt load, proper irrigationmanagement may help. One way to manage irrigation returnflow is to control the portion of irrigation water that passesthrough the root zone as deep percolation. This portion ofwater is referred to as the leaching fraction.
The salt contribution from irrigation return flow to a riversystem could be reduced to zero by eliminating the leachingfraction. However, this is not practical (assuming an inertsoil with no precipitation or solution) because without
'Contribution from Utah State University, Dep. of Agricultural and Irri-gation Engineering and Soil Science and Biometeorology in cooperationwith Utah Agric. Exp. Stn. Logan, UT 84322. J. Pap. no. 2090. Supportedin part by Grant No. R-802864-01-1, Program Element IBB038, Office ofResearch and Monitoring, U.S. Environmental Protection Agency. Re-ceived 14 June 1976. Approved 28 Oct. 1976.
Irrigation Engineer, Superior Farming Company, Bakersfield, Calif.;Professor, Utah State Univ., Logan, Utah; Professor, Washington-StateUniv., Pullman, Wash.; and Professor, Utah State Univ., respectively.
leaching, the salt concentration in the root zone would even-tually exceed the crop tolerance to salinity.
Bernstein (1) and Bower et al. (5) recommended that thevalue for the electrical conductivity of the drainage water,ECdw, for a given crop should be the electrical conductivityof the saturation extract of the soil, ECe, that causes a 50%yield reduction. These studies involved crop yield-salinitycurves developed by maintaining uniform soil salinity pro-files at various levels and relating yield to this uniformsalinity value.
In 1967, Bernstein and Francois (2) began a 6-year lysim-eter study to determine the relationship between leachingfraction and yield. They reasoned that, since the soil salinityis not uniform throughout the root zone and the crop re-sponds to the salinity of the actual soil solution rather thanthe saturation extract salinity, the ECdw used for calculationof the leaching fraction should be the electrical conductivityof the soil solution extract which causes zero yield. Thisvalue was found by extrapolating yield response curves tozero yield and adjusting the value from the saturation mois-ture content to the field capacity moisture content. On al-falfa, the study indicated that this reasoning was sound andthat increasing the ECdw to the zero yield level caused lessdecreased in yield than measuring the salinity of the irriga-tion water from 1.0 mmhos/cm to 2.0 mmhos/cm.
Rhoades (8) suggested that high soil water salinities oc-curring in the lowerportions of the root zone could be large-ly offset if sufficient low salinity water is available to meetET from the upper root zone. Others, working on the sametheory, suggested that up to two-thirds of the root zone forcorn (3, 7) and tomatoes (3) could be salinized withoutseriously reducing yields.
These studies were made under near steady state condi-tions with little precipitation or dissolving of salts. Underthese conditions, over time, the same amount of salt addedin the irrigation water would be removed in the drainagewater. The leaching fraction would influence the solutionconcentration not the amount of salt removed.
Several recent studies have indicated that decreasingleaching fractions may reduce the amount of salt in irriga-tion return flow. Rhoades et al. (9) suggested that minimiz-ing drainage water maximizes precipitation of calcium car-bonate and gypsum in the soil, minimizes soil mineralweathering and the dissolving of salts previously depositedin the soil, and maximizes the amount of soluble salts re-tained in storage in the soil profile. A study by Bower (4)supports this suggestion. Another study by van Schilfgaardeet al. (11) showed that low leaching reduced soil mineralweathering and increased salt precipitation reducing the saltload in the drainage water up to 48% depending on saltcomposition in the irrigation water and in the soil.
424

BLIESNER ET AL.: EFFECTS OF IRRIGATION MANAGEMENT ON THE QUALITY OF IRRIGATION RETURN FLOW 425
Table 1—Leaching data for the three irrigation sources and the threeirrigation quantities at Vernal, Utah, 1974.
Table 2—Irrigation water qualities for each irrigation for the high,middle, and low quality water treatments.
Treatment
AlNlSIA2N2S2A3N3S3
Depthapplied
68.968.868.870.974.777.476.591.8
104.4
ET
69.269.269.269.269.269.269.269.269.2
Leachingquantity
-0.3-0.4-0.41.85.58.2
7.322.635.2
Leaching Desired leachingfraction fraction
-0.005-0.006-0.006
0.0240.0740.1060.0960.2460.337
0.00.00.00.030.080.110.100.250.34
t The letter refers to irrigation water quality with A-high, N-middle, and S-low.The number refers to the leaching treatment with 1-low, 2-medium, and 3-high.
These recent studies suggest that salinity of the soil waterin the lower root zone may be increased beyond previouslyrecommended levels. This means that leaching fractionsmay be reduced, resulting in less salt loading in river sys-tems. However, none of the studies investigated the re-sponse of soil water salinity to limited leaching under fieldconditions using normal irrigation methods. The purpose ofthis study is to evaluate reduced leaching fractions under avariety of field water management conditions.
PROCEDUREThe study was made on a farm near Vernal, Utah (6) in 1974.
The soil was Mesa sandy clay loam which had a volume watercontent of about 0.30 at field capacity. Twenty-seven plots es-tablished on mature alfalfa (Medicago saliva L.), having threedepths to water table of approximately 1.5, 2.1, and 2 .7m, weresprinkle irrigated with three qualities of irrigation water and atthree levels of leaching. Each plot was 7.6 by 9.1 m with an areain the center 3.7 m by 4.6 m used for the study area. Instrumenta-tion was placed along the edge of the study area.
The three qualities of irrigation water were naturally occurringon the farm. The best quality was from Ashley Creek (high) whichhad an EC of about 0.8 mmhos/cm the previous year. The mediumwater quality source was Naples drain (medium) which had an ECof about 2.0 mmhos/cm in 1973. The lowest water quality sourcewas the south tributary of Naples drain (low) which had an EC ofabout 2.8 mmhos/cm in 1973.
The three quantities of applied water were designed to give (i) azero-leaching fraction, (ii) a leaching fraction that would give anEC in the drainage water of 8 mmhos/cm for a nonreactive soil,and (iii) a leaching fraction that would give an EC in the drainagewater of 25 mmhos/cm for a nonreactive soil. Because the qualityof the irrigation water was different, there was a different leachingfraction for each quality. For a nonreactive soil, the leaching frac-tion is defined as
LF = EQw/ECdw = 1 - ET/Depthiw
where iw refers to irrigation water, "dw" refers to drainage water,and ET is evapotranspiration.
Depths of irrigation water applied were estimated from ETmeasured in two 1.0 m by 1.0 m by 1.0 m weighing lysimeterslocated in the field. It was assumed that the ET of all plots was thesame. This ET was compared with the average of six nonweighinglysimeters (208-liter barrels) located in the plots. All plots were ir-rigated when cumulative ET since the last irrigation reached ap-proximately 7.5 cm. Depths of water applied actually were deter-mined from can catch of the sprinkled water falling on a sampleplot. The depth applied to this plot was related to sprinkler pres-sure and time of irrigation. Pressure and time were measured on allthe other plots and applied to the relationship for the sample plot todetermine the depth applied to the individual plots.
Irrigation number
1234567
Average
A High
1.051.051.081.020.631.031.010.98
Irrigation water quality, EC
N Middle
2.452.822.131.911.701.882.622.22
S Low
1.293.152.264.381.814.01^2.722.80
The salinity of the soil water was monitored after each irrigationby measuring the EC of samples collected from ceramic cup sam-plers placed at 30-cm intervals from the 45-cm depth to 30 cmabove the average water table. Soil samples were also taken at theend of the season.
RESULTSThe desired leaching fractions were attained as shown in
Table 1 . Note that the leaching fractions attained were aresult of very careful irrigation and ET measurement inselected parts of the field and could not be attained with thisaccuracy on the field as a whole because of nonuniformityof sprinkler irrigation.
Table 2 gives the EC of the irrigation water for the threewater supplies used in the study. The fluctuation in the lowquality water supply was due to a fluctuation in flow. Highflow brought high quality water and low flow brought lowquality water. This is an irrigation return flow channel andthe fluctuation comes from intermittent surface runoff enter-ing the channel. It was felt that fluctuation in quality wasless important than using naturally available water from thesame hydrologic system. „
For a nonreacting soil where precipitation and solution ofsalts is assumed to be zero, the change in the average soilwater salinity in one year could be described by
_ ^iw X t,vjjw i-'dw X EA-.dw
Dr X 0fc
where AEQW = change in electrical conductivity of the soilwater, Diw = depth of irrigation water, ECiw = electricalconductivity of irrigation water, Ddw = depth of drainagewater, ECdw = electrical conductivity of drainage water, Dr= depth of root zone, and 0fc = moisture content by volumeat field capacity (0.30 for the soils in this experiment).
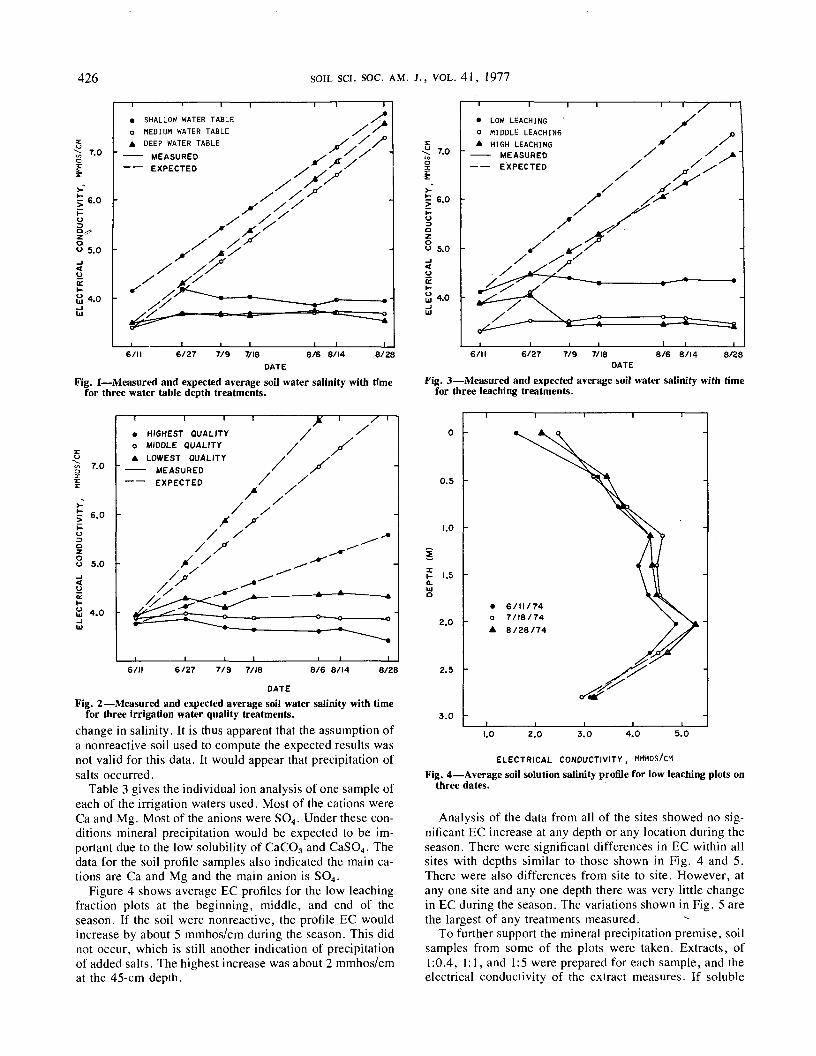
The quality of the drainage water for this study was takento be the quality of the 107-cm depth soil solution sampleand the root zone was assumed to be 107 cm deep. Theresults of applying this equation to the data from this studywere used to give the expected results shown in Fig. 1through 3.
The measured changes in soil profile salinity were muchsmaller than expected for the 1974 season (Fig. 1). Figures2 and 3 show similar results for the three irrigation waterquality treatments and three leaching treatments, respec-tively. In some cases, the measured soil profile salinity ac-tually decreased when an increase was expected. In no casewas the measured change in salinity as great as the expected
426 SOIL SCI. SOC. AM. J . , VOL. 41, 1977
7.0
o
5.0
4.0
—1————————I——————I——
• SHALLOW WATER TABLEo MEDIUM WATER TABLEA DEEP WATER TABLE
——— MEASURED——— EXPECTED
6/11 6/27 7/9 7/18 8/6 8/14 8/28DATE
Fig. 1—Measured and expected average soil water salinity with timefor three water table depth treatments.
7.0
6.0
DO
8 5.0
4.0
• HIGHEST QUALITYo MIDDLE QUALITYA LOWEST QUALITY
——— MEASURED—— EXPECTED
6/11 6/27 7/9 7/18 8/6 8/14 8/28
DATE
Fig. 2—Measured and expected average soil water salinity with timefor three irrigation water quality treatments.
change in salinity. It is thus apparent that the assumption ofa nonreactive soil used to compute the expected results wasnot valid for this data. It would appear that precipitation ofsalts occurred.
Table 3 gives the individual ion analysis of one sample ofeach of the irrigation waters used. Most of the cations wereCa and Mg. Most of the anions were SO4. Under these con-ditions mineral precipitation would be expected to be im-portant due to the low solubility of CaCO3 and CaSO4. Thedata for the soil profile samples also indicated the main ca-tions are Ca and Mg and the main anion is SO4.
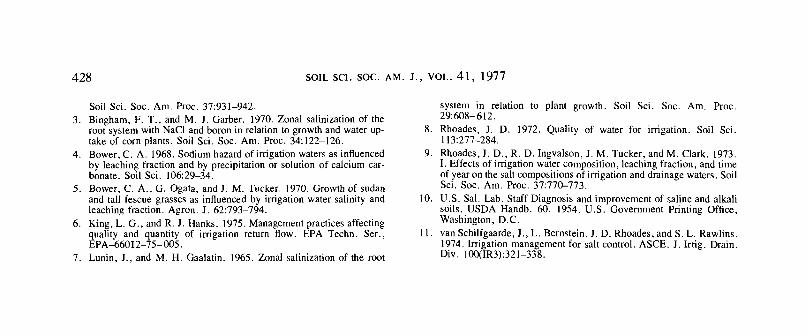
Figure 4 shows average EC profiles for the low leachingfraction plots at the beginning, middle, and end of theseason. If the soil were nonreactive, the profile EC wouldincrease by about 5 mmhos/cm during the season. This didnot occur, which is still another indication of precipitationof added salts. The highest increase was about 2 mmhos/cmat the 45-cm depth.
->i o
CO
N01 b
ELE
CTR
IC4k o
i I
• LOW LEACHING '0 MIDDLE LEACHINGA HIGH LEACHING
——— MEASURED——— EXPECTED
6/11 6/27 7/9 7/18 8/6 8/14 8/28DATE
Fig. 3—Measured and expected average soil water salinity with timefor three leaching treatments.
0.5
1.0
5
xQ.IU
1.5
2.0
2.5
3.0
• 6 / 1 1 / 7 4o 7/18/74A 8/28/74
1.0 2.0 3.0 4.0 5.0
ELECTRICAL CONDUCTIVITY, MMHOS/CM
Fig. 4—Average soil solution salinity profile for low leaching plots onthree dates.
Analysis of the data from all of the sites showed no sig-nificant EC increase at any depth or any location during theseason. There were significant differences in EC within allsites with depths similar to those shown in Fig. 4 and 5.There were also differences from site to site. However, atany one site and any one depth there was very little changein EC during the season. The variations shown in Fig. 5 arethe largest of any treatments measured. *-
To further support the mineral precipitation premise, soilsamples from some of the plots were taken. Extracts, of1:0.4, 1:1, and 1:5 were prepared for each sample, and theelectrical conductivity of the extract measures. If soluble

BLIESNER ET AL.: EFFECTS OF IRRIGATION MANAGEMENT ON THE QUALITY OF IRRIGATION RETURN FLOW 427
Table 3—Individual ion analysis of the irrigation water samples. ——'—————'—————'——————I—————'——_____Cations_____ ______Anions_______ 0 " *\̂ *~^^ f
__________Ca Mg Na K_____Cl S04 C03 HC03 ^\^^ ^""^x^
———————————————— meq/liter ——————————————— ^^^ /^^^_^Irrigation water quality 0.5 - ^v N. yP
High 9.2 8.9 0.9 0.1 0.3 15.0 0.9 2.2 \\ \ /Middle 12.0 13.0 4.7 0.2 1.0 17.0 0.6 9.2 N. \ 4Low 11.0 13.9 6.7 0.2 1.0 26.9 0.6 3.8 N. \7
Soil depth (cm) '-° " ^>N>0-30 9.4 5.7 2.1 - 0.8 11.8 - - Z ^//
30-60 24.7 18.4 3.9 -- 0.8 48.2 - - = . / / /60-90 24.0 36.0 5.7 - 1.8 64.4 jE f ff90-120 20.0 53.5 9.1 - - 1 .7 94.6 -- - - £ j '•' " I I
120-150 19.8 45.3 15.6 -- 1.9 94.1 .. .. Q / //150-180 25.7 20.6 4.1 -- 1.4 41.0 -- - «\ M.
————————————————————————————————————————————————————— • 6/11/74 ^^\A\20 ° 7/18/74 ^^V v̂,
Table 4—Comparison of electrical conductivity for three extract ' * 8/28/74 f yratios of plot soil samples. / |
_______Electrical conductivity________ / ^ /r
Treatment Depth_____1:0.4 1:1 1:5 (1:5) X 12.5f 2'5 " ' /<T
cm ————————— mmhos/cm —————————— ^^dt5N1 0-8 1.84 1.03 0.44 5.50
8-15 1.72 1.00 0.38 4.75 3.0 -15-23 1.90 1.11 0.39 4.88 '———'———————'———————'———————'———————'———'23-30 2.05 1.20 0.40 4.94 1.0 2.0 3.0 4.0 5.030-38 3.60 3.00 1.00 12.5038-45 3.95 3.10 1.22 15.31 E L E C T R I C A L C O N D U C T I V I T Y MMHOS/CM45-53 4.10 3.45 1.70 21.2553-60 4.05 3.35 1.52 18.94 Fig. 5—Average soil solution salinity profile for low water quality plots60-68 4.50 3.60 2.25 28.12 on three dates.68-75 4.55 3.45 1.52 18.9475-83 5.60 4.30 2.50 31.25 other on the farm which was caused by variability in past83-90 5.65 4.30 2.75 34.38 . . .. „ ., ,.irrigation as well as soil properties.
982 °S'_B15 I'™ I'll °f0 I™ How long leaching could be eliminated is not known, but
15-23 1.40 0.77 0.28 3.56 it appears to be many years.23-30 1.39 0.80 0.28 3.5030-38 1.40 0.82 0.29 3.6238-45 i.eo 0.95 0.32 3.94 SUMMARY AND CONCLUSIONS45-53 1.60 0.96 0.30 3.75
BO'BS 3 is 2 oo °'3f! s'^ ^or me concnt'ons °f tms study it appears that soil profile68-75 3.20 2.15 o.76 9.50 salinity is relatively insensitive to leaching fraction for short83~9o 335 250 104 1300 periods of time (1 to 2 years). It appears that any decrease in
——————————————:————'————:—————•———— leaching fraction causes more salt to precipitate in the soilt This column adjusts the conductivity of the 1:5 extract to the moisture con- and any jncrease in leaching fraction brings salts into SOlu-
tent of the 1:0.4 extract. . J ., ... . , , 7 . , , .tion from the soil. This is attnbuted to the high relative con-centrations of calcium and sulfate in the irrigation water andsoil solution, and to both the native soil gypsum and pre-
mmerals (precipitated salts) were not present, the conduc- yious gypsum accumulations from irrigation practices oftivity of the 1:1 extracts would be 5 times the conductivity some 5Q years whkh have caused ,arge quantlties of precip.of the 1:5 extracts. Table 4 gives the results of these tests. In itated sahs to accumulate in the soils, causing the soil to actthe table, columns 2 and 5 would be the same if there were as a buffef Beari thes£ factors in m[nd^ k appears that theno precipitated salts in the soils. In each case, even at the total amount of sah remoyed in irrigation return flow fromshallow depths, some solid-phase salts are evidently such an area varies directly wkh the quantity of drainagepresent. The amount of soluble solid-phase salts generally water since the concentration is reiativeiy constant. Thisincreases with depth as would be expected. There may be as wou,d say ̂ sa,t loads ••„ irrigation return flow can bemuch as six times as much salt precipitated in the soil as in reduced dramaticall without reducing yields by reducingthe soil solution at saturation moisture content. ,eachi tQ fi suggested in the literature cited. Caution
The field data collected on this study indicate that limited must be used> however> in applying this theory. Long-termleaching is a useful concept and can be used to limit salt out- effccts have not been considered and the conditions underput to the drainage water. In fact, it appears that no leaching whkh this information applies are limited by the type ofis necessary here. An examination of the farming practices sajts jnvoivedin the area on and around the experimental farm would in-dicate that there are sites where no leaching has occurred formany years. Crop yields were apparently not decreasedmuch because of the presence of a water table near the sur-face that supplied water by upward flow. This would ac-count for the variability of EC profiles from one site to an-
428 SOIL sci. soc. AM. J., VOL. 41, 1977