effects of iron-rich intermetallics and grain structure on ...constellation.uqac.ca/3972/2/semisoild...
TRANSCRIPT
1
Effects of Iron-rich Intermetallics and Grain Structure on Semisolid Tensile Properties of
Al-Cu 206 Cast Alloys near Solidus Temperature
Amir Bolouri, Kun Liu, X.-Grant Chen*
Department of Applied Science, University of Quebec at Chicoutimi,
Saguenay, QC, Canada, G7H 2B1
Abstract
The effects of iron-rich intermetallics and grain size on the semisolid tensile properties of
Al-Cu 206 cast alloys near the solidus were evaluated in relation to the mush microstructure.
Analyses of the stress-displacement curves showed that the damage expanded faster in the mush
structure dominated by plate-like β-Fe compared to the mush structure dominated by Chinese
script-like α-Fe. While there was no evidence of void formation on the β-Fe intermetallics, they
blocked the interdendritic liquid channels and thus hindered liquid flow and feeding during
semisolid deformation. In contrast, the interdendritic liquid flows more freely within the mush
structure containing α-Fe. The tensile properties of the alloy containing α-Fe are generally higher
than those containing β-Fe over the crucial liquid fraction range of ~0.6 to 2.8%, indicating that
the latter alloy may be more susceptible to stress-related casting defects such as hot tearing. A
comparison of the semisolid tensile properties of the alloy containing α-Fe with different grain
sizes showed that the maximum stress and elongation of the alloy with finer grains were
moderately higher for the liquid fractions of ~2.2-3.6%. The application of semisolid tensile
properties for the evaluation of the hot tearing susceptibility of experimental alloys is discussed.
2
Keywords: Al-Cu 206 cast alloy; Semisolid, Tensile properties; Fe-rich intermetallics; Grain
size.
* Corresponding author:
X.-Grant Chen, Department of Applied Science, University of Québec at Chicoutimi,
Saguenay (QC), Canada G7H 2B1, Tel.: 1-418-545 5011 ext. 2603; Fax: 1-418-545 5012
E-mail: [email protected]

3
1. Introduction
The semisolid tensile behavior of solidified aluminum alloys has recently received
considerable attention [1-5]. Due to the thermal gradients and solidification shrinkage during the
casting process, the semisolid microstructure is frequently subjected to tensile stresses, which
can lead to casting defects such as hot tearing and porosity [6-8]. The response of the solidified
microstructure to the applied stress depends on the deformation behavior, tensile properties and
liquid flow within the semisolid structure (mush structure) [9-11]. To investigate the mechanical
properties of aluminum alloys in the semisolid state, three major mechanical tests in shear [7,12-
13], compression [7,14-15] and tension [4,7,11,16-19] have been developed. It is widely
accepted that the semisolid tensile test induces a similar stress-strain condition to that during
solidification of the aluminum alloy [7,17]. Therefore, the semisolid tensile test can provide
accurate quantitative results for the tensile properties of the semisolid alloy [2,3,17,20-26].
Moreover, the microstructural observations of the mechanically tested samples may show that
the microstructural evolution is similar to those during solidification [1,27-30]. These
capabilities provide a deeper understanding of the deformation mechanisms of the mush structure
under the stresses from the solidification process [8].
The tensile behavior and deformation mechanisms of the mush structure as a function of
the solid fraction have been the subject of a number of studies [20-27]. Studies to determine the
semisolid tensile properties of different aluminum alloys, including AA5182 [2,4], AA3014 and
AA6111 [3,4], 7xxx [5] and AA6061 [17], have been conducted. The results from those prior
studies indicate that all semisolid materials lost their ductility at a solid fraction, fs, of ∼0.95–
0.98, and their strength at a fs of ∼0.90–0.95 [3]. However, there is limited information on the
effect of constitutive phases such as Fe-rich intermetallics on the semisolid tensile properties of
4
aluminum alloys during the last stage of solidification. The morphology, size and distribution of
these intermetallics are important for the formation of casting defects such as hot tearing [28,31].
Furthermore, a careful examination of the effect of grain structure on the tensile properties of the
mush is rarely found in the literature.
Al-Cu cast 206 alloys possess great potential to achieve excellent mechanical properties
comparable to those of forged and wrought aluminum alloys [32,33]. In addition, they have a
promising high temperature tensile strength [34]. However, 206 cast alloys are susceptible to hot
tearing during the casting process [35,36]. Iron is one of the most common impurities in
aluminum alloys. Due to its extremely low solid solubility in aluminum, iron often precipitates in
the form of different iron-rich intermetallic phases during solidification. The most common iron-
rich intermetallics in 206 alloys are plate-like β-Fe (Al7CuFe) and Chinese script-like α-Fe
(Al15(FeMn)3(SiCu)2) intermetallics, depending on the chemistry of the alloy [37,38]. The plate-
like β-Fe intermetallics are considered detrimental to the mechanical properties of the alloys
because they act as stress concentrators and crack initiators and promote shrinkage porosity by
blocking interdendritic feeding [28,39,40]. To counteract the detrimental effect of the plate-like
β-Fe intermetallics in 206 alloys, Mn and Si are added to transform the iron-rich intermetallics
from platelet β-Fe to Chinese script-like α-Fe. [39,40]. In addition to affecting the mechanical
properties of Al-Cu 206 alloys at ambient temperature, these intermetallics may also
significantly influence the semisolid tensile properties of the mush [31].
In the present study, semisolid tensile tests were conducted on 206 alloys with liquid
fractions less than 0.1 (near the solidus), which is critical for stress-related defect formation
during casting and solidification [1]. The effects of different iron-rich intermetallics and grain
sizes on the tensile properties of the mush were studied. The microstructural evolution at
5
different liquid fractions and the fracture surfaces of tensile samples were examined using
scanning electron microscopy. The mush deformation mechanisms for different liquid fractions
were discussed.
2. Experimental procedures
2.1. Preparation of alloys and cast samples
Commercially available pure aluminum (99.7%) and pure Mg (99.9%), Al-50Cu, Al-
25Fe, Al-50Si, and Al-25Mn master alloys were used to prepare three experimental Al-4.5Cu
206 alloys. The chemical compositions of the alloys were analyzed by optical emission
spectroscopy and are shown in Table 1. Three experimental alloys contained a fixed Fe level of
0.3%. They were designated based on their Fe, Si and Mn contents as following: Alloy 311
containing 0.1% Si and 0.1% Mn for forming plate-like β-Fe (Al7CuFe) intermetallics and Alloy
333 containing 0.3% Si and 0.3% Mn for forming Chinese script-like α-Fe (Al15(FeMn)3(SiCu)2)
intermetallics [37-39]. Alloy 333-GR has the same chemical composition as Alloy 333, but
0.02% Ti was added to form an Al-5Ti-1B master alloy for grain refining. In this study, all
compositions are given in wt. %, unless otherwise specified.
The alloy batch and melting was conducted in an electric resistance furnace. The
temperature of melt was held at 1033 K (750 ˚C) for 30 minutes and the melt was gently stirred.
Pure argon gas was used for 20 minutes degassing at a flow rate of 2 L/min through a rotating
graphite impeller at a speed of 150 rpm. A standard ASTM B108 permanent mold, preheated at
633 K (350 ˚C), was used to cast the as-cast samples. For semisolid tensile testing, cylindrical
specimens with a total length of 120 mm and a diameter of 10 mm were machined from the
standard ASTM B108 cast samples. Even screw threads were precisely machined at the both
6
ends of the cylindrical specimens providing that the final distance between two installed nuts was
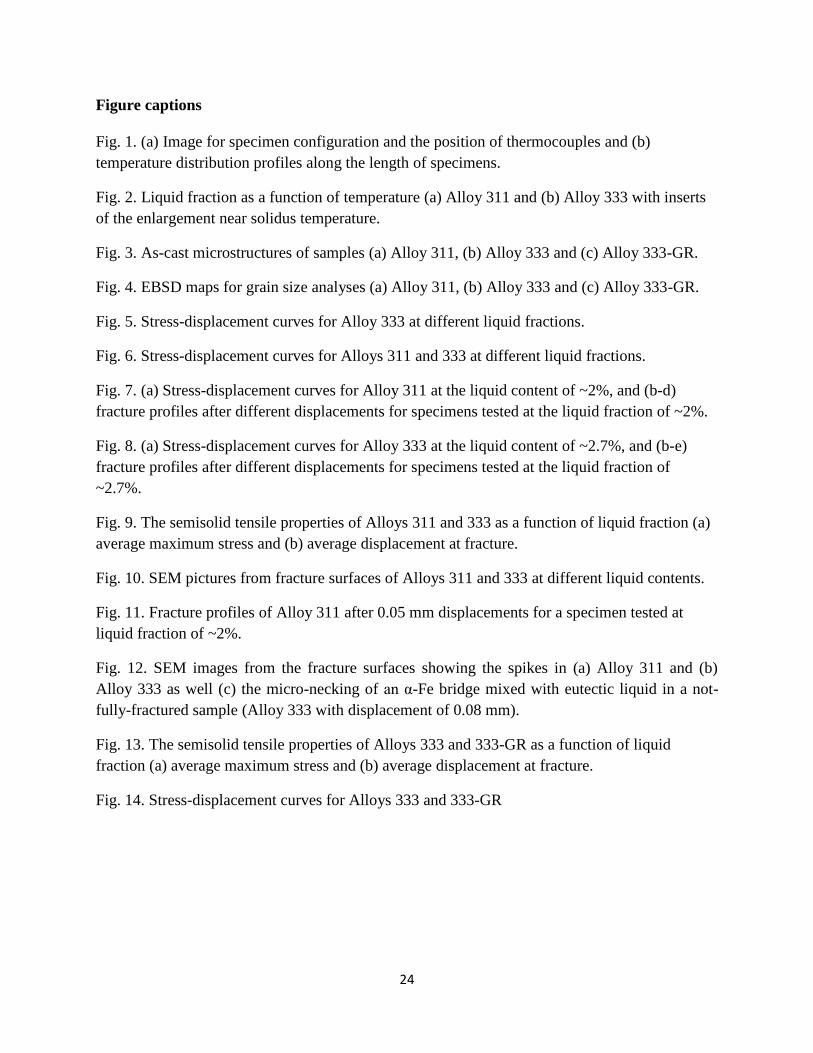
95±0.1 mm (Fig. 1a).
2.2. Semisolid tensile testing
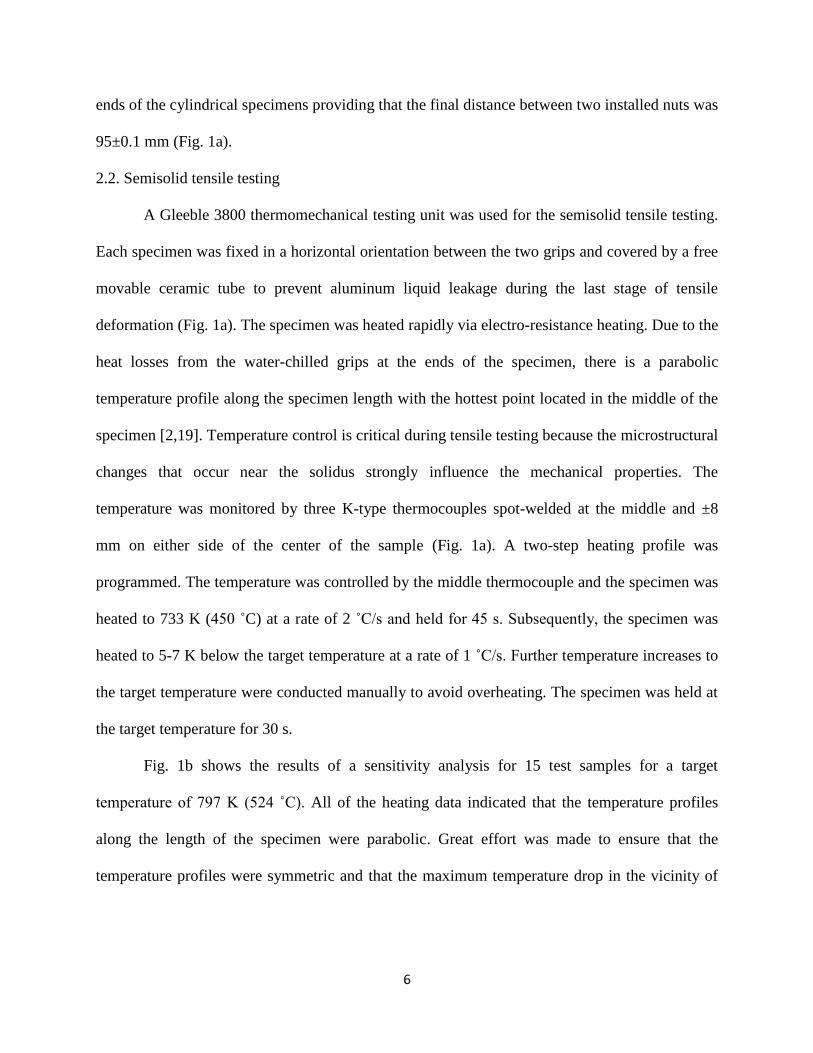
A Gleeble 3800 thermomechanical testing unit was used for the semisolid tensile testing.
Each specimen was fixed in a horizontal orientation between the two grips and covered by a free
movable ceramic tube to prevent aluminum liquid leakage during the last stage of tensile
deformation (Fig. 1a). The specimen was heated rapidly via electro-resistance heating. Due to the
heat losses from the water-chilled grips at the ends of the specimen, there is a parabolic
temperature profile along the specimen length with the hottest point located in the middle of the
specimen [2,19]. Temperature control is critical during tensile testing because the microstructural
changes that occur near the solidus strongly influence the mechanical properties. The
temperature was monitored by three K-type thermocouples spot-welded at the middle and ±8
mm on either side of the center of the sample (Fig. 1a). A two-step heating profile was
programmed. The temperature was controlled by the middle thermocouple and the specimen was
heated to 733 K (450 ˚C) at a rate of 2 ˚C/s and held for 45 s. Subsequently, the specimen was
heated to 5-7 K below the target temperature at a rate of 1 ˚C/s. Further temperature increases to
the target temperature were conducted manually to avoid overheating. The specimen was held at
the target temperature for 30 s.
Fig. 1b shows the results of a sensitivity analysis for 15 test samples for a target
temperature of 797 K (524 ˚C). All of the heating data indicated that the temperature profiles
along the length of the specimen were parabolic. Great effort was made to ensure that the
temperature profiles were symmetric and that the maximum temperature drop in the vicinity of
7
the target temperature was approximately one degree in the middle zone (5-6 mm) of the
specimen.
The tensile tests were first conducted for fully solidified alloys at a few degrees below the
solidus. Subsequently, the semisolid tensile tests were conducted at 2-degree increments until a
maximum temperature was reached. This maximum temperature was determined such that a
negligible fracture stress was present and corresponds to a solid fraction of ∼0.9. A minimum of
three tests were conducted at each temperature. The specimens were loaded at a strain rate of
~10-3. The data acquisition rate was 200 data per second.
2.3. Material characterization
Differential scanning calorimeter (DSC) analysis was performed to determine the solidus
and liquidus temperatures of experimental alloys. DSC analysis was conducted on heating
(melting) and cooling (solidification) paths. In the present work, DSC data on heating was used
to calculate the liquid fraction of the alloys due to the fact that Gleeble semisolid tests were
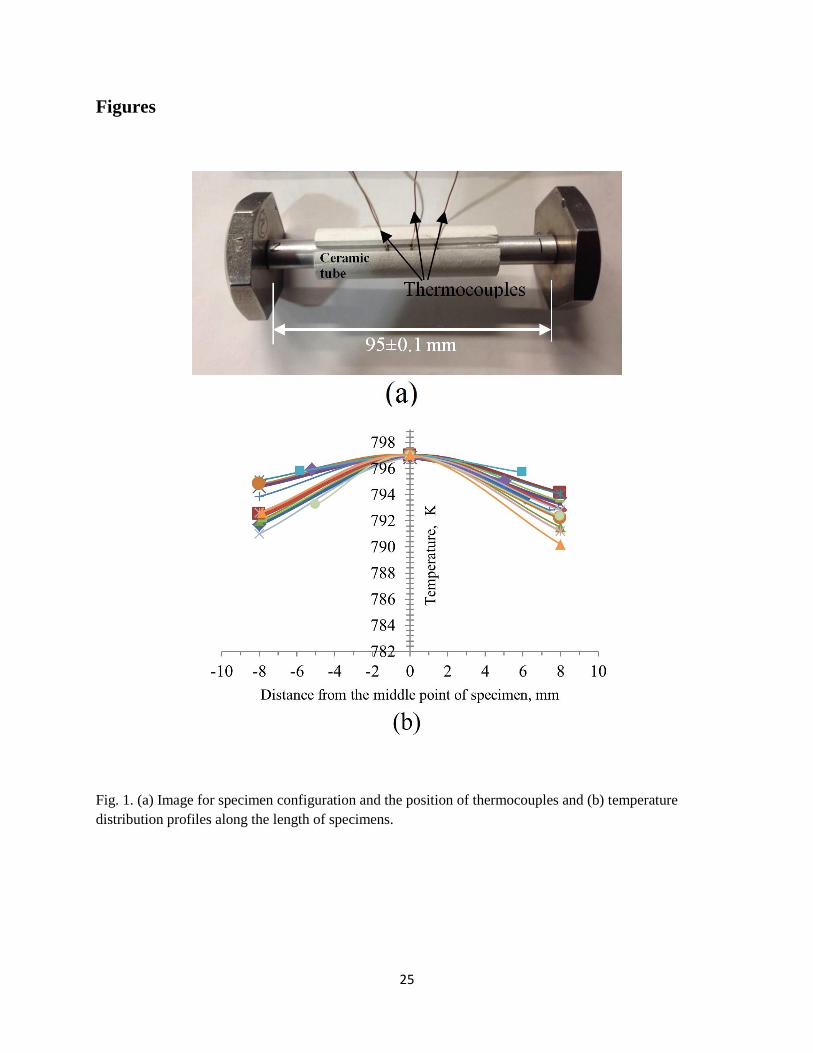
conducted on heating process. The liquid fraction of the alloys as a function of temperature was
calculated with a method proposed in Ref [41]. The liquid fraction curves vs temperature for
Alloys 311 and 333 are shown in Fig. 2. After tensile tests, the samples were sectioned parallel to
the loading direction, and prepared for metallographic observations. An optical microscope and a
scanning electron microscopy (SEM) equipped with energy-dispersive X-ray spectroscopy
(EDS) are used to examine the microstructure and fracture surface of specimens.
3. Results and discussion
3.1. As-cast microstructure
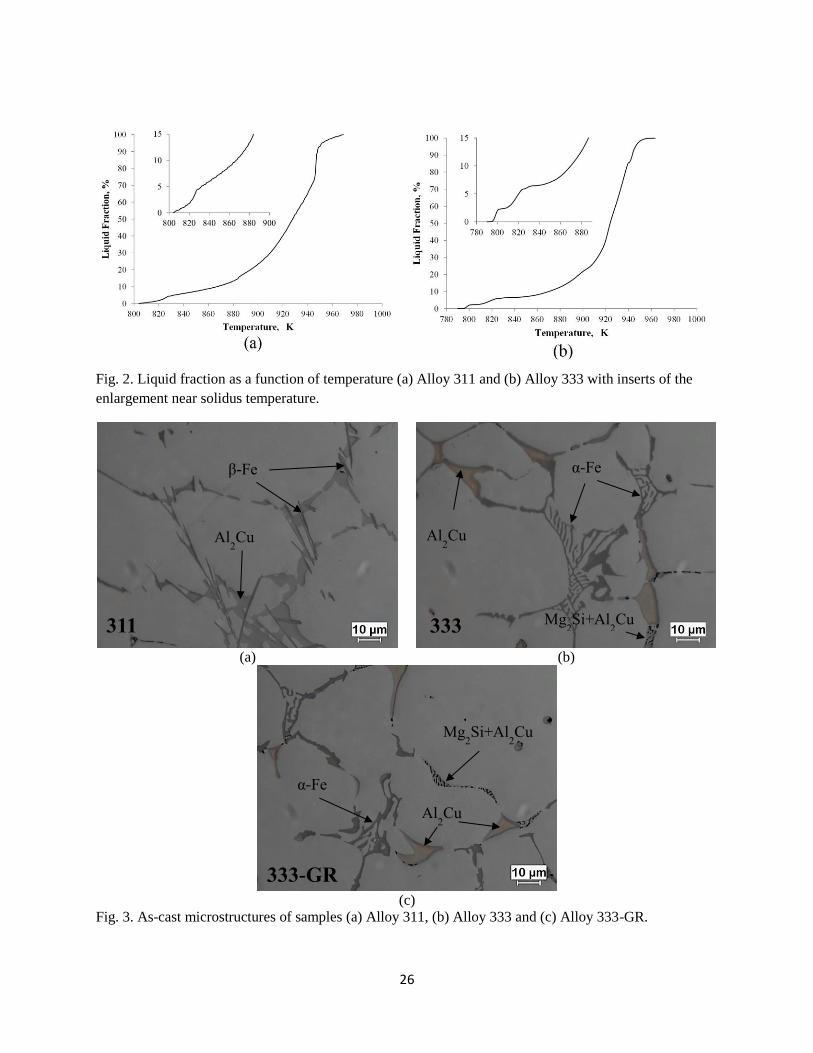
The typical as-cast microstructures of the prepared alloys are shown in Fig. 3. In general,
the microstructure consists of α-Al dendrites, iron-rich intermetallics and eutectic Al2Cu or

8
Mg2Si+Al2Cu, which are labeled in the micrographs. For Alloy 311, the iron-rich intermetallics
are plate-like β-Fe(Al7CuFe), which are interlocked with the low melting Al2Cu and are
distributed in the interdendritic regions (Fig. 3a). For Alloys 333 and 333-GR, the Chinese
script-like α-Fe (Al15(FeMn)3(SiCu)2) is the dominant iron-rich intermetallic (Figs. 3b and c). In
addition, a binary eutectic Al2Cu and a ternary eutectic Mg2Si+Al2Cu are distributed in the
interdendritic regions. The iron-rich intermetallic transformation from the plate-like β-Fe to the
Chinese script-like α-Fe is due to the increased Mn and Si contents in the 333 and 333-GR alloys
compared to Alloy 311 [37].
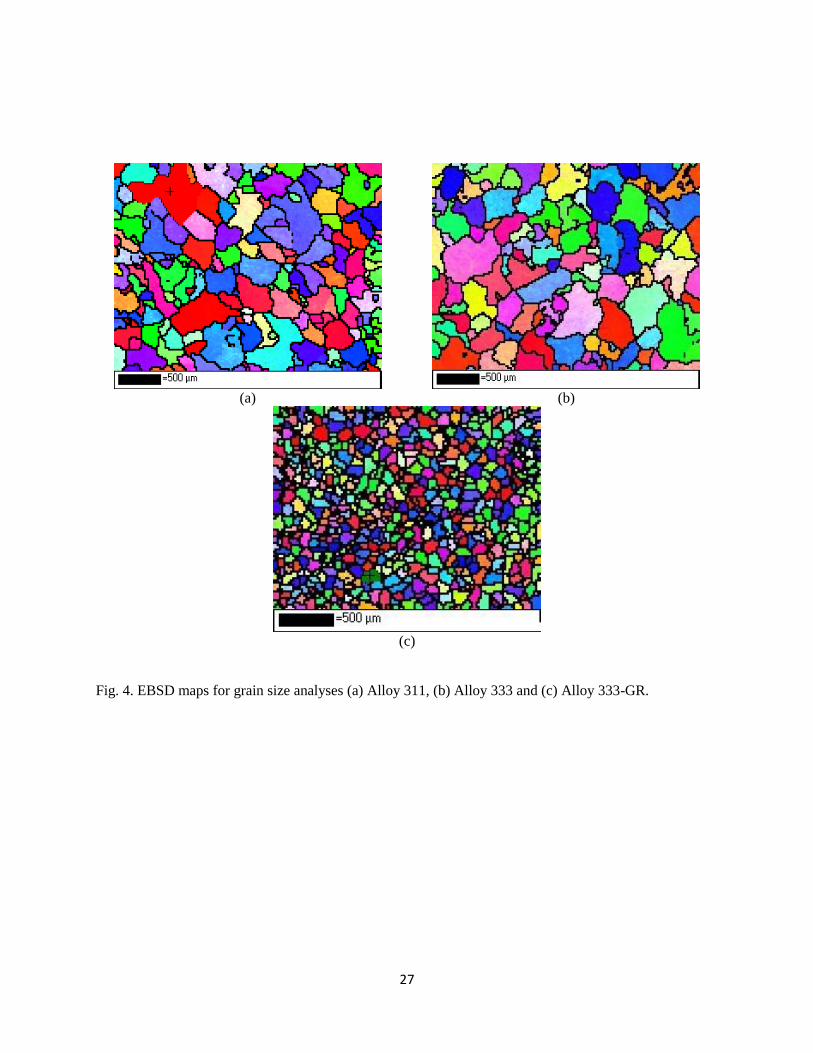
The grain structure and size were determined using Electron Backscatter Diffraction
(EBSD) technique. Fig. 4 shows the EBSD grain maps for Alloys 311, 333 and 333-GR. The
different colors represent aluminum grains with different orientations. All three alloys have
uniform, equiaxed grains. For Alloys 311 and 333, the average grain sizes are 280 ± 28 µm and
323 ± 30 µm, respectively, which are comparable because both alloys were cast using the same
casting conditions and not grain-refined. The addition of 0.02% Ti from the Al-5Ti-1B master
alloy significantly reduced the average grain size of Alloy 333-GR to 94±15 µm (Fig. 4c).
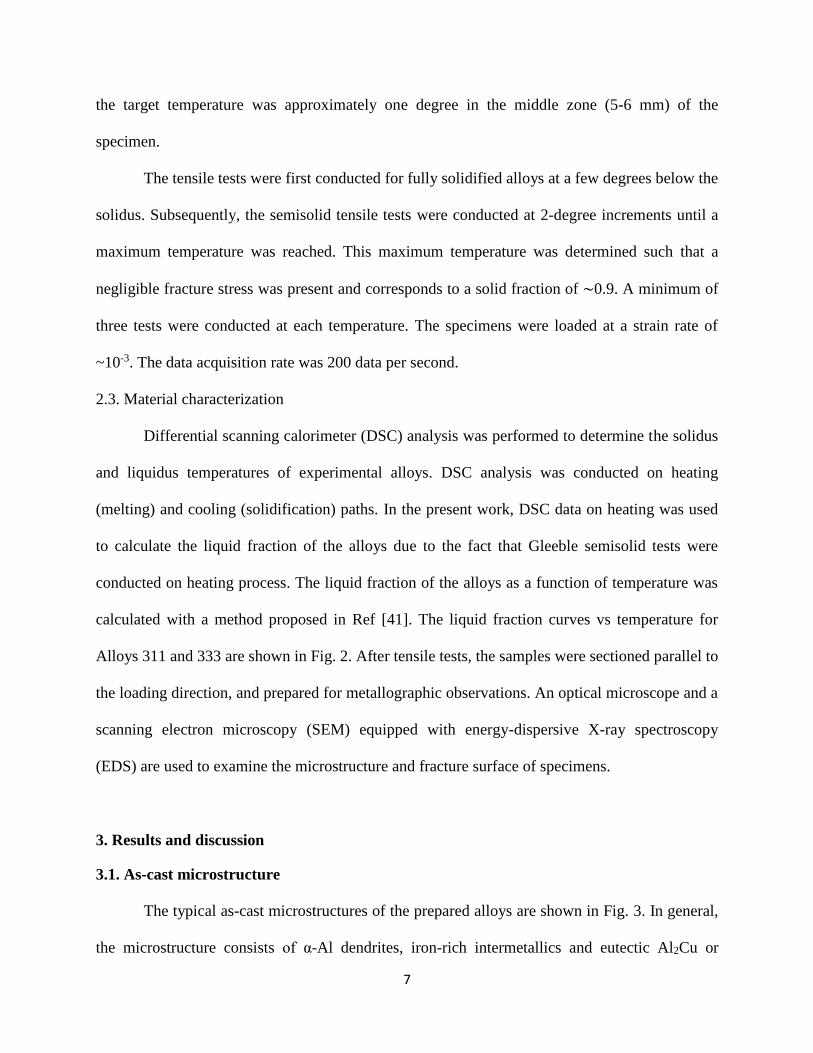
3.2. Evolution of stress-displacement curves
Tensile tests near the solidus were performed on samples with different liquid fractions.
The fracture behavior greatly depends on the liquid fraction, and similar behaviors were
observed for all three experimental alloys (Alloys 311, 333 and 333-GR). For example, typical
curves for samples in the solid state (a few degrees below the solidus temperature) and the
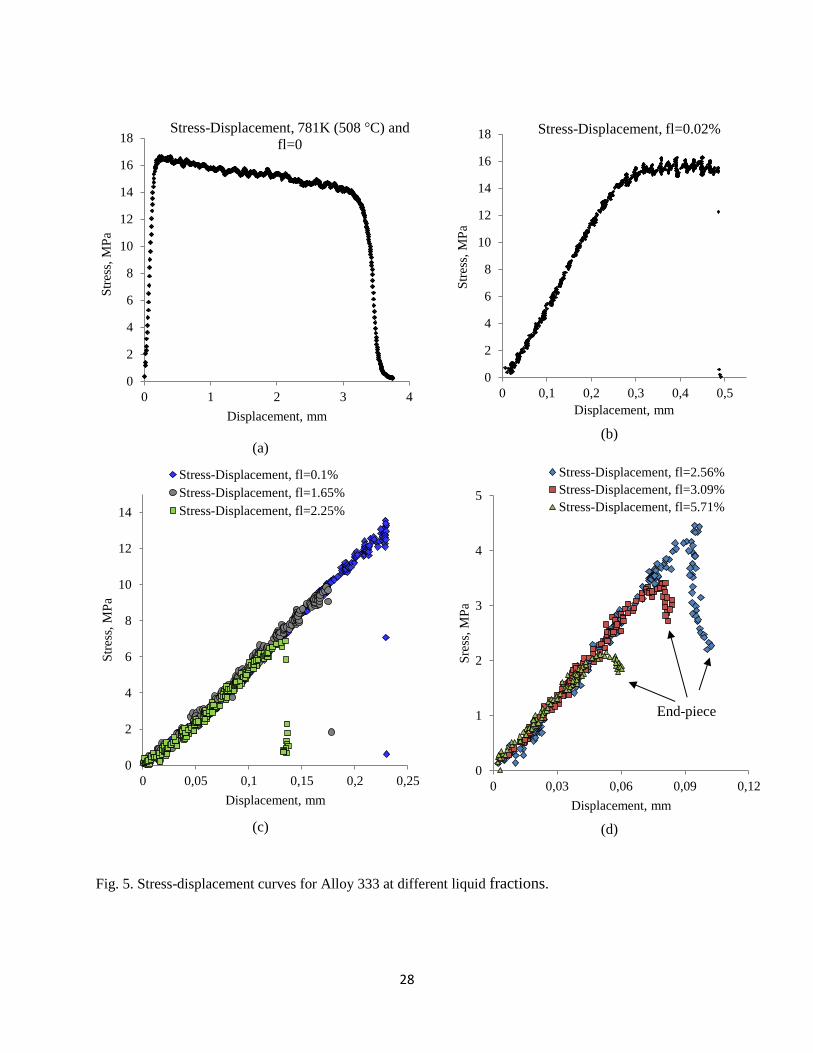
semisolid state (above the solidus temperature) are shown in Fig. 5 to illustrate the effect of the
liquid fraction on the stress-displacement curves in Alloy 333. The stress values are engineering
stresses. The engineering stress values (σ) are calculated as 𝜎 =𝐹
𝐴0, in which F is the force and
9
𝐴0 is the cross-section area of specimen before deformation. For the samples tested in the solid
state (Fig. 5a), there is a gradual decrease in the stress until the final fracture after the maximum
stress is reached. The alloy necks and is remarkably ductile until fracture (a total displacement of
3.68 mm), which is consistent with the hot tensile behavior of solid metals. For the specimens
tested in the semisolid state with a 0.02% liquid fraction (Fig. 5b), there is a limited amount of
plastic deformation before the final fracture. This fracture behavior occurs in the mush at
temperatures just above the solidus as the amount of the coherent solid skeleton is sufficient to
sustain the tensile stress allowing it to plastically deform [42]. However, the small amount of
liquid (0.02%) in the microstructure introduces isolated pockets of liquid that considerably
reduce the elongation value compared to the fully solid alloy (Fig. 5a). At a liquid fraction of
~0.1%, the alloy undergoes brittle fracture that occurs at the peak stress without any plastic
deformation (Fig. 5c). This behavior is identical for the samples with liquid fractions of ~0.1-
2.2%. The maximum stress decreases from 13 MPa at a liquid fraction of ~0.1% to 6.5 MPa at a
liquid fraction of ~2.2%. Further increases in the liquid fraction (>~2.6%) result in the
development of end-pieces in the stress-displacement curves after the maximum stress is reached
(Fig. 5d). Instead of the aforementioned brittle behavior (Fig. 5c), the stress increases sharply
until the peak stress is reached and then continuously decreases (end-pieces) before a final
rupture slightly below the maximum stress (Fig. 5d). This may indicate the presence of plastic
deformation and necking in the mush structure after the maximum stress. The size of the end-
pieces decreases as the liquid fraction increases, as shown in Fig. 5d.
Similar types of stress-displacement curves and therefore a similar fracture behavior were
obtained for all three alloys. However, the specific fracture behavior (as previously explained)
occurred over a different range of liquid fractions for each alloy. For example, Alloy 311
10
exhibits brittle fracture for liquid fractions of 0.5-0.8%, but Alloy 333-GR exhibits brittle
fracture for liquid fractions of 0.1-3.7%.
3.3. Effect of iron-rich intermetallics on semisolid tensile behavior
As mentioned in Section 3.1, Alloy 311 contains plate-like β-Fe intermetallics, while
Alloy 333 has predominant Chinese script-like α-Fe intermetallics (see Fig. 3). The semisolid
tensile deformation and properties of Alloys 311 and 333 were compared to examine the effect
of different iron-rich intermetallics on the semisolid tensile behavior for various liquid fractions.
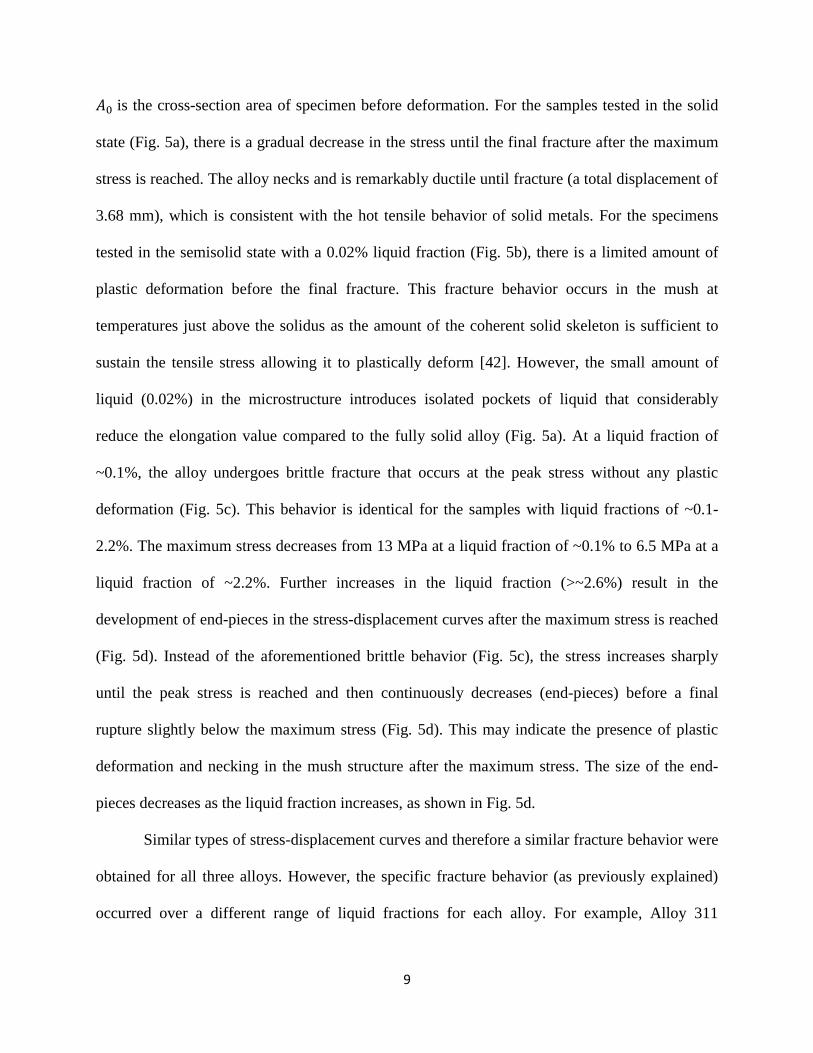
3.3.1. Stress-displacement curves
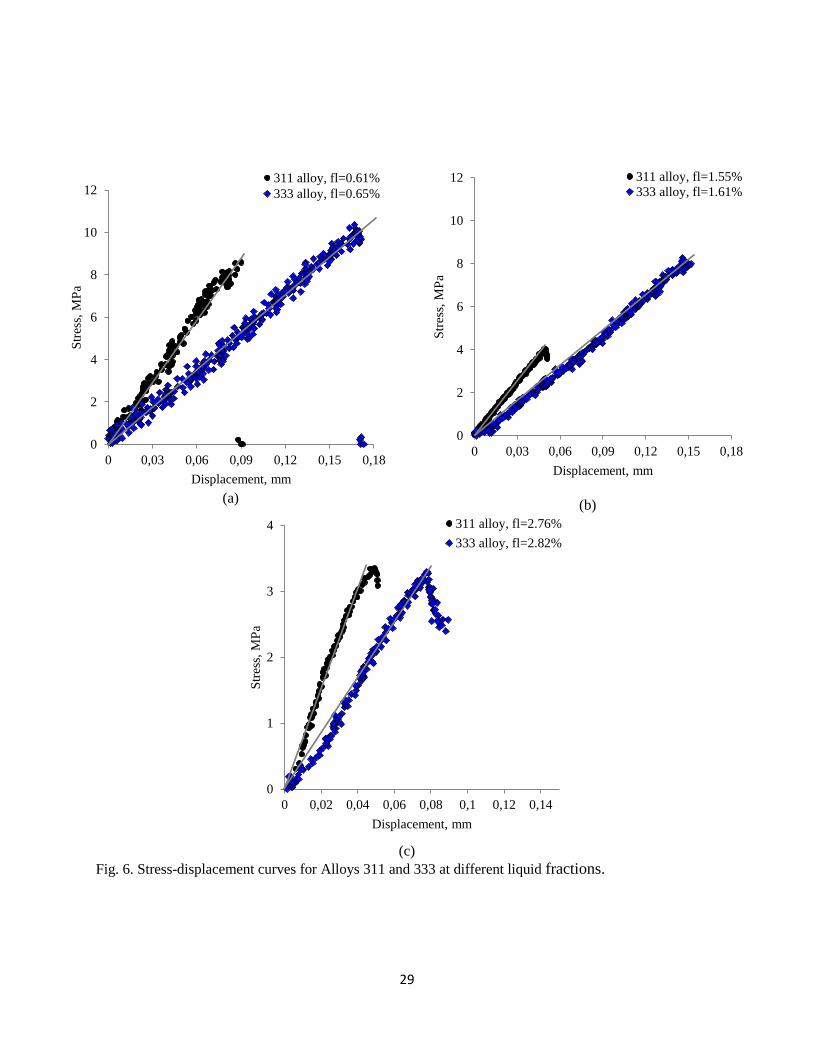
The stress-displacement curves for Alloys 311 and 333 at different liquid fractions are
shown in Fig. 6. For a given liquid content, the mush structure of Alloy 333 tolerates larger
displacements before reaching the maximum failure stress compared to the mush structure of
Alloy 311. Because tension was applied to the samples at a constant strain rate, for a given liquid
fraction, the stress reaches its maximum value more quickly in the mush structure of Alloy 311
compared to the mush structure of Alloy 333. Assuming that crack initiation and its full (Fig. 6a)
or partial propagation (Fig. 6c) occur before the maximum stress is reached [2], it is reasonable
to suggest that the expansion of damage in the mush structure of Alloy 311 occurs more quickly
than in the mush structure of Alloy 333. On the other hand, the semisolid structure of Alloy 311
is weaker than the semisolid structure of Alloy 333 because Alloy 311 reaches lower maximum
stresses (Figs. 6a and b). At larger liquid fractions of ~2.8%, both alloys exhibit a similar range
of strengths (Fig. 6c), which will be discussed in detail in the following sections.
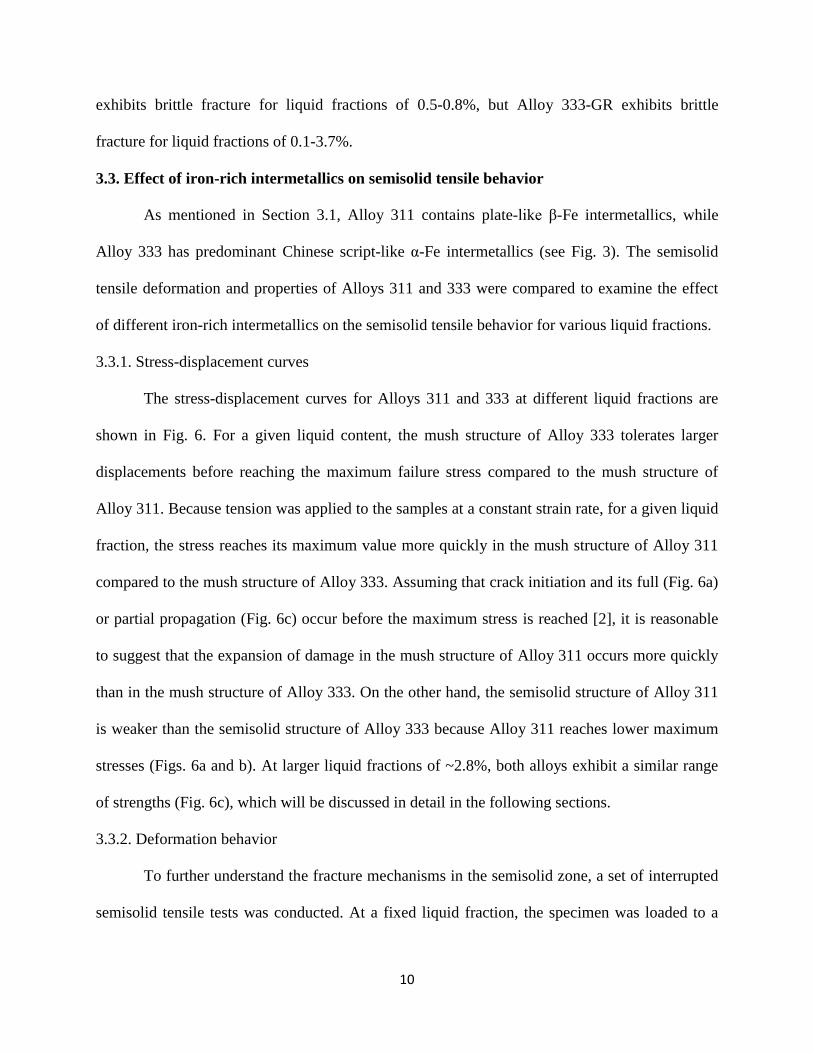
3.3.2. Deformation behavior
To further understand the fracture mechanisms in the semisolid zone, a set of interrupted
semisolid tensile tests was conducted. At a fixed liquid fraction, the specimen was loaded to a
11
limited deformation (corresponding to a predetermined displacement), and the test was
terminated. For one liquid fraction (corresponding to a single test temperature), different
displacements were applied. The minimum displacement was 0.03 mm and was increased in
increments of 0.01-0.02 mm. The unfractured specimens were carefully removed from the
testing machine and then sectioned and prepared for metallographic observation. These results
provide insight into the evolution of the semisolid microstructure during tensile deformation. The
tensile tests were conducted at liquid fractions in which both Alloys 311 and 333 exhibited
identical characteristics in the stress-displacement curves with similar maximum stress values.
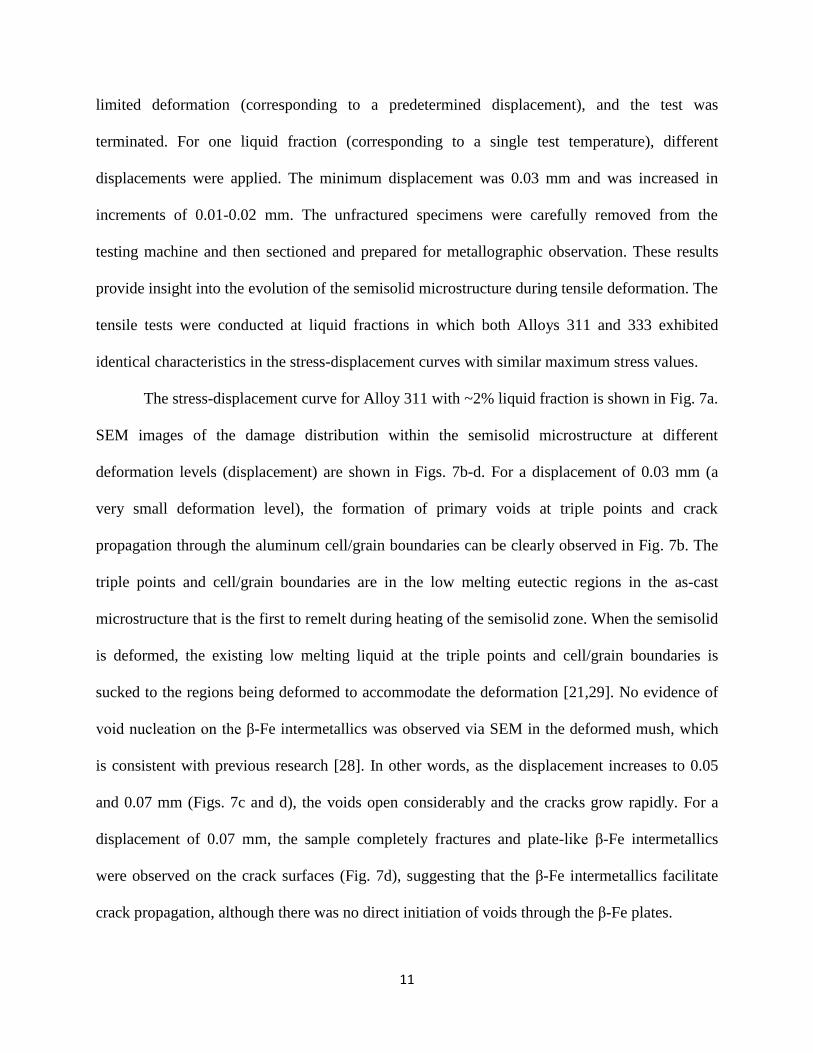
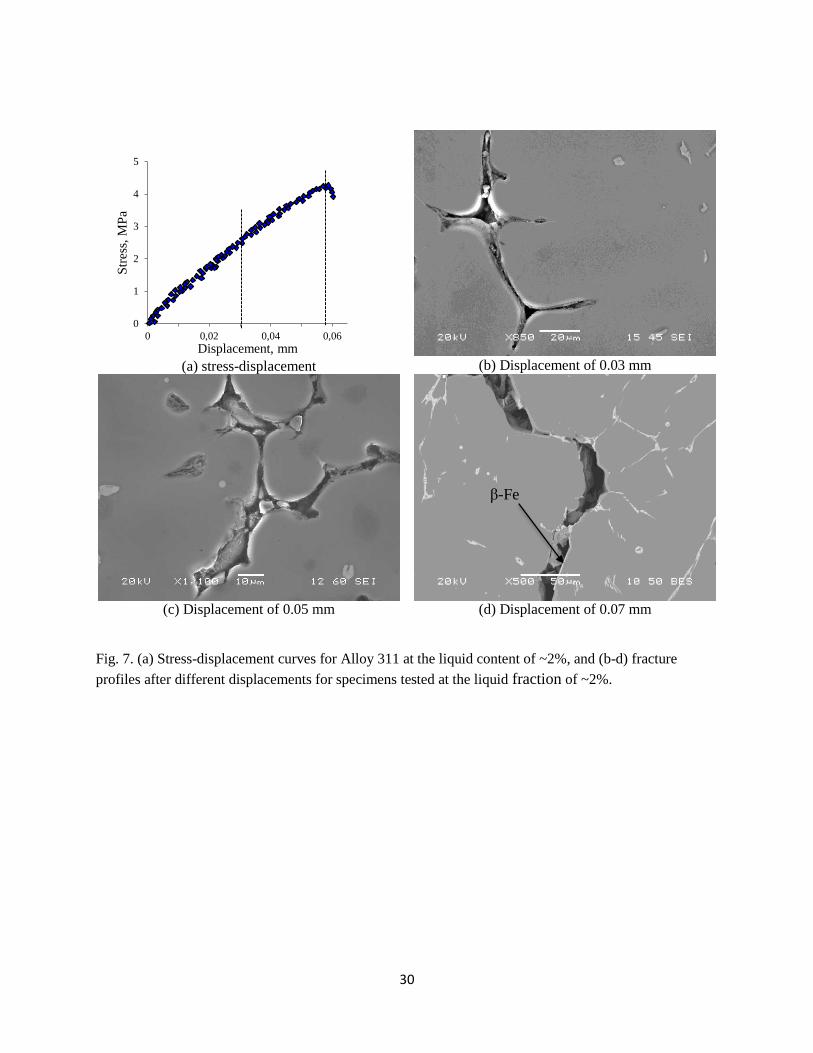
The stress-displacement curve for Alloy 311 with ~2% liquid fraction is shown in Fig. 7a.
SEM images of the damage distribution within the semisolid microstructure at different
deformation levels (displacement) are shown in Figs. 7b-d. For a displacement of 0.03 mm (a
very small deformation level), the formation of primary voids at triple points and crack
propagation through the aluminum cell/grain boundaries can be clearly observed in Fig. 7b. The
triple points and cell/grain boundaries are in the low melting eutectic regions in the as-cast
microstructure that is the first to remelt during heating of the semisolid zone. When the semisolid
is deformed, the existing low melting liquid at the triple points and cell/grain boundaries is
sucked to the regions being deformed to accommodate the deformation [21,29]. No evidence of
void nucleation on the β-Fe intermetallics was observed via SEM in the deformed mush, which
is consistent with previous research [28]. In other words, as the displacement increases to 0.05
and 0.07 mm (Figs. 7c and d), the voids open considerably and the cracks grow rapidly. For a
displacement of 0.07 mm, the sample completely fractures and plate-like β-Fe intermetallics
were observed on the crack surfaces (Fig. 7d), suggesting that the β-Fe intermetallics facilitate
crack propagation, although there was no direct initiation of voids through the β-Fe plates.
12
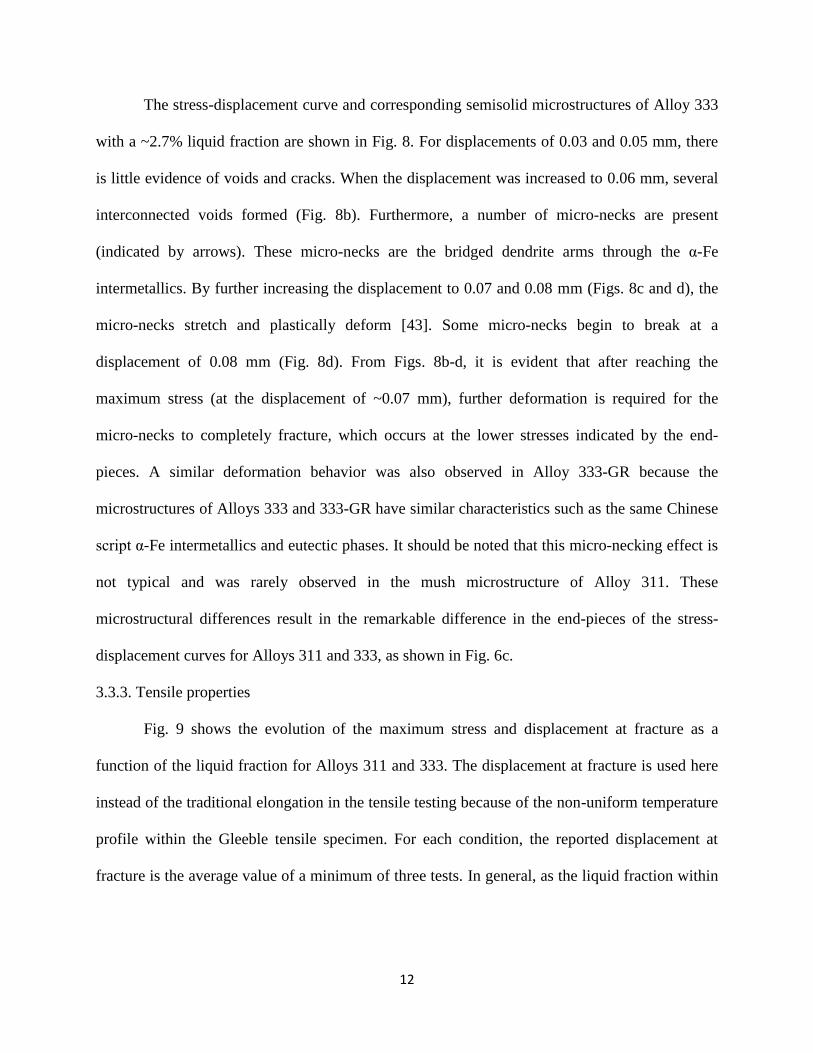
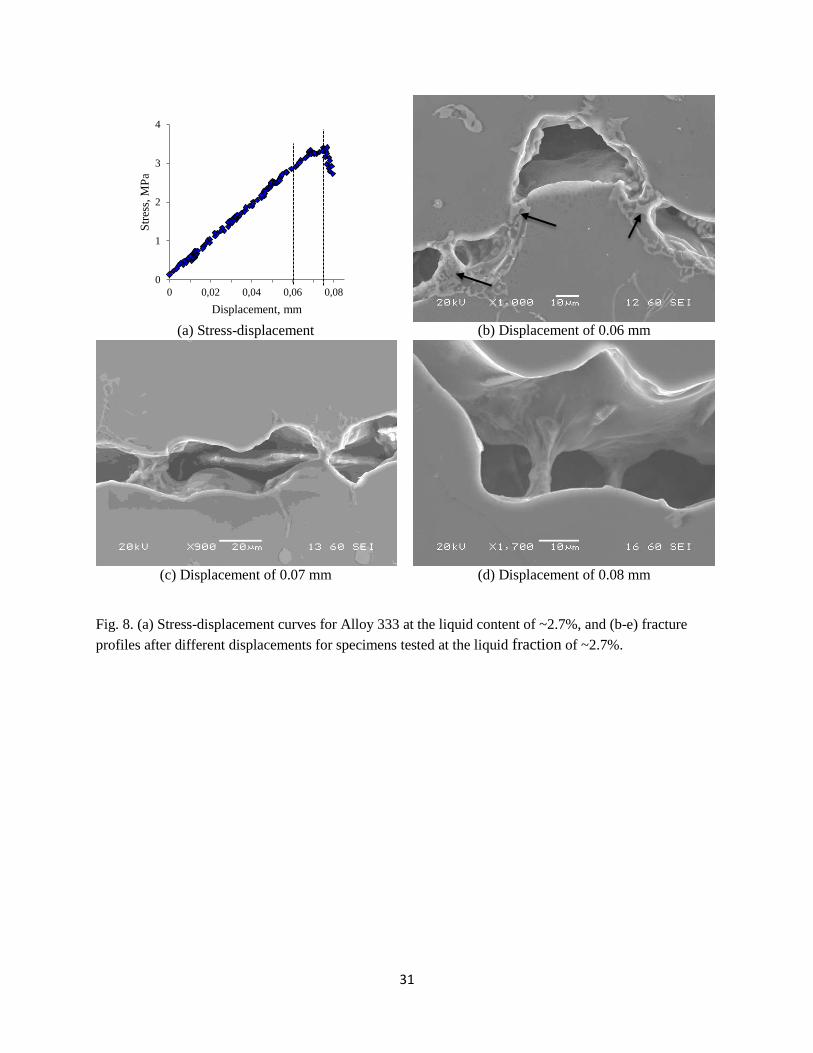
The stress-displacement curve and corresponding semisolid microstructures of Alloy 333
with a ~2.7% liquid fraction are shown in Fig. 8. For displacements of 0.03 and 0.05 mm, there
is little evidence of voids and cracks. When the displacement was increased to 0.06 mm, several
interconnected voids formed (Fig. 8b). Furthermore, a number of micro-necks are present
(indicated by arrows). These micro-necks are the bridged dendrite arms through the α-Fe
intermetallics. By further increasing the displacement to 0.07 and 0.08 mm (Figs. 8c and d), the
micro-necks stretch and plastically deform [43]. Some micro-necks begin to break at a
displacement of 0.08 mm (Fig. 8d). From Figs. 8b-d, it is evident that after reaching the
maximum stress (at the displacement of ~0.07 mm), further deformation is required for the
micro-necks to completely fracture, which occurs at the lower stresses indicated by the end-
pieces. A similar deformation behavior was also observed in Alloy 333-GR because the
microstructures of Alloys 333 and 333-GR have similar characteristics such as the same Chinese
script α-Fe intermetallics and eutectic phases. It should be noted that this micro-necking effect is
not typical and was rarely observed in the mush microstructure of Alloy 311. These
microstructural differences result in the remarkable difference in the end-pieces of the stress-
displacement curves for Alloys 311 and 333, as shown in Fig. 6c.
3.3.3. Tensile properties
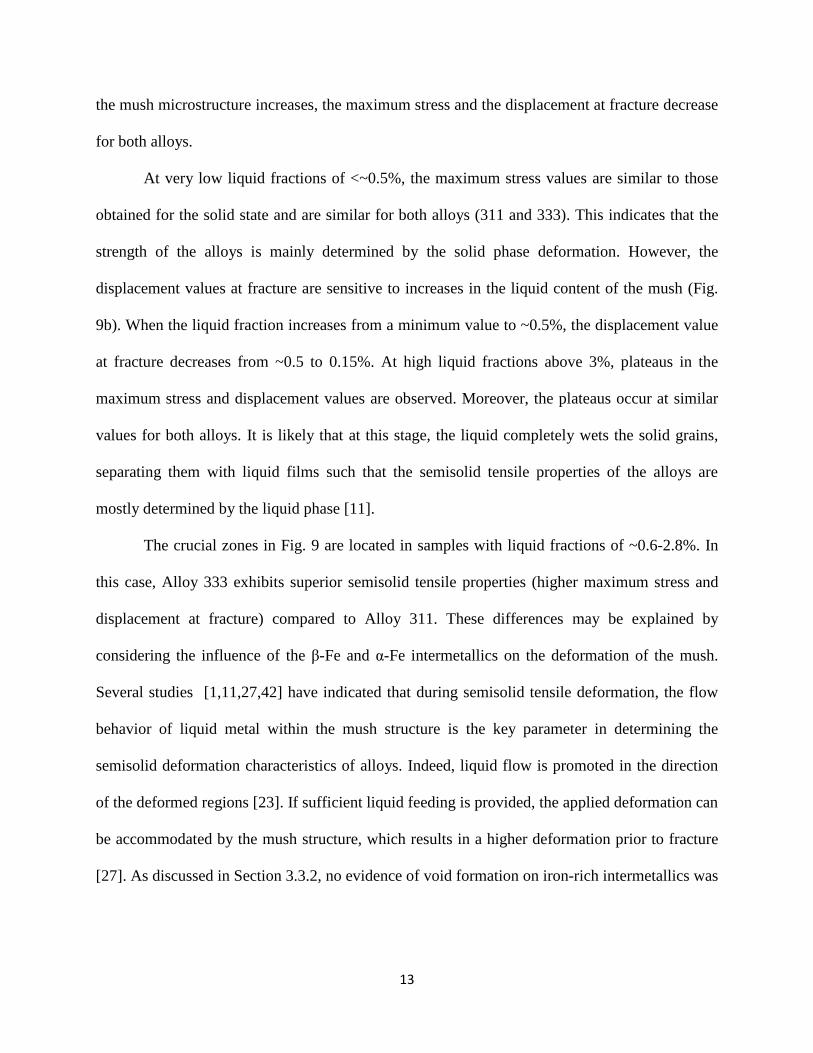
Fig. 9 shows the evolution of the maximum stress and displacement at fracture as a
function of the liquid fraction for Alloys 311 and 333. The displacement at fracture is used here
instead of the traditional elongation in the tensile testing because of the non-uniform temperature
profile within the Gleeble tensile specimen. For each condition, the reported displacement at
fracture is the average value of a minimum of three tests. In general, as the liquid fraction within
13
the mush microstructure increases, the maximum stress and the displacement at fracture decrease
for both alloys.
At very low liquid fractions of <~0.5%, the maximum stress values are similar to those
obtained for the solid state and are similar for both alloys (311 and 333). This indicates that the
strength of the alloys is mainly determined by the solid phase deformation. However, the
displacement values at fracture are sensitive to increases in the liquid content of the mush (Fig.
9b). When the liquid fraction increases from a minimum value to ~0.5%, the displacement value
at fracture decreases from ~0.5 to 0.15%. At high liquid fractions above 3%, plateaus in the
maximum stress and displacement values are observed. Moreover, the plateaus occur at similar
values for both alloys. It is likely that at this stage, the liquid completely wets the solid grains,
separating them with liquid films such that the semisolid tensile properties of the alloys are
mostly determined by the liquid phase [11].
The crucial zones in Fig. 9 are located in samples with liquid fractions of ~0.6-2.8%. In
this case, Alloy 333 exhibits superior semisolid tensile properties (higher maximum stress and
displacement at fracture) compared to Alloy 311. These differences may be explained by
considering the influence of the β-Fe and α-Fe intermetallics on the deformation of the mush.
Several studies [1,11,27,42] have indicated that during semisolid tensile deformation, the flow
behavior of liquid metal within the mush structure is the key parameter in determining the
semisolid deformation characteristics of alloys. Indeed, liquid flow is promoted in the direction
of the deformed regions [23]. If sufficient liquid feeding is provided, the applied deformation can
be accommodated by the mush structure, which results in a higher deformation prior to fracture
[27]. As discussed in Section 3.3.2, no evidence of void formation on iron-rich intermetallics was
14
observed. Therefore, the role of iron-rich intermetallics in the prevention of liquid feeding is
closely examined.
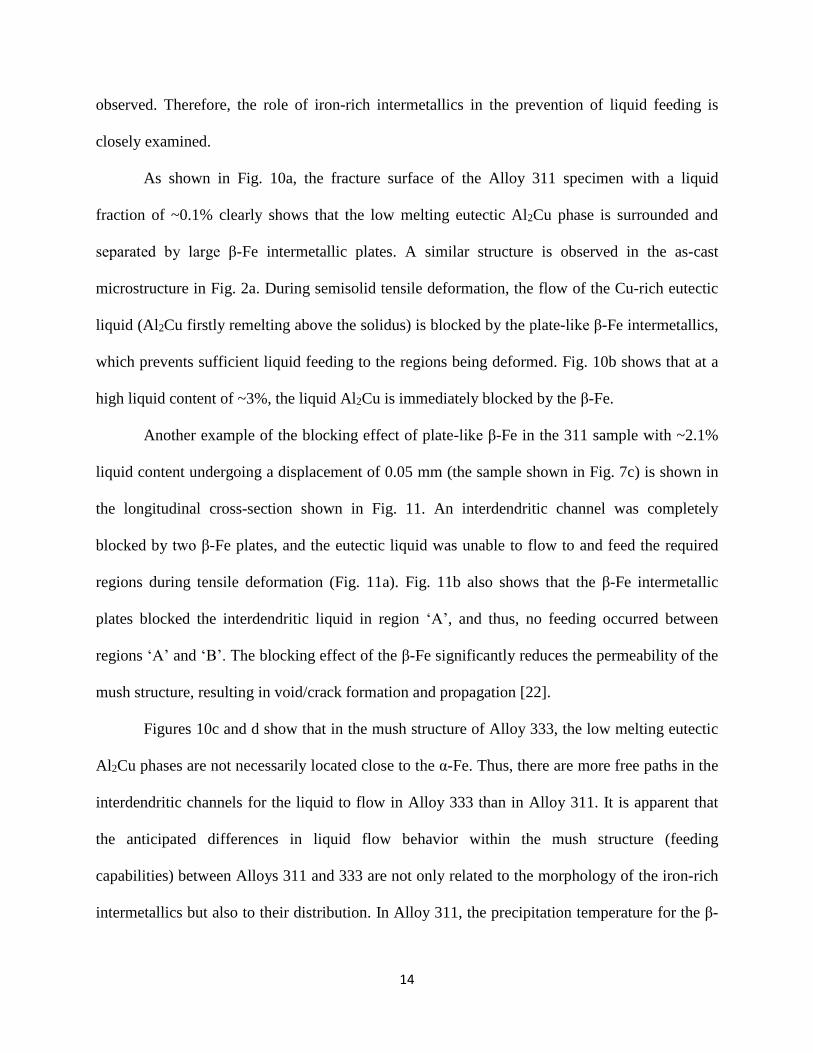
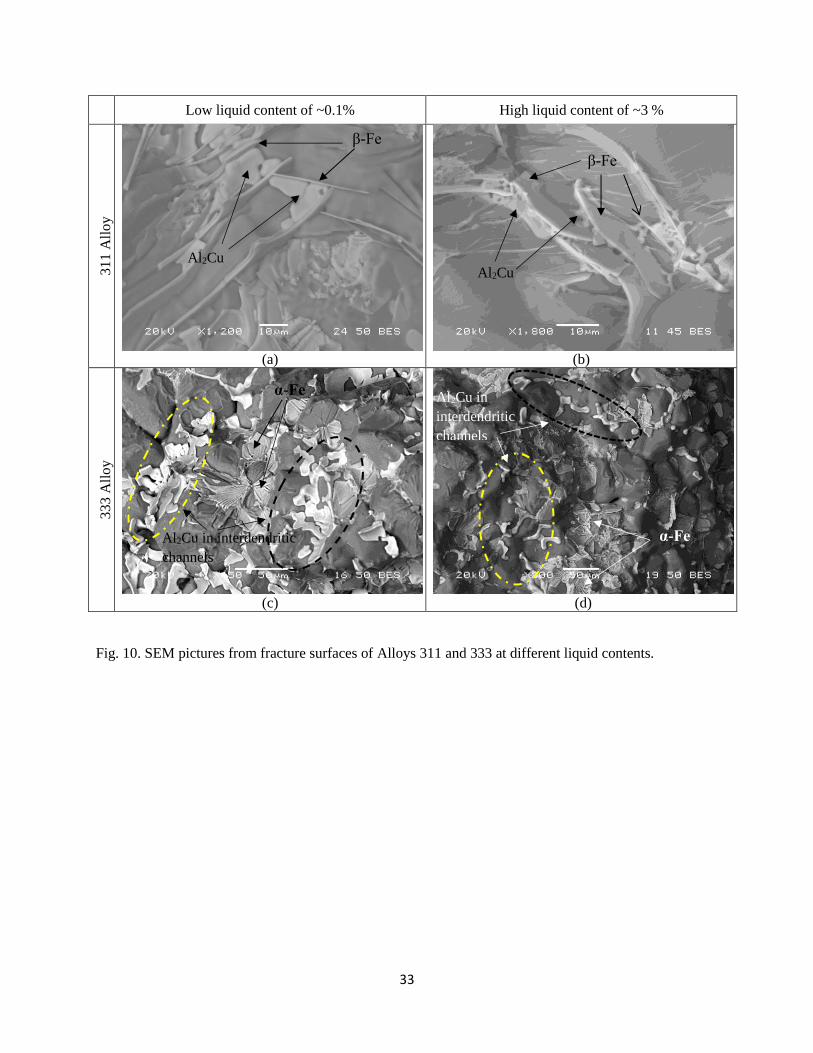
As shown in Fig. 10a, the fracture surface of the Alloy 311 specimen with a liquid
fraction of ~0.1% clearly shows that the low melting eutectic Al2Cu phase is surrounded and
separated by large β-Fe intermetallic plates. A similar structure is observed in the as-cast
microstructure in Fig. 2a. During semisolid tensile deformation, the flow of the Cu-rich eutectic
liquid (Al2Cu firstly remelting above the solidus) is blocked by the plate-like β-Fe intermetallics,
which prevents sufficient liquid feeding to the regions being deformed. Fig. 10b shows that at a
high liquid content of ~3%, the liquid Al2Cu is immediately blocked by the β-Fe.
Another example of the blocking effect of plate-like β-Fe in the 311 sample with ~2.1%
liquid content undergoing a displacement of 0.05 mm (the sample shown in Fig. 7c) is shown in
the longitudinal cross-section shown in Fig. 11. An interdendritic channel was completely
blocked by two β-Fe plates, and the eutectic liquid was unable to flow to and feed the required
regions during tensile deformation (Fig. 11a). Fig. 11b also shows that the β-Fe intermetallic
plates blocked the interdendritic liquid in region ‘A’, and thus, no feeding occurred between
regions ‘A’ and ‘B’. The blocking effect of the β-Fe significantly reduces the permeability of the
mush structure, resulting in void/crack formation and propagation [22].
Figures 10c and d show that in the mush structure of Alloy 333, the low melting eutectic
Al2Cu phases are not necessarily located close to the α-Fe. Thus, there are more free paths in the
interdendritic channels for the liquid to flow in Alloy 333 than in Alloy 311. It is apparent that
the anticipated differences in liquid flow behavior within the mush structure (feeding
capabilities) between Alloys 311 and 333 are not only related to the morphology of the iron-rich
intermetallics but also to their distribution. In Alloy 311, the precipitation temperature for the β-
15
Fe intermetallics is similar to the precipitation temperature for the Al2Cu eutectic phase [37].
Therefore, most of the β-Fe intermetallics are closely distributed and interlocked with the Al2Cu
eutectic phase (Figs. 2a and 10a). With their large and long plate-like morphology, β-Fe
intermetallics can easily block the interdendritic channels, thereby hindering the eutectic liquid
flow and feeding during semisolid deformation (Fig. 10b). In contrast, the α-Fe intermetallics
precipitate much earlier than the main eutectic phases because the precipitation temperature of
the α-Fe intermetallics is much higher than that of the Al2Cu or Al2Cu+Mg2Si eutectic phases
[37]. As a result, some of the α-Fe intermetallics may not be located in the interdendritic regions.
In addition, for the intermetallics located in the interdendritic regions, the α-Fe is less effective at
blocking flow than the β-Fe due its branched morphology. Therefore, the liquid can flow and
feed within the mush structure before it is blocked, allowing it to accommodate a larger amount
of deformation before fracture (Fig. 9b). It is generally believed that β-Fe intermetallics operate
as stress concentrators within the mush structure due to their morphology and distribution, which
weakens the mush [44]. The deleterious effect of β-Fe is clearly reflected in Fig. 9a in which
Alloy 311 exhibits considerably lower strengths compared to Alloy 333 for liquid fractions of
~0.6-2.8%.
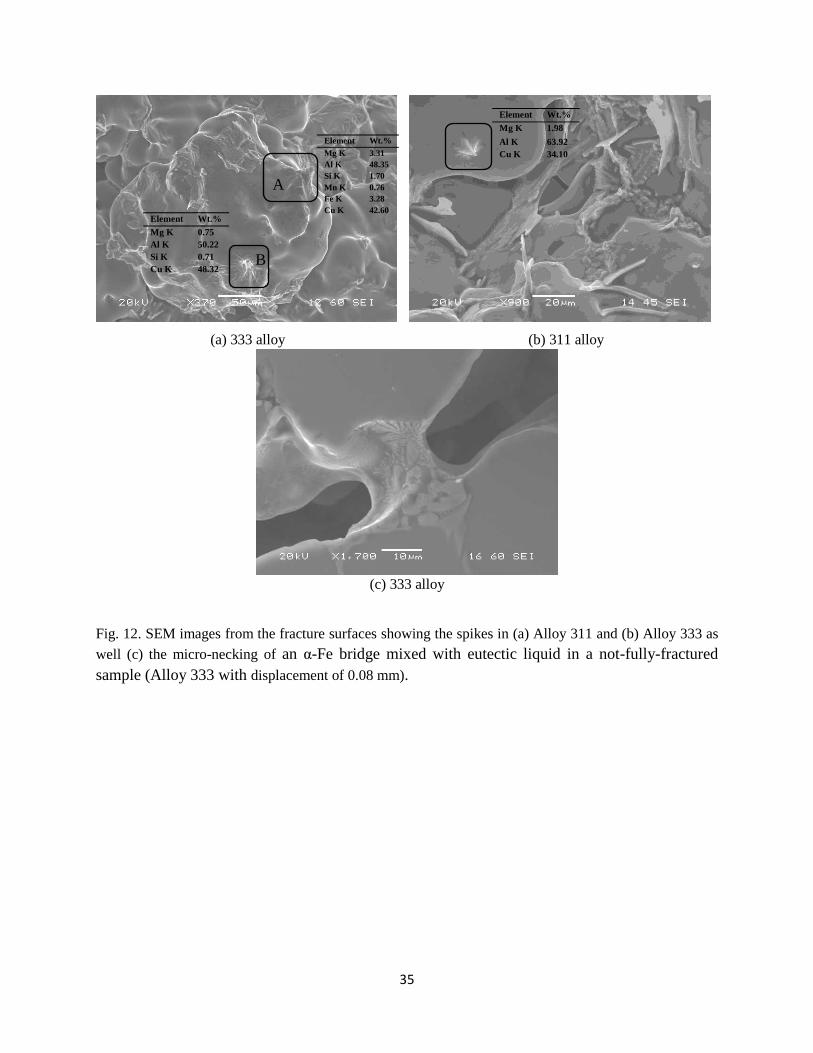
3.3.4. Spike formation
During semisolid failure, a number of small spikes are often observed on the fracture
surface after the semisolid tensile tests [27]. SEM images of the spikes along with their
approximate chemical compositions (as a reference) are shown in Figs. 12a and b for Alloys 311
and 333, respectively. In Alloy 333, spikes that, based on their chemical compositions, resulted
from either the necking of interdendritic α-Fe bridges (A in Fig. 12a) or the rupturing of
16
accumulated eutectic liquid (B in Fig. 12a) were frequently observed. However, in Alloy 311,
only a few spikes that formed via eutectic liquid rupturing were observed (Fig. 12b).
Recently, by utilizing synchrotron X-ray radiography, Phillion et al. [27] conducted in
situ observations of the semisolid deformation behavior of the Al-Cu system and proposed that
rupturing of the accumulated liquid was the principle source for the spikes. Farup et al. [6]
identified two spike formation mechanisms: (1) the necking of solid bridges at the grain
boundaries and (2) the break-up of the liquid phase. This study shows that depending on the
microstructure of the alloy, either of these mechanisms or a combination of both may contribute
to the semisolid tensile properties as well. For Alloy 311, although there are β-Fe bridges
between the aluminum dendrite cells/grains, the mechanism for necking through the solid
bridges is not active, due to the discontinuous nature of the individual large plates. On the other
hand, their plate-like morphology limits the liquid flow, and consequently, liquid accumulation
and rupturing rarely occur, suggesting that little plastic deformation occurs before failure. The
scenario is different for Alloy 333 with the Chinese script-like α-Fe. The eutectic liquid that
contains the Chinese script-like α-Fe may act as a continuous structure at the cell/grain
boundaries due to the branched morphology that sustains the deformation by necking. This
induces a further plastic deformation prior to final fracture. In a partially fractured sample
(loaded to 0.08 mm with a liquid fraction of 2.7%, Fig. 8), an α-Fe bridge mixed with eutectic
liquid at the interdendritic boundaries is shown in Fig. 12c. The collapse of these micro-necks
results in the formation of spikes on the fracture surfaces, indicating that plastic deformation
occurs during semisolid failure.
3.4. Influence of grain refinement on semisolid tensile properties
17
To examine the effect of the grain structure on the semisolid tensile behavior, the
semisolid tensile properties of Alloys 333 and 333-GR were compared. These alloys have the
same chemical compositions but different grain sizes (Fig. 4). The average grain size of Alloy
333-GR (94 µm) is significantly smaller than that of Alloy 333 (323 µm).
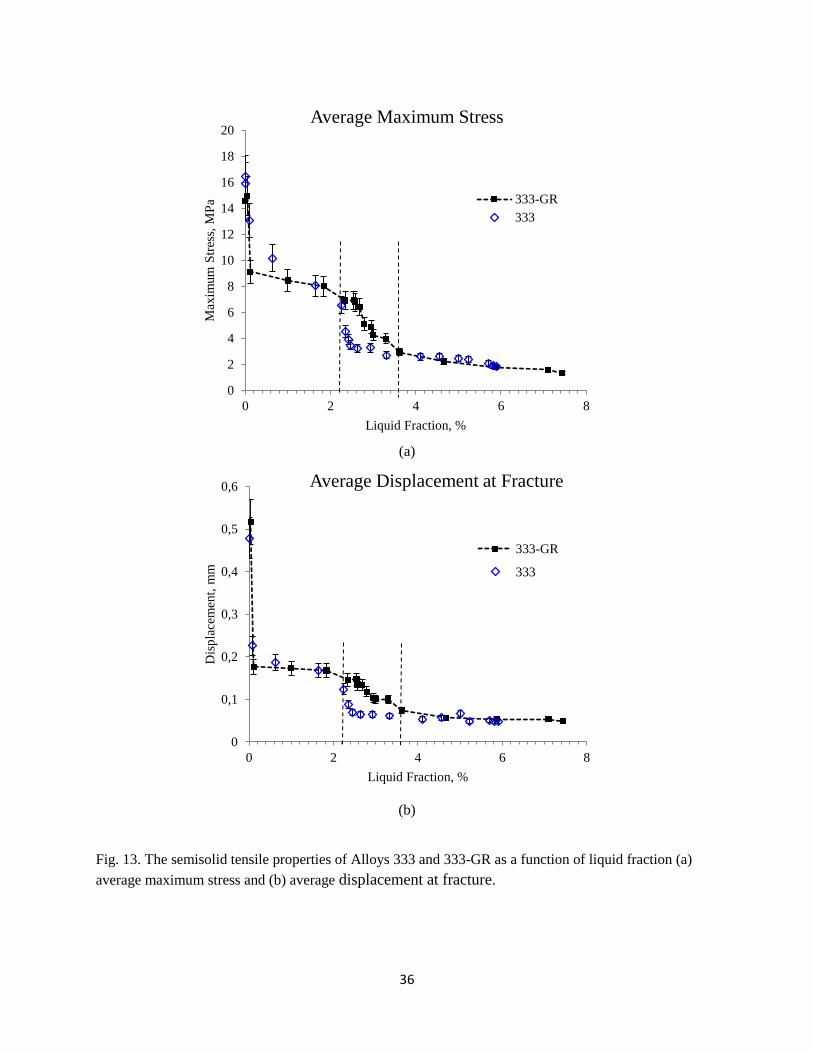
The semisolid tensile properties of Alloys 333 and 333-GR as a function of the liquid
fraction are shown in Fig. 13. At liquid fractions above ~4%, the tensile properties are nearly
identical for both alloys, indicating that the tensile properties are controlled by the liquid phase.
For both alloys (333-GR and 333) with liquid fractions of ~3.6-2.2%, a decrease in the liquid
fraction results in an increase in both the maximum stress and displacement values, followed by
a quasi-plateau. Ultimately, a rapid increase in the properties occurs at liquid contents of 0.6%
and 0.1% for Alloys 333 and 333-GR, respectively.
Although the general trend for the semisolid tensile properties of both alloys is similar,
the maximum stress and displacement at fracture of the alloy with fine grains (Alloy 333-GR)
are somewhat higher than those of the coarse-grained alloy (Alloy 333) for liquid fractions of
~2.2-3.6% (Fig. 13). In this liquid fraction range, a continuous liquid layer/film is assumed to
exist in the interdendritic regions. In the alloy with fine grains, the liquid is distributed more
uniformly around the dendrites and there are more α-Al grain bridges, which lead to a higher
strength and increased displacement at fracture. As the liquid fraction decreases, the liquid
layer/film becomes discontinuous and the effect of the fine grains is weaker. Therefore, both
alloys exhibit a quasi-plateau with similar semisolid properties.
As discussed earlier, Alloy 333 containing the Chinese script-like α-Fe has remarkably
higher semisolid tensile properties during the last stage of solidification compared to Alloy 311
containing the plate-like β-Fe (Fig. 9). This indicates that the α-Fe intermetallics in Al-Cu 206
18
alloys play a major role affecting the semisolid tensile behavior near the solidus. On the other
hand, for the grain-refined alloy (Alloy 333-GR containing the same α-Fe as Alloy 333), a
moderate improvement in the semisolid properties is observed. It is suggested that with the same
iron-rich intermetallic phase in the microstructure, the grain refinement can give a supplementary
benefit on semisolid tensile properties.
3.5. Application to hot tearing
Classical hot tearing is considered as the inability of a material to accommodate stress
and strain during the last stage of solidification and is linked to the intrinsic mechanical
properties of the mush state and the interdendritic liquid flow. Generally, the mush structure
dominated by α-Fe (Alloy 333) has a higher load-bearing capacity compared to the mush
structure dominated by β-Fe (Alloy 311) for liquid fractions of ~1-3% (Fig. 9a). Thus, under the
same solidification conditions, the stress arising from solidification shrinkage and thermal
contraction that provokes catastrophic failure (hot tearing) is higher for the mush structure
dominated by α-Fe (Alloy 333). On the other hand, Alloy 333 can sustain more deformation
before failure and is more ductile (Fig. 9b). The higher stress and ductility result in a lower
susceptibility to hot tearing in Alloy 333.
A critical transition for hot tearing can be defined as the critical liquid content for
stress/ductility below which the load-bearing capacity of the mush structure sharply increases
and the ductility is rapidly enhanced, which allow it to sustain a noticeable amount of
deformation prior to failure [2, 3]. As shown in Fig. 9, as the liquid content during the last stage
of solidification decreases, the stress/ductility dramatically increases at deformations of ~1% and
~3% for Alloys 311 and 333, respectively. This indicates that Alloy 333 can sustain the stress
and deformation earlier and at higher liquid contents than Alloy 311. At the critical liquid
19
content, the interdendritic liquid film separation is the main failure mechanism for the mush
structure due to the very low permeability of the structure [42]. This means that if an appropriate
stress is applied to the mush structure to create a void/crack, the crack will propagate easily with
only limited resistance to mush deformation. Therefore, it is reasonable to believe that a lower
critical liquid content for stress/ductility indicates a higher susceptibility of a material to hot
tearing. The critical liquid content for Alloy 311, which is dominated by β-Fe, is much lower
than that of Alloy 333 containing α-Fe (~1% vs. ~3%). In addition to the reduced interdendritic
feeding for potential crack healing in Alloy 311 (see Section 3.3.3), it can be concluded that the
mush structure of Alloy 311 is more prone to hot tearing than the mush structure of Alloy 333.
As shown in Fig. 13, the semisolid tensile properties of Alloys 333 and 333-GR are only
moderately different. Hence, a significant improvement in the hot tear resistance as a result of
grain refinement of the same α-Fe-containing microstructure cannot be expected. However, in
Alloy 333-GR, the critical liquid content for stress/ductility occurs at ~4% compared to ~3% in
Alloy 333 (Fig. 13). Therefore, Alloy 333-GR is less susceptible to hot tearing than Alloy 333.
Additionally, it should be noted that during the semisolid tensile tests, the applied tension
(stress-displacement) represents the intentionally induced voids/cracks and deformation in the
mush structure. Moreover, it has been shown that the hot tearing failure mechanism of the mush
structure follows the formation of voids/cracks and their growth within the structure [27]. Once
the voids/cracks form, an increased stress is required for the voids/cracks to propagate, which
leads to final failure (hot tearing). Therefore, the rate at which the stress increases with the
displacement (strain) can be used to evaluate the hot tearing susceptibility. For similar liquid
contents, hot tearing is more likely to occur at higher rates. In the present work, the rate (𝑑𝜎
𝑑𝜇) of
increase in the stress (σ) as a function of the displacement (μ) has been calculated for Alloys 311,

20
333 and 333-GR (Figs. 6 and 14). It is found that 𝑑𝜎
𝑑𝜇 is always higher in Alloy 311 than in Alloy
333 (Fig. 6), indicating that Alloy 311 has a higher susceptibility to hot tearing, which is
consistent with the fact that Al-Cu 206 alloys containing β-Fe intermetallics are very prone to hot
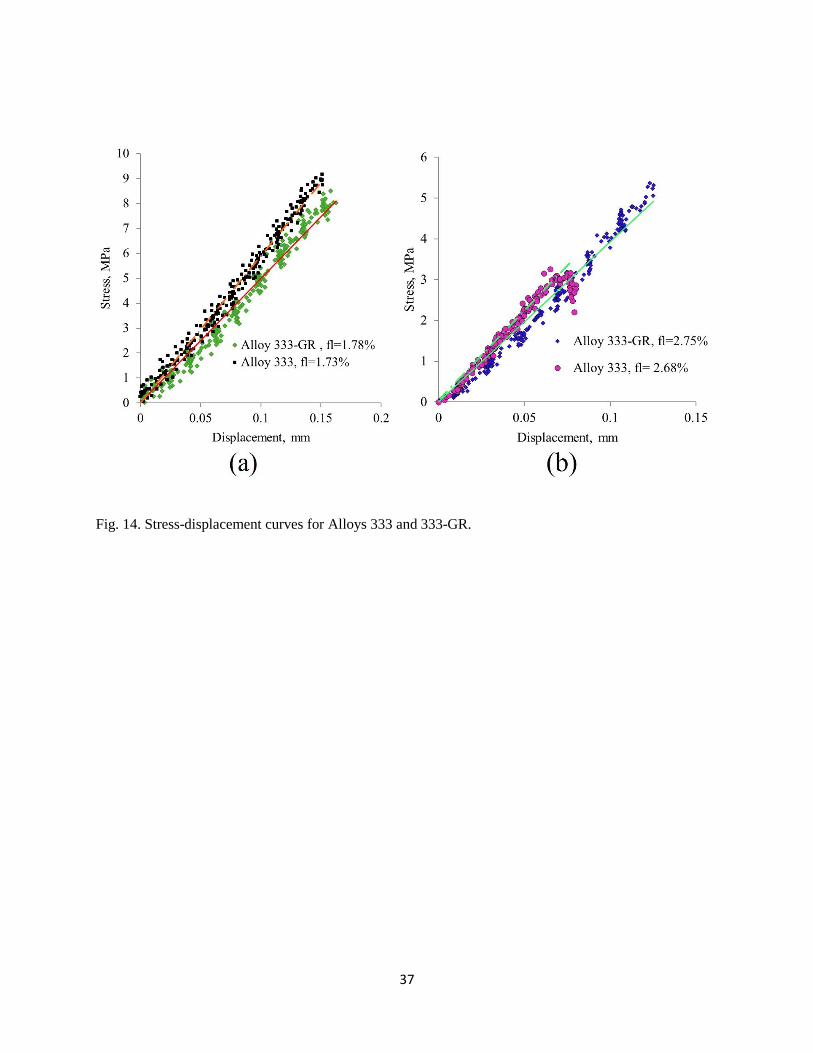
tearing [28]. The stress-displacement curves for Alloys 333 and 333-GR are shown in Fig. 14 for
two liquid fractions. Alloy 333-GR has a lower 𝑑𝜎
𝑑𝜇 compared to Alloy 333, demonstrating that
grain refinement increases the resistance to hot tearing, although it may be limited in the current
study.
4. Conclusions
(1) The effects of iron-rich intermetallics on the semisolid tensile behavior of Al-Cu 206 alloys
are significant. The tensile properties (the maximum stress and displacement at fracture) of
the alloy dominated by α-Fe are generally higher than those of the alloy dominated by β-Fe
for liquid fractions of ~0.6-2.8%. The mush structure dominated by α-Fe has a higher load-
bearing capacity and can sustain more deformation before failure compared to the mush
structure dominated by β-Fe, resulting in a lower susceptibility to hot tearing.
(2) Although no evidence of void formation on the β-Fe intermetallics was observed, the
interdendritic liquid channels are clearly blocked by the plate-like β-Fe, which hinders liquid
flow and feeding during semisolid deformation. In contrast, interdendritic liquid flow occurs
more freely within the mush structure containing Chinese script-like α-Fe due to their
branched morphology and distribution.
(3) Comparing the semisolid tensile properties of the alloys containing α-Fe with different grain
sizes, the maximum stress and displacement at fracture of the alloy with finer grains were
21
moderately higher for liquid fractions of ~ 2.2 to 3.6%, indicating a supplementary benefit
of the grain refinement on semisolid mechanical properties.
(4) The critical liquid content for stress/ductility and the rate of the stress increase with respect to
the displacement in the semisolid tensile tests are proposed as indicators of the hot tearing
susceptibility of aluminum alloys.
Acknowledgments
The authors would like to acknowledge the financial support from the Natural Sciences and
Engineering Research Council of Canada (NSERC) and from Rio Tinto Aluminum through the
NSERC Industrial Research Chair in Metallurgy of Aluminum Transformation at the University
of Québec at Chicoutimi. The authors would also like to thank Ms. E. Brideau and Mr. Dany
Racine for their assistance during the semisolid tensile tests performed on the Gleeble 3800
thermomechanical simulator.
References
1. K. M. Kareh, P. D. Lee, R. C. Atwood, T. Connolley, and C. M. Gourlay: Nat Commun., 2014
vol. 5.
2. L. J. Colley, M. A. Wells, and D. M. Maijer: Mater. Sci. Eng. A, 2004, vol. 386, pp.140–48
(2004).
3. A. B. Phillion, S. Thompson, S. L. Cockcroft, and M. A. Wells: Mater. Sci. Eng. A, 2008, vol.
497, pp. 388–94.
4. W. M. Van Haaften, W. H. Kool, and L. Katgerman: Mater. Sci. Eng. A, 2002, vol. 336, pp.
1–6 (2002).
5. G. Chen, J. Jiang, Z. Du, F. Han, and H. V. Atkinson: Mater. Des., 2014, vol. 54, pp. 1–5.
6. I. Farup, J. M. Drezet, and M. Rappaz: Acta Mater., 2011, vol. 49, pp. 1261–69.
7. D. G. Eskin, Suyitno, and L. Katgerman: Prog. Mater. Sci., 2004, vol. 49, pp. 629–711.
8. D. G. Eskin and L. Katgerman: Metall. Mater. Trans. A, 2007, vol. 38, pp. 1511–19.
9. E. Giraud, M. Suery, and M. Coret: Metall. Mater. Trans. A, 2011 vol. 42, pp. 3370–77.
10. O. Ludwig, J. M. Drezet, P. Ménésès, C. L. Martin, and M. Suéry: Mater. Sci. Eng. A, 2005,
22
vol. 413–414, pp. 174–79.
11. D. Fabrègue, A. Deschamps, M. Suery, and J. M. Drezet: Acta Mater., 2006, vol. 54, pp.
5209–20.
12. A. K. Dahle, T. Sumitomo, and S. Instone: Metall. Mater. Trans. A, 2003, vol. 34, pp. 105-
13.
13. A. K. Dahle and L. Arnberg: Acta Mater., 1997, vol. 45, pp. 547–59.
14. A. Alankar and M. A. Wells: Mater. Sci. Eng. A, 2010, vol. 527, pp. 7812–20.
15. S. M. Mohseni, A. B. Phillion, and D. M. Maijer: Mater. Sci. Eng. A, 2016, vol. 649, pp.
382–89.
16. V. Mathier, P.-D. Grasso, and M. Rappaz: Metall. Mater. Trans. A, 2008, vol. 39, 1399–
1409.
17. E. Giraud, M. Suery, and M. Coret: Metall. Mater. Trans. A, 2010, vol. 41, pp. 2257–68.
18. J. Liu, L. Qi, P. Liu, J. Guan, and J. Zhou: Mater. Sci. Eng. A, 2014, vol. 596, pp. 157–64.
19. A. B. Phillion, S. L. Cockcroft, and P. D. Lee: Mater. Sci. Eng. A, 2008, vol 491, pp. 237–47.
20. C. Puncreobutr, A. B. Phillion, J. L. Fife, P. Rockett, A. P. Horsfield, and P. D. Lee: Acta
Mater., 2014, vol. 79, pp. 292–303.
21. B. Cai, S. Karagadde, L. Yuan, T. J. Marrow, T. Connolley, and P. D. Lee: Acta Mater.,
2014, vol. 76, pp. 371–80.
22. C. Puncreobutr, A. B. Phillion, J. L. Fife, and P. D. Lee: Acta Mater., 2014, vol. 64, pp. 316–
25.
23. M. Sistaninia, A. B. Phillion, J. M. Drezet, and M. Rappaz: Acta Mater., 60, 6793 (2012).
24. A. B. Phillion, P. D. Lee, E. Maire, and S. L. Cockcroft: Metall. Mater. Trans. A, 2008, vol.
39, 2459–69.
25. D. Fabrègue, a. Deschamps, M. Suéry, and W. J. Poole: Metall. Mater. Trans. A, 2006, vol.
37, pp. 1459–67.
26. O. Ludwig, J.-M. Drezet, C. L. Martin, and M. Suéry: Metall. Mater. Trans. A, 2005, vol. 36,
pp. 1525–35.
27. A. B. Phillion, R. W. Hamilton, D. Fuloria, A. C. L. Leung, P. Rockett, T. Connolley, and P.
D. Lee: Acta Mater., 2011, vol. 59, pp. 1436–44.
28. C. Puncreobutr, P. D. Lee, K. M. Kareh, T. Connolley, J. L. Fife, and A. B. Phillion: Acta
Mater., 2014, vol. 68, pp. 42–51.
29. S. Terzi, L. Salvo, M. Suéry, N. Limodin, J. Adrien, E. Maire, Y. Pannier, M. Bornert, D.
Bernard, M. Felberbaum, M. Rappaz, and E. Boller: Scr. Mater., 2009, vol. 61, pp. 449–52.
30. K. Hu, A. B. Phillion, D. M. Maijer, and S. L. Cockcroft: Scr. Mater., 2009, vol. 60, pp. 427–
30.
31. L. Sweet, M. A. Easton, J. A. Taylor, J. F. Grandfield, C. J. Davidson, L. Lu, M. J. Couper,
and D. H. Stjohn:Metall. Mater. Trans. A, 2013, vol. 44, pp. 5396–5407.
23
32. G. K. Sigworth and J. Major: TMS Light Met., 2006,pp. 795–800
33. G. K. Sigworth and F. DeHart: Trans. Am. Foundry Soc., 2003 vol. 111, pp. 341–45.
34. G. K. Sigworth, AMD 305 Final Report, USCAR, 2002.
35. F. D’Elia, C. Ravindran, D. Sediako, K. U. Kainer, and N. Hort: Mater. Des., 2014, vol. 64,
pp. 44–55.
36. H. Kamguo Kamga, D. Larouche, M. Bournane, and A. Rahem: Mater. Sci. Eng. A, 2010,
vol. 527, pp. 7413–23.
37. K. Liu, X. Cao, and X.-G. Chen: Metall. Mater. Trans. A, 2011, vol. 42, pp. 2004–16.
38. K. Liu, X. Cao, and X. G. Chen: Metall. Mater. Trans. B, 2012, vol. 43, pp. 1231–40.
39. K. Liu, X. Cao, and X.-G. Chen: Metall. Mater. Trans. A, 2014, vol. 45, pp. 2498–2507.
40. K. Liu, X. Cao, and X.-G. Chen: Metall. Mater. Trans. B, 2015, vol. 46, pp. 1566–75.
41. Y. Birol: J. Alloys Compd., 2009, vol. 486, pp. 173–77.
42. M. Rappaz, J.-M. Drezet, and M. Gremaud: Metall. Mater. Trans. A, 1999, vol. 30, pp. 449–
55.
43. H. Nagaumi, S. Suzuki, T. Okane, and T. Umeda: Metall. Mater. Trans. A, 2006, vol. 47, pp.
2821–27.
44. L. Sweet, S. M. Zhu, S. X. Gao, J. A. Taylor, and M. A. Easton: Metall. Mater. Trans. A,
2011, vol. 42, pp. 1737–49.
Table
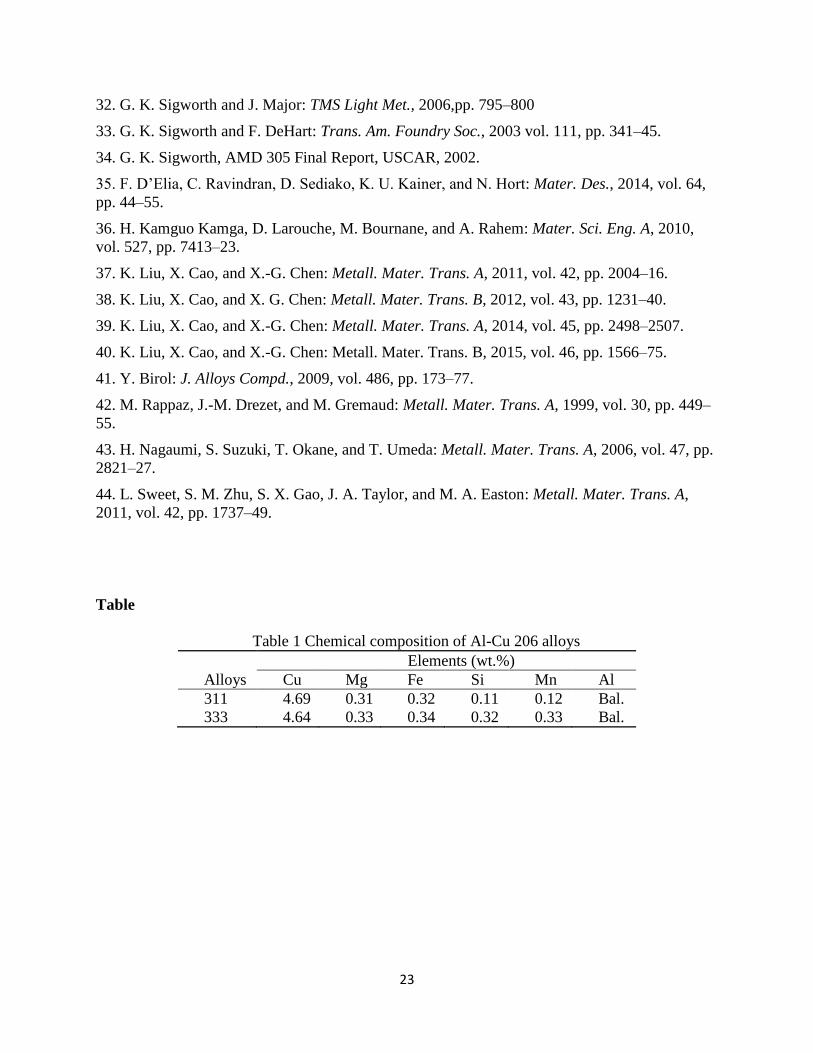
Table 1 Chemical composition of Al-Cu 206 alloys
Elements (wt.%)
Alloys Cu Mg Fe Si Mn Al
311 4.69 0.31 0.32 0.11 0.12 Bal.
333 4.64 0.33 0.34 0.32 0.33 Bal.
24
Figure captions
Fig. 1. (a) Image for specimen configuration and the position of thermocouples and (b)
temperature distribution profiles along the length of specimens.
Fig. 2. Liquid fraction as a function of temperature (a) Alloy 311 and (b) Alloy 333 with inserts
of the enlargement near solidus temperature.
Fig. 3. As-cast microstructures of samples (a) Alloy 311, (b) Alloy 333 and (c) Alloy 333-GR.
Fig. 4. EBSD maps for grain size analyses (a) Alloy 311, (b) Alloy 333 and (c) Alloy 333-GR.
Fig. 5. Stress-displacement curves for Alloy 333 at different liquid fractions.
Fig. 6. Stress-displacement curves for Alloys 311 and 333 at different liquid fractions.
Fig. 7. (a) Stress-displacement curves for Alloy 311 at the liquid content of ~2%, and (b-d)
fracture profiles after different displacements for specimens tested at the liquid fraction of ~2%.
Fig. 8. (a) Stress-displacement curves for Alloy 333 at the liquid content of ~2.7%, and (b-e)
fracture profiles after different displacements for specimens tested at the liquid fraction of
~2.7%.
Fig. 9. The semisolid tensile properties of Alloys 311 and 333 as a function of liquid fraction (a)
average maximum stress and (b) average displacement at fracture.
Fig. 10. SEM pictures from fracture surfaces of Alloys 311 and 333 at different liquid contents.
Fig. 11. Fracture profiles of Alloy 311 after 0.05 mm displacements for a specimen tested at
liquid fraction of ~2%.
Fig. 12. SEM images from the fracture surfaces showing the spikes in (a) Alloy 311 and (b)
Alloy 333 as well (c) the micro-necking of an α-Fe bridge mixed with eutectic liquid in a not-
fully-fractured sample (Alloy 333 with displacement of 0.08 mm).
Fig. 13. The semisolid tensile properties of Alloys 333 and 333-GR as a function of liquid
fraction (a) average maximum stress and (b) average displacement at fracture.
Fig. 14. Stress-displacement curves for Alloys 333 and 333-GR
25
Figures
Fig. 1. (a) Image for specimen configuration and the position of thermocouples and (b) temperature
distribution profiles along the length of specimens.
26
Fig. 2. Liquid fraction as a function of temperature (a) Alloy 311 and (b) Alloy 333 with inserts of the
enlargement near solidus temperature.
(a)
(b)
(c)
Fig. 3. As-cast microstructures of samples (a) Alloy 311, (b) Alloy 333 and (c) Alloy 333-GR.
Al2Cu
311 333
α-Fe
Mg2Si+Al
2Cu
α-Fe
β-Fe
Al2Cu
Mg2Si+Al
2Cu
Al2Cu
333-GR
27
(a)
(b)
(c)
Fig. 4. EBSD maps for grain size analyses (a) Alloy 311, (b) Alloy 333 and (c) Alloy 333-GR.
28
Fig. 5. Stress-displacement curves for Alloy 333 at different liquid fractions.
(a)
(b)
(c)
(d)
0
2
4
6
8
10
12
14
16
18
0 1 2 3 4
Str
ess,
MP
a
Displacement, mm
Stress-Displacement, 781K (508 °C) and
fl=0
0
2
4
6
8
10
12
14
16
18
0 0,1 0,2 0,3 0,4 0,5
Str
ess,
MP
a
Displacement, mm
Stress-Displacement, fl=0.02%
0
2
4
6
8
10
12
14
0 0,05 0,1 0,15 0,2 0,25
Str
ess,
MP
a
Displacement, mm
Stress-Displacement, fl=0.1%
Stress-Displacement, fl=1.65%
Stress-Displacement, fl=2.25%
0
1
2
3
4
5
0 0,03 0,06 0,09 0,12
Sre
ss,
MP
a
Displacement, mm
Stress-Displacement, fl=2.56%
Stress-Displacement, fl=3.09%
Stress-Displacement, fl=5.71%
End-piece
29
(a)
(b)
(c)
Fig. 6. Stress-displacement curves for Alloys 311 and 333 at different liquid fractions.
0
2
4
6
8
10
12
0 0,03 0,06 0,09 0,12 0,15 0,18
Str
ess,
MP
a
Displacement, mm
311 alloy, fl=0.61%
333 alloy, fl=0.65%
0
2
4
6
8
10
12
0 0,03 0,06 0,09 0,12 0,15 0,18S
tres
s, M
Pa
Displacement, mm
311 alloy, fl=1.55%
333 alloy, fl=1.61%
0
1
2
3
4
0 0,02 0,04 0,06 0,08 0,1 0,12 0,14
Str
ess,
MP
a
Displacement, mm
311 alloy, fl=2.76%
333 alloy, fl=2.82%
30
(a) stress-displacement
(b) Displacement of 0.03 mm
(c) Displacement of 0.05 mm (d) Displacement of 0.07 mm
Fig. 7. (a) Stress-displacement curves for Alloy 311 at the liquid content of ~2%, and (b-d) fracture
profiles after different displacements for specimens tested at the liquid fraction of ~2%.
0
1
2
3
4
5
0 0,02 0,04 0,06
Str
ess,
MP
a
Displacement, mm
β-Fe
31
(a) Stress-displacement
(b) Displacement of 0.06 mm
(c) Displacement of 0.07 mm
(d) Displacement of 0.08 mm
Fig. 8. (a) Stress-displacement curves for Alloy 333 at the liquid content of ~2.7%, and (b-e) fracture
profiles after different displacements for specimens tested at the liquid fraction of ~2.7%.
0
1
2
3
4
0 0,02 0,04 0,06 0,08
Str
ess,
MP
a
Displacement, mm

32
(a)
(b)
Fig. 9. The semisolid tensile properties of Alloys 311 and 333 as a function of liquid fraction (a) average
maximum stress and (b) average displacement at fracture.
0
2
4
6
8
10
12
14
16
18
0 1 2 3 4 5 6
Max
imu
m S
tres
s, M
Pa
Liquid Fraction, %
Average Maximum Stress
333 (α-Fe)
311 (β-Fe)
0
0,1
0,2
0,3
0,4
0,5
0,6
0 1 2 3 4 5 6
Dis
pla
cem
ent,
mm
Liquid Fraction, %
Average Displacement at Fracture
333 (α-Fe)
311 (β-Fe)
Liquid
content = 0%
33
Low liquid content of ~0.1% High liquid content of ~3 % 3
11
All
oy
(a)
(b)
333 A
lloy
(c)
(d)
Fig. 10. SEM pictures from fracture surfaces of Alloys 311 and 333 at different liquid contents.
Al2Cu
β-Fe
Al2Cu in interdendritic
channels
Al2Cu in
interdendritic
channels
α-Fe
α-Fe
β-Fe
Al2Cu

34
(a)
(b)
Fig. 11. Fracture profiles of Alloy 311 after 0.05 mm displacements for a specimen tested at liquid
fraction of ~2%.
A
B β-Fe
β-Fe
35
(a) 333 alloy
Element Wt.%
Mg K 3.31
Al K 48.35
Si K 1.70
Mn K 0.76
Fe K 3.28
Cu K 42.60 Element Wt.%
Mg K 0.75
Al K 50.22
Si K 0.71
Cu K 48.32
(b) 311 alloy
Element Wt.%
Mg K 1.98
Al K 63.92
Cu K 34.10
(c) 333 alloy
Fig. 12. SEM images from the fracture surfaces showing the spikes in (a) Alloy 311 and (b) Alloy 333 as
well (c) the micro-necking of an α-Fe bridge mixed with eutectic liquid in a not-fully-fractured
sample (Alloy 333 with displacement of 0.08 mm).
A
B
36
(a)
(b)
Fig. 13. The semisolid tensile properties of Alloys 333 and 333-GR as a function of liquid fraction (a)
average maximum stress and (b) average displacement at fracture.
0
2
4
6
8
10
12
14
16
18
20
0 2 4 6 8
Max
imum
Str
ess,
MP
a
Liquid Fraction, %
Average Maximum Stress
333-GR
333
0
0,1
0,2
0,3
0,4
0,5
0,6
0 2 4 6 8
Dis
pla
cem
ent,
mm
Liquid Fraction, %
Average Displacement at Fracture
333-GR
333
37
Fig. 14. Stress-displacement curves for Alloys 333 and 333-GR.