effects of drought on xylem anatomy and water-use...
TRANSCRIPT
Effects of Drought on Xylem Anatomy and Water-Use Efficiency of Two Co-Occurring Pine Species
Item Type Article
Authors Martin-Benito, Dario; Anchukaitis, Kevin; Evans, Michael; del Río,Miren; Beeckman, Hans; Cañellas, Isabel
Citation Effects of Drought on Xylem Anatomy and Water-Use Efficiency ofTwo Co-Occurring Pine Species 2017, 8 (9):332 Forests
DOI 10.3390/f8090332
Publisher MDPI AG
Journal Forests
Rights © 2017 by the authors. Licensee MDPI, Basel, Switzerland. Thisarticle is an open access article distributed under the terms andconditions of the Creative Commons Attribution (CC BY) license.
Download date 11/06/2018 20:46:46
Link to Item http://hdl.handle.net/10150/625999
Article
Effects of Drought on Xylem Anatomy and Water-UseEfficiency of Two Co-Occurring Pine Species
Dario Martin-Benito 1,2,3,*, Kevin J. Anchukaitis 3,4, Michael N. Evans 5, Miren del Río 1,6,Hans Beeckman 7 ID and Isabel Cañellas 1 ID
1 Forest Research Centre, (INIA-CIFOR), Ctra. La Coruña km 7.5, 28040 Madrid, Spain;[email protected] (M.d.R); [email protected] (I.C.)
2 Forest Ecology, Department of Environmental Sciences, Swiss Federal Institute of Technology, ETH Zurich,Universitätstrasse 16, 8092 Zürich, Switzerland
3 Tree-ring Laboratory, Lamont-Doherty Earth Observatory of Columbia University, 61 Route 9 W,Palisades, NY 10964, USA
4 School of Geography and Development & Laboratory of Tree-Ring Research, University of Arizona,Tucson, AZ 85721, USA; [email protected]
5 Department of Geology and Earth System Science Interdisciplinary Center, University of Maryland,College Park, MD 20742, USA; [email protected]
6 Sustainable Forest Management Research Institute, University of Valladolid, INIA Avda, Madrid, s/n,34004 Palencia, Spain
7 Service of Wood Biology, Royal Museum for Central Africa, Leuvensesteenweg 13, 3080 Tervuren, Belgium;[email protected]
* Correspondence: [email protected] or [email protected]; Tel.: +34913476872
Academic Editor: Giovanna BattipagliaReceived: 4 August 2017; Accepted: 30 August 2017; Published: 8 September 2017
Abstract: Exploring how drought influences growth, performance, and survival in different speciesis crucial to understanding the impacts of climate change on forest ecosystems. Here, we investigatethe responses of two co-occurring pines (Pinus nigra and Pinus sylvestris) to interannual drought ineast-central Spain by dendrochronological and wood anatomical features integrated with isotopicratios of carbon (δ13C) and oxygen (δ18O) in tree rings. Our results showed that drought induces bothspecies to allocate less carbon to build tracheid cell-walls but increases tracheid lumen diameters,particularly in the transition wood between early and latewood, potentially maximizing hydraulicconductivity but reducing resistance to embolism at a critical phase during the growing season. Thethicker cell-wall-to-lumen ratio in P. nigra could imply that its xylem may be more resistant to bendingstress and drought-induced cavitation than P. sylvestris. In contrast, the higher intrinsic water-useefficiency (iWUE) in P. sylvestris suggests that it relies more on a water-saving strategy. Our resultssuggest that narrower cell-walls and reduced growth under drought are not necessarily linked toincreased iWUE. At our site P. nigra showed a higher growth plasticity, grew faster and was morecompetitive than P. sylvestris. In the long term, these sustained differences in iWUE and anatomicalcharacters could affect forest species performance and composition, particularly under increaseddrought stress.
Keywords: xylem bending stress; drought; Pinus; tracheid; tree ring; water-use efficiency;wood anatomy
1. Introduction
Intense and prolonged drought episodes can significantly affect tree growth and survival, speciescomposition and disturbance dynamics in forests. Increased frequency of these events could potentiallyaffect mortality and recruitment dynamics and lead to changes in distribution and abundance of forest
Forests 2017, 8, 332; doi:10.3390/f8090332 www.mdpi.com/journal/forests
Forests 2017, 8, 332 2 of 19
species [1,2]. Decreased growth and increased mortality under drought conditions might deriveprimarily from carbon limitation at the source level through stomatal closure and lower carbonassimilation (the carbon-starvation hypothesis [3]) or by reduced meristematic activity and cambialenlargement [4–6], or directly by hydraulic failure [7]. Water deficits can affect the mobilizationand transport of carbohydrates reducing growth even if concentrations of soluble carbohydratesincrease [4,6,8,9]. Meristematic activity is also reduced during periods of low water availability [4,5].Xylem development under water-stress conditions is further regulated by complex interactions betweenthese different mechanisms, varying levels of growth hormones, such as auxin or indole acetic acid [10],or changes in carbon allocation patterns [9,11–13].
The response of trees to drought stress varies within a continuum between closing stomata toreduce transpiration to keep xylem water potential within safety margins [14] at the expense of reducedphotosynthetic rates (isohydric strategy) [15] or by maintaining similar levels of stomatal conductancebut risking increased embolism formation (anisohydric strategy), because stomatal and hydraulicresponse are closely co-regulated [16]. Xylem safety levels involved in hydraulic failure depend onanatomical characteristics such as pit structure [17,18] and conduit lumen and cell-wall thickness [19].In the anisohydric Juniperus thurifera L., increases in intrinsic water-use efficiency (iWUE) are likelyto reduce growth and cell-wall thickness, supporting a partial role of carbon source limitation inthe decline of tree vigor and hydraulic resistance [20]. Tree growth rates and drought resistance areclosely balanced across many different species and forest ecosystems [21] and adaptations to differentenvironments via these physiological and wood anatomical mechanisms are partly responsible for thedistributional limits of conifer species [22].
Under similar levels of drought stress, different species with different functional traits canexperience different decline and mortality rates [3], which can result in long-term differences incompetitive ability and affect species composition. Several studies in eastern Iberia show a severedrought-induced decline and mortality of P. sylvestris L., but not in P. nigra Arn. [2,23] or oaks [24],although drought-induced die-back of P. nigra has been reported in Italy [25]. Therefore, in the presentstudy, we focus on how P. sylvestris and P. nigra growing in the same stand perform in responseto climate variability and drought. These two species differ in their ecological requirements anddistribution ranges. Although P. nigra generally shows a higher drought resistance [26] and greatersapling survival [23] than P. sylvestris, both pines frequently form mixed stands in Mediterraneanmountains [27]. While P. nigra is restricted to the mountains surrounding the Mediterranean Basin [27],P. sylvestris has a wide circumboreal extension [28]. In east-central Spain, the growth of both P. nigraand P. sylvestris is sensitive to climate-mainly summer drought [29]. Although both species sometimesshow similar vulnerability to embolism [2], a loss of 50% hydraulic conductivity can occur in P. nigraat higher tensions and lower water potentials than P. sylvestris (−2.8 MPa [30] vs. −3.20 MPa [2],respectively). It remains essential to increase our knowledge about how functional traits might affectthe differential survival and competition ability of coexisting species. Mediterranean forests are alreadysubjected to a high frequency of strong droughts and offer an appropriate system to test the effects ofincreasing drought frequencies and intensities associated with climate change [31].
Annual growth rings record the response of trees to changes in their environment. Changesin stomatal conductance are recorded in the stable isotopes of wood cellulose [32,33]. Mergingdendrochronology, proxies of xylem vulnerability calculated from xylem anatomical features, andthe analysis of intrinsic water-use efficiency provides a valuable approach to explore species’ andcommunities’ long-term responses to drought [20,25,34]. In the present study, we investigate the effectsof drought on plant growth and hydraulic architecture, wood anatomical plasticity, and water-useefficiency under different levels of moisture availability of P. nigra and P. sylvestris over a 47-year period.The specific objectives of the study are to (1) determine how xylem traits (tracheid wall thicknessand lumen diameter) differ between the two pine species and characterize their tree-ring width;(2) investigate how xylem morphology is affected by climatic conditions in years with contrastingwater availability; and (3) assess whether different adaptive response to drought of traits and growth
Forests 2017, 8, 332 3 of 19
might be favouring one of the two species. We hypothesized that the P. nigra will show xylem hydraulictraits typical of more drought tolerant species and lower iWUE that would reflect higher stomatalconductance than P. sylvestris. This response would allow P. nigra to withstand periods of droughtbetter than P. sylvestris but also grow faster under moister conditions.
2. Materials and Methods
2.1. Site Description
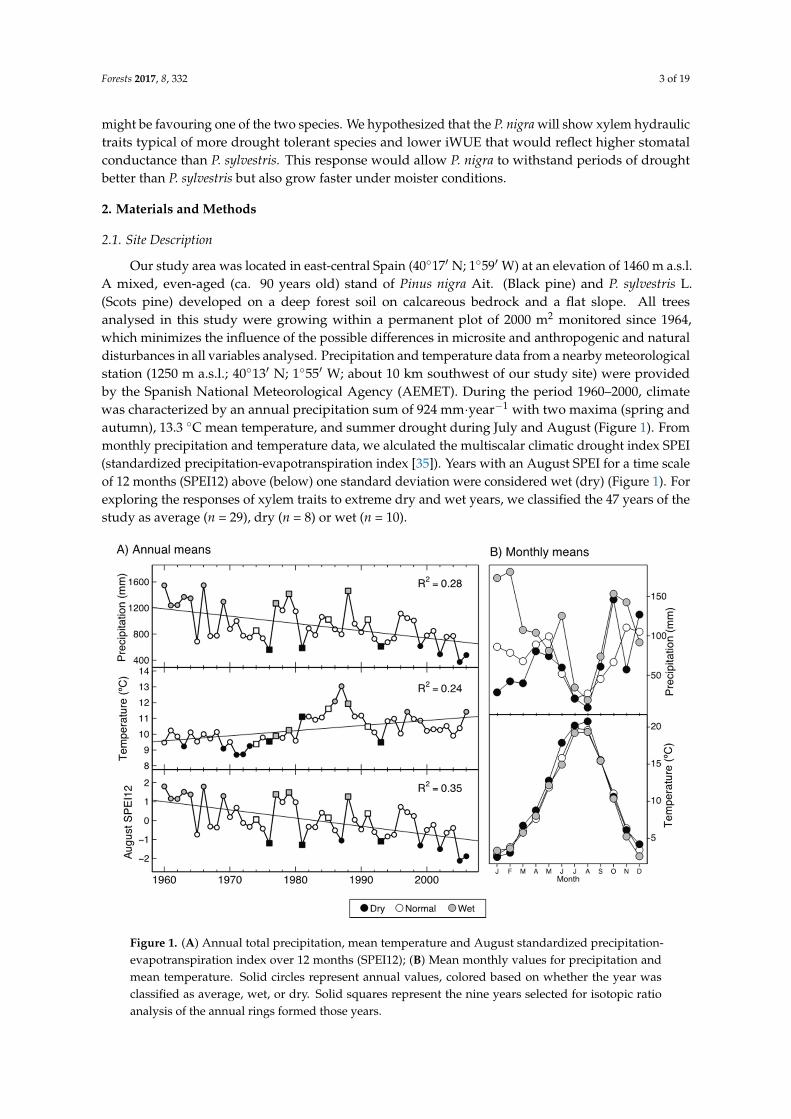
Our study area was located in east-central Spain (40◦17′ N; 1◦59′ W) at an elevation of 1460 m a.s.l.A mixed, even-aged (ca. 90 years old) stand of Pinus nigra Ait. (Black pine) and P. sylvestris L.(Scots pine) developed on a deep forest soil on calcareous bedrock and a flat slope. All treesanalysed in this study were growing within a permanent plot of 2000 m2 monitored since 1964,which minimizes the influence of the possible differences in microsite and anthropogenic and naturaldisturbances in all variables analysed. Precipitation and temperature data from a nearby meteorologicalstation (1250 m a.s.l.; 40◦13′ N; 1◦55′ W; about 10 km southwest of our study site) were providedby the Spanish National Meteorological Agency (AEMET). During the period 1960–2000, climatewas characterized by an annual precipitation sum of 924 mm·year−1 with two maxima (spring andautumn), 13.3 ◦C mean temperature, and summer drought during July and August (Figure 1). Frommonthly precipitation and temperature data, we alculated the multiscalar climatic drought index SPEI(standardized precipitation-evapotranspiration index [35]). Years with an August SPEI for a time scaleof 12 months (SPEI12) above (below) one standard deviation were considered wet (dry) (Figure 1). Forexploring the responses of xylem traits to extreme dry and wet years, we classified the 47 years of thestudy as average (n = 29), dry (n = 8) or wet (n = 10).
Forests 2017, 8, 332 3 of 19
xylem hydraulic traits typical of more drought tolerant species and lower iWUE that would reflect higher stomatal conductance than P. sylvestris. This response would allow P. nigra to withstand periods of drought better than P. sylvestris but also grow faster under moister conditions.
2. Materials and Methods
2.1. Site Description
Our study area was located in east-central Spain (40°17′ N; 1°59′ W) at an elevation of 1460 m a.s.l. A mixed, even-aged (ca. 90 years old) stand of Pinus nigra Ait. (Black pine) and P. sylvestris L. (Scots pine) developed on a deep forest soil on calcareous bedrock and a flat slope. All trees analysed in this study were growing within a permanent plot of 2000 m2 monitored since 1964, which minimizes the influence of the possible differences in microsite and anthropogenic and natural disturbances in all variables analysed. Precipitation and temperature data from a nearby meteorological station (1250 m a.s.l.; 40°13′ N; 1°55′ W; about 10 km southwest of our study site) were provided by the Spanish National Meteorological Agency (AEMET). During the period 1960–2000, climate was characterized by an annual precipitation sum of 924 mm·year−1 with two maxima (spring and autumn), 13.3 °C mean temperature, and summer drought during July and August (Figure 1). From monthly precipitation and temperature data, we alculated the multiscalar climatic drought index SPEI (standardized precipitation-evapotranspiration index [35]). Years with an August SPEI for a time scale of 12 months (SPEI12) above (below) one standard deviation were considered wet (dry) (Figure 1). For exploring the responses of xylem traits to extreme dry and wet years, we classified the 47 years of the study as average (n = 29), dry (n = 8) or wet (n = 10).
Figure 1. (A) Annual total precipitation, mean temperature and August standardized precipitation-evapotranspiration index over 12 months (SPEI12); (B) Mean monthly values for precipitation and mean temperature. Solid circles represent annual values, colored based on whether the year was classified as average, wet, or dry. Solid squares represent the nine years selected for isotopic ratio analysis of the annual rings formed those years.
Figure 1. (A) Annual total precipitation, mean temperature and August standardized precipitation-evapotranspiration index over 12 months (SPEI12); (B) Mean monthly values for precipitation andmean temperature. Solid circles represent annual values, colored based on whether the year wasclassified as average, wet, or dry. Solid squares represent the nine years selected for isotopic ratioanalysis of the annual rings formed those years.
Forests 2017, 8, 332 4 of 19
2.2. Dendrochronological and Wood Anatomical Methods
Two cores were extracted from 15 dominant trees of each species within the plot (30 trees in total).Dominance was defined as the 20 largest trees in diameter at breast height (DBH) in the 2000 m2 plot(i.e., 100 largest trees per hectare). Cores were mounted on grooved boards, sanded and crossdatedfollowing standard dendrochronological procedures. The width of each annual ring (TRW), earlywood(EW), and latewood (LW) were measured to the nearest 0.01 mm on a LINTAB measuring stage and theTSAP software [36]. The computer program COFECHA was used to check crossdating and validatemeasurement quality [37]. A subset of five trees per species highly correlated with their species TRWchronologies were selected for the analysis of their wood anatomical traits and stable isotope ratios(carbon and oxygen). It was later discovered that an extensive defoliation by the pine processionarymoth Thaumetopoea pityocampa (Denis & Schiffermüller) occurred in these pine forests in 1991 [38],so we exclude data for that year from our analyses. It is worth noting that keeping the results for year1991 in the analysis or excluding them produced similar results in all analysis performed.
For wood anatomical features, smaller sections (ca. 1–2 cm long) were cut from the corescorresponding to subperiods between 1960–2006 and embedded in polyethylene glycol (1500 MWPEG) blocks [39]. Sections ca. 20 µm thick were cut with a sliding microtome, dehydrated and mountedonto non-permanent glass microscope slides. In certain years, only three or four trees could be used forthe anatomical analysis (Figure S1 in supplementary material). In total, we analysed 447 rings (223 forP. nigra and 224 for P. sylvestris; Figure S1 in supplementary material). Digital images were obtained ata magnification of 40X using a video camera and an optical Nikon Eclipse E600 microscope. To profitfrom the high image contrast that the autofluorescence of lignin creates under UV light [40], we usedUV reflected light from a mercury vapour lamp and a U-MWU Olympus filter. For rings wider than500 µm, several successive images were blended into a mosaic image before analysis. Lumen diameter(LD), cell-wall thickness (CWT), number of cells (NC) and lumen area (LA) were measured (FigureS2 in supplementary material) along five complete radial rows of cells for each ring using the ImageJsoftware [41] with a resolution of 1430 pixels/µm. Radial tracheid dimensions were chosen becausetangential dimensions are rather constant within and among different growth rings [42].
The cell wall thickness (CWT) of each individual tracheid was calculated as CWTi = 0.5·(CWTi−1+ CWTi+1), where CWTi−1 and CWTi+1 represent the distance between left (i−1) and right (i + 1) sidetracheid lumen to the specific tracheid (i) (Figure S2 in supplementary material; [43]. For the firstand last tracheids in each tree ring, the formula was modified to CWTfirst = CWTi+1 and CWTlast =CWTi−1. Cells in which CWT·4 ≥ LD were considered as latewood [43]. We also estimated a conduitwall reinforcement or bending stress resistance factor as (t/b)2, where t is the double CWT and b is theside of a hypothetical square conduit of area LA. In this study, we used the bending stress resistancefactor [(t/b)2] as a proxy for hydraulic safety from implosion by negative pressure because it is stronglycorrelated to cavitation resistance [44].
Because cell number differed within and between growth rings (Figure 2), standardizedtracheidograms were estimated from the original measurements for each radial file to allow directcomparison between cells in different cell files, rings, and trees. In tracheidograms, all radial files areconverted to constant standardized number of cells (25 cells) by a weighted mean of the cell dimensionwithin the file. We chose 25 cells because it was close to the mean number of cells for the rings duringthe studied period (Figure 2). We briefly describe the process of tracheidogram standardization insupplementary material (for a detailed description of the method see [45]).
Forests 2017, 8, 332 5 of 19Forests 2017, 8, 332 5 of 19
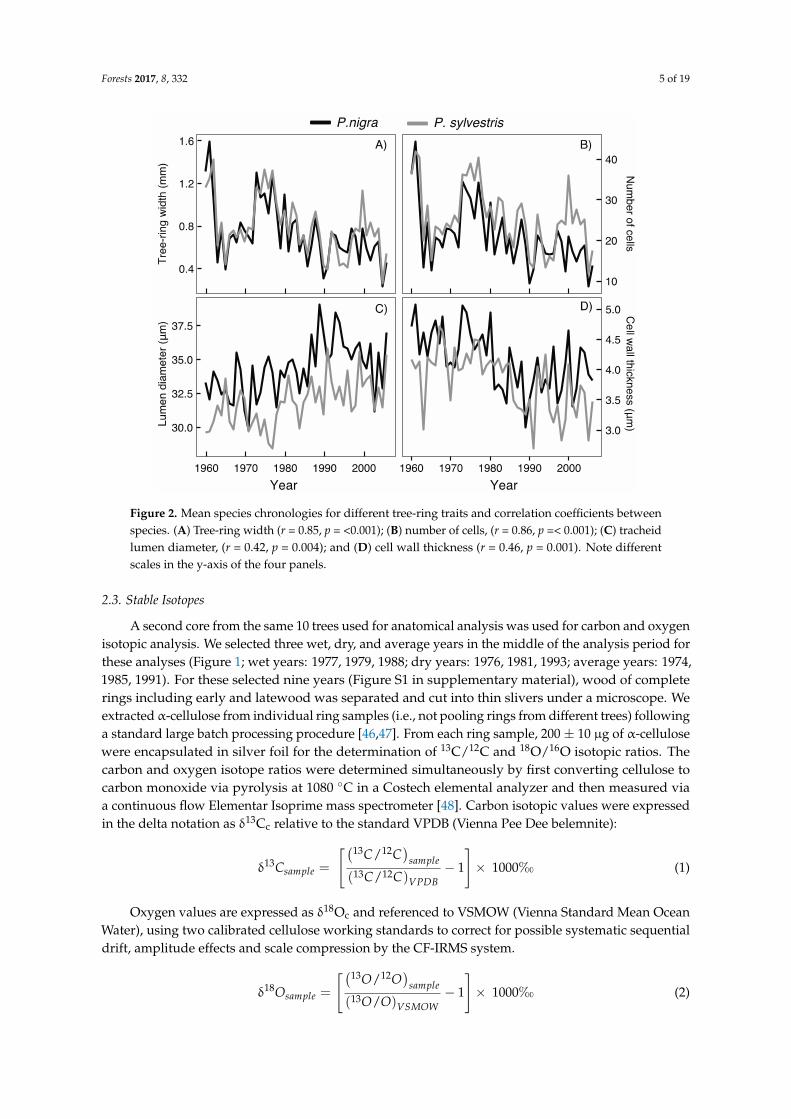
Figure 2. Mean species chronologies for different tree-ring traits and correlation coefficients between species. (A) Tree-ring width (r = 0.85, p = <0.001); (B) number of cells, (r = 0.86, p =< 0.001); (C) tracheid lumen diameter, (r = 0.42, p = 0.004); and (D) cell wall thickness (r = 0.46, p = 0.001). Note different scales in the y-axis of the four panels.
2.3. Stable Isotopes
A second core from the same 10 trees used for anatomical analysis was used for carbon and oxygen isotopic analysis. We selected three wet, dry, and average years in the middle of the analysis period for these analyses (Figure 1; wet years: 1977, 1979, 1988; dry years: 1976, 1981, 1993; average years: 1974, 1985, 1991). For these selected nine years (Figure S1 in supplementary material), wood of complete rings including early and latewood was separated and cut into thin slivers under a microscope. We extracted α-cellulose from individual ring samples (i.e., not pooling rings from different trees) following a standard large batch processing procedure [46,47]. From each ring sample, 200 ± 10 μg of α-cellulose were encapsulated in silver foil for the determination of 13C/12C and 18O/16O isotopic ratios. The carbon and oxygen isotope ratios were determined simultaneously by first converting cellulose to carbon monoxide via pyrolysis at 1080 °C in a Costech elemental analyzer and then measured via a continuous flow Elementar Isoprime mass spectrometer [48]. Carbon isotopic values were expressed in the delta notation as δ13Cc relative to the standard VPDB (Vienna Pee Dee belemnite):
δ = − 1 × 1000‰ (1)
Oxygen values are expressed as δ18Oc and referenced to VSMOW (Vienna Standard Mean Ocean Water), using two calibrated cellulose working standards to correct for possible systematic sequential drift, amplitude effects and scale compression by the CF-IRMS system.
Figure 2. Mean species chronologies for different tree-ring traits and correlation coefficients betweenspecies. (A) Tree-ring width (r = 0.85, p = <0.001); (B) number of cells, (r = 0.86, p =< 0.001); (C) tracheidlumen diameter, (r = 0.42, p = 0.004); and (D) cell wall thickness (r = 0.46, p = 0.001). Note differentscales in the y-axis of the four panels.
2.3. Stable Isotopes
A second core from the same 10 trees used for anatomical analysis was used for carbon and oxygenisotopic analysis. We selected three wet, dry, and average years in the middle of the analysis period forthese analyses (Figure 1; wet years: 1977, 1979, 1988; dry years: 1976, 1981, 1993; average years: 1974,1985, 1991). For these selected nine years (Figure S1 in supplementary material), wood of completerings including early and latewood was separated and cut into thin slivers under a microscope. Weextracted α-cellulose from individual ring samples (i.e., not pooling rings from different trees) followinga standard large batch processing procedure [46,47]. From each ring sample, 200 ± 10 µg of α-cellulosewere encapsulated in silver foil for the determination of 13C/12C and 18O/16O isotopic ratios. Thecarbon and oxygen isotope ratios were determined simultaneously by first converting cellulose tocarbon monoxide via pyrolysis at 1080 ◦C in a Costech elemental analyzer and then measured viaa continuous flow Elementar Isoprime mass spectrometer [48]. Carbon isotopic values were expressedin the delta notation as δ13Cc relative to the standard VPDB (Vienna Pee Dee belemnite):
δ13Csample =
[(13C/12C)
sample
(13C/12C)VPDB− 1
]× 1000‰ (1)
Oxygen values are expressed as δ18Oc and referenced to VSMOW (Vienna Standard Mean OceanWater), using two calibrated cellulose working standards to correct for possible systematic sequentialdrift, amplitude effects and scale compression by the CF-IRMS system.
δ18Osample =
[(13O/12O)
sample
(13O/O)VSMOW− 1
]× 1000‰ (2)
Forests 2017, 8, 332 6 of 19
The carbon isotope data were converted to carbon isotope discrimination (∆) as
∆ =(δ13Ca − δ13Cc
)/(
1 + δ13Cc/1000)
(3)
where δ13Cc is the isotopic ratio in wood cellulose and δ13Ca the ratio in atmospheric air [32]. Due tothe increase of atmospheric CO2 inputs from 13C depleted fossil fuels with respect to the pre-industrialatmospheric δ13C of −6.4‰, Suess effect [49], δ13Cc was modified by adding the correction valuespresented by McCarroll and Loader [33]. The standard deviation for replicate measurements of theworking standards of isotope ratios for carbon and oxygen were 0.12‰ and 0.26‰, respectively.
From carbon isotopic ratios, we also estimated the intrinsic water-use efficiency (iWUE), i.e., theratio between net carbon assimilation in photosynthesis (A) and stomatal conductance for water gw
(related to stomatal conductance for CO2 as gw = 1.6 g; [32]). This ratio is proportional to (ca − ci)through the expression
iWUE =Agw
=(ca − ci)
1.6(4)
where ca and ci are the partial pressure of CO2 in atmospheric air and in the intercellular space of thepine needle, respectively.
Thus, iWUE can also be estimated from ∆ (carbon discrimination) in the tree rings and ca from [50] as:
iWUE =ca·(b− ∆)1.6·(b− a)
(5)
Following the dual-isotope conceptual model of Scheidegger, et al. [51] and the recommendationsby Roden and Siegwolf [52], we compared the differences between δ13C and δ18O isotopic composition(∆C and ∆O) observed for dry and wet years with respect to average years for each tree (i) and year(j). We then averaged per species to obtain composite averages and uncertainties. We analysed thesechanges in isotopic discrimination in terms of changes in average net photosynthesis (A) and stomatalconductance (gl).
2.4. Statistical Analysis
We used linear mixed-effects models (LMM) to analyze the contribution of each anatomical feature(i.e., number of cells, cell wall thickness, lumen diameter) to ring width and to explore the responseof both pine species to years of differing water availability. In the first case, TRW was modeled byspecies as a function of cell-wall thickness (CWT), lumen diameter (LD), and number of cells (NC) ofearlywood (EW) and latewood (LW) in the form
TRW = ai·CWTew + bi·CWTlw + ci·LDew + di·LDlw + ei·NCew + fi·NClw + tj (6)
where ai–fi are model fixed parameters for each species i, and tj represents a random intercept of thelinear model for each of the 10 trees j.
In the second case, the effect of drought on tree growth was analyzed on six dependent variableswith the model
Variablei = ai·Species + bi·SPEI12 + ci·Year + di·Species SPEI12 + tj,i (7)
where ai–di are the corresponding model parameters (a–d) for each dependent variable i, whereasti,j represents a random intercept for each of the 10 trees j for each model with variable i. The six idependent variables considered were ring width, cell-wall thickness, lumen diameter, and number ofcells in the entire ring, earlywood, and latewood. The variable Year was introduced in the model asa surrogate for age, because all trees were of very similar age, and it allows for the accounting for agetrends within the model.
Forests 2017, 8, 332 7 of 19
In all cases, trees were included in the models as random effects in order to account for randomdifferences between individuals. LMMs were fitted in R [53] within the nlme package [54] accountingfor temporal autocorrelation in the time series and the maximum likelihood (ML), except for estimatingthe final model, when a restricted maximum likelihood (REML) was used. Models were developedfollowing the successive approach of Zuur et al. [55] from the original set of potential variables (SPEI12,Year, species, and their interactions) and selected based on the corrected Akaike information criterionAICc [56].
In addition, we used the non-parametric Wilcoxon signed-rank test to analyze the possible effectsof drought on CWT and LD within the annual ring between years of contrasting water availabilityfor each species. Our null hypothesis was that, for each of the 25 cells along the standardizedtracheidogram, cell-wall thickness and lumen distributions have medians that do not differ betweendry, wet or average years.
3. Results
3.1. Changes in Climate
Precipitation during the hydrological year (September to August) decreased for the period1960–2006 at ca. 11.2 mm·year−1 (R2 = 0.29; p < 0.001). During the same period, mean annualtemperature increased by 0.3 ◦C per decade (R2 = 0.24; p < 0.001). The highest temperatures werereached in the late 1980s. These precipitation and temperature changes intensified drought as shownby the strong decrease in August SPEI for 12-month periods (R2 = 0.34; p < 0.001). Four of the eightyears with SPEI12 below one standard deviation occurred in the last 10 years, whereas seven of the10 wettest years occurred in the 1960s (Figure 1).
3.2. Interspecific Growth and Anatomical Differences
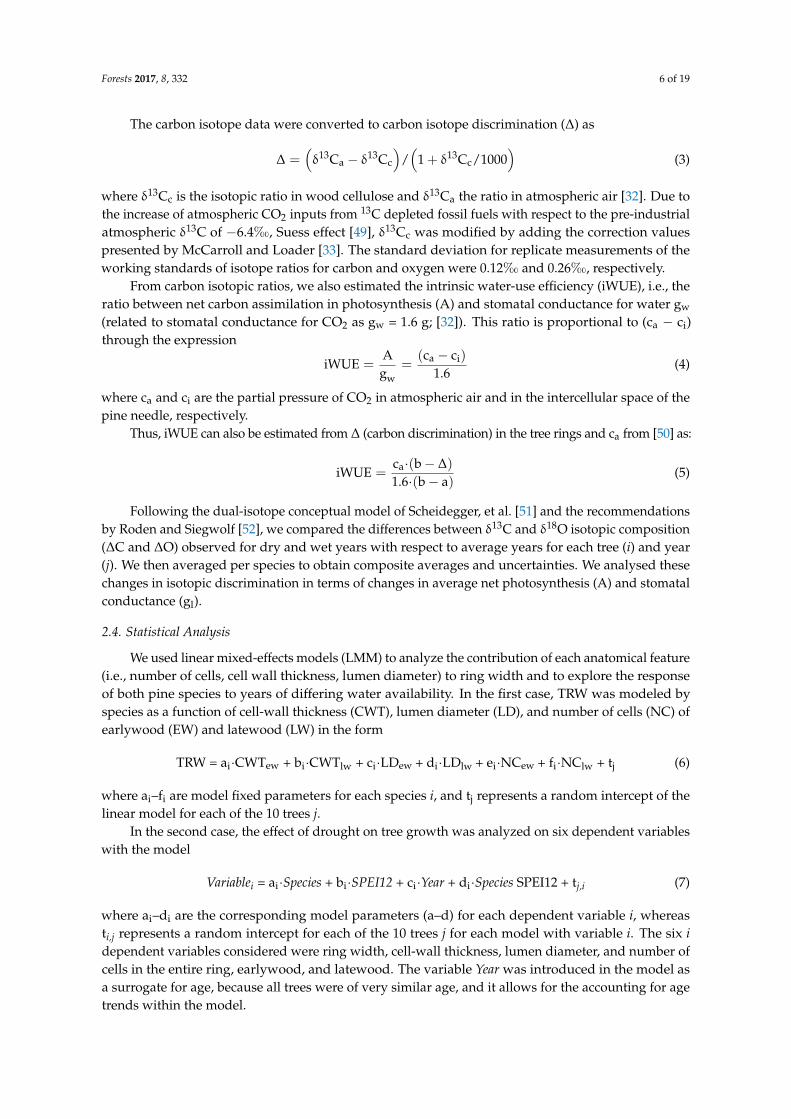
Average DBH at the moment of sampling was larger in P. nigra than in P. sylvestris (33.9 ± 54.3 cmvs. 26.2 ± 19.6cm; p = 0.0176; df = 8; Figure S3 in supplementary material) at the same approximateages. Average ring widths for both species were similar during the study period (p = 0.6019; df = 8)despite P. sylvestris having higher number of cells in the earlywood than P. nigra (p = 0.0185, df = 8)(Table 1; Figure 2). Cell walls in P. nigra were systematically wider in the latewood (p = 0.0195; df = 8;Table 1; Figure 3) and slightly wider in the earlywood (p = 0.0642, df = 8). Black pine also had widerlumen diameter in the earlywood cells (p = 0.0206, df = 8; Table 1; Figure 3).
Forests 2017, 8, 332 9 of 19
Figure 3. Cell wall thickness (CWT) and lumen diameter (LD) for the normalized tracheidogram of rings formed during the period 1990–2000. Each year represents the mean for 5 trees of each species.
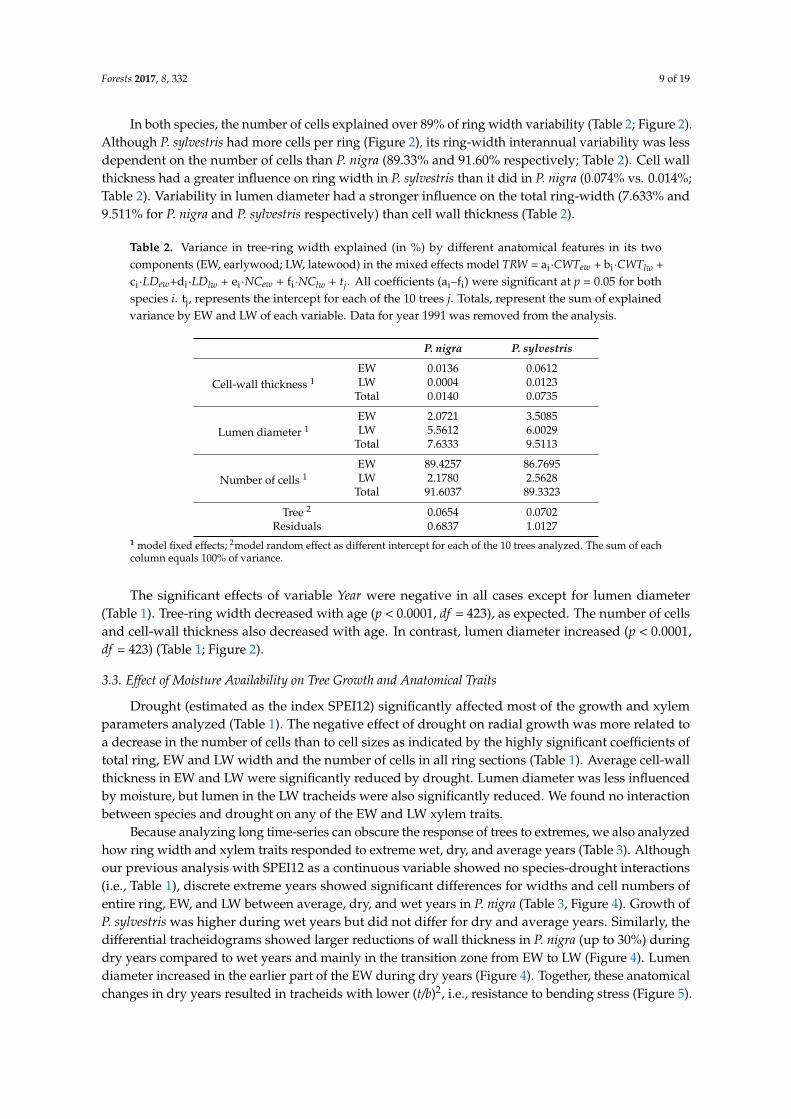
In both species, the number of cells explained over 89% of ring width variability (Table 2; Figure 2). Although P. sylvestris had more cells per ring (Figure 2), its ring-width interannual variability was less dependent on the number of cells than P. nigra (89.33% and 91.60% respectively; Table 2). Cell wall thickness had a greater influence on ring width in P. sylvestris than it did in P. nigra (0.074% vs 0.014%; Table 2). Variability in lumen diameter had a stronger influence on the total ring-width (7.633% and 9.511% for P. nigra and P. sylvestris respectively) than cell wall thickness (Table 2).
Table 2. Variance in tree-ring width explained (in %) by different anatomical features in its two components (EW, earlywood; LW, latewood) in the mixed effects model TRW = ai·CWTew + bi·CWTlw + ci·LDew+di·LDlw + ei·NCew + fi·NClw + tj. All coefficients (ai–fi) were significant at p = 0.05 for both species i. tj, represents the intercept for each of the 10 trees j. Totals, represent the sum of explained variance by EW and LW of each variable. Data for year 1991 was removed from the analysis.
P. nigra P. sylvestris
Cell-wall thickness 1 EW 0.0136 0.0612 LW 0.0004 0.0123
Total 0.0140 0.0735
Lumen diameter1 EW 2.0721 3.5085 LW 5.5612 6.0029
Total 7.6333 9.5113
Number of cells1 EW 89.4257 86.7695 LW 2.1780 2.5628
Total 91.6037 89.3323 Tree 2 0.0654 0.0702
Residuals 0.6837 1.0127 1 model fixed effects; 2model random effect as different intercept for each of the 10 trees analyzed. The sum of each column equals 100% of variance.
The significant effects of variable Year were negative in all cases except for lumen diameter (Table 1). Tree-ring width decreased with age (p < 0.0001, df = 423), as expected. The number of cells and cell-wall thickness also decreased with age. In contrast, lumen diameter increased (p < 0.0001, df = 423) (Table 1; Figure 2).
2
4
6
8
10
CW
T (
m)
2
4
6
8
10
●●●●●●●
●●●●●●●●●●●●●●●●●●
●●●●●●●●●●●●●●
●●
●●●●●●●●●
●●●●●●●
●●●●●●●●●
●
●●●●●●
●●
●●●●●
●●●●●●●●
●●●●●
●
●●●●●●
●●●●●●●●●●●●●●●●●
●●●●●●●●
●●●●●●●●●●●●●
●●●●●●●●●●●●
●●●●●●●●●●●●●●
●●
●●●●●
●
●●●
●●●●●●●●●●●
●●●
●
●
●●●●●●
●
●●
●●●●●●●●●●●●●●●
●●
●
●●●●
●●●
●●●●●●●●
●●●●
●●●●●
●●●●●●●●●●
●●●●
●●●●●●●●
●●●●●
●●●●
●●
● PINI PISY
10
20
30
40
LD (
m)
10
20
30
40●●●●●●●●●●●●●●
●●●●
●●●
●●●●
●●●●●●●●●●●●
●●●●●●●●●●●●●
●●●●●●●●●●●●●
●●●
●
●●●●●●●●
●●●●●●●●●●●
●●●●●●
●
●
●●●●●●
●●●●●●●●●●●●●●●
●
●
●●
●●●●●●
●●●●●●●●●●●●
●●●●●●●
●●●●●●
●●●●●●●●●●●
●●●
●
●
●●●●●●●●●
●●●●●●●●●●●
●●●
●
●●●●●●●●●●
●●●●●●●●●●●●●
●●
●
●
●
●●●●●●●
●●●●●
●●●●●●●●●●●●●
●●
●●●●●
●●●●●●●●●●●●●
●●●●
●
●
●●●●●●
1990 1995 2000
Year
Figure 3. Cell wall thickness (CWT) and lumen diameter (LD) for the normalized tracheidogram ofrings formed during the period 1990–2000. Each year represents the mean for 5 trees of each species.

Forests 2017, 8, 332 8 of 19
Table 1. Results for the linear mixed-effects models for width of the entire ring, earlywood and latewood, and the total number of cells in the annual ring calculatedover the 1960–2006 period. The model fitted was Variable = ai·Species + bi·SPEI12Aug + ci·Year + di·Species·SPEI12Aug + tj,i, where ai–di are the model parameters (a–d)for each variable i, and ti,i, represents the random intercept for each of the 10 trees j for each variable i. SPEI12Aug was treated as a continuous variable. Significant pvalues at the 5% level are highlighted in bold. EW, earlywood; LW, latewood. Reference species is P. nigra which means that positive (negative) parameter estimates forthe independent variable “species” need to be considered as increase (decrease) with respect to that species. Data for year 1991 was removed from the analysis.
Species (df = 8) SPEI12 (df = 423) Year (df = 423) Species × SPEI12 (df = 423)
Variable Section Estimate SE p Estimate SE p Estimate SE p Estimate SE p
WidthRing 47.67 87.78 0.6019 81.13 23.26 0.0005 −6.71 1.35 <0.0001 −35.85 29.31 0.2220EW 51.23 66.05 0.4602 49.27 18.75 0.0089 −6.41 1.10 <0.0001 −21.82 23.60 0.3558LW −3.63 39.49 0.9290 31.84 7.41 <0.0001 −0.29 0.43 0.4924 −13.98 9.33 0.1347
CWTRing −0.35 0.26 0.2046 0.03 0.07 0.9581 −0.02 <0.01 <0.0001 −0.06 0.10 0.4894EW −0.56 0.26 0.0642 0.10 0.04 0.0099 −0.01 <0.01 <0.0001 −0.07 0.05 0.1608LW −1.54 0.53 0.0195 0.30 0.09 0.0009 <0.01 <0.01 0.4976 <−0.01 0.11 0.9985
LDRing −2.48 1.42 0.1190 −0.31 0.24 0.1984 0.06 0.01 <0.0001 0.01 0.30 0.9390EW −4.01 1.39 0.0206 0.30 0.23 0.1964 0.01 0.01 0.3781 0.02 0.30 0.9430LW 0.04 0.38 0.9122 0.34 0.11 0.0028 0.01 <0.01 0.0385 0.13 0.14 0.3672
Numberof Cells
Ring 4.08 2.67 0.1653 2.23 0.64 0.0006 −0.18 0.04 <0.0001 −0.81 0.82 0.3193EW 3.31 1.39 0.0185 1.02 0.43 0.0185 −0.15 0.03 <0.0001 −0.33 0.54 0.5411LW 0.77 1.74 0.6695 1.21 0.31 0.0002 −0.03 0.02 0.1561 −0.48 0.40 0.2280
Forests 2017, 8, 332 9 of 19
In both species, the number of cells explained over 89% of ring width variability (Table 2; Figure 2).Although P. sylvestris had more cells per ring (Figure 2), its ring-width interannual variability was lessdependent on the number of cells than P. nigra (89.33% and 91.60% respectively; Table 2). Cell wallthickness had a greater influence on ring width in P. sylvestris than it did in P. nigra (0.074% vs. 0.014%;Table 2). Variability in lumen diameter had a stronger influence on the total ring-width (7.633% and9.511% for P. nigra and P. sylvestris respectively) than cell wall thickness (Table 2).
Table 2. Variance in tree-ring width explained (in %) by different anatomical features in its twocomponents (EW, earlywood; LW, latewood) in the mixed effects model TRW = ai·CWTew + bi·CWTlw +ci·LDew+di·LDlw + ei·NCew + fi·NClw + tj. All coefficients (ai–fi) were significant at p = 0.05 for bothspecies i. tj, represents the intercept for each of the 10 trees j. Totals, represent the sum of explainedvariance by EW and LW of each variable. Data for year 1991 was removed from the analysis.
P. nigra P. sylvestris
Cell-wall thickness 1EW 0.0136 0.0612LW 0.0004 0.0123
Total 0.0140 0.0735
Lumen diameter 1EW 2.0721 3.5085LW 5.5612 6.0029
Total 7.6333 9.5113
Number of cells 1EW 89.4257 86.7695LW 2.1780 2.5628
Total 91.6037 89.3323
Tree 2 0.0654 0.0702Residuals 0.6837 1.0127
1 model fixed effects; 2model random effect as different intercept for each of the 10 trees analyzed. The sum of eachcolumn equals 100% of variance.
The significant effects of variable Year were negative in all cases except for lumen diameter(Table 1). Tree-ring width decreased with age (p < 0.0001, df = 423), as expected. The number of cellsand cell-wall thickness also decreased with age. In contrast, lumen diameter increased (p < 0.0001,df = 423) (Table 1; Figure 2).
3.3. Effect of Moisture Availability on Tree Growth and Anatomical Traits
Drought (estimated as the index SPEI12) significantly affected most of the growth and xylemparameters analyzed (Table 1). The negative effect of drought on radial growth was more related toa decrease in the number of cells than to cell sizes as indicated by the highly significant coefficients oftotal ring, EW and LW width and the number of cells in all ring sections (Table 1). Average cell-wallthickness in EW and LW were significantly reduced by drought. Lumen diameter was less influencedby moisture, but lumen in the LW tracheids were also significantly reduced. We found no interactionbetween species and drought on any of the EW and LW xylem traits.
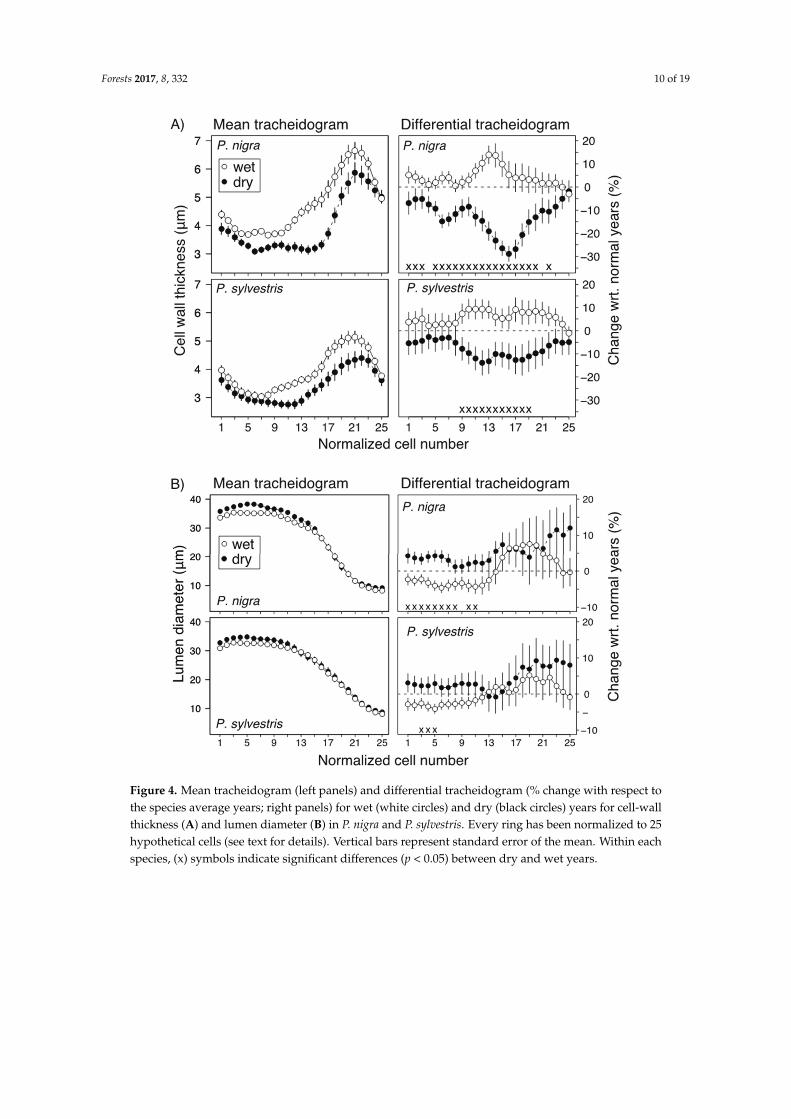
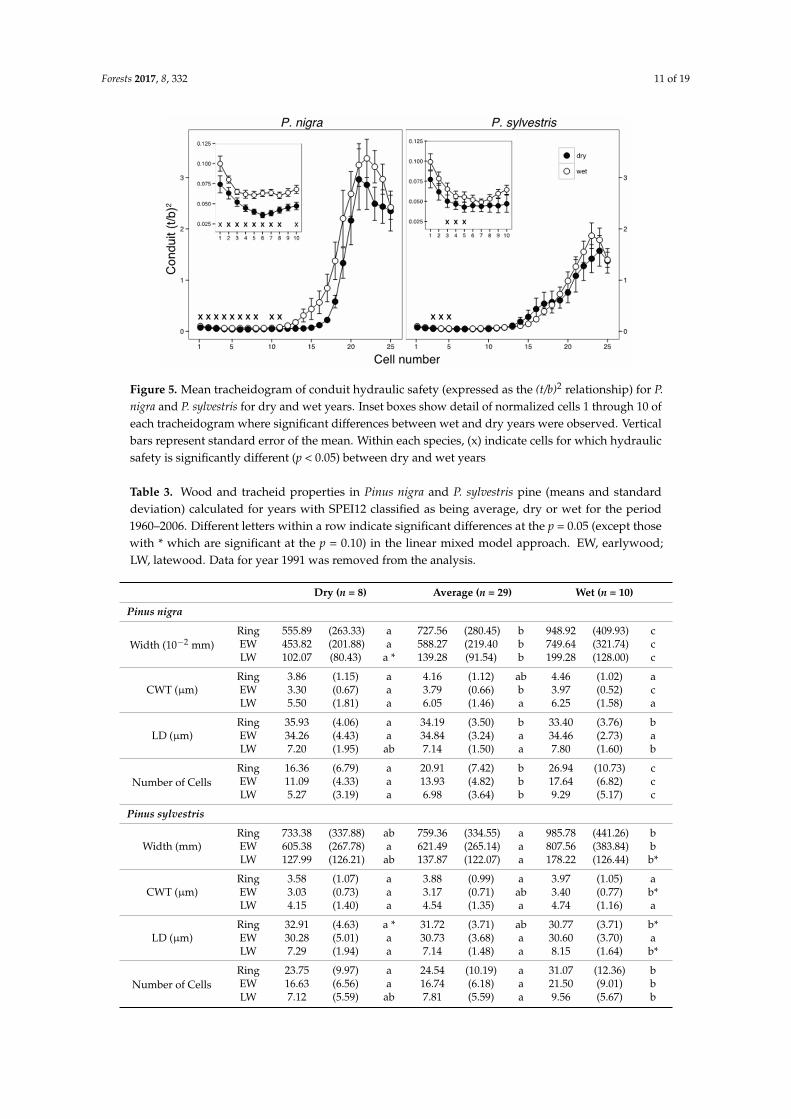
Because analyzing long time-series can obscure the response of trees to extremes, we also analyzedhow ring width and xylem traits responded to extreme wet, dry, and average years (Table 3). Althoughour previous analysis with SPEI12 as a continuous variable showed no species-drought interactions(i.e., Table 1), discrete extreme years showed significant differences for widths and cell numbers ofentire ring, EW, and LW between average, dry, and wet years in P. nigra (Table 3, Figure 4). Growth ofP. sylvestris was higher during wet years but did not differ for dry and average years. Similarly, thedifferential tracheidograms showed larger reductions of wall thickness in P. nigra (up to 30%) duringdry years compared to wet years and mainly in the transition zone from EW to LW (Figure 4). Lumendiameter increased in the earlier part of the EW during dry years (Figure 4). Together, these anatomicalchanges in dry years resulted in tracheids with lower (t/b)2, i.e., resistance to bending stress (Figure 5).
Forests 2017, 8, 332 10 of 19Forests 2017, 8, 332 11 of 19
Figure 4. Mean tracheidogram (left panels) and differential tracheidogram (% change with respect to the species average years; right panels) for wet (white circles) and dry (black circles) years for cell-wall thickness (A) and lumen diameter (B) in P. nigra and P. sylvestris. Every ring has been normalized to 25 hypothetical cells (see text for details). Vertical bars represent standard error of the mean. Within each species, (x) symbols indicate significant differences (p < 0.05) between dry and wet years.
Figure 4. Mean tracheidogram (left panels) and differential tracheidogram (% change with respect tothe species average years; right panels) for wet (white circles) and dry (black circles) years for cell-wallthickness (A) and lumen diameter (B) in P. nigra and P. sylvestris. Every ring has been normalized to 25hypothetical cells (see text for details). Vertical bars represent standard error of the mean. Within eachspecies, (x) symbols indicate significant differences (p < 0.05) between dry and wet years.
Forests 2017, 8, 332 11 of 19Forests 2017, 8, 332 12 of 19
Figure 5. Mean tracheidogram of conduit hydraulic safety (expressed as the (t/b)2 relationship) for P. nigra and P. sylvestris for dry and wet years. Inset boxes show detail of normalized cells 1 through 10 of each tracheidogram where significant differences between wet and dry years were observed. Vertical bars represent standard error of the mean. Within each species, (x) indicate cells for which hydraulic safety is significantly different (p < 0.05) between dry and wet years
3.4. Stable Isotopes
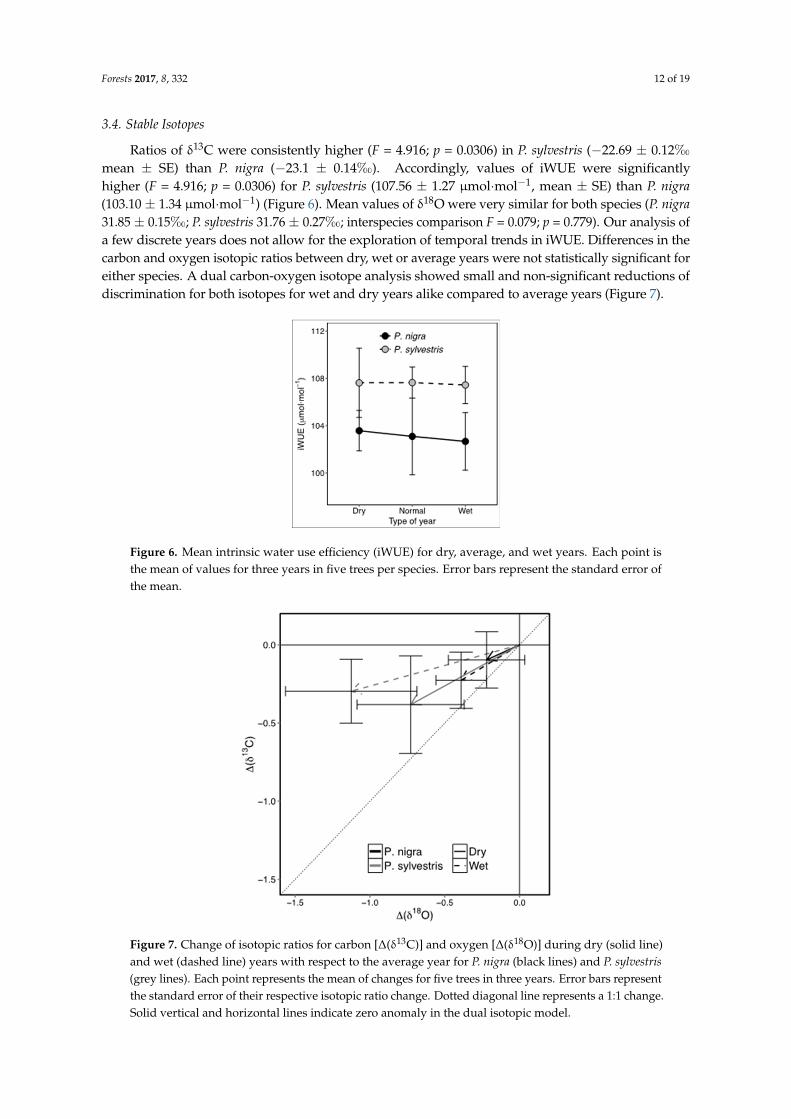
Ratios of δ13C were consistently higher (F = 4.916; p = 0.0306) in P. sylvestris (−22.69 ± 0.12‰ mean ± SE) than P. nigra (−23.1 ± 0.14‰). Accordingly, values of iWUE were significantly higher (F = 4.916; p = 0.0306) for P. sylvestris (107.56 ± 1.27 μmol·mol−1, mean ± SE) than P. nigra (103.10 ± 1.34 μmol·mol−1) (Figure 6). Mean values of δ18O were very similar for both species (P. nigra 31.85 ± 0.15‰; P. sylvestris 31.76 ± 0.27‰; interspecies comparison F = 0.079; p = 0.779). Our analysis of a few discrete years does not allow for the exploration of temporal trends in iWUE. Differences in the carbon and oxygen isotopic ratios between dry, wet or average years were not statistically significant for either species. A dual carbon-oxygen isotope analysis showed small and non-significant reductions of discrimination for both isotopes for wet and dry years alike compared to average years (Figure 7).
Figure 6. Mean intrinsic water use efficiency (iWUE) for dry, average, and wet years. Each point is the mean of values for three years in five trees per species. Error bars represent the standard error of the mean.
Figure 5. Mean tracheidogram of conduit hydraulic safety (expressed as the (t/b)2 relationship) for P.nigra and P. sylvestris for dry and wet years. Inset boxes show detail of normalized cells 1 through 10 ofeach tracheidogram where significant differences between wet and dry years were observed. Verticalbars represent standard error of the mean. Within each species, (x) indicate cells for which hydraulicsafety is significantly different (p < 0.05) between dry and wet years
Table 3. Wood and tracheid properties in Pinus nigra and P. sylvestris pine (means and standarddeviation) calculated for years with SPEI12 classified as being average, dry or wet for the period1960–2006. Different letters within a row indicate significant differences at the p = 0.05 (except thosewith * which are significant at the p = 0.10) in the linear mixed model approach. EW, earlywood;LW, latewood. Data for year 1991 was removed from the analysis.
Dry (n = 8) Average (n = 29) Wet (n = 10)
Pinus nigra
Width (10−2 mm)Ring 555.89 (263.33) a 727.56 (280.45) b 948.92 (409.93) cEW 453.82 (201.88) a 588.27 (219.40 b 749.64 (321.74) cLW 102.07 (80.43) a * 139.28 (91.54) b 199.28 (128.00) c
CWT (µm)Ring 3.86 (1.15) a 4.16 (1.12) ab 4.46 (1.02) aEW 3.30 (0.67) a 3.79 (0.66) b 3.97 (0.52) cLW 5.50 (1.81) a 6.05 (1.46) a 6.25 (1.58) a
LD (µm)Ring 35.93 (4.06) a 34.19 (3.50) b 33.40 (3.76) bEW 34.26 (4.43) a 34.84 (3.24) a 34.46 (2.73) aLW 7.20 (1.95) ab 7.14 (1.50) a 7.80 (1.60) b
Number of CellsRing 16.36 (6.79) a 20.91 (7.42) b 26.94 (10.73) cEW 11.09 (4.33) a 13.93 (4.82) b 17.64 (6.82) cLW 5.27 (3.19) a 6.98 (3.64) b 9.29 (5.17) c
Pinus sylvestris
Width (mm)Ring 733.38 (337.88) ab 759.36 (334.55) a 985.78 (441.26) bEW 605.38 (267.78) a 621.49 (265.14) a 807.56 (383.84) bLW 127.99 (126.21) ab 137.87 (122.07) a 178.22 (126.44) b*
CWT (µm)Ring 3.58 (1.07) a 3.88 (0.99) a 3.97 (1.05) aEW 3.03 (0.73) a 3.17 (0.71) ab 3.40 (0.77) b*LW 4.15 (1.40) a 4.54 (1.35) a 4.74 (1.16) a
LD (µm)Ring 32.91 (4.63) a * 31.72 (3.71) ab 30.77 (3.71) b*EW 30.28 (5.01) a 30.73 (3.68) a 30.60 (3.70) aLW 7.29 (1.94) a 7.14 (1.48) a 8.15 (1.64) b*
Number of CellsRing 23.75 (9.97) a 24.54 (10.19) a 31.07 (12.36) bEW 16.63 (6.56) a 16.74 (6.18) a 21.50 (9.01) bLW 7.12 (5.59) ab 7.81 (5.59) a 9.56 (5.67) b
Forests 2017, 8, 332 12 of 19
3.4. Stable Isotopes
Ratios of δ13C were consistently higher (F = 4.916; p = 0.0306) in P. sylvestris (−22.69 ± 0.12‰mean ± SE) than P. nigra (−23.1 ± 0.14‰). Accordingly, values of iWUE were significantlyhigher (F = 4.916; p = 0.0306) for P. sylvestris (107.56 ± 1.27 µmol·mol−1, mean ± SE) than P. nigra(103.10 ± 1.34 µmol·mol−1) (Figure 6). Mean values of δ18O were very similar for both species (P. nigra31.85 ± 0.15‰; P. sylvestris 31.76 ± 0.27‰; interspecies comparison F = 0.079; p = 0.779). Our analysis ofa few discrete years does not allow for the exploration of temporal trends in iWUE. Differences in thecarbon and oxygen isotopic ratios between dry, wet or average years were not statistically significant foreither species. A dual carbon-oxygen isotope analysis showed small and non-significant reductions ofdiscrimination for both isotopes for wet and dry years alike compared to average years (Figure 7).
Forests 2017, 8, 332 12 of 19
Figure 5. Mean tracheidogram of conduit hydraulic safety (expressed as the (t/b)2 relationship) for P. nigra and P. sylvestris for dry and wet years. Inset boxes show detail of normalized cells 1 through 10 of each tracheidogram where significant differences between wet and dry years were observed. Vertical bars represent standard error of the mean. Within each species, (x) indicate cells for which hydraulic safety is significantly different (p < 0.05) between dry and wet years
3.4. Stable Isotopes
Ratios of δ13C were consistently higher (F = 4.916; p = 0.0306) in P. sylvestris (−22.69 ± 0.12‰ mean ± SE) than P. nigra (−23.1 ± 0.14‰). Accordingly, values of iWUE were significantly higher (F = 4.916; p = 0.0306) for P. sylvestris (107.56 ± 1.27 μmol·mol−1, mean ± SE) than P. nigra (103.10 ± 1.34 μmol·mol−1) (Figure 6). Mean values of δ18O were very similar for both species (P. nigra 31.85 ± 0.15‰; P. sylvestris 31.76 ± 0.27‰; interspecies comparison F = 0.079; p = 0.779). Our analysis of a few discrete years does not allow for the exploration of temporal trends in iWUE. Differences in the carbon and oxygen isotopic ratios between dry, wet or average years were not statistically significant for either species. A dual carbon-oxygen isotope analysis showed small and non-significant reductions of discrimination for both isotopes for wet and dry years alike compared to average years (Figure 7).
Figure 6. Mean intrinsic water use efficiency (iWUE) for dry, average, and wet years. Each point is the mean of values for three years in five trees per species. Error bars represent the standard error of the mean.
Figure 6. Mean intrinsic water use efficiency (iWUE) for dry, average, and wet years. Each point isthe mean of values for three years in five trees per species. Error bars represent the standard error ofthe mean.Forests 2017, 8, 332 13 of 19
Figure 7. Change of isotopic ratios for carbon [Δ(δ13C)] and oxygen [Δ(δ18O)] during dry (solid line) and wet (dashed line) years with respect to the average year for P. nigra (black lines) and P. sylvestris (grey lines). Each point represents the mean of changes for five trees in three years. Error bars represent the standard error of their respective isotopic ratio change. Dotted diagonal line represents a 1:1 change. Solid vertical and horizontal lines indicate zero anomaly in the dual isotopic model.
4. Discussion
4.1. Effects of Drought on Interannual Radial Growth and Xylem Morphology
In long-lived plants, environmental plasticity in functional traits is vital to assure survival under stress while at the same time remain competitive under more favorable conditions. Our results showed that, in response to drought, both pine species analyzed slowed radial growth and reduced their number of cells and cell-wall thickness, but increased their lumen diameters. This result supports previous findings using simple correlation analysis between anatomical variables and climate [29]. These changes combined may result in increased xylem drought-induced vulnerability, as shown by their lower bending stress resistance (t/b)2. A similar response in P. sylvestris was observed in control vs irrigated [57,58] and precipitation exclusion experiment [59], but are opposite to responses observed in some studies of P. sylvestris [13] and other conifers [20,60]. In contrast, our results showed that narrow lumens were produced in LW on dry years particularly in P. sylvestris (Table 3), probably as a response to a decline in turgor [13]. The conductivity of tracheids depends partially on the characteristics, number and size of their pits [18,61] as well as their lumen diameter (Hagen-Poiseuille law [62]) and cell wall thickness [19]. The number and diameter of pits in P. sylvestris and P. nigra increase with lumen diameter [63,64]. A more efficient xylem would result from decreased resistivity due to wider lumens and wider and more abundant pits. Thus, our observations that pines respond to drought by producing fewer tracheids per ring with wider lumens and narrow walls (Tables 1 and 3) suggest that pines build a more efficient xylem while expending less carbon. This carbon-saving strategy or lower allocation to xylem may come at the expense of lower hydraulic strength [59] because larger pits are also more prone to air seeding.
4.2. Intraannual Responses to Drought
Our results show that anatomical responses to drought vary along a growth ring and thus during the growing season. In our study, the effects of drought conditions were minimal at the beginning and at the end of the growing period (Figure 4). The largest anatomical differences between years
Figure 7. Change of isotopic ratios for carbon [∆(δ13C)] and oxygen [∆(δ18O)] during dry (solid line)and wet (dashed line) years with respect to the average year for P. nigra (black lines) and P. sylvestris(grey lines). Each point represents the mean of changes for five trees in three years. Error bars representthe standard error of their respective isotopic ratio change. Dotted diagonal line represents a 1:1 change.Solid vertical and horizontal lines indicate zero anomaly in the dual isotopic model.
Forests 2017, 8, 332 13 of 19
4. Discussion
4.1. Effects of Drought on Interannual Radial Growth and Xylem Morphology
In long-lived plants, environmental plasticity in functional traits is vital to assure survival understress while at the same time remain competitive under more favorable conditions. Our results showedthat, in response to drought, both pine species analyzed slowed radial growth and reduced theirnumber of cells and cell-wall thickness, but increased their lumen diameters. This result supportsprevious findings using simple correlation analysis between anatomical variables and climate [29].These changes combined may result in increased xylem drought-induced vulnerability, as shown bytheir lower bending stress resistance (t/b)2. A similar response in P. sylvestris was observed in control vs.irrigated [57,58] and precipitation exclusion experiment [59], but are opposite to responses observed insome studies of P. sylvestris [13] and other conifers [20,60]. In contrast, our results showed that narrowlumens were produced in LW on dry years particularly in P. sylvestris (Table 3), probably as a responseto a decline in turgor [13]. The conductivity of tracheids depends partially on the characteristics,number and size of their pits [18,61] as well as their lumen diameter (Hagen-Poiseuille law [62]) andcell wall thickness [19]. The number and diameter of pits in P. sylvestris and P. nigra increase withlumen diameter [63,64]. A more efficient xylem would result from decreased resistivity due to widerlumens and wider and more abundant pits. Thus, our observations that pines respond to drought byproducing fewer tracheids per ring with wider lumens and narrow walls (Tables 1 and 3) suggest thatpines build a more efficient xylem while expending less carbon. This carbon-saving strategy or lowerallocation to xylem may come at the expense of lower hydraulic strength [59] because larger pits arealso more prone to air seeding.
4.2. Intraannual Responses to Drought
Our results show that anatomical responses to drought vary along a growth ring and thus duringthe growing season. In our study, the effects of drought conditions were minimal at the beginningand at the end of the growing period (Figure 4). The largest anatomical differences between yearscorresponded to the transition wood (i.e., the ring section between EW and LW), consistent withprevious observations [57,58]. Transition wood is most likely formed during late spring or earlysummer, one of the most critical times of the growing season under Mediterranean climate [65].As drought stress intensifies during the growing season, xylem development faces varying constrainsand may stop completely during the summer, which could lead to bimodal xylogenesis patterns.In some cases, this bimodal pattern may lead to the formation of intra-annual density fluctuations(IADF) if growth stops during the summer drought but resumes latter in the season [65,66]. Theseflexible xylogenesis patterns grant species higher plasticity by allowing them to concentrate growthduring favorable periods. Although several Mediterranean conifers present bimodal xylogenesis, sucha pattern has not been observed in P. sylvestris [67]. To date, no data exists on P. nigra xylogenesispatterns. Focusing our analysis on just EW, LW or on an average for the entire ring would haveobscured ecologically important differences. We suggest that studies exploring the ecological functionsof wood anatomy should consider at least the transition wood as a separate section, in addition to EWand LW, if higher resolution analyses are not performed.
4.3. Interspecific Responses to Drought
As expected, xylem of P. nigra was composed of tracheids with thicker cell walls than P. sylvestrisand wider lumen diameters in the earlywood (Figures 3 and 4). P. nigra also showed highercell-wall-to-lumen ratios, a driver of wood density, and potentially conferring higher cavitationresistance under low water potentials as suggested by their higher (t/b)2 (Figure 5). Drought, however,induced larger reductions of cell-wall thickness and radial growth in P. nigra than it did in P. sylvestris.The species with thicker cell-walls, P. nigra, might be able to reduce cell−walls more and stillmaintain higher (t/b)2 than the less drought-adapted species P. sylvestris [2,68]. Although conifers
Forests 2017, 8, 332 14 of 19
usually keep a large safety margin from drought-induced cavitation [21,61], lower (t/b)2 in P. nigrasuffering di-back than in healthy trees [25] suggests an important role of bending stress as a partialcontributor to hydraulic resistance in tree decline. Low wood density, which is related to (t/b)2 as lowcell-wall-to-lumen ratio [44], increases the risk of post-drought dieback in many conifers, includingP. sylvestris [69,70]. The higher conduit density per unit area in P. sylvestris likely contributes tomaintaining hydraulic functions in case of xylem cavitation [71]. The wider margin of P. nigra toreduce its cell walls during droughts could contribute to the adaptability of this species to variableenvironmental conditions [23] and could provide a competitive advantage at the study site. Widertracheid lumens may allow larger hydraulic conductance [61] to support higher stomatal conductanceand photosynthesis [72]. Because conifer sapwood may remain functional for multiple years [73], thesedifferences in xylem anatomy may affect tree performance long after the growing season when theyare formed.
Narrower cell walls during drought periods may result from changes in carbon allocation towardsparts of the plant other than secondary growth. Allocating more carbohydrates to mycorrhiza androot growth, storage or needles [9,11–13] offer the advantage of a faster recovery or the possibility towithstand longer periods of drought and may also be key strategies to ensure survival in long-livedplants [9,70]. Also, P. nigra has a higher frequency of rays and parenchyma than P. sylvestris [63,64]which are related to higher potential for storing non-structural carbohydrates and water contributingto a faster recovery after stressful conditions [74]. Our result of P. nigra reducing wall thickness morethan P. sylvestris could be due to a greater investment to reserves, defenses or growth of other parts ofthe plant that allows it to recover better after drought.
Changes of wood anatomical traits in response to drought could vary at different spatial scales ofstudy [26]. At population level, both P. sylvestris [63] and P. nigra [64] in the Iberian Peninsula developthick cell-walls and narrow lumens at drier locations. Here, our results suggest that, at interannualscale, the pattern is opposite, i.e., drought induces thinner cell walls but wider lumens, in accordancewith results from other species and sites [25,57,58]. The interannual response of hydraulic traits tomultiyear climate data, as done in this study, may show different relationships than considering singlevalues of traits, either from single years or averages for several years, across sites differing in meanclimatic conditions. The multi-year functionality of sapwood in conifers, the long−term adjustmentsof leaf/sapwood area ratio (Al/As) to climate, and the alterations of allocation patterns [73] couldin part explain these differences. Trees might regulate hydraulic conductance by adjusting for howlong sapwood rings remain functional and the architecture of their tracheids at the interannual scale.For example, in dryer climates, where leaf/sapwood area ratio is usually lower [73] and despite theirnarrower lumens [63,64], trees might attain similar whole-sapwood conductance. Other site-specificfactors, invariable at the interannual scale, such as stand density, basal area or soil characteristics couldalso affect how trees react to climate. Whether these opposing intrasite and intersite variations ofxylem traits in response to climate are part of a generalized drought response of conifers requiresa systematic review across species and environmental conditions.
4.4. Intrinsic Water-Use Efficiency
Both pine species were expected to show an efficient stomatal control to reduce water lossand prevent high levels of embolism [2,14]. Our dual-isotope analysis, however, suggests that bothspecies reacted by small and non-significant reductions of stomatal conductance (gs) and net carbonassimilation [51] (Figure 7). Higher iWUE in P. sylvestris reflected its tighter stomatal control thanP. nigra and thus a more isohydric strategy oriented to reduce water spending in accordance withprevious results from xeric sites [2,75]. Earlier stomata closing in P. sylvestris might contribute tomaintaining hydraulic pressure below dangerous levels at this site, but its conservative strategy mightreduce its ability to compete for light if P. nigra grows taller faster. The possibility exists that thelack of differences in iWUE between different years may be due to isotopic ratios being calculatedfrom EW and LW together, which could mask responses in iWUE at shorter scales, or that drought
Forests 2017, 8, 332 15 of 19
during the dry years considered was not enough to trigger a significant stomatal closure even inthe most sensitive species. Our results, however, are in line with the lack of interspecific differencesreported from tree-rings [2] and sapling needles [23] in these two species. Increased carbon depletionhas been suggested to occur in P. sylvestris due to its strong stomata closing during droughts [76–78].Simultaneous reductions of crown growth and lower leaf area index (LAI) [14] during droughts couldcontribute to maintaining constant levels of iWUE while overall supplying less carbon at the whole-treelevel. In fact, pines, including P. sylvestris reduced their leaf/sapwood area ratios at dryer and warmersites [79]. Even considering the potential lag between carbon fixation and use in the secondarycambium [8], our results suggest that narrow cell-walls and reduced growth at interannual scale arenot necessarily linked to increased iWUE [20], at least at the drought levels analyzed here. Cambialmeristematic activity, shorter enlarging time of tracheid and the number of wall layers produced [58,80]may have played a more important role. A reduction in crown growth or LAI during drought couldsignal a reduction in cambial growth via lower indole-3-acetic acid (IAA) production [10]. Given futureclimate change scenarios, we could anticipate a continued coexistence of both species at this site andregion under current levels of drought stress with a competition advantage for P. nigra given its fastergrowth and more flexible xylem development.
5. Conclusions
Our analysis of xylem traits showed that both pine species reacted to drought by building a xylemwith larger lumens and narrower cell walls which could be more hydraulically efficient while savingcarbon resources. The greatest differences in tracheid features between dry and wet years wereobserved in the transition zone from earlywood to latewood. Pinus nigra showed wider lumen andcell walls than P. sylvestris as well as higher xylem plasticity to the interannual drought variability(i.e., adjusted more its growth and xylem). The higher iWUE in P. sylvestris suggests that it reliesmore on stomatal control to regulate transpiration. In contrast, the little drought-induced changes iniWUE in both species suggest low levels of drought stress under current climate at the site. Increasingdrought conditions, however, could be more detrimental for P. sylvestris than for P. nigra.
This observed intra-specific response to interannual drought variability contrasts with the generalobservation that more drought-adapted species, as well as populations from arid sites, producetracheids with thicker walls and narrower lumens. Results from more species and environmentsare necessary to further explore whether these opposing trends at different taxonomical andbiogeographical scales are generally observed in conifers.
Estimates of forest annual productivity from tree-ring proxies contribute to improving andconstraining coupled terrestrial carbon cycle models [81]. Because our results imply a reduction of theamount of carbon per linear unit of radial growth (wood density) in addition to the reduced lineargrowth, if only tree-ring widths are used for calibration instead of proxies for total carbon storage(e.g., wood density), models may overestimate carbon fixed during drought periods.
Supplementary Materials: The following are available online at www.mdpi.com/1999-4907/8/9/332/s1.
Acknowledgments: We would like to thank Guilermo Gea-Izquierdo (INIA, Spain) for his comments on an earlierversion of this article. We acknowledge support to the Fulbright−MICIIN postdoctoral fellowship and Marie-CurieIEF grant (EU-grant 329935) awarded to DMB. DMB and KJA were further supported by NSF grant AGS-1338734.The Instituto Nacional de Investigaciones Agrarias y Alimentarias (INIA) provided funds to maintain thepermanent research plot network (Project OT03-002). We also thank the Spanish Meteorological Agency (AEMET)for providing meteorological data. Anonymous reviewers are thanked for critically reading the manuscript andproviding feedback that helped improve our manuscript. This is LDEO contribution #8144.
Author Contributions: D.M.-B. conceived and designed the experiments. D.M.-B., K.J.A. and M.N.E. performedthe experiments. All authors contributed reagents, materials, and analysis tools. D.M.-B. analyzed the data. Allauthors wrote the manuscript.
Conflicts of Interest: The authors declare no conflict of interest.
Forests 2017, 8, 332 16 of 19
References
1. Anderegg, W.R.L.; Kane, J.M.; Anderegg, L.D.L. Consequences of widespread tree mortality triggered bydrought and temperature stress. Nat. Clim. Chang. 2013, 3, 30–36. [CrossRef]
2. Martínez-Vilalta, J.; Piñol, J. Drought-induced mortality and hydraulic architecture in pine populations ofthe NE Iberian Peninsula. For. Ecol. Manag. 2002, 161, 247–256. [CrossRef]
3. McDowell, N.; Pockman, W.T.; Allen, C.D.; Breshears, D.D.; Cobb, N.; Kolb, T.; Plaut, J.; Sperry, J.; West, A.;Williams, D.G.; Yepez, E.A. Mechanisms of plant survival and mortality during drought: Why do someplants survive while others succumb to drought? New Phytol. 2008, 178, 719–739. [CrossRef] [PubMed]
4. Körner, C. Carbon limitation in trees. J. Ecol. 2003, 91, 4–17. [CrossRef]5. Abe, H.; Nakai, T.; Utsumi, Y.; Kagawa, A. Temporal water deficit and wood formation in Cryptomeria
japonica. Tree Physiol. 2003, 23, 859–863. [CrossRef] [PubMed]6. Körner, C. Paradigm shift in plant growth control. Curr. Opin. Plant Biol. 2015, 25, 107–114. [CrossRef]
[PubMed]7. Sala, A.; Piper, F.; Hoch, G. Physiological mechanisms of drought-induced tree mortality are far from being
resolved. New Phytol. 2010, 186, 274–281. [CrossRef] [PubMed]8. Muller, B.; Pantin, F.; Génard, M.; Turc, O.; Freixes, S.; Piques, M.; Gibon, Y. Water deficits uncouple growth
from photosynthesis, increase C content, and modify the relationships between C and growth in sink organs.J. Exp. Bot. 2011, 62, 1715–1729. [CrossRef] [PubMed]
9. Wiley, E.; Helliker, B. A re-evaluation of carbon storage in trees lends greater support for carbon limitation togrowth. New Phytol. 2012, 195, 285–289. [CrossRef] [PubMed]
10. Little, C.H. A.; Savidge, R.A. The role of plant growth regulators in forest tree cambial growth. Plant GrowthRegul. 1987, 6, 137–169. [CrossRef]
11. Dewar, R.C.; Ludlow, A.R.; Dougherty, P.M. Environmental Influences on Carbon Allocation in Pines.Ecol. Bull. 1994, 92–101.
12. Gruber, A.; Pirkebner, D.; Florian, C.; Oberhuber, W. No evidence for depletion of carbohydrate pools inScots pine (Pinus sylvestris L.) under drought stress. Plant Biol. 2012, 14, 142–148. [CrossRef] [PubMed]
13. Sterck, F.J.; Zweifel, R.; Sass-Klaassen, U.; Chowdhury, Q. Persisting soil drought reduces leaf specificconductivity in Scots pine (Pinus sylvestris) and pubescent oak (Quercus pubescens). Tree Physiol. 2008, 28,529–536. [CrossRef] [PubMed]
14. Irvine, J.; Perks, M.P.; Magnani, F.; Grace, J. The response of Pinus sylvestris to drought: Stomatal control oftranspiration and hydraulic conductance. Tree Physiol. 1998, 18, 393–402. [CrossRef] [PubMed]
15. Jones, H. Stomatal control of photosynthesis and transpiration. J. Exp. Bot. 1998, 49, 387–398. [CrossRef]16. Martínez-Vilalta, J.; Poyatos, R.; Aguadé, D.; Retana, J.; Mencuccini, M. A new look at water transport
regulation in plants. New Phytol. 2014, 204, 105–115. [CrossRef] [PubMed]17. Pittermann, J.; Sperry, J.S.; Hacke, U.G.; Wheeler, J.K.; Sikkema, E.H. Inter-tracheid pitting and the hydraulic
efficiency of conifer wood: The role of tracheid allometry and cavitation protection. Am. J. Bot. 2006, 93,1265–1273. [CrossRef] [PubMed]
18. Choat, B.; Cobb, A.R.; Jansen, S. Structure and function of bordered pits: New discoveries and impacts onwhole-plant hydraulic function. New Phytol. 2008, 177, 608–626. [CrossRef] [PubMed]
19. Pittermann, J.; Sperry, J.S.; Wheeler, J.K.; Hacke, U.G.; Sikkema, E.H. Mechanical reinforcement of tracheidscompromises the hydraulic efficiency of conifer xylem. Plant Cell Environ. 2006, 29, 1618–1628. [CrossRef][PubMed]
20. Olano, J.M.; Linares, J.C.; Garcia-Cervigon, A.I.; Arzac, A.; Delgado, A.; Rozas, V. Drought-induced increasein water-use efficiency reduces secondary tree growth and tracheid wall thickness in a Mediterranean conifer.Oecologia 2014, 176, 273–283. [CrossRef] [PubMed]
21. Choat, B.; Jansen, S.; Brodribb, T.J.; Cochard, H.; Delzon, S.; Bhaskar, R.; Bucci, S.J.; Feild, T.S.; Gleason, S.M.;Hacke, U.G.; et al. Global convergence in the vulnerability of forests to drought. Nature 2012, 491, 752–755.[CrossRef] [PubMed]
22. Brodribb, T.; Hill, R.S. The importance of xylem constraints in the distribution of conifer species. New Phytol.1999, 143, 365–372. [CrossRef]
Forests 2017, 8, 332 17 of 19
23. Herrero, A.; Castro, J.; Zamora, R.; Delgado-Huertas, A.; Querejeta, J.I. Growth and stable isotope signalsassociated with drought-related mortality in saplings of two coexisting pine species. Oecologia 2013, 173,1613–1624. [CrossRef] [PubMed]
24. Quero, J.L.; Sterck, F.J.; Martínez-Vilalta, J.; Villar, R. Water-use strategies of six co-existing Mediterraneanwoody species during a summer drought. Oecologia 2011, 166, 45–57. [CrossRef] [PubMed]
25. Petrucco, L.; Nardini, A.; von Arx, G.; Saurer, M.; Cherubini, P. Isotope signals and anatomical features in treerings suggest a role for hydraulic strategies in diffuse drought-induced die-back of Pinus nigra. Tree Physiol.2017, 37, 523–535. [PubMed]
26. Martinez-Vilalta, J.; Sala, A.; Pinol, J. The hydraulic architecture of Pinaceae—A review. Plant Ecol. 2004, 171,3–13. [CrossRef]
27. Barbéro, M.; Losiel, R.; Queézel, P.; Richardson, D.M.; Romane, F. Pines of the Mediterranean Basin. In Ecologyand Biogeography of Pinus; Richardson, D.M., Ed.; Cambridge University Press: Cambridge, UK, 1998.
28. Nikolov, N.; Helmisaari, H. Silvics of the circumpolar boreal forest tree species. In A Systems Analysis of theGlobal Boreal Forest; Shugart, H.H., Leemans, R., Bonan, G.B., Eds.; Cambridge University Press: Cambridge,UK, 1992; pp. 13–84.
29. Martin-Benito, D.; Beeckman, H.; Cañellas, I. Influence of drought on tree rings and tracheid features ofPinus nigra and Pinus sylvestris in a mesic Mediterranean forest. Eur. J. For. Res. 2013, 132, 33–45. [CrossRef]
30. Froux, F.; Huc, R.; Ducrey, M.; Dreyer, E. Xylem hydraulic efficiency versus vulnerability in seedlings offour contrasting Mediterranean tree species (Cedrus atlantica, Cupressus sempervirens, Pinus halepensis andPinus nigra). Ann. For. Sci. 2002, 59, 409–418. [CrossRef]
31. Meehl, G.A.; Tebaldi, C. More Intense, more frequent, and longer lasting heat waves in the 21st century.Science 2004, 305, 994–997. [CrossRef] [PubMed]
32. Farquhar, G.D.; Ehleringer, J.R.; Hubick, K.T. Carbon Isotope Discrimination and Photosynthesis. Annu. Rev.Plant. Physiol. Plant Mol. Biol. 1989, 40, 503–537. [CrossRef]
33. McCarroll, D.; Loader, N.J. Stable isotopes in tree rings. Quat. Sci. Rev. 2004, 23, 771–801. [CrossRef]34. Beeckman, H. Wood anatomy and trait-based ecology. IAWA J. 2016, 37, 127–151. [CrossRef]35. Vicente-Serrano, S.M.; Beguería, S.; López-Moreno, J.I. A multiscalar drought index sensitive to global
warming: The standardized precipitation evapotranspiration index. J. Clim. 2010, 23, 1696–1718. [CrossRef]36. Rinn, F. TSAP−Win Professional, Time Series Analysis and Presentation for Dendrochronology and Related
Applications; Version 0.3; Quick Reference; Frank Rinn: Heidelberg, Germany, 2003; p. 20.37. Holmes, R.L. Computer−assisted quality control in tree-ring dating and measurement. Tree-Ring Bull. 1983,
43, 69–78.38. Sangüesa-Barreda, G.; Camarero, J.J.; García-Martín, A.; Hernández, R.; de la Riva, J. Remote-sensing
and tree-ring based characterization of forest defoliation and growth loss due to the Mediterranean pineprocessionary moth. For. Ecol. Manag. 2014, 320, 171–181. [CrossRef]
39. Schmitz, N.; Verheyden, A.; Kairo, J.G.; Beeckman, H.; Koedam, N. Successive cambia development inAvicennia marina (Forssk.) Vierh. is not climatically driven in the seasonal climate at Gazi Bay, Kenya.Dendrochronologia 2007, 25, 87–96. [CrossRef]
40. Donaldson, L.A. Abnormal lignin distribution in wood from severely drought stressed Pinus radiata trees.IAWA J. 2002, 23, 161–178. [CrossRef]
41. Rasband, W.S. ImageJ (1.38x); U.S. National Institutes of Health: Bethesda, MD, USA, 1997.42. Vysotskaya, L.G.; Vaganov, E.A. Components of the variability of radial cell size in tree rings of conifers.
Iawa Bull. 1989, 10, 417–426. [CrossRef]43. Filion, L.; Cournoyer, L. Variation in wood structure of eastern larch defoliated by the larch sawfly in
subarctic Quebec, Can. Can. J. For. Res. 1995, 25, 1263–1268. [CrossRef]44. Hacke, U.G.; Sperry, J.S.; Pockman, W.T.; Davis, S.D.; McCulloch, K.A. Trends in wood density and structure
are linked to prevention of xylem implosion by negative pressure. Oecologia 2001, 126, 457–461. [CrossRef][PubMed]
45. Vaganov, E.A. The tracheidogram method in tree-ring analysis and its application. In Methods ofDendrochronology; Cook, E.R., Kairiukstis, L., Eds.; Kluwer: Dordrecht, The Netherlands, 1989; pp. 63–76.
46. Loader, N.J.; Robertson, I.; Barker, A.C.; Switsur, V.R.; Waterhouse, J.S. An improved technique for the batchprocessing of small wholewood samples to α-cellulose. Chem. Geol. 1997, 136, 313–317. [CrossRef]
Forests 2017, 8, 332 18 of 19
47. Wieloch, T.; Helle, G.; Heinrich, I.; Voigt, M.; Schyma, P. A novel device for batch-wise isolation of α-cellulosefrom small−amount wholewood samples. Dendrochronologia 2011, 29, 115–117. [CrossRef]
48. Evans, M.N.; Selmer, K.J.; Breeden, B.T.; Lopatka, A.S.; Plummer, R.E. Correction algorithm for on-linecontinuous flow stable isotope analyses. G3 2016, 17, 3580–3588.
49. Keeling, C.D. The Suess effect: 13Carbon−14Carbon interrelations. Environ. Int. 1979, 2, 229–300. [CrossRef]50. McCarroll, D.; Gagen, M.H.; Loader, N.J.; Robertson, I.; Anchukaitis, K.J.; Los, S.; Young, G.H.F.; Jalkanen, R.;
Kirchhefer, A.; Waterhouse, J.S. Correction of tree ring stable carbon isotope chronologies for changes in thecarbon dioxide content of the atmosphere. Geochim. Cosmochim. Acta 2009, 73, 1539–1547. [CrossRef]
51. Scheidegger, Y.; Saurer, M.; Bahn, M.; Siegwolf, R. Linking stable oxygen and carbon isotopes with stomatalconductance and photosynthetic capacity: A conceptual model. Oecologia 2000, 125, 350–357. [CrossRef][PubMed]
52. Roden, J.; Siegwolf, R. Is the dual-isotope conceptual model fully operational? Tree Physiol. 2012, 32,1179–1182. [CrossRef] [PubMed]
53. R Development Core Team. R: A Language and Environment for Statistical Computing. R Foundationfor Statistical Computing: Vienna, Austria. Available online: http://www.r-project.org/ (accessed on18 January 2016).
54. Pinheiro, J.; Bates, D.; DebRoy, S.; Sarkar, D. nlme: Linear and Nonlinear Mixed Effects Models. R PackageVersion 3.1-128. Available online: http://CRAN.R-project.org/package=nlme (accessed on 1 December 2016).
55. Zuur, A.F.; Ieno, E.N.; Walker, N.J.; Saveliev, A.A.; Smith, G.M. Mixed Effects Models and Extensions in Ecologywith R; Springer: New York, NY, USA, 2009.
56. Burnham, K.P.; Anderson, D.R. Information theory and log-likelihood models: A basis for model selectionand Inference. In Model Selection and Multimodel Inference: A Practical Information−Theoretic Approach; Springer:New York, NY, USA, 2002; pp. 33–74.
57. Eilmann, B.; Zweifel, R.; Buchmann, N.; Fonti, P.; Rigling, A. Drought-induced adaptation of the xylem inScots pine and pubescent oak. Tree Physiol. 2009, 29, 1011–1020. [CrossRef] [PubMed]
58. Eilmann, B.; Zweifel, R.; Buchmann, N.; Graf Pannatier, E.; Rigling, A. Drought alters timing, quantity, andquality of wood formation in Scots pine. J. Exp. Bot. 2011, 62, 2763–2771. [CrossRef] [PubMed]
59. Fernández-de-Uña, L.; Rossi, S.; Aranda, I.; Fonti, P.; González-González, B.D.; Cañellas, I.; Gea-Izquierdo, G.Xylem and Leaf Functional Adjustments to Drought in Pinus sylvestris and Quercus pyrenaica at TheirElevational Boundary. Front. Plant. Sci. 2017, 8, 1200. [CrossRef] [PubMed]
60. Rossi, S.; Simard, S.; Rathgeber, C.; Deslauriers, A.; De Zan, C. Effects of a 20-day-long dry period on cambialand apical meristem growth in Abies balsamea seedlings. Trees 2009, 23, 85–93. [CrossRef]
61. Sperry, J.S.; Hacke, U.G.; Pittermann, J. Size and function in conifer tracheids and angiosperm vessels.Am. J. Bot. 2006, 93, 1490–1500. [CrossRef] [PubMed]
62. Tyree, M.T.; Zimmermann, M.H. Xylem Structure and the Ascent of Sap; Springer: New York, NY, USA, 2002.63. Esteban, L.; Martín, J.; de Palacios, P.; Fernández, F. Influence of region of provenance and climate factors on
wood anatomical traits of Pinus nigra Arn. subsp. salzmannii. Eur. J. For. Res. 2012, 131, 633–645. [CrossRef]64. Martín, J.; Esteban, L.; de Palacios, P.; Fernández, F. Variation in wood anatomical traits of Pinus sylvestris L.
between Spanish regions of provenance. Trees 2010, 24, 1017–1028. [CrossRef]65. Wilkinson, S.; Ogée, J.; Domec, J.-C.; Rayment, M.; Wingate, L. Biophysical modelling of intra-ring variations
in tracheid features and wood density of Pinus pinaster trees exposed to seasonal droughts. Tree Physiol. 2017,35, 305–318. [CrossRef] [PubMed]
66. De Micco, V.; Saurer, M.; Aronne, G.; Tognetti, R.; Cherubini, P. Variations of wood anatomy and δ13Cwithin-tree rings of coastal Pinus pinaster showing intra-annual density fluctuations. IAWA J. 2007, 28, 61–74.[CrossRef]
67. Camarero, J.J.; Olano, J.M.; Parras, A. Plastic bimodal xylogenesis in conifers from continental Mediterraneanclimates. New Phytol. 2010, 185, 471–480. [CrossRef] [PubMed]
68. Lebourgeois, F.; Levy, G.; Aussenac, G.; Clerc, B.; Willm, F. Influence of soil drying on leaf water potential,photoshyntesis, stomatal conductance and growth in two black pine varieties. Ann. For. Sci. 1998, 55,287–299. [CrossRef]
69. Voltas, J.; Camarero, J.J.; Carulla, D.; Aguilera, M.; Ortiz, A.; Ferrio, J.P. A retrospective, dual-isotope approachreveals individual predispositions to winter-drought induced tree dieback in the southernmost distributionlimit of Scots pine. Plant Cell Environ. 2013, 36, 1435–1448. [CrossRef] [PubMed]
Forests 2017, 8, 332 19 of 19
70. Hentschel, R.; Rosner, S.; Kayler, Z.E.; Andreassen, K.; Børja, I.; Solberg, S.; Tveito, O.E.; Priesack, E.;Gessler, A. Norway spruce physiological and anatomical predisposition to dieback. For. Ecol. Manag. 2014,322, 27–36. [CrossRef]
71. Robert, E.M. R.; Koedam, N.; Beeckman, H.; Schmitz, N. A safe hydraulic architecture as wood anatomicalexplanation for the difference in distribution of the mangroves Avicennia and Rhizophora. Funct. Ecol. 2009,23, 649–657. [CrossRef]
72. Zhang, J.-L.; Cao, K.-F. Stem hydraulics mediates leaf water status, carbon gain, nutrient use efficiencies andplant growth rates across dipterocarp species. Funct. Ecol. 2009, 23, 658–667. [CrossRef]
73. Delucia, E.H.; Maherali, H.; Carey, E.V. Climate-driven changes in biomass allocation in pines. Glob. Chang.Biol. 2000, 6, 587–593. [CrossRef]
74. McDowell, N.G. Mechanisms linking drought, hydraulics, carbon metabolism, and vegetation mortality.Plant Physiol. 2011, 155, 1051–1059. [CrossRef] [PubMed]
75. Lévesque, M.; Siegwolf, R.; Saurer, M.; Eilmann, B.; Rigling, A. Increased water-use efficiency does notlead to enhanced tree growth under xeric and mesic conditions. New Phytol. 2014, 203, 94–109. [CrossRef][PubMed]
76. Aguadé, D.; Poyatos, R.; Rosas, T.; Martínez-Vilalta, J. Comparative drought responses of Quercus ilex L. andPinus sylvestris L. in a montane forest undergoing a vegetation shift. Forests 2015, 6, 2505–2529. [CrossRef]
77. Galiano, L.; Martínez-Vilalta, J.; Lloret, F. Drought-induced multifactor decline of Scots pine in the Pyreneesand potential vegetation change by the expansion of co-occurring oak species. Ecosystems 2010, 13, 978–991.[CrossRef]
78. Poyatos, R.; Aguade, D.; Galiano, L.; Mencuccini, M.; Martinez-Vilalta, J. Drought-induced defoliation andlong periods of near-zero gas exchange play a key role in accentuating metabolic decline of Scots pine.New Phytol. 2013, 200, 388–401. [CrossRef] [PubMed]
79. Mencuccini, M.; Bonosi, L. Leaf/sapwood area ratios in Scots pine show acclimation across Europe. Can. J.For. Res. 2001, 31, 442–456. [CrossRef]
80. Gruber, A.; Strobl, S.; Veit, B.; Oberhuber, W. Impact of drought on the temporal dynamics of wood formationin Pinus sylvestris. Tree. Physiol. 2010, 30, 490–501. [CrossRef] [PubMed]
81. Belmecheri, S.; Maxwell, R.S.; Taylor, A.H.; Davis, K.J.; Freeman, K.H.; Munger, W.J. Tree-ring δ13C tracksflux tower ecosystem productivity estimates in a NE temperate forest. Environ. Res. Lett. 2014, 9, 074011.[CrossRef]
© 2017 by the authors. Licensee MDPI, Basel, Switzerland. This article is an open accessarticle distributed under the terms and conditions of the Creative Commons Attribution(CC BY) license (http://creativecommons.org/licenses/by/4.0/).